Factors Affecting Farmland Markets - 2017 and Beyond · Factors Affecting Farmland Markets - 2017...
42
Bruce J. Sherrick, Ph.D. TIAA Center for Farmland Research, University of Illinois Advancing Farmland Markets through Research and Information Factors Affecting Farmland Markets - 2017 and Beyond Land Values and Lease Trends ISPFMRA Bloomington, IL - March 2017
Transcript of Factors Affecting Farmland Markets - 2017 and Beyond · Factors Affecting Farmland Markets - 2017...
Bruce J. Sherrick, Ph.D.
TIAA Center for Farmland Research,
University of Illinois
Advancing Farmland Markets through Research and Information
Factors Affecting Farmland
Markets - 2017 and Beyond
Land Values and Lease Trends
ISPFMRA
Bloomington, IL - March 2017
TIAA Center for Farmland Research Advancing Farmland Markets through Research and Information
Goals: improve accuracy and understanding of asset class, and to provide unbiased research and useful tools for those involved with farmland investments.
Tools and articles at:
http://farmdocdaily.illinois.edu/
http://farmland.illinois.edu/
C
o
n
t
e
x
t

Balance Sheet of Ag Sector -- US Table 1. Selected Balance Sheet Characteristics of US Agricultural Sector
1970 1980 1990 2000 2010 2012 2014 2016
($ millions, except ratios - source ERS-USDA)
Farm Assets 278,823 1,000,422 840,609 1,203,215 2,170,832 2,638,243 2,949,243 2,848,679
Real Estate 202,418 782,820 619,149 946,428 1,660,114 2,073,664 2,383,150 2,383,688
Non Real Estate 76,405 217,602 221,459 256,787 510,718 564,579 566,092 464,990
Farm Debt 48,501 162,432 131,116 163,930 278,931 297,521 345,201 375,395
Real Estate 27,238 85,272 67,633 84,724 154,065 173,369 196,780 226,733
Non Real Estate 21,263 77,160 63,483 79,206 124,865 124,152 148,421 148,662
Equity 230,322 837,990 709,493 1,039,285 1,891,902 2,340,722 2,604,041 2,473,283
Selected Indicators
Debt/Equity 21.1% 19.4% 18.5% 15.8% 14.7% 12.7% 13.3% 15.2%
Debt/Assets 17.4% 16.2% 15.6% 13.6% 12.8% 11.3% 11.7% 13.2%
Real Estate/Equity 87.9% 93.4% 87.3% 91.1% 87.7% 88.6% 91.5% 96.4%
Real Estate/Assets 72.6% 78.2% 73.7% 78.7% 76.5% 78.6% 80.8% 83.7%
Real Estate D/Total D 56.2% 52.5% 51.6% 51.7% 55.2% 58.3% 57.0% 60.4%

Ag Sector Balance Sheet -- US
Farmland represents about 84% of farm assets
Farm real estate debt only 60% of total farm debt
Low aggregate leverage (approx. 13% D/A)
Growth rates 1970-2016, continuous compounding:
Assets --5%
Real Estate -- 5.3%
Debt – 5%
Equity – 5%
Absence of active equity market with “hedgeable” indices – key in future.
Ag Balance sheet compared to corporate sector vastly different, especially in financial structure.
Early stage “financialization” critical to improving efficiency of farmland market.
C
o
n
t
e
x
t

Remembering your Future’s Past..
Macro Market influences – where to from here?
Interest rates and strength of dollar, relative returns still attractive
Trade policy, world productivity changes, emerging market diets
Agricultural Policy
Direct impacts (i.e., Farm Bill related, including crop insurance, conservation)
Indirect (Energy, RFS, nutrition, climate, and related)
Efficiency vs consumer view of sustainability,
GMO and related debates reshaped into attribute demands
Water (policy and virtual trade) and locational usage by sector
Land Use, edge of field, ‘downstream’ liability, BMP and NMP
Technological advances (more later)
Emerging Financial Structures underlying modern production systems
C
o
n
t
e
x
t
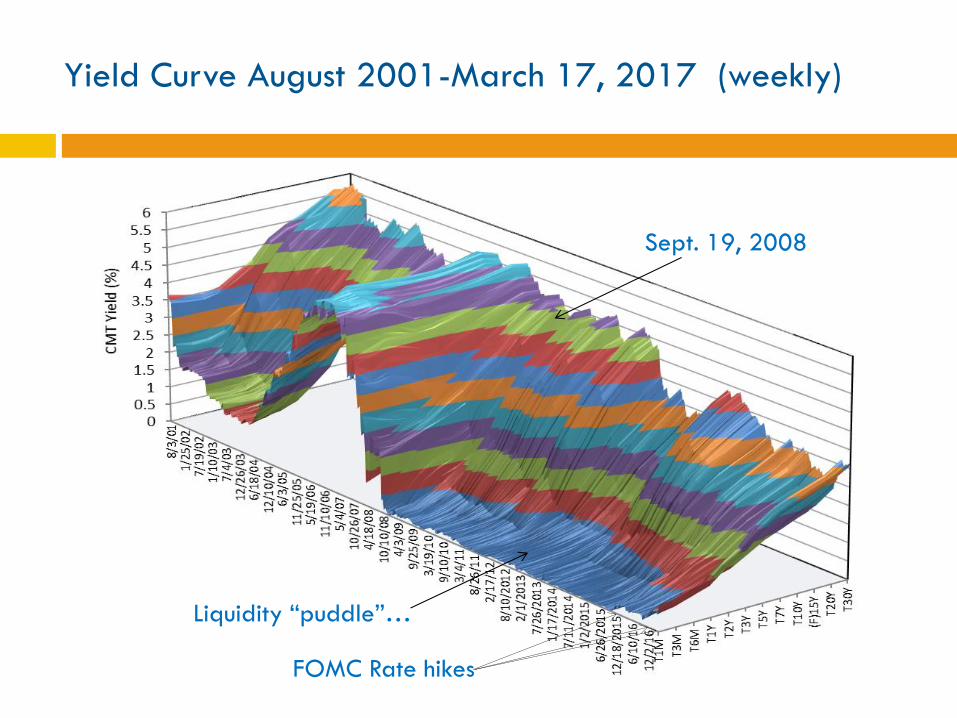
Liquidity “puddle”…
Yield Curve August 2001-March 17, 2017 (weekly)
FOMC Rate hikes
Sept. 19, 2008

What rates did ‘they’ raise?
0.5
1
1.5
2
2.5
3
1 mo 3 mo 6 mo 1 yr 2 yr 3 yr 5 yr 7 yr 10 yr 20 yr 30 yr
Yiel
d (
%)
Term to Maturity
3/14/2017
3/15/2017
3/16/2017
3/17/2017
3/20/2017
3/21/2017
3/22/2017

“Does the farmland market make sense?”
Historic comparison of implied cap rate and
CMT-10 – One period in 1980’s where
conditions that might be considered “bubble”
formation existed.
Implied asset value from capitalization of
income to q2:16. Recent asset values show
that the market did not consider income
levels in recent years to be “permanent”

Farmland Returns in context – 1970-2016
Standard Coefficient
Asset/Index Return Deviation of Variation Correlation
-------------- 1970 - 2016--------------
US Ave Farm (all) 10.27% 6.48% 0.631 1
S&P500 6.79% 16.57% 2.440 -0.252
NASDAQ 9.63% 25.14% 2.611 -0.133
EAFE 6.04% 20.49% 3.394 -0.219
TCM10Y 6.57% 2.93% 0.447 0.140
AAA 7.70% 2.54% 0.330 0.070
Mort30F 8.25% 3.10% 0.376 0.095
All REITS 9.09% 20.11% 2.213 -0.136
Gold 7.41% 22.79% 3.075 0.306
CPI 3.95% 2.85% 0.721 0.659
Annual Ave.
Table 1. Asset Return Characteristics

Farmland Returns in context – 1980-2016
Standard Coefficient
Asset/Index Return Deviation of Variation Correlation
-------------- 1980 - 2016--------------
US Ave Farm (all) 8.23% 5.29% 0.642 1
S&P500 8.19% 15.87% 1.936 -0.130
NASDAQ 9.63% 25.14% 2.611 -0.133
EAFE 6.11% 20.61% 3.375 -0.233
TCM10Y 6.32% 3.23% 0.510 0.023
AAA 7.56% 2.82% 0.374 -0.028
Mort30F 8.10% 3.40% 0.420 0.009
All REITS 10.29% 17.08% 1.659 -0.033
Gold 2.18% 16.09% 7.391 -0.086
CPI 3.10% 2.10% 0.679 0.410
Annual Ave.
Table 2. Asset Return Characteristics
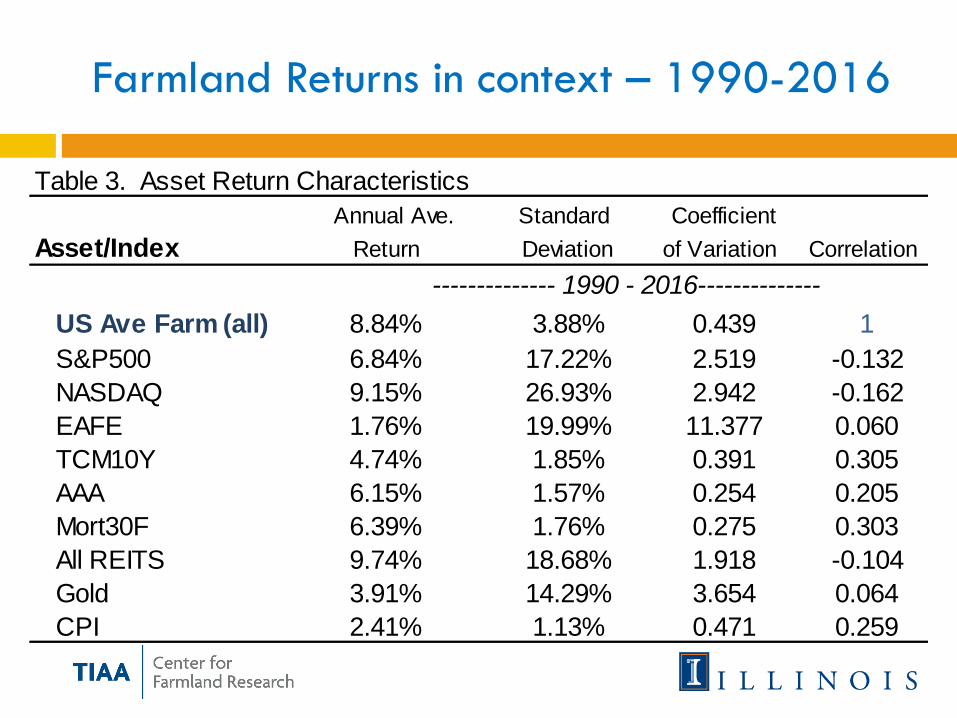
Farmland Returns in context – 1990-2016
Standard Coefficient
Asset/Index Return Deviation of Variation Correlation
-------------- 1990 - 2016--------------
US Ave Farm (all) 8.84% 3.88% 0.439 1
S&P500 6.84% 17.22% 2.519 -0.132
NASDAQ 9.15% 26.93% 2.942 -0.162
EAFE 1.76% 19.99% 11.377 0.060
TCM10Y 4.74% 1.85% 0.391 0.305
AAA 6.15% 1.57% 0.254 0.205
Mort30F 6.39% 1.76% 0.275 0.303
All REITS 9.74% 18.68% 1.918 -0.104
Gold 3.91% 14.29% 3.654 0.064
CPI 2.41% 1.13% 0.471 0.259
Annual Ave.
Table 3. Asset Return Characteristics
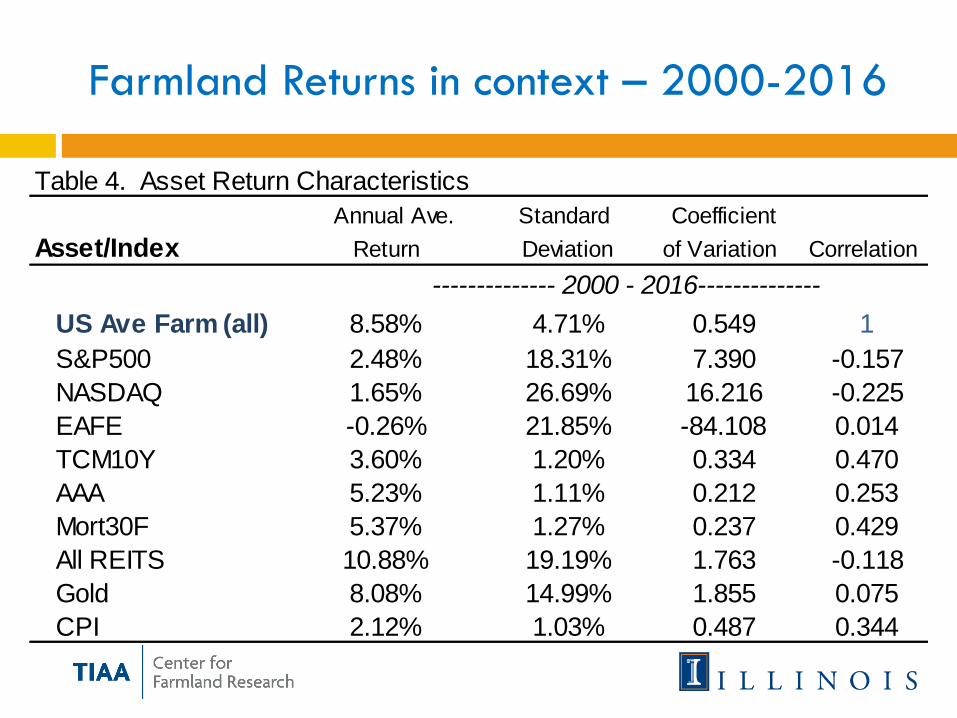
Farmland Returns in context – 2000-2016
Standard Coefficient
Asset/Index Return Deviation of Variation Correlation
-------------- 2000 - 2016--------------
US Ave Farm (all) 8.58% 4.71% 0.549 1
S&P500 2.48% 18.31% 7.390 -0.157
NASDAQ 1.65% 26.69% 16.216 -0.225
EAFE -0.26% 21.85% -84.108 0.014
TCM10Y 3.60% 1.20% 0.334 0.470
AAA 5.23% 1.11% 0.212 0.253
Mort30F 5.37% 1.27% 0.237 0.429
All REITS 10.88% 19.19% 1.763 -0.118
Gold 8.08% 14.99% 1.855 0.075
CPI 2.12% 1.03% 0.487 0.344
Annual Ave.
Table 4. Asset Return Characteristics

Sell (end of year)
1972 1973 1974 1975 1976 1977 1978 1979 1980 1981 1982 1983 1984 1985 1986 1987 1988 1989 1990 1991 1992 1993 1994 1995 1996 1997 1998 1999 2000 2001 2002 2003 2004 2005 2006 2007 2008 2009 2010 2011 2012 2013 2014 2015 2016
1972 10.9% 12.3% 17.8% 18.9% 20.8% 23.3% 22.2% 21.6% 20.7% 19.7% 17.5% 15.5% 14.7% 11.6% 10.4% 9.7% 10.0% 10.3% 10.1% 10.0% 10.1% 9.9% 10.0% 10.1% 10.1% 10.0% 10.1% 10.0% 9.9% 9.7% 9.6% 9.6% 9.6% 10.0% 10.1% 10.2% 10.4% 10.1% 10.1% 10.2% 10.4% 10.5% 10.5% 10.3% 10.1%
1973 13.7% 21.4% 21.7% 23.4% 25.9% 24.1% 23.2% 22.0% 20.8% 18.2% 15.9% 15.1% 11.7% 10.4% 9.6% 9.9% 10.2% 10.0% 10.0% 10.0% 9.9% 10.0% 10.1% 10.1% 10.0% 10.1% 10.0% 9.8% 9.7% 9.6% 9.5% 9.5% 10.0% 10.1% 10.2% 10.4% 10.1% 10.1% 10.2% 10.4% 10.5% 10.5% 10.3% 10.1%
1974 29.7% 25.9% 26.8% 29.2% 26.4% 24.9% 23.2% 21.7% 18.7% 16.2% 15.2% 11.5% 10.2% 9.3% 9.7% 10.0% 9.8% 9.8% 9.8% 9.7% 9.8% 10.0% 9.9% 9.8% 9.9% 9.8% 9.7% 9.5% 9.4% 9.4% 9.4% 9.9% 10.0% 10.1% 10.3% 10.0% 10.0% 10.1% 10.3% 10.4% 10.4% 10.2% 10.0%
1975 22.1% 25.3% 29.0% 25.5% 24.0% 22.2% 20.6% 17.4% 14.7% 13.8% 10.0% 8.7% 7.9% 8.4% 8.8% 8.7% 8.7% 8.8% 8.7% 8.9% 9.1% 9.1% 9.1% 9.2% 9.1% 9.0% 8.9% 8.8% 8.7% 8.8% 9.3% 9.4% 9.6% 9.7% 9.5% 9.5% 9.6% 9.8% 10.0% 10.0% 9.8% 9.6%
1976 28.6% 32.6% 26.7% 24.4% 22.2% 20.3% 16.7% 13.8% 12.9% 8.8% 7.5% 6.8% 7.4% 7.9% 7.8% 7.9% 8.1% 8.0% 8.2% 8.5% 8.5% 8.5% 8.6% 8.6% 8.5% 8.4% 8.3% 8.3% 8.3% 8.9% 9.0% 9.2% 9.4% 9.1% 9.1% 9.3% 9.5% 9.7% 9.7% 9.5% 9.3%
1977 36.8% 25.7% 23.0% 20.7% 18.7% 14.8% 11.9% 11.1% 6.8% 5.6% 5.0% 5.8% 6.5% 6.5% 6.7% 6.9% 6.9% 7.2% 7.5% 7.6% 7.6% 7.8% 7.8% 7.7% 7.6% 7.6% 7.6% 7.7% 8.3% 8.4% 8.6% 8.8% 8.6% 8.6% 8.8% 9.0% 9.2% 9.2% 9.0% 8.8%
1978 15.6% 16.7% 15.7% 14.6% 10.9% 8.2% 7.9% 3.6% 2.6% 2.2% 3.4% 4.3% 4.5% 4.8% 5.2% 5.3% 5.7% 6.1% 6.2% 6.3% 6.6% 6.6% 6.6% 6.6% 6.6% 6.6% 6.7% 7.4% 7.6% 7.8% 8.0% 7.8% 7.8% 8.1% 8.3% 8.5% 8.5% 8.4% 8.2%
1979 17.8% 15.8% 14.3% 9.7% 6.8% 6.6% 2.0% 1.1% 0.9% 2.2% 3.3% 3.6% 4.0% 4.5% 4.6% 5.1% 5.5% 5.7% 5.9% 6.1% 6.2% 6.2% 6.2% 6.2% 6.3% 6.4% 7.1% 7.3% 7.5% 7.8% 7.6% 7.6% 7.9% 8.1% 8.3% 8.3% 8.2% 8.0%
1980 13.8% 12.5% 7.2% 4.2% 4.5% -0.5% -1.1% -1.1% 0.6% 2.0% 2.4% 3.0% 3.5% 3.7% 4.3% 4.8% 5.1% 5.2% 5.6% 5.7% 5.7% 5.7% 5.7% 5.8% 6.0% 6.7% 6.9% 7.2% 7.5% 7.2% 7.3% 7.6% 7.8% 8.1% 8.1% 7.9% 7.7%
1981 11.3% 4.0% 1.2% 2.4% -3.1% -3.3% -3.0% -0.9% 0.7% 1.3% 2.0% 2.7% 3.0% 3.7% 4.3% 4.5% 4.8% 5.1% 5.3% 5.3% 5.3% 5.4% 5.5% 5.6% 6.4% 6.7% 7.0% 7.2% 7.0% 7.1% 7.4% 7.7% 7.9% 7.9% 7.8% 7.6%
1982 -2.8% -3.5% -0.5% -6.4% -6.0% -5.2% -2.6% -0.5% 0.3% 1.1% 2.0% 2.3% 3.1% 3.8% 4.1% 4.4% 4.8% 5.0% 5.0% 5.0% 5.1% 5.2% 5.4% 6.2% 6.5% 6.8% 7.1% 6.9% 6.9% 7.2% 7.5% 7.8% 7.8% 7.7% 7.5%
1983 -4.3% 0.7% -7.6% -6.8% -5.7% -2.5% -0.2% 0.7% 1.6% 2.5% 2.8% 3.6% 4.3% 4.6% 4.9% 5.3% 5.4% 5.5% 5.5% 5.5% 5.6% 5.8% 6.6% 6.9% 7.2% 7.5% 7.2% 7.3% 7.6% 7.9% 8.2% 8.2% 8.0% 7.8%
1984 6.0% -9.2% -7.7% -6.1% -2.2% 0.5% 1.4% 2.3% 3.2% 3.5% 4.3% 5.0% 5.3% 5.5% 5.9% 6.1% 6.1% 6.0% 6.1% 6.1% 6.3% 7.1% 7.4% 7.7% 8.0% 7.7% 7.8% 8.0% 8.4% 8.6% 8.6% 8.4% 8.2%
1985 -22.2% -13.8% -9.8% -4.1% -0.5% 0.6% 1.8% 2.9% 3.3% 4.2% 4.9% 5.3% 5.5% 5.9% 6.1% 6.1% 6.0% 6.1% 6.2% 6.3% 7.2% 7.5% 7.8% 8.1% 7.8% 7.8% 8.1% 8.4% 8.7% 8.7% 8.5% 8.3%
1986 -4.6% -2.9% 2.8% 5.7% 5.9% 6.5% 7.1% 7.0% 7.6% 8.1% 8.2% 8.2% 8.5% 8.4% 8.3% 8.1% 8.0% 8.0% 8.1% 8.9% 9.2% 9.4% 9.6% 9.3% 9.2% 9.5% 9.8% 10.0% 9.9% 9.7% 9.4%
1987 -1.1% 6.7% 9.4% 8.7% 8.9% 9.2% 8.7% 9.2% 9.6% 9.6% 9.5% 9.6% 9.5% 9.3% 9.0% 8.9% 8.8% 8.8% 9.7% 9.9% 10.1% 10.3% 9.9% 9.9% 10.1% 10.4% 10.6% 10.5% 10.2% 9.9%
1988 15.0% 15.1% 12.2% 11.5% 11.3% 10.5% 10.8% 11.1% 10.8% 10.6% 10.7% 10.5% 10.1% 9.8% 9.6% 9.4% 9.4% 10.3% 10.5% 10.7% 10.9% 10.4% 10.4% 10.6% 10.9% 11.1% 11.0% 10.6% 10.3%
1989 15.2% 10.9% 10.4% 10.4% 9.6% 10.1% 10.5% 10.3% 10.1% 10.2% 10.0% 9.7% 9.4% 9.2% 9.1% 9.1% 10.0% 10.3% 10.5% 10.7% 10.2% 10.2% 10.4% 10.7% 10.9% 10.8% 10.5% 10.1%
1990 6.7% 8.0% 8.9% 8.2% 9.1% 9.8% 9.6% 9.5% 9.7% 9.5% 9.2% 8.9% 8.7% 8.7% 8.7% 9.7% 10.0% 10.2% 10.5% 10.0% 9.9% 10.2% 10.5% 10.7% 10.6% 10.3% 10.0%
1991 9.4% 10.0% 8.7% 9.7% 10.4% 10.1% 9.9% 10.1% 9.9% 9.5% 9.1% 8.9% 8.8% 8.8% 9.9% 10.2% 10.4% 10.7% 10.1% 10.1% 10.4% 10.7% 10.9% 10.8% 10.5% 10.1%
1992 10.7% 8.4% 9.9% 10.6% 10.3% 10.0% 10.2% 9.9% 9.5% 9.1% 8.9% 8.8% 8.8% 9.9% 10.2% 10.5% 10.8% 10.2% 10.1% 10.4% 10.7% 11.0% 10.9% 10.5% 10.1%
1993 6.2% 9.4% 10.6% 10.2% 9.8% 10.1% 9.8% 9.3% 8.9% 8.7% 8.6% 8.6% 9.9% 10.2% 10.5% 10.8% 10.2% 10.1% 10.4% 10.7% 11.0% 10.9% 10.5% 10.1%
1994 12.8% 12.9% 11.5% 10.8% 10.9% 10.4% 9.8% 9.3% 9.0% 8.8% 8.9% 10.2% 10.5% 10.8% 11.1% 10.4% 10.3% 10.6% 11.0% 11.2% 11.1% 10.7% 10.3%
1995 13.0% 10.9% 10.1% 10.4% 10.0% 9.3% 8.8% 8.5% 8.4% 8.5% 10.0% 10.3% 10.6% 10.9% 10.2% 10.2% 10.5% 10.9% 11.2% 11.0% 10.6% 10.2%
1996 8.8% 8.7% 9.6% 9.2% 8.6% 8.1% 7.9% 7.8% 8.0% 9.7% 10.1% 10.4% 10.8% 10.1% 10.0% 10.4% 10.8% 11.1% 10.9% 10.5% 10.0%
1997 8.5% 10.0% 9.4% 8.5% 7.9% 7.7% 7.7% 7.9% 9.8% 10.2% 10.6% 11.0% 10.2% 10.1% 10.5% 10.9% 11.2% 11.0% 10.6% 10.1%
1998 11.4% 9.8% 8.5% 7.8% 7.6% 7.6% 7.8% 9.9% 10.4% 10.8% 11.2% 10.3% 10.2% 10.6% 11.0% 11.4% 11.2% 10.7% 10.2%
1999 8.1% 7.1% 6.6% 6.6% 6.8% 7.2% 9.7% 10.3% 10.7% 11.2% 10.2% 10.1% 10.5% 11.0% 11.3% 11.2% 10.6% 10.1%
2000 6.0% 5.8% 6.1% 6.5% 7.0% 10.0% 10.6% 11.0% 11.5% 10.4% 10.3% 10.8% 11.2% 11.6% 11.4% 10.8% 10.2%
2001 5.6% 6.2% 6.6% 7.3% 10.8% 11.4% 11.8% 12.2% 10.9% 10.7% 11.2% 11.7% 12.0% 11.8% 11.1% 10.5%
2002 6.8% 7.1% 7.9% 12.1% 12.6% 12.8% 13.2% 11.6% 11.3% 11.8% 12.3% 12.6% 12.3% 11.5% 10.8%
2003 7.5% 8.4% 14.0% 14.0% 14.1% 14.3% 12.3% 11.9% 12.3% 12.8% 13.1% 12.7% 11.9% 11.1%
2004 9.3% 17.4% 16.3% 15.8% 15.7% 13.1% 12.5% 13.0% 13.4% 13.7% 13.2% 12.3% 11.4%
2005 26.0% 20.0% 18.0% 17.4% 13.9% 13.0% 13.5% 13.9% 14.2% 13.6% 12.5% 11.6%
2006 14.3% 14.2% 14.6% 11.0% 10.6% 11.5% 12.3% 12.8% 12.3% 11.3% 10.3%
2007 14.2% 14.8% 9.9% 9.7% 11.0% 12.0% 12.6% 12.1% 11.0% 10.0%
2008 15.3% 7.9% 8.2% 10.2% 11.6% 12.3% 11.8% 10.6% 9.5%
2009 0.9% 4.9% 8.5% 10.6% 11.7% 11.2% 9.9% 8.8%
2010 9.0% 12.6% 14.1% 14.6% 13.3% 11.5% 10.0%
2011 16.2% 16.7% 16.5% 14.5% 12.0% 10.1%
2012 17.2% 16.7% 13.9% 10.9% 8.9%
2013 16.2% 12.3% 8.9% 7.0%
2014 8.4% 5.4% 4.1%
2015 2.5% 2.0%
2016 1.4%
Bu
y (b
egin
nin
g o
f ye
ar)
-30%
-20%
-10%
0%
10%
20%
30%
19
72
19
75
19
78
19
81
19
84
19
87
19
90
19
93
19
96
19
99
20
02
20
05
20
08
20
11
20
14
Bought
An
nu
aliz
ed
Re
turn
Sold
-30%--20% -20%--10% -10%-0% 0%-10% 10%-20% 20%-30% 30%-30%
Farmland: time and holding periods
(Illinois 1970-2016)

Farmland risk stability measures
-0.300
-0.200
-0.100
0.000
0.100
0.200
0.300
0.400
19
72
19
74
19
76
19
78
19
80
19
82
19
84
19
86
19
88
19
90
19
92
19
94
19
96
19
98
20
00
20
02
20
04
20
06
20
08
20
10
20
12
20
14
20
16
Av
era
ge
An
nu
al re
turn
1
2
3
4
5
6
7
8
9
10
11
12
13
14
15
16
17
18
19
20
21
22
23
Holding period length:
1 yr2 yr3 yr5 yr
10 yr15 yr20 yr25 yr
0%
2%
4%
6%
8%
10%
12%
0% 2% 4% 6% 8% 10% 12%
Av
e. A
nn
ua
l R
etu
rn
St.Dev. of Returns
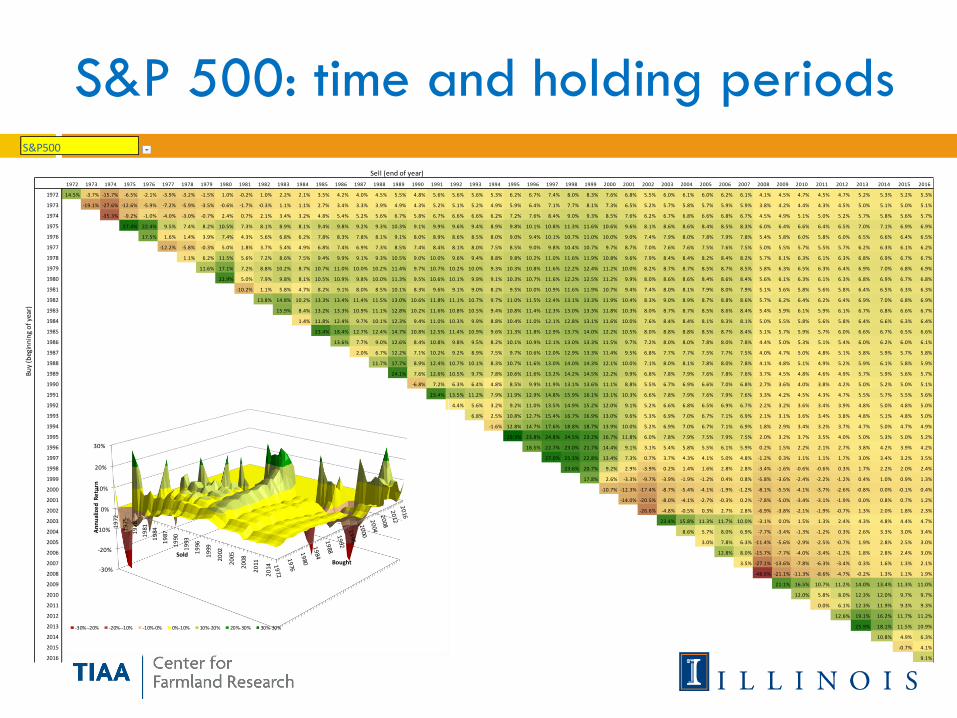
S&P 500: time and holding periods
Sell (end of year)
1972 1973 1974 1975 1976 1977 1978 1979 1980 1981 1982 1983 1984 1985 1986 1987 1988 1989 1990 1991 1992 1993 1994 1995 1996 1997 1998 1999 2000 2001 2002 2003 2004 2005 2006 2007 2008 2009 2010 2011 2012 2013 2014 2015 2016
1972 14.5% -3.7% -15.7% -6.5% -2.1% -3.9% -3.2% -1.5% 1.0% -0.2% 1.0% 2.2% 2.1% 3.5% 4.2% 4.0% 4.5% 5.5% 4.8% 5.6% 5.6% 5.6% 5.3% 6.2% 6.7% 7.4% 8.0% 8.3% 7.6% 6.8% 5.5% 6.0% 6.1% 6.0% 6.2% 6.1% 4.1% 4.5% 4.7% 4.5% 4.7% 5.2% 5.3% 5.2% 5.3%
1973 -19.1% -27.6% -12.6% -5.9% -7.2% -5.9% -3.5% -0.6% -1.7% -0.3% 1.1% 1.1% 2.7% 3.4% 3.3% 3.9% 4.9% 4.3% 5.2% 5.1% 5.2% 4.9% 5.9% 6.4% 7.1% 7.7% 8.1% 7.3% 6.5% 5.2% 5.7% 5.8% 5.7% 5.9% 5.9% 3.8% 4.2% 4.4% 4.3% 4.5% 5.0% 5.1% 5.0% 5.1%
1974 -35.3% -9.2% -1.0% -4.0% -3.0% -0.7% 2.4% 0.7% 2.1% 3.4% 3.2% 4.8% 5.4% 5.2% 5.6% 6.7% 5.8% 6.7% 6.6% 6.6% 6.2% 7.2% 7.6% 8.4% 9.0% 9.3% 8.5% 7.6% 6.2% 6.7% 6.8% 6.6% 6.8% 6.7% 4.5% 4.9% 5.1% 5.0% 5.2% 5.7% 5.8% 5.6% 5.7%
1975 27.4% 22.4% 9.5% 7.4% 8.2% 10.5% 7.3% 8.1% 8.9% 8.1% 9.4% 9.8% 9.2% 9.3% 10.3% 9.1% 9.9% 9.6% 9.4% 8.9% 9.8% 10.1% 10.8% 11.3% 11.6% 10.6% 9.6% 8.1% 8.6% 8.6% 8.4% 8.5% 8.3% 6.0% 6.4% 6.6% 6.4% 6.5% 7.0% 7.1% 6.9% 6.9%
1976 17.5% 1.6% 1.4% 3.9% 7.4% 4.3% 5.6% 6.8% 6.2% 7.8% 8.3% 7.8% 8.1% 9.1% 8.0% 8.9% 8.6% 8.5% 8.0% 9.0% 9.4% 10.1% 10.7% 11.0% 10.0% 9.0% 7.4% 7.9% 8.0% 7.8% 7.9% 7.8% 5.4% 5.8% 6.0% 5.8% 6.0% 6.5% 6.6% 6.4% 6.5%
1977 -12.2% -5.8% -0.3% 5.0% 1.8% 3.7% 5.4% 4.9% 6.8% 7.4% 6.9% 7.3% 8.5% 7.4% 8.4% 8.1% 8.0% 7.5% 8.5% 9.0% 9.8% 10.4% 10.7% 9.7% 8.7% 7.0% 7.6% 7.6% 7.5% 7.6% 7.5% 5.0% 5.5% 5.7% 5.5% 5.7% 6.2% 6.3% 6.1% 6.2%
1978 1.1% 6.2% 11.5% 5.6% 7.2% 8.6% 7.5% 9.4% 9.9% 9.1% 9.3% 10.5% 9.0% 10.0% 9.6% 9.4% 8.8% 9.8% 10.2% 11.0% 11.6% 11.9% 10.8% 9.6% 7.9% 8.4% 8.4% 8.2% 8.4% 8.2% 5.7% 6.1% 6.3% 6.1% 6.3% 6.8% 6.9% 6.7% 6.7%
1979 11.6% 17.1% 7.2% 8.8% 10.2% 8.7% 10.7% 11.0% 10.0% 10.2% 11.4% 9.7% 10.7% 10.2% 10.0% 9.3% 10.3% 10.8% 11.6% 12.2% 12.4% 11.2% 10.0% 8.2% 8.7% 8.7% 8.5% 8.7% 8.5% 5.8% 6.3% 6.5% 6.3% 6.4% 6.9% 7.0% 6.8% 6.9%
1980 22.9% 5.0% 7.9% 9.8% 8.1% 10.5% 10.9% 9.8% 10.0% 11.3% 9.5% 10.6% 10.1% 9.9% 9.1% 10.3% 10.7% 11.6% 12.2% 12.5% 11.2% 9.9% 8.0% 8.6% 8.6% 8.4% 8.6% 8.4% 5.6% 6.1% 6.3% 6.1% 6.3% 6.8% 6.9% 6.7% 6.8%
1981 -10.2% 1.1% 5.8% 4.7% 8.2% 9.1% 8.0% 8.5% 10.1% 8.3% 9.6% 9.1% 9.0% 8.2% 9.5% 10.0% 10.9% 11.6% 11.9% 10.7% 9.4% 7.4% 8.0% 8.1% 7.9% 8.0% 7.9% 5.1% 5.6% 5.8% 5.6% 5.8% 6.4% 6.5% 6.3% 6.3%
1982 13.8% 14.8% 10.2% 13.3% 13.4% 11.4% 11.5% 13.0% 10.6% 11.8% 11.1% 10.7% 9.7% 11.0% 11.5% 12.4% 13.1% 13.3% 11.9% 10.4% 8.3% 9.0% 8.9% 8.7% 8.8% 8.6% 5.7% 6.2% 6.4% 6.2% 6.4% 6.9% 7.0% 6.8% 6.9%
1983 15.9% 8.4% 13.2% 13.3% 10.9% 11.1% 12.8% 10.2% 11.6% 10.8% 10.5% 9.4% 10.8% 11.4% 12.3% 13.0% 13.3% 11.8% 10.3% 8.0% 8.7% 8.7% 8.5% 8.6% 8.4% 5.4% 5.9% 6.1% 5.9% 6.1% 6.7% 6.8% 6.6% 6.7%
1984 1.4% 11.8% 12.4% 9.7% 10.1% 12.3% 9.4% 11.0% 10.3% 9.9% 8.8% 10.4% 11.0% 12.1% 12.8% 13.1% 11.6% 10.0% 7.6% 8.4% 8.4% 8.1% 8.3% 8.1% 5.0% 5.5% 5.8% 5.6% 5.8% 6.4% 6.6% 6.3% 6.4%
1985 23.4% 18.4% 12.7% 12.4% 14.7% 10.8% 12.5% 11.4% 10.9% 9.6% 11.3% 11.8% 12.9% 13.7% 14.0% 12.2% 10.5% 8.0% 8.8% 8.8% 8.5% 8.7% 8.4% 5.1% 5.7% 5.9% 5.7% 6.0% 6.6% 6.7% 6.5% 6.6%
1986 13.6% 7.7% 9.0% 12.6% 8.4% 10.8% 9.8% 9.5% 8.2% 10.1% 10.9% 12.1% 13.0% 13.3% 11.5% 9.7% 7.2% 8.0% 8.0% 7.8% 8.0% 7.8% 4.4% 5.0% 5.3% 5.1% 5.4% 6.0% 6.2% 6.0% 6.1%
1987 2.0% 6.7% 12.2% 7.1% 10.2% 9.2% 8.9% 7.5% 9.7% 10.6% 12.0% 12.9% 13.3% 11.4% 9.5% 6.8% 7.7% 7.7% 7.5% 7.7% 7.5% 4.0% 4.7% 5.0% 4.8% 5.1% 5.8% 5.9% 5.7% 5.8%
1988 11.7% 17.7% 8.9% 12.4% 10.7% 10.1% 8.3% 10.7% 11.6% 13.0% 14.0% 14.3% 12.1% 10.0% 7.1% 8.0% 8.1% 7.8% 8.0% 7.8% 4.1% 4.8% 5.1% 4.9% 5.2% 5.9% 6.1% 5.8% 5.9%
1989 24.1% 7.6% 12.6% 10.5% 9.7% 7.8% 10.6% 11.6% 13.2% 14.2% 14.5% 12.2% 9.9% 6.8% 7.8% 7.9% 7.6% 7.8% 7.6% 3.7% 4.5% 4.8% 4.6% 4.9% 5.7% 5.9% 5.6% 5.7%
1990 -6.8% 7.2% 6.3% 6.4% 4.8% 8.5% 9.9% 11.9% 13.1% 13.6% 11.1% 8.8% 5.5% 6.7% 6.9% 6.6% 7.0% 6.8% 2.7% 3.6% 4.0% 3.8% 4.2% 5.0% 5.2% 5.0% 5.1%
1991 23.4% 13.5% 11.2% 7.9% 11.9% 12.9% 14.8% 15.9% 16.1% 13.1% 10.3% 6.6% 7.8% 7.9% 7.6% 7.9% 7.6% 3.3% 4.2% 4.5% 4.3% 4.7% 5.5% 5.7% 5.5% 5.6%
1992 4.4% 5.6% 3.2% 9.2% 11.0% 13.5% 14.9% 15.2% 12.0% 9.1% 5.2% 6.6% 6.8% 6.5% 6.9% 6.7% 2.2% 3.2% 3.6% 3.4% 3.9% 4.8% 5.0% 4.8% 5.0%
1993 6.8% 2.5% 10.8% 12.7% 15.4% 16.7% 16.9% 13.0% 9.6% 5.3% 6.9% 7.0% 6.7% 7.1% 6.9% 2.1% 3.1% 3.6% 3.4% 3.8% 4.8% 5.1% 4.8% 5.0%
1994 -1.6% 12.8% 14.7% 17.6% 18.8% 18.7% 13.9% 10.0% 5.2% 6.9% 7.0% 6.7% 7.1% 6.9% 1.8% 2.9% 3.4% 3.2% 3.7% 4.7% 5.0% 4.7% 4.9%
1995 29.3% 23.8% 24.8% 24.5% 23.2% 16.7% 11.8% 6.0% 7.8% 7.9% 7.5% 7.9% 7.5% 2.0% 3.2% 3.7% 3.5% 4.0% 5.0% 5.3% 5.0% 5.2%
1996 18.5% 22.7% 23.0% 21.7% 14.4% 9.1% 3.1% 5.4% 5.8% 5.5% 6.1% 5.9% 0.2% 1.5% 2.2% 2.1% 2.7% 3.8% 4.2% 3.9% 4.2%
1997 27.0% 25.3% 22.8% 13.4% 7.3% 0.7% 3.7% 4.3% 4.1% 5.0% 4.8% -1.2% 0.3% 1.1% 1.1% 1.7% 3.0% 3.4% 3.2% 3.5%
1998 23.6% 20.7% 9.2% 2.9% -3.9% 0.2% 1.4% 1.6% 2.8% 2.8% -3.4% -1.6% -0.6% -0.6% 0.3% 1.7% 2.2% 2.0% 2.4%
1999 17.8% 2.6% -3.3% -9.7% -3.9% -1.9% -1.2% 0.4% 0.8% -5.8% -3.6% -2.4% -2.2% -1.2% 0.4% 1.0% 0.9% 1.3%
2000 -10.7% -12.3% -17.4% -8.7% -5.4% -4.1% -1.9% -1.2% -8.1% -5.5% -4.1% -3.7% -2.6% -0.8% 0.0% -0.1% 0.4%
2001 -14.0% -20.5% -8.0% -4.1% -2.7% -0.3% 0.2% -7.8% -5.0% -3.4% -3.1% -1.9% 0.0% 0.8% 0.7% 1.2%
2002 -26.6% -4.8% -0.5% 0.3% 2.7% 2.8% -6.9% -3.8% -2.1% -1.9% -0.7% 1.3% 2.0% 1.8% 2.3%
2003 23.4% 15.8% 11.3% 11.7% 10.0% -3.1% 0.0% 1.5% 1.3% 2.4% 4.3% 4.8% 4.4% 4.7%
2004 8.6% 5.7% 8.0% 6.9% -7.7% -3.4% -1.3% -1.2% 0.3% 2.6% 3.3% 3.0% 3.4%
2005 3.0% 7.8% 6.3% -11.4% -5.6% -2.9% -2.5% -0.7% 1.9% 2.8% 2.5% 3.0%
2006 12.8% 8.0% -15.7% -7.7% -4.0% -3.4% -1.2% 1.8% 2.8% 2.4% 3.0%
2007 3.5% -27.1% -13.6% -7.8% -6.3% -3.4% 0.3% 1.6% 1.3% 2.1%
2008 -48.6% -21.1% -11.3% -8.6% -4.7% -0.2% 1.3% 1.1% 1.9%
2009 21.1% 16.5% 10.7% 11.2% 14.0% 13.4% 11.3% 11.0%
2010 12.0% 5.8% 8.0% 12.3% 12.0% 9.7% 9.7%
2011 0.0% 6.1% 12.3% 11.9% 9.3% 9.3%
2012 12.6% 19.1% 16.2% 11.7% 11.2%
2013 25.9% 18.1% 11.5% 10.9%
2014 10.8% 4.9% 6.3%
2015 -0.7% 4.1%
2016 9.1%
Bu
y (b
egin
nin
g o
f ye
ar)
S&P500
-30%
-20%
-10%
0%
10%
20%
30%
19
72
19
75
19
78
19
81
19
84
19
87
19
90
19
93
19
96
19
99
20
02
20
05
20
08
20
11
20
14
Bought
An
nu
aliz
ed
Re
turn
Sold
-30%--20% -20%--10% -10%-0% 0%-10% 10%-20% 20%-30% 30%-30%

S&P 500 risk stability measures
-0.600
-0.500
-0.400
-0.300
-0.200
-0.100
0.000
0.100
0.200
0.300
0.400
19
72
19
74
19
76
19
78
19
80
19
82
19
84
19
86
19
88
19
90
19
92
19
94
19
96
19
98
20
00
20
02
20
04
20
06
20
08
20
10
20
12
20
14
Av
era
ge
An
nu
al re
turn
1
2
3
4
5
6
7
8
9
10
11
12
13
14
15
16
17
18
19
20
21
22
23
24
25
Holding period length:
1 yr
2 yr3 yr5 yr10 yr
15 yr20 yr25 yr
0%
1%
2%
3%
4%
5%
6%
7%
8%
0% 2% 4% 6% 8% 10% 12% 14% 16% 18% 20%
Av
e. A
nn
ua
l R
etu
rn
St.Dev. of Returns
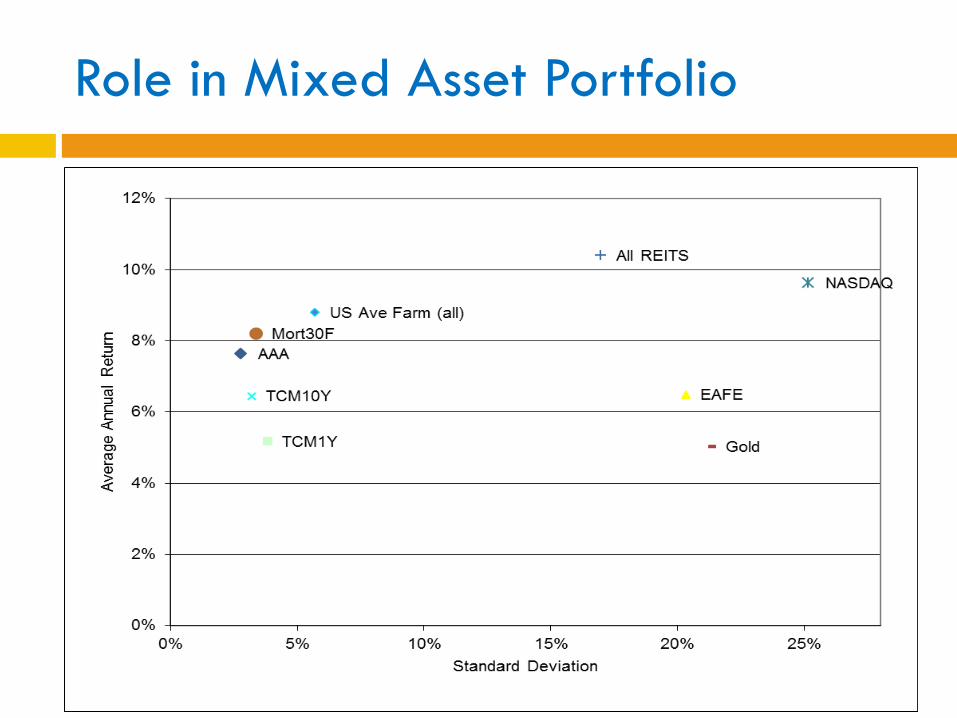
Role in Mixed Asset Portfolio

Role in Mixed Asset Portfolio
Farmland, Stocks, CBonds, REITS, CMT10, Mort30, AAA
Efficient set - Excluding Farmland
Including Farmland

Farmland impacts on portfolio efficiency
Diversification effect drives inclusion in efficient portfolios including real assets and farmland – key driver in institutional interest
Higher shares are “optimal” than normally found in holdings Thin markets, high transactions costs, variance smoothing bias
Holding period effects differ from other assets
Improves Sharpe ratio significantly- See TIAA report
Fairly robust to time periods examined (including present…)
Other real assets may do similarly, but tend to have less diversification benefit, more idiosyncratic risk (e.g. timber).
How to “move the needle” in funds remains difficult.
High net worth individuals often have greatest benefit
C
o
n
t
e
x
t

Number of Farms 1960-present
ERS-USDA

Distribution by Sales Class

Age – (it’s complicated…)
Slope = .48

More complex ops than ownership
ERS-USDA

Ownership and Operations
Increasingly separable, but risk profile changes
Tax advantaged asset to own into estate
Crop Insurance and farm program incentives – mixed and increasingly targeted
Most corporate farms are family farms – age of “stockholders” may not be meaningful number
2032a and 1031 – not ag-specific
Fairly concentrated relative to most other sectors
“Degrees of separation” may matter
More Management opportunities, more competing technologies. (Cell Phones and Travel Agencies…)

Crop Insurance safety net through time
2011 2012 2013 2014 2015 2016 2017
Corn
Projected Price 6.01 5.68 5.65 4.62 4.15 3.86 3.96
Harvest Price 6.32 7.50 4.39 3.49 3.82 3.49 ?
Soybeans
Projected Price 13.49 12.55 12.87 11.36 9.74 8.85 10.19
Harvest Price 12.14 15.39 12.87 9.65 8.91 9.75 ?
Tailwinds and supporting factors…..
Long term thesis for food consumption is quite strong
“World Virtual Water Trade” network intact
Stable relationship between calories and income, SOI curve
Low leverage, very low turnover rates, thin markets
Low correlation with financials, and positive correlation with inflation make farmland a good portfolio anchor asset.
Tax advantages (both income and basis related)
Strong collateral and B/S positions from prior years
Crop insurance countercyclicality, ARC payments
Low interest rates – at point on YC that matters
Technology-related output improvements (factor productivity), and new “analytics” based efforts
C
o
n
t
e
x
t

Where do people live?

Where does rain fall?
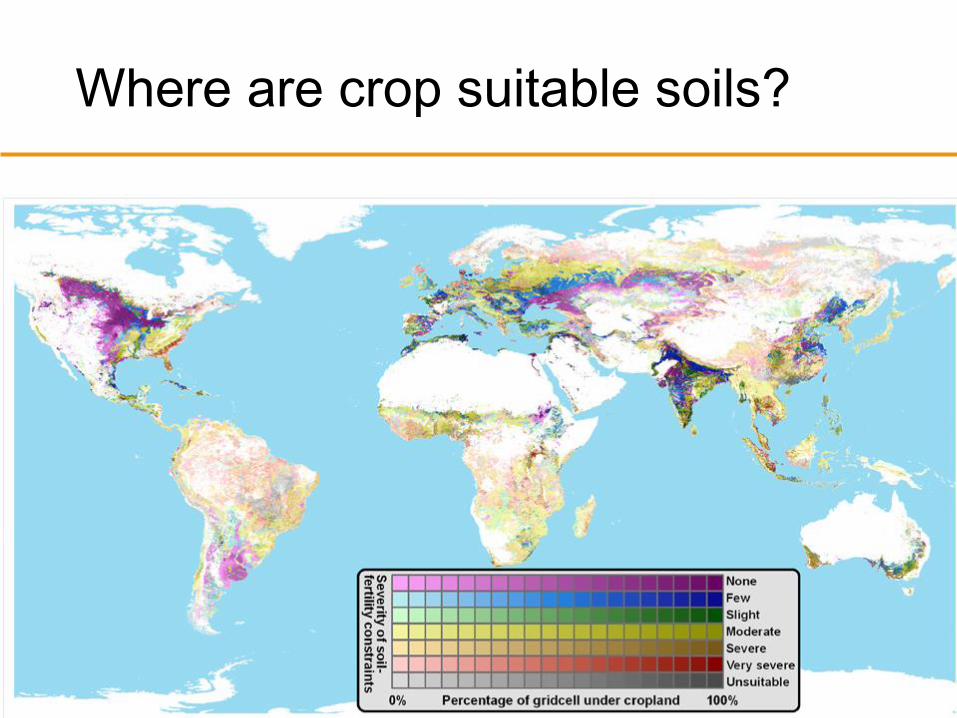
Where are crop suitable soils?

Where is purchasing power?

Income increases calories and quality

Remember these?

“Technology - Times they are a changin’..”

Long lost relatives?

Soil map units and acreage (free…)
(I actually wondered how to compare to the others in the area that I knew…)

Crop Histories (free…)

“Valuation” app. (free…)

Some conversation starters:
How to use tools for competitive advantage?
Other likely “apps” that will appear
Uber-drone analogs to limit machinery transport, reorganized custom activities
Water resource monitoring/mapping
“Case-Shiller” and Zillow for Ag would be incredibly useful
Efficient capitalization with retained ownership of income from specific assets but pooled risk
Transmission of attribute demand information
Opportunities/Threats- both/neither

Farm to fork movement - many channels
Natural, local, fresh, low impact, etc. competing with certification programs (Organic, GMO-free, gluten free)
Lack of standardization in measure of importance (healthfulness, toxicity, taste) and proxy production characteristics
Limited impact in short term on prod. systems
Changing consumer attribute demand
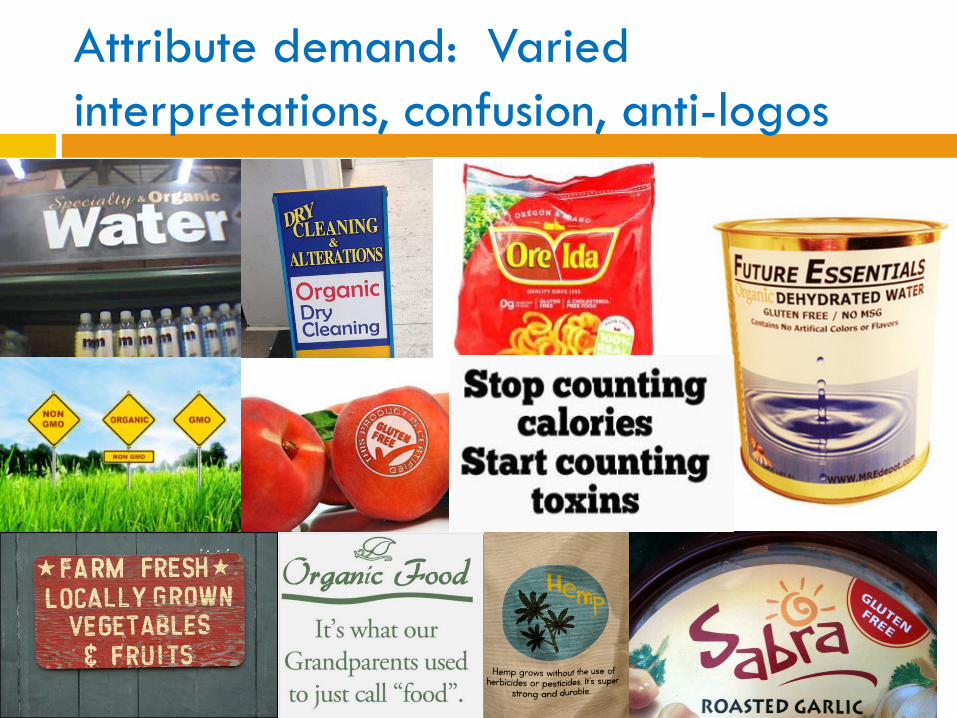
Attribute demand: Varied
interpretations, confusion, anti-logos

“Financialization” likely to continue for the sector. Equity &
indexing vehicles very positive developments
Rationalization of recent incomes, lower cap rates, WACC
Attribute Demand (e.g., non-GMO) becomes more direct
public signal, but marginally impacts production – key
Some positive outcomes for capital providers likely, balance
sheet effects unlikely to trigger “bubble”, low cap rates
remain for some time (economy wide, not ag-specific)
“What asset would you rather own” remains important
Futurecasting

Bruce J. Sherrick
Questions/Discussion
Find us on the web at: