医薬品インタビューフォーム · 洋名:Cibenzoline Succinate 製造承認年月日製造承認年月日 薬価基準収載年月日薬価基準収載年月日:1993年

2020年2月期決算補足資料
For the Year Ended February 29, 2020FACT BOOK 2020
※当連結会計年度より決算期を3月末日から2月末日に変更しているため、当連結会計年度は2019年4月1日から2020年2月29日までの11ヵ月決算となっており、前期比は前連結会計年度の12ヵ月決算との比較となります。
※Since the fiscal year has been changed from the end of March to the end of February, the consolidated fiscal year under review is 11 months from April 1, 2019 to February 29, 2020. YoY figure is calculated by dividing the number by 12-month of the previous fiscal year.
※国内事業は、イオンクレジットサービス株式会社、他3社は、決算期を3月末日から2月末日に変更しているため、当連結会計年度(2019年4月1日~2020年2月29日)は11カ月決算となっており、前期比は前連結会計年度(2018年4月1日~2019年3月31日)の12カ月決算との比較になります。なお、株式会社イオン銀行は、決算期は3月末日から変更ございませんが、連結業績への取り込み数値は、当連結会計年度(2019年4月1日~2020年2月29日)は11カ月、前連結会計年度(2018年4月1日~2019年3月31日)は12カ月となっております。
※Aeon Credit Services Co., Ltd. and three other domestic subsidiaries have changed their fiscal year from the end of March to the end of February, so the consolidated fiscal year 2019 incorporates 11-month from April 1, 2019 to February 29, 2020, and the previous consolidated fiscal year was 12-month from April 1, 2018 to March 31, 2019. YoY is the comparison between these fiscal periods. Although AEON Bank, Ltd. has not changed its fiscal year from the end of March, AFS consolidated earnings figures incorporate 11-month from April 1, 2019 to February 29, 2020 for the fiscal year under review and 12-month from April 1, 2018 to March 31, 2019 for the previous consolidated fiscal year.
※海外事業は、当連結会計年度及び前連結会計年度の期間に変更はなく、いずれも現地12ヵ月決算数値を取り込んでおり、前期比は同期間、12カ月の比率となっております。
※Overseas subsidiaries have not changed their fiscal period for both the consolidated fiscal year under review and the previous year, so AFS incorporate 12-month financial results of all companies for both fiscal years.
証券コード:8570

目次(CONTENTS)
連結決算報告(Consolidated Financial Summary)決算概要(Overview)……………………………………………………………………………………………………………………………………………… 1
業績ハイライト(Financial Highlights)……………………………………………………………………………………………………………………… 1主要な経営指標(Key Indicators)…………………………………………………………………………………………………………………………… 1連結対象会社(Consolidated Subsidiaries and Affiliates)……………………………………………………………………………………………… 2
貸借対照表(Balance Sheet)…………………………………………………………………………………………………………………………………… 3取扱高(Transaction Volume)………………………………………………………………………………………………………………………………… 5損益計算書(Statement of Income)…………………………………………………………………………………………………………………………… 6営業債権内訳(Consolidated Finance Receivables)……………………………………………………………………………………………………… 8(債権流動化実施額)(Securitized Receivables)…………………………………………………………………………………………………………… 8(債権流動化分を含む営業債権残高)(Finance Receivables Including Securitized Receivables)………………………………………………… 9有利子負債内訳(Interest-Bearing Debt)……………………………………………………………………………………………………………………… 10貸倒引当金、貸倒関連費用(Allowance for Possible Credit Losses)…………………………………………………………………………………… 10
事業セグメントの状況(Operating Segment Performance)…………………………………………………………………………………………… 11
国内事業決算報告(Financial Summary for Domestic Business)貸借対照表(Balance Sheet)…………………………………………………………………………………………………………………………………… 13取扱高(Transaction Volume)………………………………………………………………………………………………………………………………… 15損益計算書(Statement of Income)…………………………………………………………………………………………………………………………… 16営業債権内訳(Finance Receivables)………………………………………………………………………………………………………………………… 17(債権流動化実施額等)(Securitized Receivables)………………………………………………………………………………………………………… 17(債権流動化分を含む営業債権残高)(Finance Receivables Including Securitized Receivables)………………………………………………… 18有利子負債内訳(Interest-Bearing Debt)……………………………………………………………………………………………………………………… 19クレジットカードの貸倒引当金、貸倒関連費用(Allowance for Possible Credit Losses)…………………………………………………………… 19
国際事業決算報告(Financial Summary for Global Business)セグメント別取扱高(Transaction Volume by Segment)………………………………………………………………………………………………… 20セグメント別営業債権残高(Finance Receivables by Segment)………………………………………………………………………………………… 21セグメント別損益計算書(Statement of Income by Segment)…………………………………………………………………………………………… 23セグメント別有利子負債(Interest-Bearing Debt by Segment)…………………………………………………………………………………………… 26

目次(CONTENTS)
主要指標(Key Operating Data)カード会員数の推移(Number of Cardholders)……………………………………………………………………………………………………………… 28国内稼働会員数の推移(Number of Active Cardholders in Domestic)………………………………………………………………………………… 28会員属性(Attribution)…………………………………………………………………………………………………………………………………………… 29イオン銀行(単体)の業容(Results of AEON Bank)……………………………………………………………………………………………………… 30
(注)Remarks:1:記載数値は、すべて単位未満切り捨て表示をしております。1:All numbers posted are rounded off to the nearest figure.2:前期比のパーセント表示は、増減率を表しております。2:YOY (%) represents the growth ratio compared with the results in the same period of the previous year.3:連結及び国際事業の記載数値は、決算期ごとの為替レートで換算しております。3:The consolidated figures and global business figures are converted to Japanese yen by exchange rates at every financial closing.4:国内事業の貸借対照表(P13)記載数値は、連結消去前の数値となります。なお、持株会社である当社の数値を含んでおります。4:Figures of the balance sheet for domestic business (P13) are estimated figures before the elimination of intra-company transactions. Included in
domestic are the figures of AEON Financial Service, the holding company.5:国内事業及び国際事業(P15-27)記載数値は、持株会社や機能会社等の5社を除き、かつ各事業セグメントの内部取引を消去しております。5:The figures stated for the domestic business and global business (P15-27) exclude 5 companies comprising the holding company and the companies
providing administrative functions, etc. The internal transactions among the respective business segments have been eliminated.

連結決算報告(Consolidated Financial Summary)決算概要(Overview)
業績ハイライト(Financial Highlights)(単位:百万円)(Unit:Millions of Yen)
2019/3 2020/2実 績Results
前期比YOY
実 績Results
前期比YOY
営業収益 Operating revenue 438,441 - 457,280 4.3%
営業利益 Operating profit 70,021 - 65,070 △7.1%
経常利益 Ordinary profit 70,171 - 65,797 △6.2%
親会社株主に帰属する当期純利益 Profit attributable to owners of parent 39,408 - 34,149 △13.3%
主要な経営指標(Key Indicators)(単位:円)(Unit:Yen)
2019/3 2020/2
自己資本比率 Equity ratio 7.2% 6.8%
1株当たり当期純利益 Earnings per share(EPS) 182.64 158.25
1株当たり純資産(1株当たり株主資本) Book value per share(BPS) 1,764.05 1,823.05
※「自己資本比率」は、(期末純資産の部合計-期末新株予約権-期末非支配株主持分)を期末資産の部合計で除して算出しております。なお、本「自己資本比率」は、自己資本比率告示に定める自己資本比率ではありません。
※The “Equity ratio” is calculated by dividing “Total net assets at the end of the year - Subscription rights to shares at the end of the year - Non-controlling interests at the end of the year” by Total assets at the end of the year.The “Equity ratio” presented here is different from the equity ratio stipulated by the Financial Services Agency Public Notice Regarding Equity Ratio.
1

連結決算報告(Consolidated Financial Summary)決算概要(Overview)
連結対象会社(Consolidated Subsidiaries and Affiliates)国内連結子会社
Consolidated Subsidiaries (Domestic)議決権の所有割合
Shareholding ratio of voting rightsイオンクレジットサービス株式会社 AEON CREDIT SERVICE CO., LTD. 100.0%AFSコーポレーション株式会社 AFS Corporation Co., Ltd. 100.0%株式会社イオン銀行 AEON BANK CO., LTD. 100.0%イオン保険サービス株式会社 AEON INSURANCE SERVICE CO., LTD. 99.0%イオン住宅ローンサービス株式会社 AEON HOUSING LOAN SERVICE CO., LTD. 100.0%エー・シー・エス債権管理回収株式会社 ACS CREDIT MANAGEMENT CO., LTD. 99.5%イオン少額短期保険株式会社 AEON S.S.INSURANCE CO., LTD. 100.0%イオンプロダクトファイナンス株式会社 AEON PRODUCT FINANCE CO., LTD. 100.0%ACSリース株式会社 ACS LEASING CO., LTD. 100.0%
海外連結子会社Consolidated Affiliates (Global)
議決権の所有割合Shareholding ratio of voting rights
海外連結子会社Consolidated Affiliates (Global)
議決権の所有割合Shareholding ratio of voting rights
AEON FINANCIAL SERVICE (HONG KONG) CO., LTD. 100.0% AEON CREDIT SERVICE (M) BERHAD ※3 61.9%AEON CREDIT SERVICE (ASIA) CO., LTD. ※1 52.8% AEON CREDIT CARD (TAIWAN) CO., LTD. 100.0%AEON INSURANCE BROKERS (HK) LTD. 100.0% AEON CREDIT SERVICE SYSTEMS (PHILIPPINES) INC. 100.0%AEON INFORMATION SERVICE (SHENZHEN) CO., LTD. 100.0% AEON CREDIT SERVICE (PHILIPPINES) INC. 94.0%AEON MICRO FINANCE (SHENZHEN) CO., LTD. 100.0% PT.AEON CREDIT SERVICE INDONESIA 89.5%AEON MICRO FINANCE (SHENYANG) CO., LTD. 100.0% ACS TRADING VIETNAM CO., LTD. 100.0%AEON MICRO FINANCE (TIANJIN) CO., LTD. 100.0% AEON CREDIT SERVICE INDIA PRIVATE LTD. 100.0%AEON THANA SINSAP (THAILAND) PLC. ※2 54.3% AEON SPECIALIZED BANK (CAMBODIA) PUBLIC LIMITED COMPANY 100.0%ACS CAPITAL CORPORATION LTD. 29.0% AEON MICROFINANCE (MYANMAR) CO., LTD. 100.0%ACS SERVICING (THAILAND) CO., LTD. 100.0% AEON LEASING SERVICE (LAO) CO., LTD. 100.0%AEON INSURANCE SERVICE (THAILAND) CO., LTD. 100.0% ATS RABBIT SPECIAL PURPOSE VEHICLE CO., LTD. 48.7%HORIZON MASTER TRUST (AEON 2006-1) -%
※1 AEON CREDIT SERVICE (ASIA) CO., LTD. は、香港証券取引所に上場しております。(証券コード900)※1 The shares of AEON CREDIT SERVICE (ASIA) CO., LTD. are listed on Hong Kong Exchanges and Clearing Limited. (Securities Code: 900)※2 AEON THANA SINSAP (THAILAND) PLC. は、タイ証券取引所に上場しております。(証券コードAEONTS)※2 The shares of AEON THANA SINSAP (THAILAND) PLC. are listed on Stock Exchange of Thailand. (Securities Code: AEONTS)※3 AEON CREDIT SERVICE (M) BERHADは、マレーシア証券取引所に上場しております。(証券コード5139)※3 The shares of AEON CREDIT SERVICE (M) BERHAD are listed on Bursa Malaysia Berhad. (Securities Code: 5139)
海外持分法適用会社Consolidated Affiliates (Global)
議決権の所有割合Shareholding ratio of voting rights
FUJITSU CREDIT SERVICE SYSTEMS (TIANJIN) CO., LTD. 49.0%
2
連結決算報告(Consolidated Financial Summary)貸借対照表(Balance Sheet)
(単位:百万円)(Unit:Millions of Yen)2019/3 2020/2
実 績Results
期首増減Change
実 績Results
期首増減Change
流動資産 Current assets 4,981,426 5,483,871 502,444現金及び預金 Cash and deposits 644,502 762,891 118,389コールローン Call loans 30,496 53,773 23,276割賦売掛金 Accounts receivable-installment 1,453,160 1,543,135 89,975リース債権及びリース投資資産 Lease receivables and investment
assets 11,425 12,782 1,357営業貸付金 Operating loans 850,508 860,572 10,064銀行業における貸出金 Loans and bills discounted for
banking business 1,584,990 1,674,786 89,796銀行業における有価証券 Securities for banking business 324,946 447,229 122,282買入金銭債権 Monetary claims bought 13,316 14,823 1,507金銭の信託 Money held in trust 22,406 50,308 27,902その他 Other 148,506 177,875 29,368貸倒引当金 Allowance for doubtful accounts △102,831 △114,308 △11,476
固定資産 Non-current assets 272,425 296,720 24,295有形固定資産 Property, plant and equipment 39,204 45,302 6,097無形固定資産 Intangible assets 100,177 108,934 8,756
のれん Goodwill 20,061 18,378 △1,682その他 Other 80,116 90,555 10,439
投資その他の資産 Investments and other assets 133,042 142,483 9,440繰延資産 Deferred assets 228 779 551資産の部合計 Total assets 5,254,079 5,781,370 527,291
3

連結決算報告(Consolidated Financial Summary)貸借対照表(Balance Sheet)
(単位:百万円)(Unit:Millions of Yen)2019/3 2020/2
実 績Results
期首増減Change
実 績Results
期首増減Change
流動負債 Current liabilities 4,325,626 4,693,618 367,991買掛金 Accounts payable-trade 285,653 260,810 △24,843銀行業における預金 Deposits for banking business 3,469,134 3,790,240 321,106短期借入金 Short-term borrowings 161,744 139,386 △22,3581年内返済予定の長期借入金 Current portion of long-term
borrowings 51,142 106,651 55,5091年内償還予定の社債 Current portion of bonds 50,522 45,253 △5,2681年内償還予定の新株予約権付社債 Current portion of bonds with
share acquisition rights 29,946 - △29,946コマーシャル・ペーパー Commercial papers 102,079 160,151 58,071賞与引当金 Provision for bonuses 4,015 3,685 △330ポイント引当金 P r o v i s i o n f o r p o i n t c a r d
certificates 17,543 20,713 3,169その他の引当金 Other provisions 208 198 △9その他 Other 153,634 166,526 12,892
固定負債 Non-current liabilities 479,748 628,676 148,928社債 Bonds payable 92,621 252,853 160,232長期借入金 Long-term borrowings 331,935 316,005 △15,929退職給付に係る負債 Net defined benefit liability 4,120 4,381 261利息返還損失引当金 Prov i s i on f o r l o s s on i n t e r e s t
repayment 4,176 4,965 788その他の引当金 Other provisions 223 455 232繰延税金負債 Deferred tax liabilities 3,935 3,626 △309その他 Other 42,736 46,389 3,653
負債の部合計 Total liabilities 4,805,374 5,322,295 516,920
4

連結決算報告(Consolidated Financial Summary)貸借対照表(Balance Sheet)
(単位:百万円)(Unit:Millions of Yen)2019/3 2020/2
実 績Results
期首増減Change
実 績Results
期首増減Change
株主資本 Total shareholders' equity 376,376 396,032 19,655資本金 Capital stock 45,698 45,698 -資本剰余金 Capital surplus 120,213 120,360 146利益剰余金 Retained earnings 235,413 230,508 △4,905自己株式 Treasury stock △24,948 △534 24,414
その他の包括利益累計額 Total other comprehensive income 4,267 △2,614 △6,881
その他有価証券評価差額金 Valuation differenceon available-for-sale securities 5,150 2,912 △2,237
繰延ヘッジ損益 Deferred gains or losses on hedges △1,675 △4,468 △2,792
為替換算調整勘定 F o r e i g n c u r r e n c y t r a n s l a t i o n adjustments 1,472 △467 △1,939
退職給付に係る調整累計額 Remeasurements of defined benefit plans △679 △591 88
新株予約権 Subscription rights to shares 103 82 △21非支配株主持分 Non-controlling interests 67,957 65,575 △2,381純資産の部合計 Total net assets 448,705 459,075 10,370負債純資産合計 Total liabilities and net assets 5,254,079 5,781,370 527,291
取扱高(Transaction Volume)(単位:百万円)(Unit:Millions of Yen)
2019/3 2020/2実 績Results
前期比YOY
実 績Results
前期比YOY
包括信用購入あっせん Credit card purchase contracts 5,618,378 8.2% 5,669,677 0.9%
(包括信用購入あっせん) ※ (Credit card purchase contracts) ※ 5,124,355 △1.3% 5,669,677 10.6%
個別信用購入あっせん Hire purchase contracts 346,550 3.5% 351,099 1.3%
カードキャッシング Cash advances 540,997 6.4% 515,070 △4.8%
(カードキャッシング) ※ (Cash advances) ※ 502,638 6.6% 515,070 2.5%
※2020年2月期実績との比較を目的として概算で組み替えた前年同期間の参考数値に基づき前期比較を実施しています。※YoY comparison is calculated with the reference figures of the previous fiscal year which were roughly rearranged to meet the same period as the fiscal year under review.
5

連結決算報告(Consolidated Financial Summary)損益計算書(Statement of Income)
(単位:百万円)(Unit:Millions of Yen)
2019/3 2020/2実 績Results
前期比YOY
実 績Results
前期比YOY
営業収益 Operating revenue 438,441 457,280 4.3%
包括信用購入あっせん収益 Credit card purchase contracts 125,916 125,700 △0.2%
個別信用購入あっせん収益 Hire purchase contracts 40,032 41,914 4.7%
融資収益 Financing revenue 146,365 149,815 2.4%
カードキャッシング Cash advances 94,283 89,868 △4.7%
その他融資 Other loans 52,081 59,946 15.1%
償却債権取立益 Gain on bad debts recovered 7,604 9,604 26.3%
金融収益 Financial revenue 28,251 30,088 6.5%
役務取引等収益 Fees and commissions 60,897 59,565 △2.2%
その他 Other 29,372 40,591 38.2%
営業費用 Operating expenses 368,419 392,209 6.5%
金融費用 Financial expenses 22,741 24,473 7.6%
役務取引等費用 Fees and commissions payments 10,122 9,004 △11.0%
販売費及び一般管理費 Selling, general and administrative expenses 331,982 354,977 6.9%
販売促進費 Promotion expenses 57,855 68,508 18.4%
貸倒関連費用 Bad debt allowance 57,256 68,483 19.6%
貸倒引当金繰入額 Provision of allowance fordoubtful accounts 51,316 62,732 22.2%
貸倒損失 Bad debts expenses 2,708 2,595 △4.2%
利息返還損失引当金繰入額 Provision for loss on interest repayment 3,231 3,155 △2.4%
人件費 Personnel expenses 73,077 73,980 1.2%
管理費 Equipment expenses 90,067 89,671 △0.4%
設備費 Equipment expenses 42,219 43,283 2.5%
一般費 General expenses 11,505 11,050 △4.0%
その他 Other 3,572 3,753 5.1%
営業利益 Operating profit 70,021 65,070 △7.1%
6

連結決算報告(Consolidated Financial Summary)損益計算書(Statement of Income)
(単位:百万円)(Unit:Millions of Yen)
2019/3 2020/2実 績Results
前期比YOY
実 績Results
前期比YOY
営業外収益 Non-operating income 560 742 32.5%
受取配当金 Dividend income 242 206 △15.0%
投資事業組合運用益 Gain on investments in investment partnerships - 187 -
為替差益 Foreign exchange gains 93 197 109.9%
その他 Other 224 152 △32.1%
営業外費用 Non-operating expenses 410 15 △96.2%
投資有価証券評価損 Loss on valuation of investment securities 33 2 △93.9%
雑損失 Miscellaneous loss 376 13 △96.4%
経常利益 Ordinary profit 70,171 65,797 △6.2%
特別利益 Extraordinary income 10 13 24.1%
固定資産売却益 Gain on disposal of non-current assets 10 13 24.1%
特別損失 Extraordinary loss 1,003 1,279 27.5%固定資産処分損 Loss on disposal of non-current assets 594 682 14.7%減損損失 Impairment loss 52 303 483.5%子会社清算損 Loss on liquidation of subsidiaries 45 96 109.3%
カード規格変更に伴う関連資産処分損 Loss on an asset disposal due to change in specification of credit card 298 - -
その他 Other 11 197 -税金等調整前四半期純利益 Profit before income taxes 69,178 64,530 △6.7%法人税等合計 Total income taxes 17,998 19,535 8.5%
法人税、住民税及び事業税 Income taxes-current 23,555 22,677 △3.7%法人税等調整額 Income taxes-deferred △5,557 △3,141 -
四半期純利益 Net profit 51,180 44,994 △12.1%非支配株主に帰属する四半期純利益 Profit attributable to non-controlling interests 11,771 10,844 △7.9%
親会社株主に帰属する四半期純利益 Profit attributable to owners of parent 39,408 34,149 △13.3%
7
連結決算報告(Consolidated Financial Summary)営業債権内訳(Consolidated Finance Receivables)
(単位:百万円)(Unit:Millions of Yen)
2019/3 2020/2実 績Results
期首増減Change
実 績Results
期首増減Change
貸出金計 ※1 Total loans and bills discounted ※1 2,435,498 158,034 2,535,358 99,860
カードキャッシング Cash advances 576,937 29,564 563,803 △13,134
その他融資 Other loans 1,858,561 128,469 1,971,555 112,994
割賦売掛金計 Total accounts receivable-installment 1,453,160 158,527 1,543,135 89,975
包括信用購入あっせん Credit card purchase contracts 912,110 82,899 966,315 54,204
個別信用購入あっせん Hire purchase contracts 541,049 75,628 576,820 35,770
リース債権及びリース投資資産 Lease receivables andinvestment assets 11,425 2,918 12,782 1,357
営業債権合計 Total operating receivables 3,900,083 319,480 4,091,277 191,193
(債権流動化実施額 ※2)(Securitized Receivables ※2)(単位:百万円)(Unit:Millions of Yen)
2019/3 2020/2実績
Results実績
Results
貸出金計 ※1 Total loans and bills discounted ※1 1,327,887 1,617,935
カードキャッシング Cash advances - 31,200
その他融資 Other loans 1,327,887 1,586,735
割賦売掛金計 Total accounts receivable-installment 517,507 582,494
包括信用購入あっせん Credit card purchase contracts 240,200 248,570
個別信用購入あっせん Hire purchase contracts 277,307 333,924
債権流動化残高合計 Total securitized receivables 1,845,395 2,200,429
8

(債権流動化分を含む営業債権残高)(Finance Receivables Including Securitized Receivables)(単位:百万円)(Unit:Millions of Yen)
2019/3 2020/2実 績Results
期首増減Change
実 績Results
期首増減Change
貸出金計 ※1 Total loans and bills discounted ※1 3,763,386 431,016 4,153,294 389,908
カードキャッシング Cash advances 576,937 29,564 595,003 18,065
その他融資 Other loans 3,186,448 401,452 3,558,291 371,842
割賦売掛金計 Total accounts receivable-installment 1,970,668 191,524 2,125,629 154,961
包括信用購入あっせん Credit card purchase contracts 1,152,310 79,049 1,214,885 62,574
個別信用購入あっせん Hire purchase contracts 818,357 112,474 910,744 92,386
リース債権及びリース投資資産 Lease receivables andinvestment assets 11,425 2,918 12,782 1,357
営業債権合計 Total operating receivables 5,745,479 625,459 6,291,706 546,227※1 貸出金は、営業貸付金及び銀行業における貸出金です。※1 Figures of total loans and bills discounted represent operating loan and loans and bills discounted for banking business.※2 債権流動化実施額は、オフバランス残高を記載しております。※2 Securitized Receivables represents balance of Off-balanced receivables.
9

連結決算報告(Consolidated Financial Summary)有利子負債内訳(Interest-Bearing Debt)
(単位:百万円)(Unit:Millions of Yen)2019/3 2020/2
実 績Results
期首増減Change
実 績Results
期首増減Change
短期借入金 Short-term loans payable 161,744 △16,135 139,386 △22,358
長期借入金 Long-term loans payable 383,078 21,565 422,657 39,579
コマーシャル・ペーパー Commercial papers 102,079 41,579 160,151 58,071
社債 Bonds payable 143,143 7,477 298,106 154,963
新株予約権付社債 Bonds with share acquisition rights 29,946 △2 - △29,946リース債務 Lease obligations 36,856 △1,782 44,501 7,644
有利子負債計 Total interest-bearing debt 856,848 52,702 1,064,802 207,954
貸倒引当金、貸倒関連費用(Allowance for Possible Credit Losses)(単位:百万円)(Unit:Millions of Yen)
2019/3 2020/2実 績Results
実 績Results
① 期首貸倒引当金 ※1 Opening balance ※1 93,840 102,831
② 貸倒関連費用 ※2(前期比)
Bad debt allowance ※2(YOY)
54,025-
65,32820.9%
③ 貸倒償却額(前期比)
Written-off amount(YOY)
45,033-
53,85219.6%
期末貸倒引当金①+②-③
(期首比)Ending balance
(Change) 102,8319.6%
114,30811.2%
期末貸倒引当金/営業債権残高比 Ending balance/Total financereceivables 2.6% 2.8%
流動化債権を含んだ場合 If including securitized debt 1.8% 1.8%
貸倒償却額/営業債権残高比 ※3 Written-off amount/Total financereceivables ※3 1.2% 1.3%
流動化債権を含んだ場合 ※3 If including securitized debt ※3 0.8% 0.9%※1 2019年3月期の貸倒引当金の期首残高は、IFRS9を適用した一部子会社の調整後数値を含めて記載しております。※1 The figures stated for opening balance of allowance for doubtful accounts for the Fiscal Year 2019 and for the Fiscal Year 2020 include the adjusted figures from some
subsidiaries that applied IFRS 9.※2 貸倒関連費用は、利息返還損失引当金繰入額を除いた数値を記載しております。※2 The figures of bad debt allowance exclude provision for loss on interest repayment.※3 年率換算しております。※3 The ratio represents the modulated rate for one-year basis.
10

事業セグメントの状況(Operating Segment Performance)(単位:百万円)(Unit:Millions of Yen)
国内Domestic
国際Global
調整額Adjustments
連結財務諸表計上額Consolidated statements
appropriation
(参考※1)(Reference ※1)
リテールRetail
ソリューションSolutions
(参考※1)(Reference ※1)
中華圏China Area
メコン圏Mekong Area
マレー圏Malay Area
実 績Results
実 績Results
前期比YOY国内計
DomesticTotal
前期比YOY
実 績Results
前期比YOY
実 績Results
前期比YOY
国際計GlobalTotal
前期比YOY
実 績Results
前期比YOY
実 績Results
前期比YOY
実 績Results
前期比YOY
営業収益 Operating revenue 302,061 1.3% 185,680 △1.6% 182,360 0.3% 154,947 11.3% 18,910 △3.5% 84,120 16.0% 51,916 10.3% △65,708 457,280 4.3%
包括信用購入あっせん収益 Credit card purchase contracts 105,879 △0.4% 40,214 7.7% 63,997 △5.3% 19,821 1.3% 7,729 0.6% 9,098 △1.3% 2,992 12.2% 1,667 125,700 △0.2%
個別信用購入あっせん収益 Hire purchase contracts 11,700 △6.6% 318 △65.0% 11,484 △3.9% 30,825 10.4% - - 3,955 23.8% 26,869 8.7% △713 41,914 4.7%
融資収益 Financing revenue 67,011 △7.4% 62,774 △11.6% 4,192 175.9% 82,803 11.9% 9,889 △6.4% 59,984 13.2% 12,930 23.9% 44 149,815 2.4%
償却債権取立益 Gain on bad debts recovered △125 - 20 △29.0% △145 △128.1% 9,729 37.8% 607 △10.3% 5,702 118.3% 3,419 △9.3% - 9,604 26.3%
金融収益 Financial revenue 29,997 6.7% 29,986 5.8% 48 - 212 △4.8% 108 46.1% 45 37.7% 57 △50.0% △158 30,088 6.5%
役務取引等収益 Fees and commissions 48,012 △4.9% 31,376 △4.9% 79,752 △6.3% 11,556 11.0% 575 △3.3% 5,333 19.5% 5,646 5.5% △63,119 59,565 △2.2%
その他 Other 39,585 41.8% 20,989 16.3% 23,030 52.8% - - - - - - - - △3,427 40,591 38.2%
営業費用 Operating expenses 265,635 0.6% 170,705 △3.7% 158,656 2.1% 125,635 20.0% 12,976 4.1% 67,059 14.6% 45,599 35.4% △62,788 392,209 6.5%
金融費用 Financial expenses 4,939 △10.8% 3,952 △18.1% 1,029 8.7% 18,709 13.2% 913 △21.0% 8,075 5.2% 9,719 26.4% 782 24,473 7.6%
役務取引等費用 Fees and commissions payments 8,542 △11.7% 70,952 △7.9% 556 30.7% 684 3.8% 0 △79.1% 683 4.3% - - △63,188 9,004 △11.0%
販売費及び一般管理費 Selling, general and administrative expenses 248,620 1.4% 95,550 0.4% 153,787 2.0% 106,023 21.2% 12,019 6.3% 58,207 15.9% 35,796 37.8% △383 354,977 6.9%
その他 Other 3,533 △1.1% 250 △25.5% 3,283 1.5% 218 - 41 - 93 - 83 - 1 3,753 5.1%
営業利益 Operating profit 36,426 6.3% 14,974 32.3% 23,704 △10.2% 29,311 △15.0% 5,934 △16.7% 17,060 21.9% 6,316 △52.8% △2,919 65,070 △7.1%
11

国内Domestic
国際Global
調整額Adjustments
連結財務諸表計上額Consolidated statements
appropriation
(参考※1)(Reference ※1)
リテールRetail
ソリューションSolutions
(参考※1)(Reference ※1)
中華圏China Area
メコン圏Mekong Area
マレー圏Malay Area 実績
Results実 績Results
期首増減Change実 績
Results期首増減Change
実 績Results
期首増減Change
実 績Results
期首増減Change
実 績Results
期首増減Change
実 績Results
期首増減Change
実 績Results
期首増減Change
実 績Results
期首増減Change
貸出金 Loans and bills discounted 2,142,344 34,340 2,053,234 △58,244 106,589 23,747 349,331 16,844 34,808 △5,136 239,793 13,038 74,730 8,942 26,203 2,535,358 99,860
割賦売掛金 Accounts receivable-installment 1,226,681 56,816 765,680 29,093 470,971 27,203 310,565 34,481 30,461 △2,364 71,510 9,117 208,594 27,728 △4,082 1,543,135 89,975
包括信用購入あっせん Credit card purchase contracts 865,161 54,747 719,757 42,562 148,564 12,248 101,153 △542 30,461 △2,364 47,068 △1,842 23,623 3,664 △3,159 966,315 54,204
個別信用購入あっせん Hire purchase contracts 361,519 2,068 45,923 △13,468 322,407 14,954 209,412 35,023 - - 24,442 10,959 184,970 24,064 △923 576,820 35,770
銀行業における預金残高 Balance of deposits for banking business 3,790,486 311,277 3,791,425 309,107 - - - - - - - - - - △1,184 3,790,240 321,106
有利子負債残高 Balance of interest-bearing debt 364,957 89,406 31,061 △4,008 355,762 23,306 508,330 57,628 29,669 △7,512 249,528 19,898 229,132 45,243 169,648 1,064,802 207,954
実 績Results
実 績Results
実 績Results
実 績Results
実 績Results
実 績Results
実 績Results
実 績Results
実 績Results
① 貸出金利回り ① Average interest rate onloans and bills discounted 4.1% 3.9% 4.4% 24.3% 26.5% 25.7% 18.4% - 6.8%
② 貸出金に係る 資金調達利回り
② Funding interestconcerning loans andbills discounted
0.1% 0.1% 0.2% 3.6% 1.4% 3.2% 4.4% - 0.8%
③ 貸出金利鞘 (①-②)
③ Interest rate spread①-② 4.0% 3.8% 4.2% 20.7% 25.1% 22.5% 14.0% - 6.0%
※1 国内計及び国際計は、各事業に属するセグメント間取引における相殺消去後の数値を記載しております。※1 The figures provided under “Domestic Total” and “Global Total” are after the elimination of transactions between segments belonging to each business.※2 貸出金は、営業貸付金及び銀行業における貸出金です。※2 Figures of total loans and bills discounted represent operating loan and loans and bills discounted for banking business.※3 利回りは期首残高と期末残高の平均残高より算出しております。※3 The interest rate is calculated from the average of beginning of the term and end of the term.※4 資金調達利回りは銀行業における預金残高を含み算出しております。※4 The funding interest is calculated by including the balance of deposits for banking business.
12
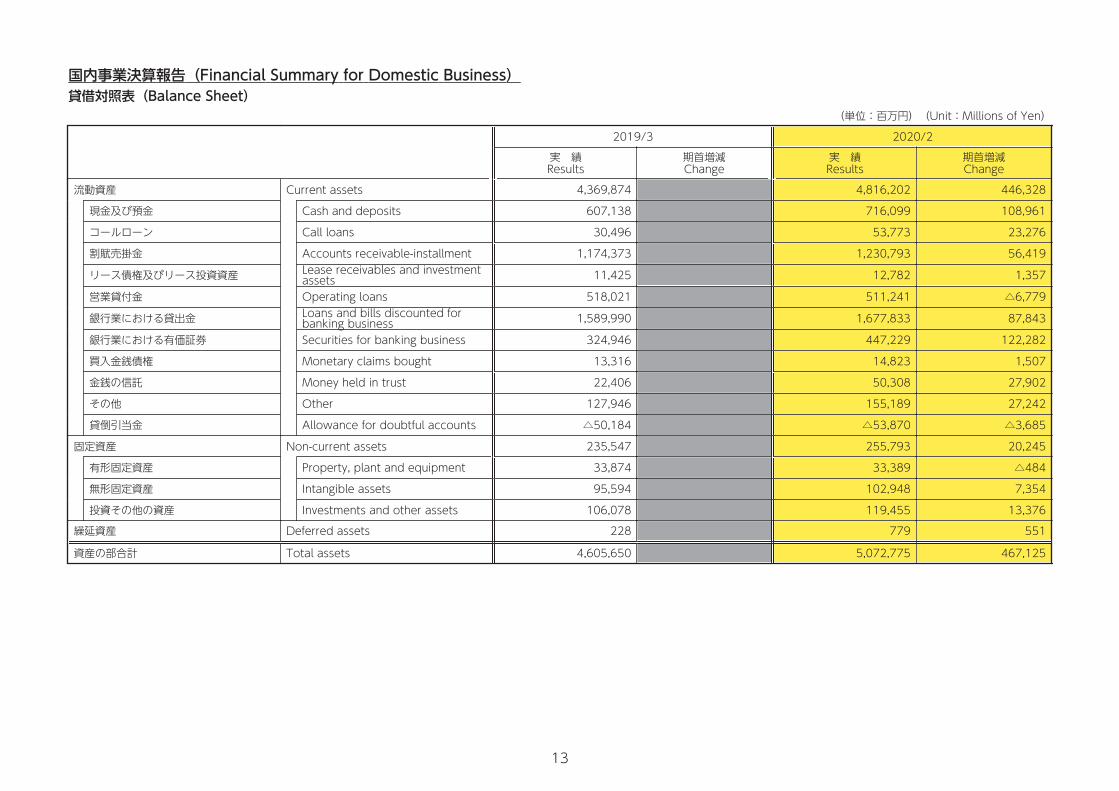
国内事業決算報告(Financial Summary for Domestic Business)貸借対照表(Balance Sheet)
(単位:百万円)(Unit:Millions of Yen)
2019/3 2020/2実 績Results
期首増減Change
実 績Results
期首増減Change
流動資産 Current assets 4,369,874 4,816,202 446,328
現金及び預金 Cash and deposits 607,138 716,099 108,961
コールローン Call loans 30,496 53,773 23,276
割賦売掛金 Accounts receivable-installment 1,174,373 1,230,793 56,419
リース債権及びリース投資資産 Lease receivables and investment assets 11,425 12,782 1,357
営業貸付金 Operating loans 518,021 511,241 △6,779
銀行業における貸出金 Loans and bills discounted for banking business 1,589,990 1,677,833 87,843
銀行業における有価証券 Securities for banking business 324,946 447,229 122,282
買入金銭債権 Monetary claims bought 13,316 14,823 1,507
金銭の信託 Money held in trust 22,406 50,308 27,902
その他 Other 127,946 155,189 27,242
貸倒引当金 Allowance for doubtful accounts △50,184 △53,870 △3,685
固定資産 Non-current assets 235,547 255,793 20,245
有形固定資産 Property, plant and equipment 33,874 33,389 △484
無形固定資産 Intangible assets 95,594 102,948 7,354
投資その他の資産 Investments and other assets 106,078 119,455 13,376
繰延資産 Deferred assets 228 779 551
資産の部合計 Total assets 4,605,650 5,072,775 467,125
13

国内事業決算報告(Financial Summary for Domestic Business)貸借対照表(Balance Sheet)
(単位:百万円)(Unit:Millions of Yen)
2019/3 2020/2実 績Results
期首増減Change
実 績Results
期首増減Change
流動負債 Current liabilities 4,198,819 4,477,802 278,982
買掛金 Accounts payable-trade 282,222 256,841 △25,380
銀行業における預金 Deposits for banking business 3,469,134 3,790,240 321,106
賞与引当金 Provision for bonuses 2,704 2,141 △563
ポイント引当金 Provision for point card certificates 17,543 20,713 3,169
その他 Other 427,214 407,865 △19,349
固定負債 Non-current liabilities 123,191 300,770 177,578
退職給付に係る負債 Net defined benefit liability 3,165 2,930 △235
利息返還損失引当金 Provision for loss on interest repayment 4,176 4,965 788
その他の引当金 Other provisions 99 85 △14
その他 Other 115,749 292,789 177,039
負債の部合計 Total liabilities 4,322,011 4,778,572 456,561
純資産の部合計 Total net assets 283,638 294,202 10,563
負債純資産合計 Total liabilities and net assets 4,605,650 5,072,775 467,125
14

国内事業決算報告(Financial Summary for Domestic Business)取扱高(Transaction Volume)
(単位:百万円)(Unit:Millions of Yen)
2019/3 2020/2実 績Results
前期比YOY
実 績Results
前期比YOY
包括信用購入あっせん Credit card purchase contracts 5,358,216 8.1% 5,378,384 0.4%
(包括信用購入あっせん) ※ (Credit card purchase contracts) ※ 4,864,193 8.0% 5,378,384 10.6%
個別信用購入あっせん Hire purchase contracts 241,756 △4.7% 218,303 △9.7%
カードキャッシング Cash advances 405,809 4.3% 379,643 △6.4%
(カードキャッシング) ※ (Cash advances) ※ 367,450 4.3% 379,643 3.3%
電子マネー Total e-money contracts 1,880,609 △3.7% 1,804,070 △4.1%
(電子マネー) ※ (Total e-money contracts) ※ 1,725,566 △3.8% 1,804,070 4.5%
※2020年2月期実績との比較を目的として概算で組み替えた前年同期間の参考数値に基づき前期比較を実施しています。※YoY comparison is calculated with the reference figures of the previous fiscal year which were roughly rearranged to meet the same period as the fiscal year under review.
15

国内事業決算報告(Financial Summary for Domestic Business)損益計算書(Statement of Income)
(単位:百万円)(Unit:Millions of Yen)
2019/3 2020/2実 績Results
前期比YOY
実 績Results
前期比YOY
営業収益 Operating revenue 298,301 302,061 1.3%包括信用購入あっせん収益 Credit card purchase contracts 106,348 105,879 △0.4%
加盟店収益 Affiliated merchants 80,253 80,110 △0.2%リボ・分割収益 Revolving credit 23,299 22,627 △2.9%その他収益 Other 2,795 3,141 12.4%
個別信用購入あっせん収益 Hire purchase contracts 12,521 11,700 △6.6%融資収益 Financing revenue 72,360 67,011 △7.4%
カードキャッシング Cash advances 70,930 65,713 △7.4%その他融資 Other loans 1,429 1,297 △9.2%
償却債権取立益 Gain on bad debts recovered 546 △125 -金融収益 Financial revenue 28,110 29,997 6.7%役務取引等収益 Fees and commissions 50,490 48,012 △4.9%
内、電子マネー収益 E-money revenue 13,287 12,061 △9.2%その他 Other 27,923 39,585 41.8%
営業費用 Operating expenses 264,034 265,635 0.6%金融費用 Financial expenses 5,538 4,939 △10.8%役務取引等費用 Fees and commissions payments 9,668 8,542 △11.7%販売費及び一般管理費 Selling, general and
administrative expenses 245,256 248,620 1.4%販売促進費 Promotion expenses 51,437 60,506 17.6%貸倒関連費用 Bad debt allowance 25,548 24,105 △5.6%
貸倒引当金繰入額 Provision of allowance fordoubtful accounts 21,939 20,692 △5.7%
貸倒損失 Bad debts expenses 377 258 △31.6%利息返還損失引当金繰入額 Provision for loss on interest
repayment 3,231 3,155 △2.4%人件費 Personnel expenses 48,539 47,337 △2.5%管理費 Equipment expenses 75,365 72,813 △3.4%設備費 Equipment expenses 31,211 31,612 1.3%一般費 General expenses 13,154 12,243 △6.9%
その他 Other 3,571 3,533 △1.1%営業利益 Operating profit 34,267 36,426 6.3%
16

国内事業決算報告(Financial Summary for Domestic Business)営業債権内訳(Finance Receivables)
(単位:百万円)(Unit:Millions of Yen)
2019/3 2020/2実 績Results
期首増減Change
実 績Results
期首増減Change
貸出金計 ※1 Total loans and bills discounted ※1 2,108,004 117,907 2,142,344 34,340
カードキャッシング Cash advances 474,133 18,277 463,234 △10,898
その他融資 Other loans 1,633,870 99,629 1,679,110 45,239
割賦売掛金計 Total accounts receivable-installment 1,169,865 132,037 1,226,681 56,816
包括信用購入あっせん Credit card purchase contracts 810,414 78,337 865,161 54,747
内、リボ・分割払い残高 Revolving and installmentspayment credit card purchase 151,987 20,143 161,926 9,938
個別信用購入あっせん Hire purchase contracts 359,450 53,699 361,519 2,068
リース債権及びリース投資資産 Lease receivables and investment assets 11,425 2,918 12,782 1,357
営業債権合計 Total operating receivables 3,289,294 252,863 3,381,808 92,513
(債権流動化実施額等 ※2)(Securitized Receivables ※2)(単位:百万円)(Unit:Millions of Yen)
2019/3 2020/2実績
Results実績
Results
貸出金計 ※1 Total loans and bills discounted ※1 1,327,887 1,617,935
カードキャッシング Cash advances - 31,200
その他融資 Other loans 1,327,887 1,586,735
割賦売掛金計 Total accounts receivable-installment 517,507 582,494
包括信用購入あっせん Credit card purchase contracts 240,200 248,570
内、リボ・分割払い残高 Revolving and installmentspayment credit card purchase 110,200 118,570
個別信用購入あっせん Hire purchase contracts 277,307 333,924
債権流動化残高合計 Total securitized receivables 1,845,395 2,200,429
17

(債権流動化分を含む営業債権残高)(Finance Receivables Including Securitized Receivables)(単位:百万円)(Unit:Millions of Yen)
2019/3 2020/2実 績Results
期首増減Change
実 績Results
期首増減Change
貸出金計 ※1 Total loans and bills discounted ※1 3,435,892 390,889 3,760,280 324,388
カードキャッシング Cash advances 474,133 18,277 494,434 20,301
その他融資 Other loans 2,961,758 372,612 3,265,845 304,087
内、住宅ローン ※3 Housing Loans ※3 1,803,225 191,463 1,985,335 182,109
割賦売掛金計 Total accounts receivable-installment 1,687,373 165,034 1,809,175 121,802
包括信用購入あっせん Credit card purchase contracts 1,050,614 74,487 1,113,731 63,117
内、リボ・分割払い残高 Revolving and installmentspayment credit card purchase 262,187 16,293 280,496 18,308
個別信用購入あっせん Hire purchase contracts 636,758 90,546 695,443 58,685
リース債権及びリース投資資産 Lease receivables and investment assets 11,425 2,918 12,782 1,357
営業債権合計 Total operating receivables 5,134,690 558,842 5,582,238 447,547※1 貸出金は、営業貸付金及び銀行業における貸出金です。※1 Figures of total loans and bills discounted represent operating loan and loans and bills discounted for banking business.※2 債権流動化実施額は、オフバランス残高を記載しております。※2 Securitized Receivables represents balance of Off-balanced receivables.※3 住宅ローン残高は、投資用マンションローンを除くイオン銀行の数値です。※3 Housing loans receivables are the figures of AEON Bank excluding real estate investment loan figures.
18
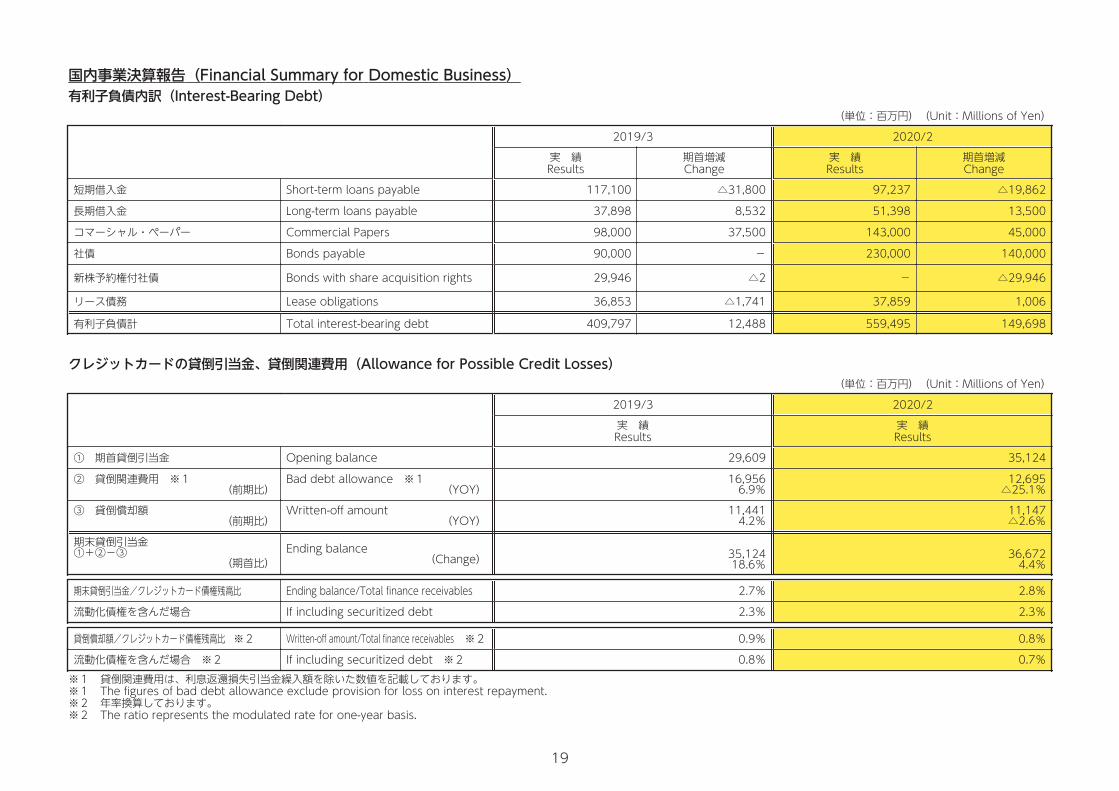
国内事業決算報告(Financial Summary for Domestic Business)有利子負債内訳(Interest-Bearing Debt)
(単位:百万円)(Unit:Millions of Yen)
2019/3 2020/2実 績Results
期首増減Change
実 績Results
期首増減Change
短期借入金 Short-term loans payable 117,100 △31,800 97,237 △19,862
長期借入金 Long-term loans payable 37,898 8,532 51,398 13,500
コマーシャル・ペーパー Commercial Papers 98,000 37,500 143,000 45,000
社債 Bonds payable 90,000 - 230,000 140,000
新株予約権付社債 Bonds with share acquisition rights 29,946 △2 - △29,946
リース債務 Lease obligations 36,853 △1,741 37,859 1,006
有利子負債計 Total interest-bearing debt 409,797 12,488 559,495 149,698
クレジットカードの貸倒引当金、貸倒関連費用(Allowance for Possible Credit Losses)(単位:百万円)(Unit:Millions of Yen)
2019/3 2020/2実 績Results
実 績Results
① 期首貸倒引当金 Opening balance 29,609 35,124
② 貸倒関連費用 ※1(前期比)
Bad debt allowance ※1(YOY)
16,9566.9%
12,695△25.1%
③ 貸倒償却額(前期比)
Written-off amount(YOY)
11,4414.2%
11,147△2.6%
期末貸倒引当金①+②-③
(期首比)Ending balance
(Change) 35,12418.6%
36,6724.4%
期末貸倒引当金/クレジットカード債権残高比 Ending balance/Total finance receivables 2.7% 2.8%
流動化債権を含んだ場合 If including securitized debt 2.3% 2.3%
貸倒償却額/クレジットカード債権残高比 ※2 Written-off amount/Total finance receivables ※2 0.9% 0.8%
流動化債権を含んだ場合 ※2 If including securitized debt ※2 0.8% 0.7%※1 貸倒関連費用は、利息返還損失引当金繰入額を除いた数値を記載しております。※1 The figures of bad debt allowance exclude provision for loss on interest repayment.※2 年率換算しております。※2 The ratio represents the modulated rate for one-year basis.
19
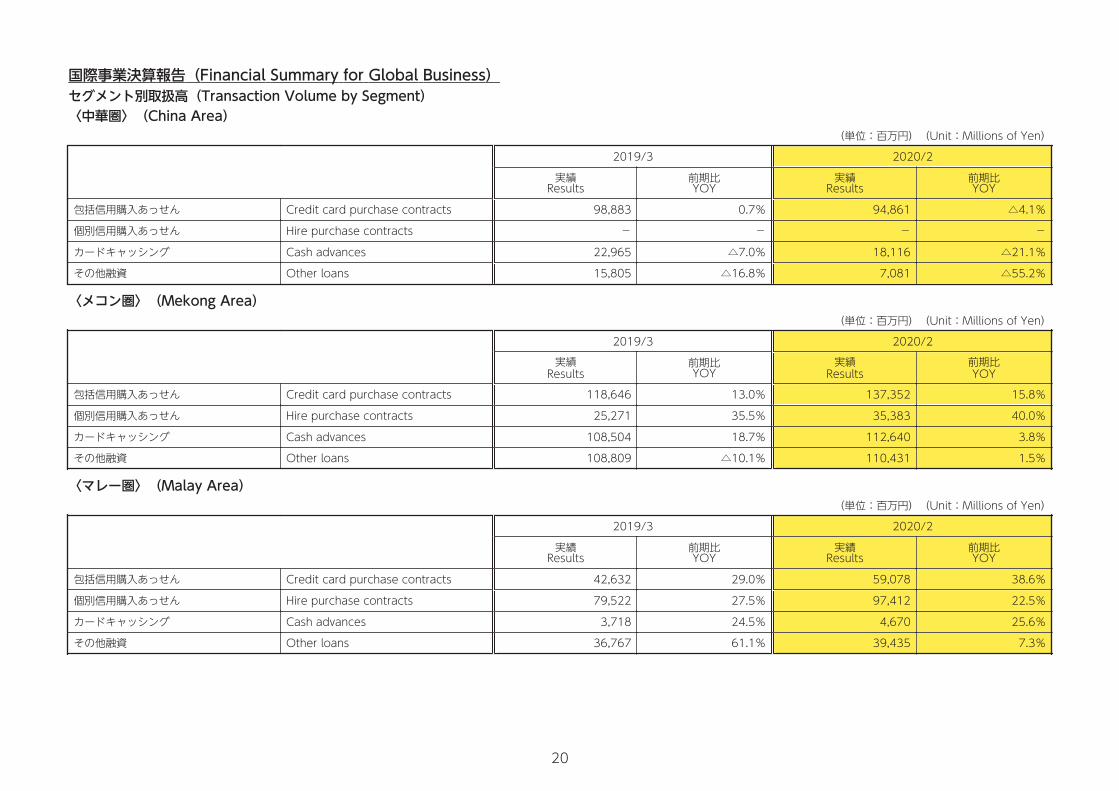
国際事業決算報告(Financial Summary for Global Business)セグメント別取扱高(Transaction Volume by Segment)〈中華圏〉(China Area)
(単位:百万円)(Unit:Millions of Yen)
2019/3 2020/2
実績Results
前期比YOY
実績Results
前期比YOY
包括信用購入あっせん Credit card purchase contracts 98,883 0.7% 94,861 △4.1%
個別信用購入あっせん Hire purchase contracts - - - -
カードキャッシング Cash advances 22,965 △7.0% 18,116 △21.1%
その他融資 Other loans 15,805 △16.8% 7,081 △55.2%
〈メコン圏〉(Mekong Area)(単位:百万円)(Unit:Millions of Yen)
2019/3 2020/2実績
Results前期比YOY
実績Results
前期比YOY
包括信用購入あっせん Credit card purchase contracts 118,646 13.0% 137,352 15.8%
個別信用購入あっせん Hire purchase contracts 25,271 35.5% 35,383 40.0%
カードキャッシング Cash advances 108,504 18.7% 112,640 3.8%
その他融資 Other loans 108,809 △10.1% 110,431 1.5%
〈マレー圏〉(Malay Area)(単位:百万円)(Unit:Millions of Yen)
2019/3 2020/2
実績Results
前期比YOY
実績Results
前期比YOY
包括信用購入あっせん Credit card purchase contracts 42,632 29.0% 59,078 38.6%
個別信用購入あっせん Hire purchase contracts 79,522 27.5% 97,412 22.5%
カードキャッシング Cash advances 3,718 24.5% 4,670 25.6%
その他融資 Other loans 36,767 61.1% 39,435 7.3%
20
セグメント別営業債権残高(Finance Receivables by Segment)〈中華圏〉(China Area)
(単位:百万円)(Unit:Millions of Yen)
2019/3 2020/2実績
Results期首増減Change
実績Results
期首増減Change
貸出金計 ※ Total loans and bills discounted ※ 39,945 △1,381 34,808 △5,136
カードキャッシング Cash advances 23,028 578 20,405 △2,622
その他融資 Other loans 16,917 △1,960 14,403 △2,514
割賦売掛金計 Total accounts receivable-installment 32,825 1,189 30,461 △2,364
包括信用購入あっせん Credit card purchase contracts 32,825 1,189 30,461 △2,364
個別信用購入あっせん Hire purchase contracts - - - -
営業債権合計 Total operating receivables 72,770 △192 65,270 △7,500
〈メコン圏〉(Mekong Area)(単位:百万円)(Unit:Millions of Yen)
2019/3 2020/2実績
Results期首増減Change
実績Results
期首増減Change
貸出金計 ※ Total loans and bills discounted ※ 226,755 27,846 239,793 13,038
カードキャッシング Cash advances 77,870 10,754 78,334 464
その他融資 Other loans 148,884 17,092 161,458 12,573
割賦売掛金計 Total accounts receivable-installment 62,393 1,955 71,510 9,117
包括信用購入あっせん Credit card purchase contracts 48,910 41 47,068 △1,842
個別信用購入あっせん Hire purchase contracts 13,483 1,913 24,442 10,959
営業債権合計 Total operating receivables 289,148 29,802 311,303 22,155
21

〈マレー圏〉(Malay Area)(単位:百万円)(Unit:Millions of Yen)
2019/3 2020/2実績
Results期首増減Change
実績Results
期首増減Change
貸出金計 ※ Total loans and bills discounted ※ 65,787 14,609 74,730 8,942
カードキャッシング Cash advances 1,905 △45 1,827 △77
その他融資 Other loans 63,881 14,655 72,902 9,020
割賦売掛金計 Total accounts receivable-installment 180,865 24,813 208,594 27,728
包括信用購入あっせん Credit card purchase contracts 19,959 3,330 23,623 3,664
個別信用購入あっせん Hire purchase contracts 160,905 21,483 184,970 24,064
営業債権合計 Total operating receivables 246,652 39,423 283,324 36,671※ 貸出金は、営業貸付金及び銀行業における貸出金です。※ Figures of total loans and bills discounted represent operating loan and loans and bills discounted for banking business.
22
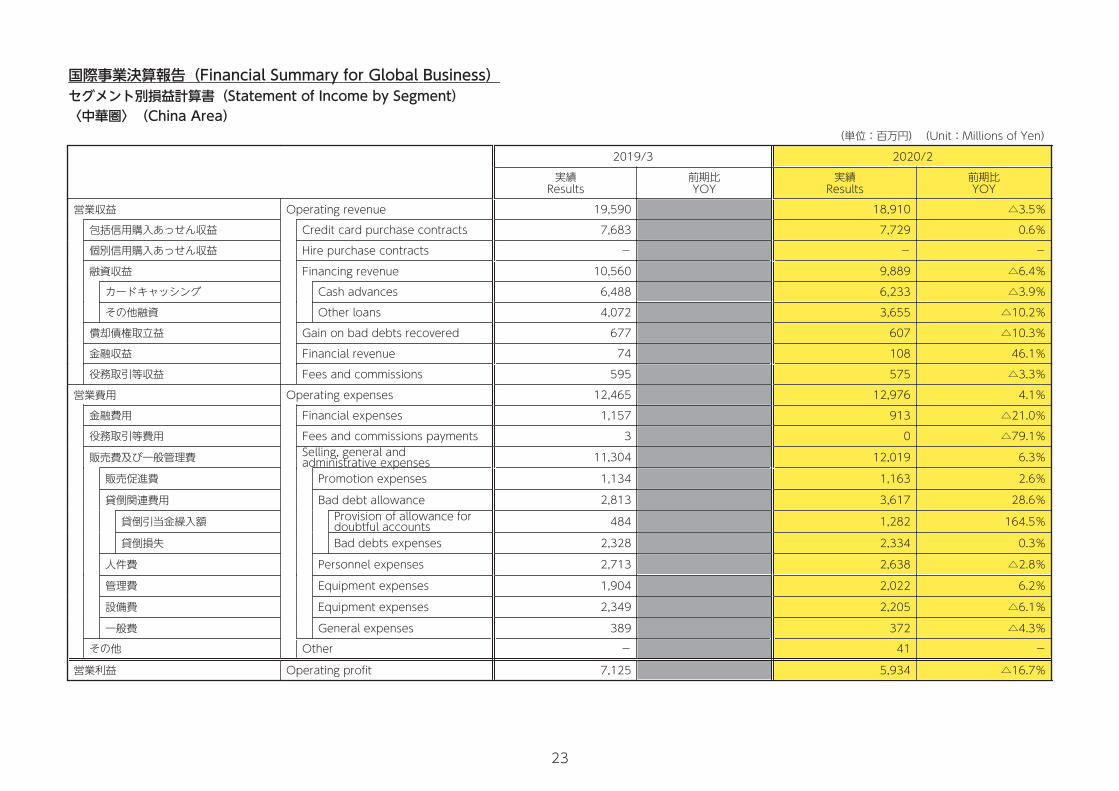
国際事業決算報告(Financial Summary for Global Business)セグメント別損益計算書(Statement of Income by Segment)〈中華圏〉(China Area)
(単位:百万円)(Unit:Millions of Yen)
2019/3 2020/2実績
Results前期比YOY
実績Results
前期比YOY
営業収益 Operating revenue 19,590 18,910 △3.5%
包括信用購入あっせん収益 Credit card purchase contracts 7,683 7,729 0.6%
個別信用購入あっせん収益 Hire purchase contracts - - -
融資収益 Financing revenue 10,560 9,889 △6.4%
カードキャッシング Cash advances 6,488 6,233 △3.9%
その他融資 Other loans 4,072 3,655 △10.2%
償却債権取立益 Gain on bad debts recovered 677 607 △10.3%
金融収益 Financial revenue 74 108 46.1%
役務取引等収益 Fees and commissions 595 575 △3.3%
営業費用 Operating expenses 12,465 12,976 4.1%
金融費用 Financial expenses 1,157 913 △21.0%
役務取引等費用 Fees and commissions payments 3 0 △79.1%
販売費及び一般管理費 Selling, general and administrative expenses 11,304 12,019 6.3%
販売促進費 Promotion expenses 1,134 1,163 2.6%
貸倒関連費用 Bad debt allowance 2,813 3,617 28.6%
貸倒引当金繰入額 Provision of allowance fordoubtful accounts 484 1,282 164.5%
貸倒損失 Bad debts expenses 2,328 2,334 0.3%
人件費 Personnel expenses 2,713 2,638 △2.8%
管理費 Equipment expenses 1,904 2,022 6.2%
設備費 Equipment expenses 2,349 2,205 △6.1%
一般費 General expenses 389 372 △4.3%その他 Other - 41 -
営業利益 Operating profit 7,125 5,934 △16.7%
23

〈メコン圏〉(Mekong Area)(単位:百万円)(Unit:Millions of Yen)
2019/3 2020/2実績
Results前期比YOY
実績Results
前期比YOY
営業収益 Operating revenue 72,530 84,120 16.0%
包括信用購入あっせん収益 Credit card purchase contracts 9,217 9,098 △1.3%
個別信用購入あっせん収益 Hire purchase contracts 3,195 3,955 23.8%
融資収益 Financing revenue 53,007 59,984 13.2%
カードキャッシング Cash advances 16,396 17,457 6.5%
その他融資 Other loans 36,610 42,527 16.2%
償却債権取立益 Gain on bad debts recovered 2,612 5,702 118.3%
金融収益 Financial revenue 33 45 37.7%
役務取引等収益 Fees and commissions 4,464 5,333 19.5%
営業費用 Operating expenses 58,540 67,059 14.6%
金融費用 Financial expenses 7,674 8,075 5.2%
役務取引等費用 Fees and commissions payments 655 683 4.3%
販売費及び一般管理費 Selling, general and administrative expenses 50,208 58,207 15.9%
販売促進費 Promotion expenses 4,497 5,225 16.2%
貸倒関連費用 Bad debt allowance 19,473 24,624 26.5%
貸倒引当金繰入額 Provision of allowance fordoubtful accounts 19,471 24,623 26.5%
貸倒損失 Bad debts expenses 2 1 △35.6%
人件費 Personnel expenses 11,364 12,371 8.9%
管理費 Equipment expenses 8,629 9,597 11.2%
設備費 Equipment expenses 5,220 5,307 1.7%
一般費 General expenses 1,023 1,079 5.5%その他 Other 1 93 -
営業利益 Operating profit 13,990 17,060 21.9%
24

〈マレー圏〉(Malay Area)(単位:百万円)(Unit:Millions of Yen)
2019/3 2020/2実績
Results前期比YOY
実績Results
前期比YOY
営業収益 Operating revenue 47,059 51,916 10.3%
包括信用購入あっせん収益 Credit card purchase contracts 2,667 2,992 12.2%
個別信用購入あっせん収益 Hire purchase contracts 24,720 26,869 8.7%
融資収益 Financing revenue 10,431 12,930 23.9%
カードキャッシング Cash advances 468 464 △0.9%
その他融資 Other loans 9,963 12,466 25.1%
償却債権取立益 Gain on bad debts recovered 3,768 3,419 △9.3%
金融収益 Financial revenue 115 57 △50.0%
役務取引等収益 Fees and commissions 5,354 5,646 5.5%
営業費用 Operating expenses 33,678 45,599 35.4%
金融費用 Financial expenses 7,692 9,719 26.4%
役務取引等費用 Fees and commissions payments - - -
販売費及び一般管理費 Selling, general and administrative expenses 25,985 35,796 37.8%
販売促進費 Promotion expenses 1,884 2,765 46.7%
貸倒関連費用 Bad debt allowance 9,602 15,913 65.7%
貸倒引当金繰入額 Provision of allowance fordoubtful accounts 9,602 15,912 65.7%
貸倒損失 Bad debts expenses - 1 -
人件費 Personnel expenses 7,686 8,865 15.3%
管理費 Equipment expenses 3,566 4,228 18.5%
設備費 Equipment expenses 2,773 3,455 24.6%
一般費 General expenses 472 568 20.4%その他 Other - 83 -
営業利益 Operating profit 13,380 6,316 △52.8%
25
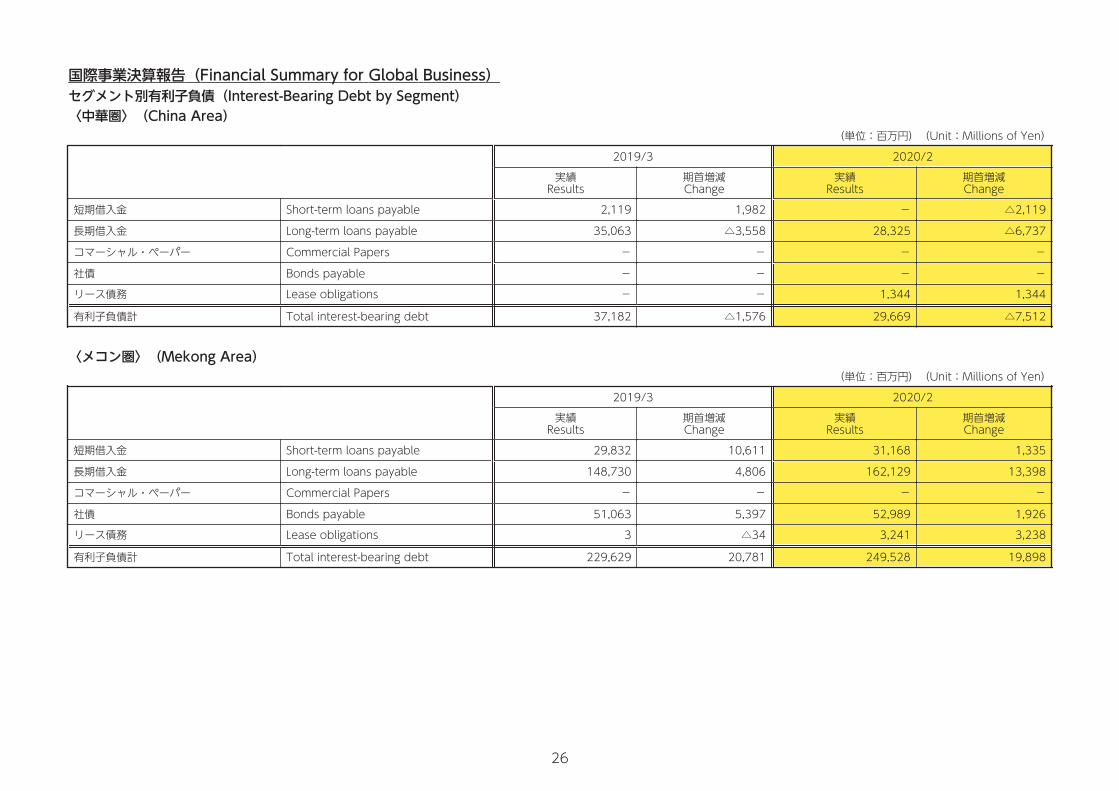
国際事業決算報告(Financial Summary for Global Business)セグメント別有利子負債(Interest-Bearing Debt by Segment)〈中華圏〉(China Area)
(単位:百万円)(Unit:Millions of Yen)
2019/3 2020/2実績
Results期首増減Change
実績Results
期首増減Change
短期借入金 Short-term loans payable 2,119 1,982 - △2,119
長期借入金 Long-term loans payable 35,063 △3,558 28,325 △6,737
コマーシャル・ペーパー Commercial Papers - - - -
社債 Bonds payable - - - -
リース債務 Lease obligations - - 1,344 1,344
有利子負債計 Total interest-bearing debt 37,182 △1,576 29,669 △7,512
〈メコン圏〉(Mekong Area)(単位:百万円)(Unit:Millions of Yen)
2019/3 2020/2実績
Results期首増減Change
実績Results
期首増減Change
短期借入金 Short-term loans payable 29,832 10,611 31,168 1,335
長期借入金 Long-term loans payable 148,730 4,806 162,129 13,398
コマーシャル・ペーパー Commercial Papers - - - -
社債 Bonds payable 51,063 5,397 52,989 1,926
リース債務 Lease obligations 3 △34 3,241 3,238
有利子負債計 Total interest-bearing debt 229,629 20,781 249,528 19,898
26
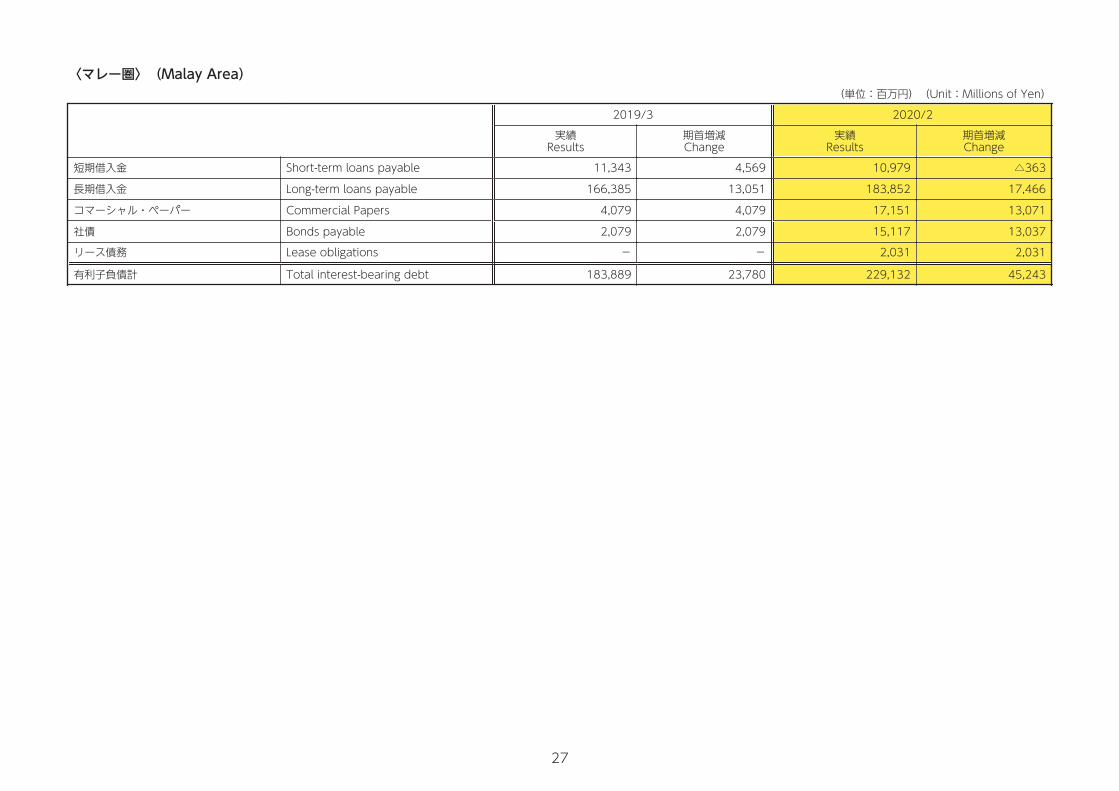
〈マレー圏〉(Malay Area)(単位:百万円)(Unit:Millions of Yen)
2019/3 2020/2実績
Results期首増減Change
実績Results
期首増減Change
短期借入金 Short-term loans payable 11,343 4,569 10,979 △363
長期借入金 Long-term loans payable 166,385 13,051 183,852 17,466
コマーシャル・ペーパー Commercial Papers 4,079 4,079 17,151 13,071
社債 Bonds payable 2,079 2,079 15,117 13,037
リース債務 Lease obligations - - 2,031 2,031
有利子負債計 Total interest-bearing debt 183,889 23,780 229,132 45,243
27

主要指標(Key Operating Data)カード会員数の推移(Number of Cardholders)
(単位:万人)(Unit:Ten thousand)
2017/3 2018/3 2019/3 2020/2実績
Results期首増減Change
実績Results
期首増減Change
実績Results
期首増減Change
実績Results
期首増減Change
連結有効会員数 Number of cardholders 3,894 172 4,064 170 4,269 205 4,527 258
内、国内有効会員数 ※ Number of creditcardholders in domestic ※ 2,692 104 2,775 83 2,840 65 2,889 49
※国内有効会員数には家族カード会員数を含んでおります。※The number of affiliate card members is included in the number of card members for domestic business.
国内稼働会員数の推移(Number of Active Cardholders in Domestic)(単位:万人)(Unit:Ten thousand)
2017/3 2018/3 2019/3 2020/2実績
Results期首増減Change
実績Results
期首増減Change
実績Results
期首増減Change
実績Results
期首増減Change
稼働会員数 ※1 Active cardholders ※1 1,661 68 1,702 41 1,749 47 1,843 94
年間稼働率(%) ※2 Card-use rate(%) ※2 66.3% - 65.7% - 65.8% - 68.0% -
※1 稼働会員数とはカード会員数の内、1年間に1回以上カードを利用した会員数です。※1 “Active cardholders” means the number of cardholders who have used their cards at least once within the previous 12 months.※2 年間稼働率=稼働会員数÷(2019/4~2020/2)平均国内カード会員数(家族カード会員除く)×100※2 Card-use rate = Active cardholders/Average number of cardholders in Domestic excluding affiliated card members (2019/4 and 2020/2)×100.
28

2020/04/09 21:07:53 / 20620352_イオンフィナンシャルサービス株式会社_総会その他(C)
会員属性(Attribution)-男女別構成比(Composition ratio by sex)
男女別構成比Composition ratio by sex
男性 Male 36.0%
女性 Female 64.0%
-地域別構成比(Composition ratio by area)地域別構成比
Composition ratio by area地域別構成比
Composition ratio by area
北海道 Hokkaido 4.6% 東海 Tokai 14.1%
東北 Tohoku 8.6% 近畿 Kinki 18.6%
北関東・北陸・甲信越 Kitakanto/Hokuriku/Koushinetsu 11.4% 中国・四国 Chugoku/Shikoku 9.5%
首都圏 Syutoken 22.7% 九州・沖縄 Kyusyu/Okinawa 10.5%
-年齢別構成比(Composition ratio by age)年齢別構成比:全体
Composition ratio by age:Total年齢別構成比:男性
Composition ratio by age:Male年齢別構成比:女性
Composition ratio by age:Female
29歳以下 Under 29 7.6% 8.6% 7.1%
30-39 30-39 12.4% 12.8% 12.2%
40-49 40-49 22.2% 21.0% 22.9%
50-59 50-59 21.6% 20.6% 22.2%
60歳以上 Over 60 36.1% 37.0% 35.5%
合計 Total 100.0% 100.0% 100.0%
29
会員属性

イオン銀行(単体)の業容(Results of AEON Bank)(単位:百万円)(Unit:Millions of Yen)
2017/3 2018/3 2019/3 2020/2実績
Results期首増減Change
実績Results
期首増減Change
実績Results
期首増減Change
実績Results
期首増減Change
預金残高 Balance of Deposits 2,545,618 391,919 3,053,808 508,189 3,483,437 429,629 3,791,837 308,400
普通預金 Ordinary deposits 1,444,931 728,718 2,020,773 575,841 2,633,376 612,602 2,991,246 357,870
定期預金 Time deposits 1,097,158 △339,920 1,030,573 △66,584 815,285 △215,288 728,131 △87,153
その他預金 Other deposits 3,528 3,121 2,461 △1,067 34,775 32,314 72,458 37,683
貸出金残高 Balance of loans and bills discounted 1,630,046 208,233 1,959,497 329,451 2,110,896 151,398 2,052,741 △58,155
(単位:万)(Unit:Ten thousand)
口座数 Number of accounts 555 62 605 50 656 51 709 53
(単位:店舗、台)銀行店舗数 Number of branches 135 3 140 5 140 - 141 1
ATM台数 Number of ATMs 5,855 125 6,181 326 6,193 12 6,146 △47
30


![Title 7月1日-1976年8月3日 Issue Date URL Right …...Title [亀田治メモランダム]Memorandom2 (KDD本社) : 1975年 7月1日-1976年8月3日 Author(s) Citation CIAS discussion](https://static.fdocuments.in/doc/165x107/5ecc09c7087ff73ee102b36e/title-7oe1-19768oe3-issue-date-url-right-title-cffffffmemorandom2.jpg)