Fabrication of Hollow CoP/TiOx Heterostructures for ...
11
See discussions, stats, and author profiles for this publication at: https://www.researchgate.net/publication/337834485 Fabrication of Hollow CoP/TiOx Heterostructures for Enhanced Oxygen Evolution Reaction Article in Small · December 2019 DOI: 10.1002/smll.201905075 CITATIONS 2 READS 168 13 authors, including: Some of the authors of this publication are also working on these related projects: energy storage View project Carbon Supported Nanostructures for Electrocatalysis View project Zibin Liang Peking University 70 PUBLICATIONS 2,065 CITATIONS SEE PROFILE Song Gao Peking University 51 PUBLICATIONS 634 CITATIONS SEE PROFILE Ruo Zhao Peking University 27 PUBLICATIONS 771 CITATIONS SEE PROFILE Hao Zhang Peking University 22 PUBLICATIONS 97 CITATIONS SEE PROFILE All content following this page was uploaded by Zibin Liang on 19 December 2019. The user has requested enhancement of the downloaded file.
Transcript of Fabrication of Hollow CoP/TiOx Heterostructures for ...
See discussions, stats, and author profiles for this publication at: https://www.researchgate.net/publication/337834485
Fabrication of Hollow CoP/TiOx Heterostructures for Enhanced Oxygen
Evolution Reaction
Article in Small · December 2019
DOI: 10.1002/smll.201905075
CITATIONS
2READS
168
13 authors, including:
Some of the authors of this publication are also working on these related projects:
energy storage View project
Carbon Supported Nanostructures for Electrocatalysis View project
Zibin Liang
Peking University
70 PUBLICATIONS 2,065 CITATIONS
SEE PROFILE
Song Gao
Peking University
51 PUBLICATIONS 634 CITATIONS
SEE PROFILE
Ruo Zhao
Peking University
27 PUBLICATIONS 771 CITATIONS
SEE PROFILE
Hao Zhang
Peking University
22 PUBLICATIONS 97 CITATIONS
SEE PROFILE
All content following this page was uploaded by Zibin Liang on 19 December 2019.
The user has requested enhancement of the downloaded file.

1905075 (1 of 10) © 2019 WILEY-VCH Verlag GmbH & Co. KGaA, Weinheim
www.small-journal.com
Full PaPer
Fabrication of Hollow CoP/TiOx Heterostructures for Enhanced Oxygen Evolution Reaction
Zibin Liang, Wenyang Zhou, Song Gao, Ruo Zhao, Hao Zhang, Yanqun Tang, Jinqian Cheng, Tianjie Qiu, Bingjun Zhu, Chong Qu, Wenhan Guo, Qian Wang,* and Ruqiang Zou*
Z. Liang, W. Zhou, Dr. S. Gao, Dr. R. Zhao, Dr. H. Zhang, Y. Tang, J. Cheng, T. Qiu, Dr. B. Zhu, Dr. C. Qu, Dr. W. Guo, Prof. Q. Wang, Prof. R. ZouBeijing Key Laboratory for Theory and Technology of Advanced Battery MaterialsDepartment of Materials Science and EngineeringCollege of EngineeringPeking UniversityBeijing 100871, P. R. ChinaE-mail: [email protected]; [email protected]
The ORCID identification number(s) for the author(s) of this article can be found under https://doi.org/10.1002/smll.201905075.
DOI: 10.1002/smll.201905075
1. Introduction
Oxygen evolution reaction (OER) is a key process for various energy storage and conversion devices including rechargeable metal-air batteries and electrochemical water splitting.[1] As a four-electron-involving reaction, OER is a complicated and slug-gish process, which requires efficient electrocatalysts to promote the kinetics and reduce the overpotential.[2] Currently, Ir/Ru-based materials are highly active electrocatalysts for OER. How-ever, their high cost, scarcity, and poor durability greatly hinder their widespread applications for OER. Therefore, great efforts have been devoted to developing earth-abundant materials with high activity and durability for OER electrocatalysis.[2a,3] Among the developed earth-abundant OER electrocatalysts, transi-tion-metal phosphides (TMPs) have emerged as promising
Transition-metal phosphides have flourished as promising candidates for oxygen evolution reaction (OER) electrocatalysts. Herein, it is demonstrated that the electrocatalytic OER performance of CoP can be greatly improved by constructing a hybrid CoP/TiOx heterostructure. The CoP/TiOx heterostruc-ture is fabricated using metal–organic framework nanocrystals as templates, which leads to unique hollow structures and uniformly distributed CoP nano particles on TiOx. The strong interactions between CoP and TiOx in the CoP/TiOx heterostructure and the conductive nature of TiOx with Ti3+ sites endow the CoP–TiOx hybrid material with high OER activity comparable to the state-of-the-art IrO2 or RuO2 OER electrocatalysts. In combination with theoretical calculations, this work reveals that the formation of CoP/TiOx hetero structure can generate a pathway for facile electron transport and opti-mize the water adsorption energy, thus promoting the OER electrocatalysis.
candidates.[4] Many strategies have been explored to improve the electrocatalytic OER performance of TMPs such as nano-structuring[5] and incorporation of foreign metal sites.[4a,c] However, there is still a large room for further improvement of the electrocatalytic OER performance of TMPs by more precise control of their structures and compositions.
Recently, hybrid materials constructed with different functional components have attracted great attentions for electro-chemical applications benefitting from the combined advantages/features and the synergistic effect of the different com-ponents.[6] For example, the synergistic effect on the interfaces between different components can optimize the electronic
structure of active sites for adsorption and activation of the reac-tant molecules and modify the reaction pathway or the configu-rations of reaction intermediates, leading to greatly promoted reaction kinetics and accelerated reaction rates.[6e–g] For OER electrocatalysis, however, the design and fabrication of hybrid materials with interface structure are not well-explored because of the absence of an effective strategy for the synthesis of hybrid materials with strong interfacial effect for promoting the reac-tion kinetics.
Herein, motivated by the aforementioned considerations, we demonstrated the fabrication of CoP–TiOx hybrid mate-rial with CoP/TiOx heterostructure for OER electrocatalysis. The presented CoP–TiOx hybrid material has unique porous hollow nanocage TiOx morphology coupled with ultrafine CoP nanoparticles and abundant CoP/TiOx interfaces. The porous hollow TiOx nanocages with abundant Ti3+ sites can serve as conductive substrates and promote the electron transfer as well as facilitate the mass transport. The use of TiOx as con-ductive substrate offer advantage of high stability and low cost, which is especially important for OER as the commonly used carbon substrate may undergo severe corrosion and decrease the Faradic efficiency at high positive potentials. Moreover, the strong interactions and synergistic effect between CoP and TiOx in the CoP/TiOx heterostructure resulted in fast pathway for electron transport and optimized water adsorption energy. As a consequence, the CoP–TiOx hybrid material showed remark-able activity and durability for OER electrocatalysis in alkaline solution, which were superior to the individual CoP or TiOx and
Small 2019, 1905075

1905075 (2 of 10)
www.advancedsciencenews.com
© 2019 WILEY-VCH Verlag GmbH & Co. KGaA, Weinheim
www.small-journal.com
were comparable to the state-of-the-art IrO2 and RuO2 electro-catalysts. In combination with theoretical calculations based on density functional theory (DFT), we demonstrated the strong interactions between CoP and TiOx in the CoP/TiOx hetero-structure play important role on its high electrochemical per-formance. This work not only presented a promising electro-catalyst for OER, but also explored a new strategy to improve OER performance through heterostructure construction and interface engineering.
2. Results and Discussion
The fabrication process of CoP–TiOx was schematically illus-trated in Figure 1A. Co-based metal–organic framework (MOF) nanocrystals, namely, ZIF-67 were first synthesized through the coprecipitation reaction of Co2+ and 2-methylimidazole
(Figure S1, Supporting Information).[7] Transmission electron microscopy (TEM) images, X-ray diffraction (XRD) patterns, and N2 sorption measurements confirmed the successful synthesis of ZIF-67 nanocrystals with particle size of ≈300 nm (Figure S1B–F, Supporting Information). Afterward, the ZIF-67 nanocrystals were uniformly coated with thin TiOx shells through the hydrolysis, oligomerization, and condensa-tion of titanium butoxide (see the Experimental Section).[8] The ZIF-67 crystal structure of the resultant ZIF-67–TiOx remained intact after TiOx coating, and the absence of XRD peaks of crystalline TiOx suggested the amorphous nature of the TiOx shells (Figure S2, Supporting Information). TEM images of ZIF-67–TiOx confirmed that the rhombic dodecahedron mor-phology of ZIF-67 was maintained while rough TiOx shells with thickness of ≈15 nm that uniformly coat the ZIF-67 nanocrystals can be clearly recognized (Figure 1B,C). ZIF-67–TiOx was then annealed at 400 °C in air to obtain Co3O4–TiOx
Small 2019, 1905075
Figure 1. A) Schematic illustration of the fabrication of CoP–TiOx hybrid hollow materials. B) TEM image of ZIF-67–TiOx. Inset shows an isolated ZIF-67–TiOx particle. C) TEM image of ZIF-67–TiOx showing a thin TiOx shell on the ZIF-67 core. Inset shows a schematic model of the core–shell ZIF-67–TiOx structure. D) SEM image of CoP–TiOx with arrows pointing to broken particles that shows hollow structure. E) SEM image of CoP–TiOx showing the CoP nanoparticles distributed on the internal surface of the TiOx shell. F) TEM image of CoP–TiOx. Inset shows the schematic model of CoP–TiOx. G) TEM image of CoP–TiOx showing the interface (dot line) between the TiOx shell and CoP nanoparticles. H) HRTEM image of CoP–TiOx with dot line showing the CoP/TiOx heterostructure. I) HAADF-STEM image and J) the corresponding EDS line-scan profile of CoP–TiOx showing the CoP/TiOx interface.

1905075 (3 of 10)
www.advancedsciencenews.com
© 2019 WILEY-VCH Verlag GmbH & Co. KGaA, Weinheim
www.small-journal.com
(Figure S3, Supporting Information). The complete decom-position of ZIF-67 and formation of Co3O4 nanoparticles was confirmed by the disappeared ZIF-67 peaks and well-defied Co3O4 peaks in the XRD pattern of Co3O4–TiOx (Figure S3B, Supporting Information). The TiOx shells were well maintained in Co3O4–TiOx and exhibited hollow nanocage structure as the ZIF-67 core completely decomposed into Co3O4 nanoparticles that were uniformly distributed on the internal surface of the TiOx nanocages (Figures S3C,D and S4, Supporting Informa-tion). After phosphorization, the Co3O4 nanoparticles were in situ converted to CoP nanoparticles and the final product CoP–TiOx was obtained. For comparison, Co3O4 and CoP were also synthesized from ZIF-67 nanocrystals without TiOx shells (Figure S5, Supporting Information).
XRD pattern of CoP–TiOx proved the complete transforma-tion from Co3O4 into CoP (Figure S6, Supporting Information). CoP–TiOx possessed hollow rhombic dodecahedron structure, with CoP nanoparticles uniformly distributed on the internal surface of the TiOx nanocages (Figure 1D,E; Figure S7, Sup-porting Information). The TiOx nanocages of CoP–TiOx are porous and disordered (Figure S8, Supporting Information), and the CoP nanoparticles were showed to have hollow struc-ture, which was formed because of the nanoscale Kirkendall effect (Figure 1F).[9] The pore structure of CoP–TiOx was investi-gated by nitrogen sorption measurements, which demonstrated the presence of meso/macropores in CoP–TiOx (Figure S9, Supporting Information). These CoP hollow nanoparticles had an intimate contact with the TiOx shells, leading to formation of abundant CoP/TiOx interface in CoP–TiOx (Figure 1G). The CoP/TiOx interface was further demonstrated in high-resolution TEM (HRTEM) image, which clearly showed lattice fringes with spacings of 0.19 and 0.25 nm corresponding to the (211) and (200) planes of CoP, respectively, and the amorphous nature of the TiOx shells (Figure 1H). Figure 1I,J illustrates the high-angle annular dark-field scanning TEM (HAADF-STEM) image of CoP–TiOx and the corresponding energy-dispersive X-ray spectroscopy (EDS) line-scan profiles, which further con-firmed the intimate contact between CoP and TiOx and the existence of CoP/TiOx interface. Recently, precise synthesis and tuning of the heterojunction interface between two different components have been proven an efficient strategy to boost the electrocatalytic activity.[6f,10] Remarkably, Zhang and co-workers demonstrated the NiO/TiOx interface can lead to facile electron transport and electron donation from NiO to TiOx, resulting in enhanced electrocatalytic OER performance.[10c] In this regard, it was expected that the existence of abundant CoP/TiOx inter-face can endow CoP–TiOx with outstanding electrocatalytic OER activity because of the facilitated electron transport and the charge modification on the CoP/TiOx interface.
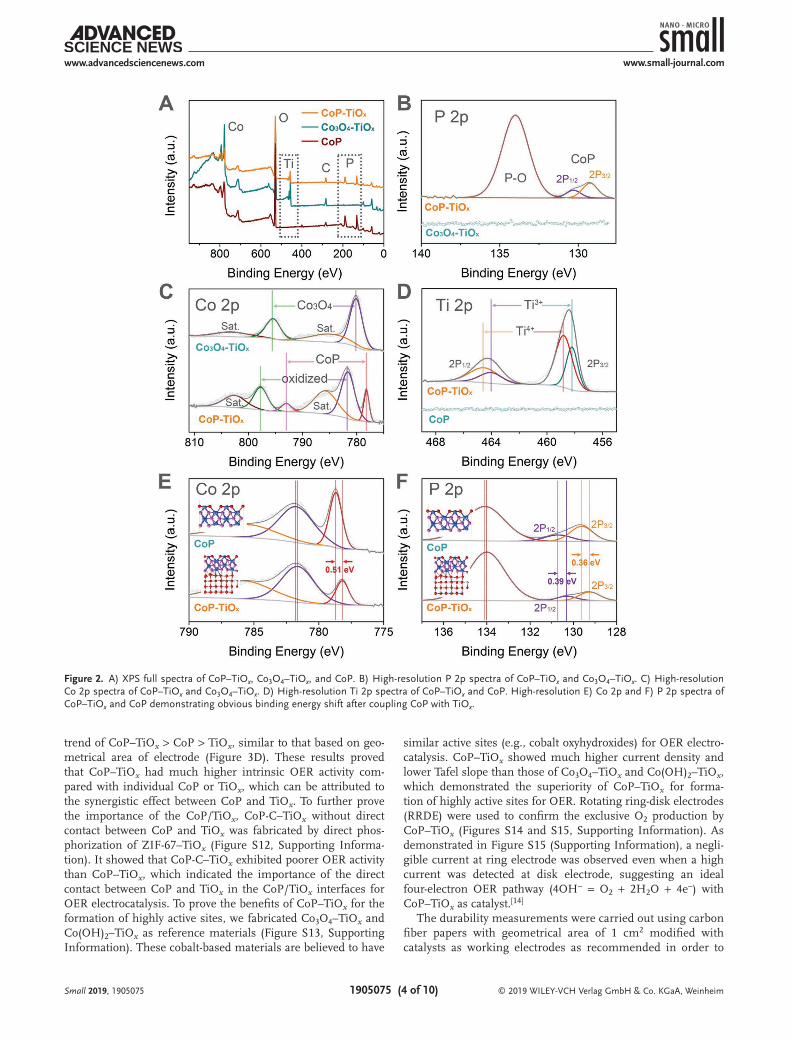
The existence of Co, P, Ti, O, and impurity C in CoP–TiOx were confirmed by the XPS full spectrum, while those of Co3O4–TiOx and CoP showed the absence of P and Ti, respectively (Figure 2A). In high resolution P 2p spectrum of CoP–TiOx, two peaks at 130.3 and 129.3 eV can be resolved, which can be assigned to P 2p1/2 and P 2p3/2 of CoP, respec-tively, along with a peak at 134.0 eV originated from oxidized phosphorus species (Figure 2B).[11] High-resolution Co 2p spec-trum of CoP–TiOx consisted of peaks at 793.0 and 778.2 eV cor-responding to Co 2p1/2 and 2p3/2 of CoP, respectively, as well as
peaks at 797.7 and 781.6 eV with two shakeup satellite peaks assigned to oxidized cobalt species (Figure 2C).[4a,12] In con-trast, the high-resolution Co 2p spectrum of Co3O4–TiOx only showed peaks of Co3O4. In high-resolution Ti 2p spectrum, characteristic peaks for both Ti4+ (464.5 and 458.8 eV) and Ti3+ (464.0 and 458.2 eV) were observed, confirming the existence of abundant Ti3+ sites in the TiOx shells (Figure 2D).[10c] It has been reported that the existence of Ti3+ sites in TiOx can greatly increase the charge carriers and the electrical conductivity.[13] In this regard, the TiOx shells of CoP–TiOx with abundant Ti3+ sites was expected to serve as conductive substrates to facili-tate the electron transport, leading to enhanced electrocatalytic OER performance. Interestingly, the high-resolution Co 2p and P 2p spectra exhibited that the CoP peaks of CoP–TiOx had obvious binding energy shifts compared with CoP, indicating a charge transfer and strong interaction between CoP and TiOx (Figure 2E,F). Specifically, the Co 2p peaks exhibited a negative binding energy shift of 0.51 eV and the P 2p peaks also had negative shifts of 0.39 and 0.36 eV for P 2p1/2 and P 2p3/2 peaks, respectively. The charge transfer and strong interaction between CoP and TiOx are expected to modify the electronic structure of the active sites and promote the OER electrocatalytic kinetics.
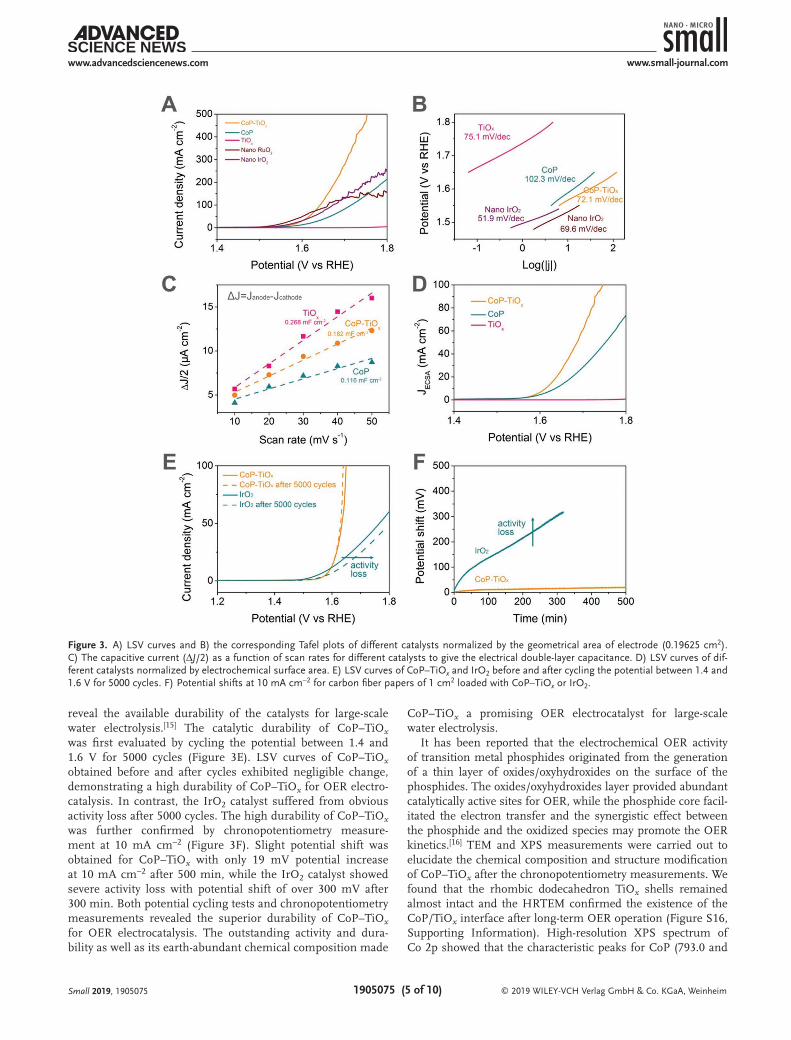
Electrocatalytic OER experiments were carried out in a three-electrode configuration with 1 m KOH as electrolyte, and glassy carbon electrodes modified with catalysts (≈0.2 mg cm−2) were used as working electrodes. All the linear sweep voltam-metry (LSV) curves were corrected with 95% iR compensation (Figure S10, Supporting Information). RuO2 and IrO2 nano-particles were fabricated as reference materials to evaluate the OER performance of the samples (Figure S11, Supporting Information). The LSV curves normalized by the geometrical area of electrode (0.19625 cm2) of different materials tested at a rotation rate of 1600 rpm were illustrated in Figure 3A. A dra-matically increased anodic current density with onset potential of 1.50 V was observed for CoP–TiOx, which was lower than those of CoP (1.52 V) and TiOx (1.66 V), demonstrating a much enhanced electrocatalytic OER performance of CoP–TiOx com-pared with the individual CoP and TiOx. In addition to onset potential, overpotential at 10 mA cm−2 can be obtained from the LSV curves as well. CoP–TiOx had an overpotential of 337 mV at 10 mA cm−2, which was lower than those of CoP and TiOx, and was comparable to those of the state-of-the-art IrO2 and RuO2 catalysts. The catalytic kinetics of the catalysts was revealed by Tafel plots (Figure 3B). The Tafel plots showed that CoP–TiOx has a Tafel slope of 72.1 mV decade−1, which was much smaller than those of CoP and TiOx and was com-parable to those of the IrO2 and RuO2 catalysts, indicating superior OER catalytic kinetics for CoP–TiOx. To minimize the influence of the different electrochemical surface area (ECSA) and to further compare the intrinsic OER activity of CoP–TiOx, CoP, and TiOx, their LSV curves were normalized by their ECSA. The ECSA was estimated by cycling the pre-pared electrodes in the non-Faradaic potential regions to get the electrical double-layer capacitances (Cdl) (Figure 3C). It showed that TiOx had higher Cdl than that of CoP because of the porous nature of TiOx, while their composites CoP–TiOx exhibited a middle Cdl value. LSV curves of the samples were then normalized by ECSA based on the obtained Cdl values (see the Experimental Section). It demonstrated a OER activity
Small 2019, 1905075
1905075 (4 of 10)
www.advancedsciencenews.com
© 2019 WILEY-VCH Verlag GmbH & Co. KGaA, Weinheim
www.small-journal.com
trend of CoP–TiOx > CoP > TiOx, similar to that based on geo-metrical area of electrode (Figure 3D). These results proved that CoP–TiOx had much higher intrinsic OER activity com-pared with individual CoP or TiOx, which can be attributed to the synergistic effect between CoP and TiOx. To further prove the importance of the CoP/TiOx, CoP-C–TiOx without direct contact between CoP and TiOx was fabricated by direct phos-phorization of ZIF-67–TiOx (Figure S12, Supporting Informa-tion). It showed that CoP-C–TiOx exhibited poorer OER activity than CoP–TiOx, which indicated the importance of the direct contact between CoP and TiOx in the CoP/TiOx interfaces for OER electrocatalysis. To prove the benefits of CoP–TiOx for the formation of highly active sites, we fabricated Co3O4–TiOx and Co(OH)2–TiOx as reference materials (Figure S13, Supporting Information). These cobalt-based materials are believed to have
similar active sites (e.g., cobalt oxyhydroxides) for OER electro-catalysis. CoP–TiOx showed much higher current density and lower Tafel slope than those of Co3O4–TiOx and Co(OH)2–TiOx, which demonstrated the superiority of CoP–TiOx for forma-tion of highly active sites for OER. Rotating ring-disk electrodes (RRDE) were used to confirm the exclusive O2 production by CoP–TiOx (Figures S14 and S15, Supporting Information). As demonstrated in Figure S15 (Supporting Information), a negli-gible current at ring electrode was observed even when a high current was detected at disk electrode, suggesting an ideal four-electron OER pathway (4OH− = O2 + 2H2O + 4e−) with CoP–TiOx as catalyst.[14]
The durability measurements were carried out using carbon fiber papers with geometrical area of 1 cm2 modified with catalysts as working electrodes as recommended in order to
Small 2019, 1905075
Figure 2. A) XPS full spectra of CoP–TiOx, Co3O4–TiOx, and CoP. B) High-resolution P 2p spectra of CoP–TiOx and Co3O4–TiOx. C) High-resolution Co 2p spectra of CoP–TiOx and Co3O4–TiOx. D) High-resolution Ti 2p spectra of CoP–TiOx and CoP. High-resolution E) Co 2p and F) P 2p spectra of CoP–TiOx and CoP demonstrating obvious binding energy shift after coupling CoP with TiOx.
1905075 (5 of 10)
www.advancedsciencenews.com
© 2019 WILEY-VCH Verlag GmbH & Co. KGaA, Weinheim
www.small-journal.com
reveal the available durability of the catalysts for large-scale water electrolysis.[15] The catalytic durability of CoP–TiOx was first evaluated by cycling the potential between 1.4 and 1.6 V for 5000 cycles (Figure 3E). LSV curves of CoP–TiOx obtained before and after cycles exhibited negligible change, demonstrating a high durability of CoP–TiOx for OER electro-catalysis. In contrast, the IrO2 catalyst suffered from obvious activity loss after 5000 cycles. The high durability of CoP–TiOx was further confirmed by chronopotentiometry measure-ment at 10 mA cm−2 (Figure 3F). Slight potential shift was obtained for CoP–TiOx with only 19 mV potential increase at 10 mA cm−2 after 500 min, while the IrO2 catalyst showed severe activity loss with potential shift of over 300 mV after 300 min. Both potential cycling tests and chronopotentiometry measurements revealed the superior durability of CoP–TiOx for OER electrocatalysis. The outstanding activity and dura-bility as well as its earth-abundant chemical composition made
CoP–TiOx a promising OER electrocatalyst for large-scale water electrolysis.
It has been reported that the electrochemical OER activity of transition metal phosphides originated from the generation of a thin layer of oxides/oxyhydroxides on the surface of the phosphides. The oxides/oxyhydroxides layer provided abundant catalytically active sites for OER, while the phosphide core facil-itated the electron transfer and the synergistic effect between the phosphide and the oxidized species may promote the OER kinetics.[16] TEM and XPS measurements were carried out to elucidate the chemical composition and structure modification of CoP–TiOx after the chronopotentiometry measurements. We found that the rhombic dodecahedron TiOx shells remained almost intact and the HRTEM confirmed the existence of the CoP/TiOx interface after long-term OER operation (Figure S16, Supporting Information). High-resolution XPS spectrum of Co 2p showed that the characteristic peaks for CoP (793.0 and
Small 2019, 1905075
Figure 3. A) LSV curves and B) the corresponding Tafel plots of different catalysts normalized by the geometrical area of electrode (0.19625 cm2). C) The capacitive current (ΔJ/2) as a function of scan rates for different catalysts to give the electrical double-layer capacitance. D) LSV curves of dif-ferent catalysts normalized by electrochemical surface area. E) LSV curves of CoP–TiOx and IrO2 before and after cycling the potential between 1.4 and 1.6 V for 5000 cycles. F) Potential shifts at 10 mA cm−2 for carbon fiber papers of 1 cm2 loaded with CoP–TiOx or IrO2.
1905075 (6 of 10)
www.advancedsciencenews.com
© 2019 WILEY-VCH Verlag GmbH & Co. KGaA, Weinheim
www.small-journal.com
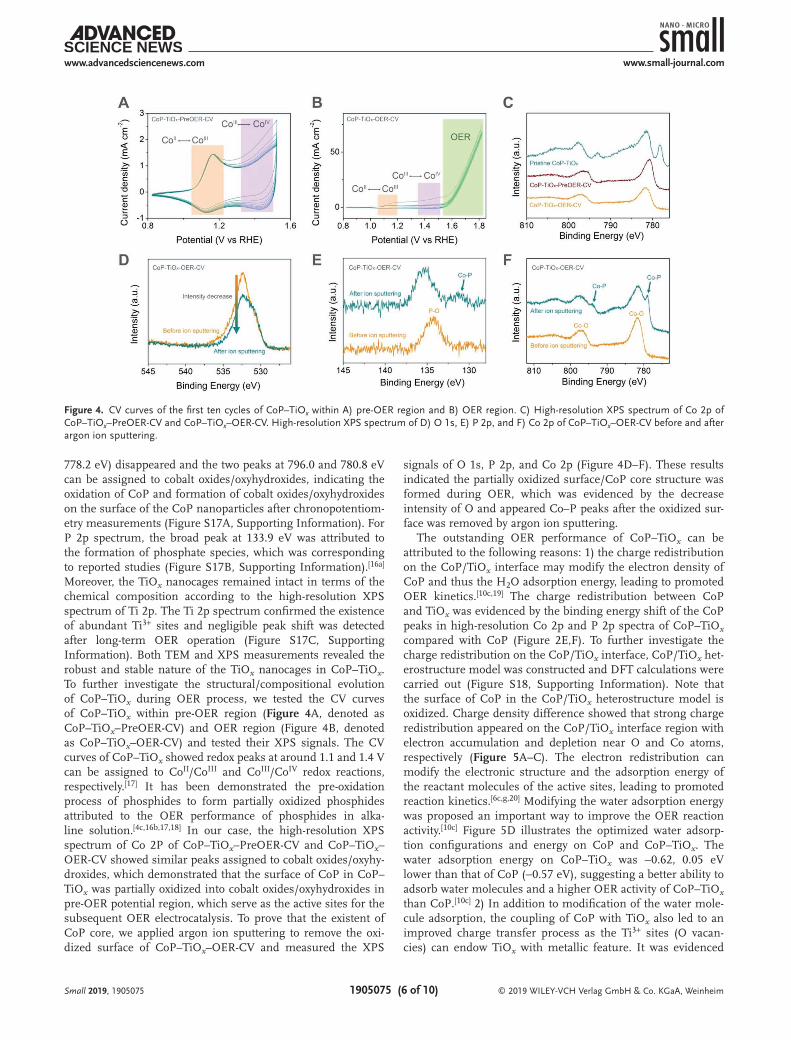
778.2 eV) disappeared and the two peaks at 796.0 and 780.8 eV can be assigned to cobalt oxides/oxyhydroxides, indicating the oxidation of CoP and formation of cobalt oxides/oxyhydroxides on the surface of the CoP nanoparticles after chronopotentiom-etry measurements (Figure S17A, Supporting Information). For P 2p spectrum, the broad peak at 133.9 eV was attributed to the formation of phosphate species, which was corresponding to reported studies (Figure S17B, Supporting Information).[16a] Moreover, the TiOx nanocages remained intact in terms of the chemical composition according to the high-resolution XPS spectrum of Ti 2p. The Ti 2p spectrum confirmed the existence of abundant Ti3+ sites and negligible peak shift was detected after long-term OER operation (Figure S17C, Supporting Information). Both TEM and XPS measurements revealed the robust and stable nature of the TiOx nanocages in CoP–TiOx. To further investigate the structural/compositional evolution of CoP–TiOx during OER process, we tested the CV curves of CoP–TiOx within pre-OER region (Figure 4A, denoted as CoP–TiOx–PreOER-CV) and OER region (Figure 4B, denoted as CoP–TiOx–OER-CV) and tested their XPS signals. The CV curves of CoP–TiOx showed redox peaks at around 1.1 and 1.4 V can be assigned to CoII/CoIII and CoIII/CoIV redox reactions, respectively.[17] It has been demonstrated the pre-oxidation process of phosphides to form partially oxidized phosphides attributed to the OER performance of phosphides in alka-line solution.[4c,16b,17,18] In our case, the high-resolution XPS spectrum of Co 2P of CoP–TiOx–PreOER-CV and CoP–TiOx–OER-CV showed similar peaks assigned to cobalt oxides/oxyhy-droxides, which demonstrated that the surface of CoP in CoP–TiOx was partially oxidized into cobalt oxides/oxyhydroxides in pre-OER potential region, which serve as the active sites for the subsequent OER electrocatalysis. To prove that the existent of CoP core, we applied argon ion sputtering to remove the oxi-dized surface of CoP–TiOx–OER-CV and measured the XPS
signals of O 1s, P 2p, and Co 2p (Figure 4D–F). These results indicated the partially oxidized surface/CoP core structure was formed during OER, which was evidenced by the decrease intensity of O and appeared Co–P peaks after the oxidized sur-face was removed by argon ion sputtering.
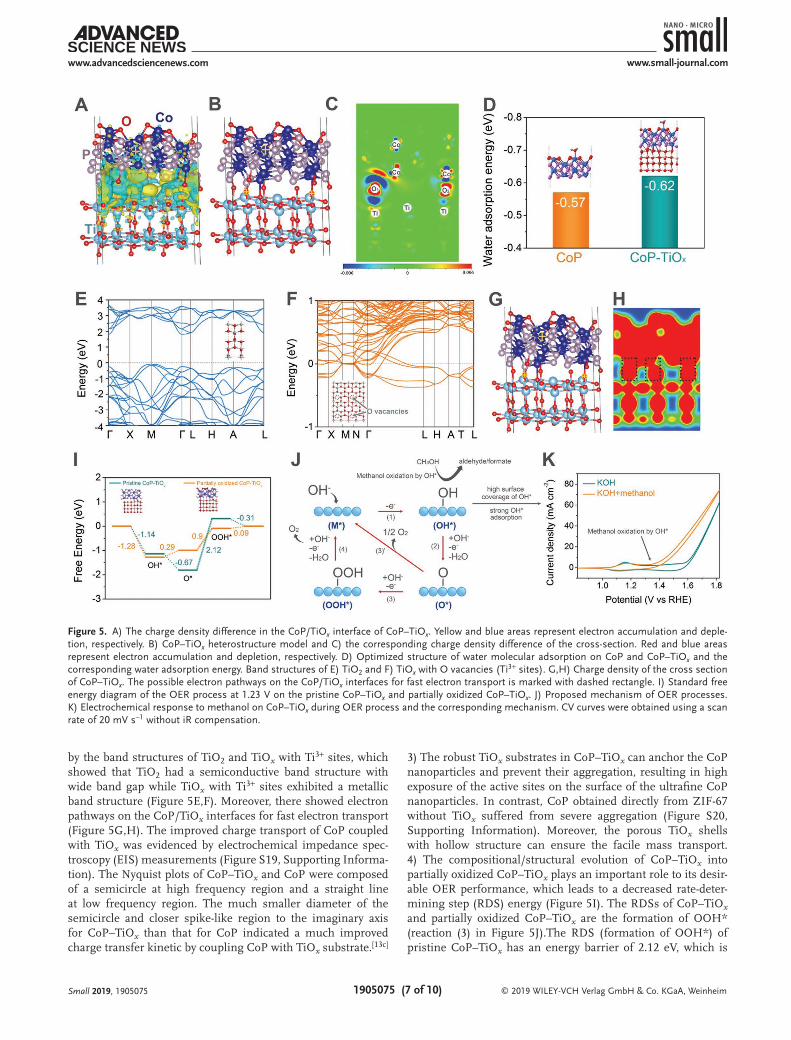
The outstanding OER performance of CoP–TiOx can be attributed to the following reasons: 1) the charge redistribution on the CoP/TiOx interface may modify the electron density of CoP and thus the H2O adsorption energy, leading to promoted OER kinetics.[10c,19] The charge redistribution between CoP and TiOx was evidenced by the binding energy shift of the CoP peaks in high-resolution Co 2p and P 2p spectra of CoP–TiOx compared with CoP (Figure 2E,F). To further investigate the charge redistribution on the CoP/TiOx interface, CoP/TiOx het-erostructure model was constructed and DFT calculations were carried out (Figure S18, Supporting Information). Note that the surface of CoP in the CoP/TiOx heterostructure model is oxidized. Charge density difference showed that strong charge redistribution appeared on the CoP/TiOx interface region with electron accumulation and depletion near O and Co atoms, respectively (Figure 5A–C). The electron redistribution can modify the electronic structure and the adsorption energy of the reactant molecules of the active sites, leading to promoted reaction kinetics.[6c,g,20] Modifying the water adsorption energy was proposed an important way to improve the OER reaction activity.[10c] Figure 5D illustrates the optimized water adsorp-tion configurations and energy on CoP and CoP–TiOx. The water adsorption energy on CoP–TiOx was −0.62, 0.05 eV lower than that of CoP (−0.57 eV), suggesting a better ability to adsorb water molecules and a higher OER activity of CoP–TiOx than CoP.[10c] 2) In addition to modification of the water mole-cule adsorption, the coupling of CoP with TiOx also led to an improved charge transfer process as the Ti3+ sites (O vacan-cies) can endow TiOx with metallic feature. It was evidenced
Small 2019, 1905075
Figure 4. CV curves of the first ten cycles of CoP–TiOx within A) pre-OER region and B) OER region. C) High-resolution XPS spectrum of Co 2p of CoP–TiOx–PreOER-CV and CoP–TiOx–OER-CV. High-resolution XPS spectrum of D) O 1s, E) P 2p, and F) Co 2p of CoP–TiOx–OER-CV before and after argon ion sputtering.
1905075 (7 of 10)
www.advancedsciencenews.com
© 2019 WILEY-VCH Verlag GmbH & Co. KGaA, Weinheim
www.small-journal.com
by the band structures of TiO2 and TiOx with Ti3+ sites, which showed that TiO2 had a semiconductive band structure with wide band gap while TiOx with Ti3+ sites exhibited a metallic band structure (Figure 5E,F). Moreover, there showed electron pathways on the CoP/TiOx interfaces for fast electron transport (Figure 5G,H). The improved charge transport of CoP coupled with TiOx was evidenced by electrochemical impedance spec-troscopy (EIS) measurements (Figure S19, Supporting Informa-tion). The Nyquist plots of CoP–TiOx and CoP were composed of a semicircle at high frequency region and a straight line at low frequency region. The much smaller diameter of the semicircle and closer spike-like region to the imaginary axis for CoP–TiOx than that for CoP indicated a much improved charge transfer kinetic by coupling CoP with TiOx substrate.[13c]
3) The robust TiOx substrates in CoP–TiOx can anchor the CoP nanoparticles and prevent their aggregation, resulting in high exposure of the active sites on the surface of the ultrafine CoP nanoparticles. In contrast, CoP obtained directly from ZIF-67 without TiOx suffered from severe aggregation (Figure S20, Supporting Information). Moreover, the porous TiOx shells with hollow structure can ensure the facile mass transport. 4) The compositional/structural evolution of CoP–TiOx into partially oxidized CoP–TiOx plays an important role to its desir-able OER performance, which leads to a decreased rate-deter-mining step (RDS) energy (Figure 5I). The RDSs of CoP–TiOx and partially oxidized CoP–TiOx are the formation of OOH* (reaction (3) in Figure 5J).The RDS (formation of OOH*) of pristine CoP–TiOx has an energy barrier of 2.12 eV, which is
Small 2019, 1905075
Figure 5. A) The charge density difference in the CoP/TiOx interface of CoP–TiOx. Yellow and blue areas represent electron accumulation and deple-tion, respectively. B) CoP–TiOx heterostructure model and C) the corresponding charge density difference of the cross-section. Red and blue areas represent electron accumulation and depletion, respectively. D) Optimized structure of water molecular adsorption on CoP and CoP–TiOx and the corresponding water adsorption energy. Band structures of E) TiO2 and F) TiOx with O vacancies (Ti3+ sites). G,H) Charge density of the cross section of CoP–TiOx. The possible electron pathways on the CoP/TiOx interfaces for fast electron transport is marked with dashed rectangle. I) Standard free energy diagram of the OER process at 1.23 V on the pristine CoP–TiOx and partially oxidized CoP–TiOx. J) Proposed mechanism of OER processes. K) Electrochemical response to methanol on CoP–TiOx during OER process and the corresponding mechanism. CV curves were obtained using a scan rate of 20 mV s−1 without iR compensation.
1905075 (8 of 10)
www.advancedsciencenews.com
© 2019 WILEY-VCH Verlag GmbH & Co. KGaA, Weinheim
www.small-journal.com
Small 2019, 1905075
reduced to 0.9 eV after compositional/structural evolution of CoP–TiOx into partially oxidized CoP–TiOx. We applied a methanol-assistant method to in situ probe OER intermediates of CoP–TiOx during OER process according to a reported work (Figure 5K).[21] It was showed that after addition of methanol in KOH, a distinct oxidation current can be detected around the onset potential of OER, which can be attributed to the methanol oxidation by the OER intermediate OH*. The large methanol oxidation current indicated that CoP–TiOx had a high surface coverage of OH* and thus the OER kinetics on CoP–TiOx were limited by formation of O* (reaction (2)) or OOH* (reaction (3)). These results are consistent with the cal-culated results by DFT.
We also demonstrated the universality of the presented MOF-templated method was universal and can be applied to fabricate other phosphide/TiOx heterostructures (Figures S21 and S22, Supporting Information).
3. Conclusion
In summary, CoP–TiOx hybrid material with CoP/TiOx hetero-structure was fabricated using MOF nanocrystals as templates for efficient and durable OER electrocatalysis. The utilization of well-defined MOF nanocrystals leads to unique TiOx hollow nanocage structures and uniform distribution of CoP nano-particles. The introduction of the TiOx hollow nanocages with abundant Ti3+ sites can not only prevent the aggregation of CoP nanoparticles, but also facilitate the electron transfer and mass transport. Moreover, the existence of abundant CoP/TiOx inter-face in the resultant composite CoP–TiOx greatly promoted the charge transport and modified the electron density of CoP for more efficient OER electrocatalysis. We believe this work will offer new design idea and provide a new route for the fabrica-tions of efficient and durable electrocatalysts for OER electroca-talysis and many other electrochemical applications.
4. Experimental SectionSynthesis of ZIF-67: ZIF-67 nanocrystals with a particle size of
≈300 nm were synthesized through a coprecipitation method reported by the group of this work.[7] Typically, 1.436 g of Co(NO3)2·6H2O was dissolved into 100 mL of methanol to form solution A, while 3.244 g of 2-methylimidazole was dissolved into another 100 mL of methanol to form solution B. Then, solution A was poured into solution B under vigorous stir. The resultant mixture was kept stirred for 12 min and then kept standing for 24 h. Afterward, the ZIF-67 nanocrystals were separated by centrifugation and washed with ethanol for at least three times, followed by drying at 80 °C for 12 h.
Synthesis of ZIF-67–TiOx: The ZIF-67 nanocrystals were coated with thin TiOx shells using titanium butoxide as TiOx source. Typically, 120 mg of the as-prepared ZIF-67 nanocrystals was dispersed into 60 mL of ethanol containing 0.3 mL of water through sonication. Afterward, 6 mL of ethanol containing 0.125 mL of titanium butoxide was added into the ZIF-67 suspension dropwise under vigorous stirring. The resulting mixture was heated to 80 °C and was kept for 90 min. Then the ZIF-67–TiOx was separated by centrifugation and washed with ethanol for three times, followed by drying at 80 °C for 12 h.
Synthesis of Co3O4–TiOx: Co3O4–TiOx was obtained by pyrolysis of ZIF-67–TiOx at 400 °C (1 °C min−1 ramping up to 400 °C) for 1 min in air.
Synthesis of CoP–TiOx: CoP–TiOx was obtained by phosphorization of Co3O4–TiOx using NaH2PO2 as phosphorus source. Typically, 10 mg of the Co3O4–TiOx powder was put into a small crucible, which was then put into a big crucible containing 100 mg of NaH2PO2·H2O. The big crucible containing the small crucible was placed in a furnace and was kept at 350 °C (2 °C min−1 ramping up to 350 °C) for 2 h, and the final product CoP–TiOx was obtained.
Synthesis of Co3O4 and CoP from ZIF-67 without TiOx Shell: For comparison, Co3O4 and CoP were synthesized from ZIF-67 without TiOx shells. To synthesize Co3O4, ZIF-67 nanocrystals were pyrolyzed at 400 °C (1 °C min−1 ramping up to 400 °C) for 1 min in air and Co3O4 was obtained. CoP was obtained by phosphorization of the as-prepared Co3O4: 10 mg of the Co3O4 powder was put into a small crucible, which was then put into a big crucible containing 100 mg of NaH2PO2·H2O. The big crucible containing the small crucible was placed in a furnace and was kept at 350 °C (2 °C min−1 ramping up to 350 °C) for 2 h, and the CoP was obtained.
Synthesis of Co(OH)2–TiOx: For comparison Co(OH)2–TiOx hybrid material was fabricated using ZIF–TiOx as precursor. Typically, 10 mg of ZIF–TiOx was dispersed into 10 mL of ethanol by sonication. Afterward, 5 mL of Co(NO3)2·6H2O ethanol solution (40 mg mL−1) was injected into the ZIF–TiOx suspension. The mixture was then sealed into 20 mL Teflon-lined autoclave. The reaction was carried out at 120 °C for 4 h (5 °C min−1 ramping up to 120 °C). The resultant pink powder was separated by centrifugation and washed with ethanol for three times and dried at 80 °C overnight to obtain the final Co(OH)2–TiOx product.
Synthesis of RuO2 Nanoparticles: To fabricate RuO2 nanoparticles as reference material to compare OER performance, Ru nanoparticles were first fabricated with a modified previously reported method.[22] Then, the Ru nanoparticles were placed in a crucible was kept in a furnace at 500 °C (5 °C min−1 ramping up to 500 °C) for 12 h to obtain RuO2 nanoparticles.
Synthesis of IrO2 Nanoparticles: IrO2 nanoparticles were fabricated as reference material to compare OER performance according to a reported work.[23]
Synthesis of MIL-88B-NH2: MIL-88B-NH2 rod-like nanocrystals were synthesized through a modified method reported previously.[24] Typically, 0.96 g of F127 was dissolved into 80 mL of water and 10 mL of 0.4 m FeCl3 solution was injected into the F127 solution. The resulting solution was kept stirring for 2 h. Afterward, 1.8 mL of CH3COOH was injected and the solution was kept stirring for another 2 h. The 0.36 g of 2-aminoterephthalic acid was added and the solution was kept stirring for additional 2 h. The resulting mixture was sealed into Teflon-lined autoclave and was kept at 110 °C for 24 h. The resulting MIL-88B-NH2 powder was centrifugated and washed by ethanol for three times.
Synthesis of Ni-BTC: Ni-BTC sphere-like nanocrystals were synthesized through a previously reported method.[25] Typically, 108 mg of Ni(acac)2, 33.6 mg of H3BTC, and 200 mg of PVP were dissolved into a mixture solution (32 mL of DMF and 20 mL of ethyl glycol), which were then sealed in a 100 mL Teflon-lined autoclave and kept at 180 °C for 3 h. The resulting Ni-BTC powder was centrifugated and washed by ethanol for three times.
Synthesis of MIL-88B-NH2–TiOx and Ni-BTC–TiOx: The MOF (MIL-88B-NH2 and Ni-BTC) nanocrystals were coated with thin TiOx shells using titanium butoxide as TiOx source. Typically, 120 mg of the as-prepared MOF nanocrystals were dispersed into 60 mL of ethanol containing 0.3 mL of water through sonication. Afterward, 6 mL of ethanol containing 0.125 mL of titanium butoxide was added into the MOF suspension dropwise under vigorous stirring. The resulting mixture was heated to 80 °C and was kept for 90 min. Then, the MOF–TiOx was separated by centrifugation and washed with ethanol for three times, followed by drying at 80 °C for 12 h.
Synthesis of Ni2P–TiOx and FeP–TiOx: Ni2P–TiOx was synthesized using a similar method except that Ni-BTC–TiOx rather than ZIF-67–TiOx was used as precursor. For FeP–TiOx, MIL-88B-NH2–TiOx was used as precursor and the phosphorization temperature was 500 °C.
Characterization: XRD patterns were measured by Rigaku Corporation SmartLab 9 kW at 45 kV and 200 mA using Cu Kα radiation. SEM
1905075 (9 of 10)
www.advancedsciencenews.com
© 2019 WILEY-VCH Verlag GmbH & Co. KGaA, Weinheim
www.small-journal.com
Small 2019, 1905075
images were obtained on a Hitachi S-4800 microscope. TEM images were obtained using a transmission electron microscope (Hitachi, H-9000NAR). HRTEM was measured using an FEI Tecnai F30 microscope. XPS was measured by X-ray photoelectron spectroscopy (XPS, Axis Ultra, Kratos Analytical, Japan) with monochromatic aluminum Kα as source of X-ray.
Electrochemical Measurements: The electrochemical measurements were carried out on a CHI 760E electrochemical workstation using a standard three-electrode system with catalyst-modified glassy carbon electrode, KCl saturated Ag/AgCl electrode, and Pt foil as working electrode, reference electrode, and counter electrode, respectively. 1 m KOH saturated with O2 was used as electrolyte. To prepare catalyst-modified glassy carbon electrode, 2 mg of catalyst was dispersed into 1 mL of ethanol containing 10 µL of 5 wt% Nafion by sonication for a least 1 h, and 20 µL of the resulting ink was then loaded on the glassy carbon electrode with diameter of 5 mm (catalyst loading of ≈0.2 mg cm−2). The potentials in this paper is referred to reversible hydrogen electrode (RHE) using ERHE = EAg/AgCl + 0.197 V + 0.059 pH. The LSV curves were obtained at scan rate of 5 mV s−1. For RRDE measurements, RRDE with glassy carbon disk and Pt ring (PINE E6 RRDE) was used. For durability tests, carbon fiber paper with geometrical area of 1 cm2 was used to support the catalysts as recommended in order to reveal the available durability of the catalysts for large-scale water electrolysis.
For electrochemical surface area (ECSA) normalized current density, ESCA was estimated by measuring the electrical double-layer capacitance (Cdl).[26] Cdl was obtained according to the equation
ν= ∆2dlC
J
(1)
where ΔJ is equal to Janode minus Jcathode, and ν is the potential scan rate. ΔJ and ν were obtained by cycling the electrodes in the non-Faradaic potential regions (−0.7 to −0.3 V vs KCl-saturated Ag/AgCl) in nitrogen-saturated 1 m KOH in order to minimize the oxygen reduction reaction. Because of the linear slopes, the Cdl values can be estimated by the slopes in Figure 3C. Then, the roughness factor was calculated by the equation
=ECSA dl
s
CC
(2)
where Cs is the specific capacitance of electrode with smooth planar surface. Cs of 0.040 mF cm−2 was used according to the reported literatures.[27] Then, the current densities of the samples were normalized by ECSA value according to the equation (Figure 3D)
=ECSAECSAJ
J
(3)
where J is the current density based on geometrical surface area of the electrode (0.19625 cm2).
Theoretical Calculations: All calculations were performed based on density functional theory (DFT) implemented in the Vienna Ab Initio Simulation Package (VASP).[28] The projector augmented wave (PAW) method[29] was used to treat the interactions between ion cores and valence electrons. The exchange-correlation potential was incorporated by using the generalized gradient approximation (GGA) in the Perdew–Burke–Ernzerhof (PBE) form.[30] Plane waves with a kinetic energy cutoff of 400 eV were used to expand valance electron wavefunctions. Monkhorst–Pack k-meshs[31] of 10 × 10 × 4 for TiO2 unit cell, 2 × 10 × 2 for TiO2 supercell (4 × 2 × 1) and 2 × 3 × 1 for CoP/ TiO2 heterostructure, and CoP slab were used. All studied structures were fully relaxed until the energy and force on each atom were less than 0.0001 eV and 0.01 eV Å−1, respectively.
In order to study the charge redistribution on the CoP/TiOx interface, a 2D CoP–TiO2 heterostructure was constructed, and then one O atom was removed from the CoP/TiO2 heterostructure to mimic the CoP/TiOx interface with defects. The details are given in Figure S13 (Supporting
Information). The vacuum space of 12 Å in the z-direction was set to prevent the interaction between the periodic images. The adsorption energy of H2O molecule on the surfaces was calculated by using the below equation
= − −−ads * O * O2 2E E E EH H (4)
where −* O2E H is the total energy of the CoP slab or the CoP–TiOx
heterostructure with H2O molecule adsorbed on the Co site, E* is the total energy of the CoP slab or the CoP/ TiOx heterostructure, and H O2
E is the total energy of an isolated H2O.
Supporting InformationSupporting Information is available from the Wiley Online Library or from the author.
AcknowledgementsZ.L. and W.Z. contributed equally to this work. This work was financially supported by the Natural Science Foundation of China (518205201), the National Key Research and Development Program of China (2017YFA0206701), National Program for Support of Top-Notch Young Professionals, and Changjiang Scholar Program.
Conflict of InterestThe authors declare no conflict of interest.
Keywordscobalt phosphide, heterostructures, oxygen evolution reaction, synergistic effect, titanium oxide
Received: September 5, 2019Revised: October 29, 2019
Published online:
[1] a) M. Tahir, L. Pan, F. Idrees, X. Zhang, L. Wang, J.-J. Zou, Z. L. Wang, Nano Energy 2017, 37, 136; b) Z.-F. Huang, J. Song, Y. Du, S. Xi, S. Dou, J. M. V. Nsanzimana, C. Wang, Z. J. Xu, X. Wang, Nat. Energy 2019, 4, 329; c) N.-T. Suen, S.-F. Hung, Q. Quan, N. Zhang, Y.-J. Xu, H. M. Chen, Chem. Soc. Rev. 2017, 46, 337; d) Z. Liang, W. Guo, R. Zhao, T. Qiu, H. Tabassum, R. Zou, Nano Energy 2019, 64, 103917.
[2] a) I. Roger, M. A. Shipman, M. D. Symes, Nat. Rev. Chem. 2017, 1, 0003; b) T. Qiu, Z. Liang, W. Guo, S. Gao, C. Qu, H. Tabassum, H. Zhang, B. Zhu, R. Zou, Y. Shao-Horn, Nano Energy 2019, 58, 1.
[3] a) Z. Liang, R. Zhao, T. Qiu, R. Zou, Q. Xu, EnergyChem 2019, 1, 100001; b) F. Lu, M. Zhou, Y. Zhou, X. Zeng, Small 2017, 13, 1701931; c) J. Nai, H. Yin, T. You, L. Zheng, J. Zhang, P. Wang, Z. Jin, Y. Tian, J. Liu, Z. Tang, L. Guo, Adv. Energy Mater. 2015, 5, 1401880; d) W. Zhou, L. Guo, Chem. Soc. Rev. 2015, 44, 6697.
[4] a) X. Xiao, C.-T. He, S. Zhao, J. Li, W. Lin, Z. Yuan, Q. Zhang, S. Wang, L. Dai, D. Yu, Energy Environ. Sci. 2017, 10, 893; b) W. Li, X. Gao, D. Xiong, F. Xia, J. Liu, W.-G. Song, J. Xu, S. M. Thalluri, M. F. Cerqueira, X. Fu, L. Liu, Chem. Sci. 2017, 8, 2952; c) D. Li, H. Baydoun, C. N. Verani, S. L. Brock, J. Am. Chem. Soc. 2016, 138, 4006.

1905075 (10 of 10)
www.advancedsciencenews.com
© 2019 WILEY-VCH Verlag GmbH & Co. KGaA, Weinheim
www.small-journal.com
Small 2019, 1905075
[5] a) K. Xu, H. Cheng, L. Liu, H. Lv, X. Wu, C. Wu, Y. Xie, Nano Lett. 2017, 17, 578; b) M. Liu, J. Li, ACS Appl. Mater. Interfaces 2016, 8, 2158.
[6] a) C. G. Morales-Guio, E. R. Cave, S. A. Nitopi, J. T. Feaster, L. Wang, K. P. Kuhl, A. Jackson, N. C. Johnson, D. N. Abram, T. Hatsukade, C. Hahn, T. F. Jaramillo, Nat. Catal. 2018, 1, 764; b) J. Lai, B. Huang, Y. Tang, F. Lin, P. Zhou, X. Chen, Y. Sun, F. Lv, S. Guo, Chem 2018, 4, 1153; c) L. An, Z. Zhang, J. Feng, F. Lv, Y. Li, R. Wang, M. Lu, R. B. Gupta, P. Xi, S. Zhang, J. Am. Chem. Soc. 2018, 140, 17624; d) J. Azadmanjiri, V. K. Srivastava, P. Kumar, M. Nikzad, J. Wang, A. Yu, J. Mater. Chem. A 2018, 6, 702; e) R. Subbaraman, D. Tripkovic, D. Strmcnik, K.-C. Chang, M. Uchimura, A. P. Paulikas, V. Stamenkovic, N. M. Markovic, Science 2011, 334, 1256; f) Z. Zhuang, Y. Li, Z. Li, F. Lv, Z. Lang, K. Zhao, L. Zhou, L. Moskaleva, S. Guo, L. Mai, Angew. Chem., Int. Ed. 2018, 57, 496; g) J. Xu, T. Liu, J. Li, B. Li, Y. Liu, B. Zhang, D. Xiong, I. Amorim, W. Li, L. Liu, Energy Environ. Sci. 2018, 11, 1819.
[7] W. Xia, J. Zhu, W. Guo, L. An, D. Xia, R. Zou, J. Mater. Chem. A 2014, 2, 11606.
[8] H. Yang, P. E. Kruger, S. G. Telfer, Inorg. Chem. 2015, 54, 9483.[9] W. Wang, M. Dahl, Y. Yin, Chem. Mater. 2013, 25, 1179.
[10] a) J. Lai, B. Huang, Y. Tang, F. Lin, P. Zhou, X. Chen, Y. Sun, F. Lv, S. Guo, Chem. 2018, 4, 1153; b) P. Wang, X. Zhang, J. Zhang, S. Wan, S. Guo, G. Lu, J. Yao, X. Huang, Nat. Commun. 2017, 8, 14580; c) Y. Zhao, X. Jia, G. Chen, L. Shang, G. I. N. Waterhouse, L.-Z. Wu, C.-H. Tung, D. O’Hare, T. Zhang, J. Am. Chem. Soc. 2016, 138, 6517; d) Z. H. Xue, H. Su, Q. Y. Yu, B. Zhang, H. H. Wang, X. H. Li, J. S. Chen, Adv. Energy Mater. 2017, 7, 1602355.
[11] a) X. Yu, S. Zhang, C. Li, C. Zhu, Y. Chen, P. Gao, L. Qi, X. Zhang, Nanoscale 2016, 8, 10902; b) H. Tabassum, W. Guo, W. Meng, A. Mahmood, R. Zhao, Q. Wang, R. Zou, Adv. Energy Mater. 2017, 7, 1601671; c) Z. Liang, C. Qu, W. Zhou, R. Zhao, H. Zhang, B. Zhu, W. Guo, W. Meng, Y. Wu, W. Aftab, Q. Wang, R. Zou, Adv. Sci.6, 2019, 1802005.
[12] Y. Liu, Y. Zhu, J. Shen, J. Huang, X. Yang, C. Li, Nanoscale 2018, 10, 2603.
[13] a) X. Lu, G. Wang, T. Zhai, M. Yu, J. Gan, Y. Tong, Y. Li, Nano Lett. 2012, 12, 1690; b) X. Lu, M. Yu, G. Wang, T. Zhai, S. Xie,
Y. Ling, Y. Tong, Y. Li, Adv. Mater. 2013, 25, 267; c) Q. Ke, C. Guan, X. Zhang, M. Zheng, Y. W. Zhang, Y. Cai, H. Zhang, J. Wang, Adv. Mater. 2017, 29, 1604164.
[14] S. Zhao, Y. Wang, J. Dong, C.-T. He, H. Yin, P. An, K. Zhao, X. Zhang, C. Gao, L. Zhang, J. Lv, J. Wang, J. Zhang, A. M. Khattak, N. A. Khan, Z. Wei, J. Zhang, S. Liu, H. Zhao, Z. Tang, Nat. Energy 2016, 1, 16184.
[15] S. Anantharaj, S. R. Ede, K. Karthick, S. Sam Sankar, K. Sangeetha, P. E. Karthik, S. Kundu, Energy Environ. Sci. 2018, 11, 744.
[16] a) Y. P. Zhu, Y. P. Liu, T. Z. Ren, Z. Y. Yuan, Adv. Funct. Mater. 2015, 25, 7337; b) L.-A. Stern, L. Feng, F. Song, X. Hu, Energy Environ. Sci. 2015, 8, 2347.
[17] G. Zhang, G. Wang, Y. Liu, H. Liu, J. Qu, J. Li, J. Am. Chem. Soc. 2016, 138, 14686.
[18] J. Ryu, N. Jung, J. H. Jang, H.-J. Kim, S. J. Yoo, ACS Catal. 2015, 5, 4066.
[19] Z. H. Xue, J. T. Han, W. J. Feng, Q. Y. Yu, X. H. Li, M. Antonietti, J. S. Chen, Angew. Chem. 2018, 130, 2727.
[20] Y. Liu, Q. Li, R. Si, G.-D. Li, W. Li, D.-P. Liu, D. Wang, L. Sun, Y. Zhang, X. Zou, Adv. Mater. 2017, 29, 1606200.
[21] H. B. Tao, Y. Xu, X. Huang, J. Chen, L. Pei, J. Zhang, J. G. Chen, B. Liu, Joule 2019, 3, 1498.
[22] J. Su, Y. Yang, G. Xia, J. Chen, P. Jiang, Q. Chen, Nat. Commun. 2017, 8, 14969.
[23] G. Li, S. Li, M. Xiao, J. Ge, C. Liu, W. Xing, Nanoscale 2017, 9, 9291.
[24] M.-H. Pham, G.-T. Vuong, A.-T. Vu, T.-O. Do, Langmuir 2011, 27, 15261.
[25] H. Yang, B. Wang, H. Li, B. Ni, K. Wang, Q. Zhang, X. Wang, Adv. Energy Mater. 2018, 8, 1801839.
[26] D. Voiry, M. Chhowalla, Y. Gogotsi, N. A. Kotov, Y. Li, R. M. Penner, R. E. Schaak, P. S. Weiss, ACS Nano 2018, 12, 9635.
[27] a) C. C. L. McCrory, S. Jung, J. C. Peters, T. F. Jaramillo, J. Am. Chem. Soc. 2013, 135, 16977; b) C. Luan, G. Liu, Y. Liu, L. Yu, Y. Wang, Y. Xiao, H. Qiao, X. Dai, X. Zhang, ACS Nano 2018, 12, 3875.
[28] G. Kresse, J. Furthmüller, Phys. Rev. B 1996, 54, 11169.[29] P. E. Blöchl, Phys. Rev. B 1994, 50, 17953.[30] J. P. Perdew, K. Burke, M. Ernzerhof, Phys. Rev. Lett. 1996, 77, 3865.[31] H. J. Monkhorst, J. D. Pack, Phys. Rev. B 1976, 13, 5188.
View publication statsView publication stats