Fabrication and Characterization of Silicon Carbide Epoxy ...
220
Clemson University TigerPrints All Dissertations Dissertations 5-2017 Fabrication and Characterization of Silicon Carbide Epoxy Composites James Townsend Clemson University, [email protected] Follow this and additional works at: hps://tigerprints.clemson.edu/all_dissertations is Dissertation is brought to you for free and open access by the Dissertations at TigerPrints. It has been accepted for inclusion in All Dissertations by an authorized administrator of TigerPrints. For more information, please contact [email protected]. Recommended Citation Townsend, James, "Fabrication and Characterization of Silicon Carbide Epoxy Composites" (2017). All Dissertations. 1948. hps://tigerprints.clemson.edu/all_dissertations/1948
Transcript of Fabrication and Characterization of Silicon Carbide Epoxy ...

Clemson UniversityTigerPrints
All Dissertations Dissertations
5-2017
Fabrication and Characterization of SiliconCarbide Epoxy CompositesJames TownsendClemson University, [email protected]
Follow this and additional works at: https://tigerprints.clemson.edu/all_dissertations
This Dissertation is brought to you for free and open access by the Dissertations at TigerPrints. It has been accepted for inclusion in All Dissertations byan authorized administrator of TigerPrints. For more information, please contact [email protected].
Recommended CitationTownsend, James, "Fabrication and Characterization of Silicon Carbide Epoxy Composites" (2017). All Dissertations. 1948.https://tigerprints.clemson.edu/all_dissertations/1948

FABRICATION AND CHARACTERIZATION OF
SILICON CARBIDE EPOXY COMPOSITES
______________________________________
A Dissertation
Presented to
the Graduate School of
Clemson University
______________________________________
In Partial Fulfilment
of the Requirement of the Degree
Doctor of Philosophy
Materials Science and Engineering
______________________________________
by
James Townsend
May 2017
______________________________________
Accepted by:
Dr. Igor Luzinov, Committee Chair
Dr. Olin Mefford
Dr. Marian Kennedy
Dr. Christopher Kitchens

ii
ABSTRACT
Nanoscale fillers can significantly enhance the performance of composites by
increasing the extent of filler-to-matrix interaction. Thus far, the embedding of
nanomaterials into composites has been achieved, but the directional arrangement has
proved to be a challenging task. Even with advances in in-situ and shear stress induced
orientation, these methods are both difficult to control and unreliable. Therefore, the
fabrication of nanomaterials with an ability to orient along a magnetic field is a promising
pathway to create highly controllable composite systems with precisely designed
characteristics. To this end, the goal of this dissertation is to develop magnetically active
nanoscale whiskers and study the effect of the whiskers orientation in a polymer matrix
on the nanocomposite’s behavior.
Namely, we report the surface modification of silicon carbide whiskers (SiCWs)
with magnetic nanoparticles and fabrication of SiC/epoxy composite materials. The
magnetic nanoparticles attachment to the SiCWs was accomplished using polyelectrolyte
polymer-to-polymer complexation. The “grafting to” and adsorption techniques were
used to attach the polyelectrolytes to the surface of the SiCWs and magnetic
nanoparticles. The anchored polyelectrolytes were polyacrylic acid (PAA) and poly(2-
vinylpyridine) (P2VP).
Next, the SiC/epoxy composites incorporating randomly oriented and
magnetically oriented whiskers were fabricated. The formation of the composite was
studied to determine the influence of the whiskers’ surface composition on the epoxy
curing reaction. After curing, the composites’ thermal and thermo-mechanical properties

iii
were studied. These properties were related to the dispersion and orientation of the fillers
in the composite samples. The obtained results indicated that the thermal and thermo-
mechanical properties could be improved by orienting magnetically-active SiCWs inside
the matrix.
Silanization, “grafting to”, adsorption, and complexation were used to modify the
surface of SiCWs to further investigate the epoxy nanocomposite system. The process of
composites formation was studied to evaluate the effects of the surface modification on
the epoxy curing reaction. The obtained composites were tested and analyzed to assess
their thermal and thermo-mechanical properties. These properties were related to the
dispersion and surface chemical composition of the fillers in the nanocomposites. It was
determined that magnetically modified SiCWs have lower ability for interfacial stress
transfer in the composite systems under consideration.
The final portion of this work was focused on reinforcing the magnetic layer of
the SiCWs. This was accomplished by structurally toughening the magnetic layer with
poly(glycidyl methacrylate) (PGMA) layer. As a result, the thermal and mechanical
properties of the magnetic composite system were improved significantly.

iv
DEDICATION
I dedicate this dissertation to my parents Jack and Helen Townsend. They have always
believed in me and pushed me to become the best version of myself. Their love has
always been the backbone of my success.
Thank you for your sacrifices and compassion throughout this journey, I love you more
than words can say.
I also dedicate this dissertation to my brothers Bear, Light, and Colin.
Without you, I would be lost in this world.

v
ACKNOWLEDGMENTS
First, I would like to acknowledge my advisor, Dr. Igor Luzinov, for giving me
this opportunity and for his mentorship. His patience, appreciation, empathy, support, and
laughter provided me with strength throughout my time here at Clemson University. I
will always remember his wise words.
Thank you to Drs. O. Thompson Mefford, Marian Kennedy, and Christopher
Kitchens for agreeing to serve on my committee. I am grateful for the time and effort
they have put into me and my research.
In addition, I am most appreciative of the time Dr. Ruslan Burtovyy has spent
mentoring me throughout these five years. I greatly appreciate his patience and helpful
suggestions with my research and life.
A debt of gratitude is owed to my friends Dr. Bradley Schultz and Benoit Faugas.
We have made some great memories and will make even more to come. Thank you for
making these some of the best years of my life.
My friends and group members, Michael Seeber, Yuri Galabura, James
Giammarco, Fehime Vatansever, Tugba Demir, Anna Paola Soliani, Mykhaylo Savchak,
Nickolay Borodinov, and Liying Wei, are acknowledged for their support and
encouragement. These years would have been dull without them.
I would also like to acknowledge Dr. Yu Gu and Pavel Aprelev for their guidance
and friendship. A special thanks to Dr. Kornev and Pavel for helping me with magnetic
measurements and improving my understanding of magnetic concepts.

vi
I owe my Sundays, and a part of my happiness here, to Mr. Bob Bowen. Thank
you for your kindness and laughter.
In kind, the Drs. Deborah and Gary Lickfield were very influential in my decision
to come back to Clemson after the death of my brother. Thank you for all the great
memories, kindness, and conversations.
A special thanks goes out to Ms. Kimberly Ivey for the support and affection she
has shown me throughout my years. She has always been there for me when I needed a
pick me up or a conversation. Thank you for all your mentorship and creativity.
Dr. Michael Ellison has also been a great friend and mentor. I deeply appreciate
those days out on the farm and your kindness.
I also would like to thank Dr. Taghi Darroudi, Mr. Donald Mulwee, and Mr.
Dayton Cash for their help at the Electron Microscopy Laboratory.
I thank everyone from Materials Science and Engineering from Clemson
University for making this a memorable experience.
And most importantly, I am very thankful for all my friends and family who have
been there to support, love, and encourage me throughout my life.

vii
TABLE OF CONTENTS
Page
TITLE PAGE ..................................................................................................................... i
ABSTRACT ....................................................................................................................... ii
DEDICATION....................................................................................................................v
ACKNOWLEDGMENTS .............................................................................................. vi
LIST OF FIGURES ....................................................................................................... xiii
LIST OF TABLES ...........................................................................................................xx
CHAPTER 1: INTRODUCTION .....................................................................................1
CHAPTER 2: LITERATURE REVIEW ........................................................................6
2.1: Epoxy Nanocomposite Materials .....................................................................6
2.1.1: Epoxy Thermoset Resins ..................................................................7
2.1.2: Silicon Carbide Whiskers ..................................................................9
2.1.3: Nickel Nanoparticles ........................................................................11
2.1.4 Iron Oxide Nanoparticles ..................................................................13
2.2: Surface Modification ......................................................................................14
2.2.1: Adsorption of PAA on Iron Oxides ................................................15
2.2.2: “Grafting to” Anchoring of Polymer Chains ..................................16
2.2.3: Polymer-to-Polymer Complexation .................................................17
2.3: Fabrication of Nanocomposites with Orientated Dispersed Phase .................19
2.3.1: The Theoretical Aspects of Magnetic Orientation ..........................20
2.3.2: Magnetic Orientation of Nanofiller .................................................22
2.4: Properties of Composites ................................................................................24
2.4.1: Predicting Composite’s Properties ..................................................24
2.4.2: Surface Effect and Compatibility ....................................................26
2.5: References .......................................................................................................28
CHAPTER 3: MODIFICATION OF SIC WHISKERS WITH NICKEL
NANOPARTICLES .........................................................................................................43
3.1: Introduction .....................................................................................................43
3.2: Experimental ...................................................................................................43
3.2.1: Synthesis of Nickel Nanoparticles ...................................................43
3.2.2: Modification of Model Nickel Surfaces with PGMA and
polyethylene glycol (PEG) ........................................................................45

viii
3.2.3: Modification of NiNPs with PGMA, PEG and PAA.......................45
3.2.4: Thermal Cleaning of SiCWs ............................................................46
3.2.5: Size Separation of SiCWs ................................................................49
3.2.6: “Grafting to” of PGMA and P2VP to Silicon Wafer Surface ..........50
3.2.7: “Grafting to” of PGMA and P2VP to SiCWs ..................................50
3.2.8: Modification of Silicon Wafer with Epoxy Silane and P2VP .........51
3.2.9: Modification of SiCWs with Epoxy Silane and P2VP ....................52
3.2.10: Modification of SiC Whiskers with Magnetic NiNPs ..................52
3.2.11: TGA Measurements .......................................................................53
3.2.12: Procedure for Calculation of Polymer Thickness from TGA Data53
3.2.13: TEM Imaging and of the Nanoparticles ........................................54
3.2.14: XRD Measurements .......................................................................54
3.2.15: Magnetic Measurements ................................................................54
3.3: Results and Discussion ...................................................................................55
3.3.1: Synthesis and Modification of NiNPs .............................................55
3.3.2: Modification of SiCWs ....................................................................61
3.3.3: Magnetic Modification of SiCWs with NiNPs ................................69
3.4: Conclusions .....................................................................................................71
3.5: References .......................................................................................................72
CHAPTER 4: MODIFICATION OF SICWs WITH IRON OXIDE
NANOPARTICLES .........................................................................................................75
4.1: Introduction .....................................................................................................75
4.2: Experimental ...................................................................................................76
4.2.1: Size Separation of Iron Oxide Nanoparticles .................................76
4.2.2: Surface Modification of Iron Oxide Nanoparticles ........................76
4.2.3: Fabrication of Magnetically Functionalized SiCWs ........................77
4.2.4: Magnetic Characterization ...............................................................78
4.2.5: Orientation of MagSiCWs in PEO Composite Film ........................80
4.3: Results and Discussion ...................................................................................81
4.3.1: Size of the MagNPs .........................................................................81
4.3.2: Modification of MagNPs with PAA ...............................................83
4.3.3: Modification of SiCWs with MagNPs ............................................86
4.3.4: Magnetic Characterization of the MagSiCWs .................................91
4.3.5: Study of Orientation of MagSiCWs in a PEO Matrix .....................92
4.4: Conclusions .....................................................................................................96
4.5: REFERENCES ...............................................................................................97
CHAPTER 5: ORIENTATION OF MAGNETICALLY MODIFIED SILICON
CARBIDE WHISKERS IN A CURING EPOXY MATRIX .......................................98
5.1: Introduction .....................................................................................................98
5.2: Experimental ...................................................................................................99

ix
5.2.1: Ball Drop Methodology ...................................................................99
5.2.2: Calibration of the Ball Drop Experiment .......................................100
5.2.3: Orientation of MagSiCWs in Epoxy at Low Concentration ..........102
5.3: Results and Discussion .................................................................................103
5.3.1: Epoxy Curing .................................................................................103
5.3.2: Modeling the Characteristic Time of Orientation ..........................105
5.3.3: Magnetic Orientation of MagSiCWs in a Curing Epoxy
Resin ........................................................................................................109
5.4: Conclusions ...................................................................................................111
5.5: References .....................................................................................................113
CHAPTER 6: FABRICATION AND STUDY OF MAGNETICALLY
ORIENTED SICW/EPOXY NANOCOMPOSITES ..................................................115
6.1: Introduction ...................................................................................................115
6.2: Experimental .................................................................................................116
6.2.1: Fabrication of the Composites .......................................................116
6.2.2: Curing Kinetics Monitored using DSC ..........................................117
6.2.3: Curing Kinetics Monitored using FTIR .........................................117
6.2.4: Determination of the Amount of Epoxy Grafted to MagSiCWs ...118
6.2.5: Orientation of MagSiCWs in Epoxy Resin....................................118
6.2.5: Thermo-Mechanical Characterization by DMA ............................119
6.2.6: Thermal Characterization using DSC ............................................119
6.2.7: Magnetic Characterization of the Composite Materials ................120
6.2.8: SEM Analysis of Composites’ Microstructure ..............................120
6.2.9: Determination of the Composites’ Cross-Linking Density ...........121
6.3: Results and Discussion .................................................................................122
6.3.1: Curing of Epoxy Resin in the Presence of MagSiCWs .................122
6.3.2: Grafting of Epoxy Polymer to MagSiCWs ....................................127
6.3.3: Magnetic Orientation Methods for MagSiCWs in the Epoxy
Resin ........................................................................................................129
6.3.4: Properties of the MagSiCW/Epoxy Composite Materials .............132
6.3.5: Composite Microstructure Analysis ..............................................143
6.4: Conclusions ...................................................................................................146
6.5: References .....................................................................................................148
CHAPTER 7: THE EFFECT OF INTERFACIAL MODIFICATION ON
SICW/EPOXY COMPOSITE FORMATION AND PROPERTIES ........................153
7.1: Introduction ...................................................................................................153
7.2: Experimental .................................................................................................155
7.2.1: Surface Modification .....................................................................155
7.2.2: Composite Fabrication ...................................................................156
7.2.3: Epoxy Curing Reaction ..................................................................156

x
7.2.4: Thermo-Mechanical Characterization using DMA .......................157
7.2.5: Thermal Characterization using DSC ............................................157
7.2.6: Composite Microstructure Analysis by SEM ................................157
7.2.7: Determination of the Composites’ Cross-Linking Density for
the Epoxy Matrix ....................................................................................158
7.3: Results and Discussion .................................................................................158
7.3.1: Curing of Epoxy Resin in the Presence of Modified SiCWs .........158
7.3.2: Properties of the SiCW/Epoxy Composites ...................................162
7.3.3: Composite Microstructure Analysis ..............................................166
7.4: Conclusions ...................................................................................................170
7.5: References .....................................................................................................172
CHAPTER 8: THE REINFORCEMENT OF MagSiCWs ........................................173
8.1: Introduction ...................................................................................................175
8.2: Experimental .................................................................................................176
8.2.1: Surface Modification of MagSiCWs with PGMA .........................176
8.2.2: TGA Measurements .......................................................................177
8.2.3: Fabrication of Epoxy Composites..................................................177
8.2.4: DMA Measurements ......................................................................177
8.2.5: DSC Measurements .......................................................................177
8.2.6: SEM Imaging .................................................................................178
8.3: Results and Discussion .................................................................................178
8.3.1: Identification of the Interphase ......................................................178
8.3.2: Reinforcement of the MagSiCWs’ Interphases .............................179
8.3.3: DMA Study of PGMA-MagSiCW/Epoxy Composites .................180
8.3.4: DSC Study of PGMA-MagSiCW/Epoxy Composites ..................182
8.3.5: Nanocomposites’ Microstructure ...................................................184
8.4: Conclusions ...................................................................................................186
8.5: References .....................................................................................................187
CHAPTER 9: CONCLUSIONS ...................................................................................188
CHAPTER 10: FUTURE WORK ................................................................................189
APPENDIX .........................................................................................................................
A: Materials and Instrumentation ...................................................................191

xi
LIST OF FIGURES
Figure 1.1: Diagram representation of the approach employed by this project: a) and
b) the selection and synthesis of nanoparticles and SiCWs; c) and d) surface
modification of the nanomaterials; e) the attachment of the nanoparticles to the
whiskers; f) fabrication of composites with oriented nanofillers.........................................2
Figure 2.1: Conceptual diagram of the thermoset formation. ..............................................8
Figure 2.2: The schematic representation of the reaction of the epoxy functional
group with hydroxyl and carboxylic functional groups. ......................................................8
Figure 2.3: The chemical structure of DGEBA ..................................................................9
Figure 2.4: The chemical structure of DDSA. ...................................................................9
Figure 2.5: Schematic representation of the possible bonding of PAA to the iron oxide
surface via (a) hydrogen bonding and (b) chelation. .........................................................16
Figure 2.6: The schematic representation of the “grafting to” technique using a) end-
terminated and b) functional groups methods. ...................................................................17
Figure 2.7: Structure of PAA-P2VP complexes depending on the association ratio
between carboxylic and pyridine groups a) 2:1 and b) 1:1 (reprinted with permission). ..18
Figure 2.8: Dependence of Tg on the composition of the complexes a) PAA/P4VP, b)
PAA/P2VP, c) PMMA/P4VP, and d) PMMA/P2VP (the straight line corresponds to
the calculated linear additive rule values) (reprinted with permission). ............................19
Figure 3.1: TGA of as-received SiCWs. ............................................................................47
Figure 3.2: TGA of thermally cleaned SiCWs ..................................................................48
Figure 3.3: SEM image of the thermally cleaned SiCWs .................................................48
Figure 3.4: The measured diameters of the synthesized NiNPs .......................................56
Figure 3.5: (a, b) SEM images, (c) XRD pattern and (d) magnetization curve of the S1
synthesized NiNPs. ............................................................................................................56
Figure 3.6: AFM topography image of the as deposited nickel film. The image size is
0.8x0.8 μm2. The vertical scale is 5 nm ............................................................................58

xii
Figure 3.7: AFM topography image of the grafted (a) PGMA and (b) PEG films on
the nickel substrate. The image size is 0.8x0.8 μm2. The vertical scale is (a) 5 nm and
(b) 20 nm. ...........................................................................................................................59
Figure 3.8: TEM images of NiNPs at various stages of the modification process: (a)
bare NiNPs, (b) PGMA-modified NiNPs, and (c) PEG-modified NiNPs. The scale bar
is 50 nm. .............................................................................................................................59
Figure 3.9: TEM image of NiNPs modified with PGMA and PAA. ................................60
Figure 3.10: AFM topography images of the grafted (a) PGMA and (b) P2VP. The
images size is 10x10 μm2. The vertical scale is (a) 25 nm and (b) 40 nm. (The craters
in the PGMA film are related to high humidity causing water condensation during the
film drying). .......................................................................................................................62
Figure 3.11: TEM images of a SiCW modified with the PGMA layer: (a) the end of a
SiCW (the film is barely visible); (b) the bridging of the PGMA layers between two
SiCWs ...............................................................................................................................63
Figure 3.12: TGA curve of PGMA-modified SiCWs .......................................................63
Figure 3.13: TEM image of a SiCW modified with carboxyl-terminated P2VP. ..............64
Figure 3.14: TGA curve for the P2VP-modified SiCWs ..................................................65
Figure 3.15: Additional TEM images of SiCWs modified with PGMA and P2VP .........66
Figure 3.16: AFM topography image of (a) the epoxy silane layer (1 x 1 μm2) and (b)
grafted P2VP polymer film (10 x 10 μm2). The vertical scale is 10 nm. ..........................67
Figure 3.17: TGA curve for the SiCWs modified with epoxy silane ...............................68
Figure 3.18: TGA curve for the SiCWs modified with P2VP via epoxy silane. ...............68
Figure 3.19: TEM image of the SiCWs modified with epoxy silane and P2VP.) .............69
Figure 3.20: Representative (a) TEM and (b) z-contrast images of SiCWs
functionalized with NiNPs ................................................................................................70
Figure 3.21: Dark field images of a SiCW modified with NiNPs orienting in the
magnetic field. The magnetic field direction is denoted by the white arrow. The
direction was changed by 90 o from (a) to (b). .................................................................71

xiii
Figure 4.1: (a) The experimental set-up used for drying of the PEG-MagSiCW film;
(b) magnetic field in-between the magnets. .......................................................................81
Figure 4.2: TEM image of the bare MagNPs obtained after separation processing. .........82
Figure 4.3: The particle size distribution fitted to the Weibull function (─). The top of
the figure provides the statistical relevance of the distribution. ........................................82
Figure 4.4: (a) TEM image of MagNPs modified with PAA and (b) TGA curves of
original and modified MagNPs. .........................................................................................83
Figure 4.5: The nanoparticle agglomerate size distribution fitted to the Weibull
function. The top of the figure provides the statistical relevance of the distribution. ......85
Figure 4.6: (a) The average thickness of the attached MagNPs layer vs weight fraction
of magnetic nanoparticles; (b) the SEM image of the MagSiCWs for the 1:10 ratio. .......87
Figure 4.7: Schematic diagram of the statistical analysis methodology for the
MagNPs layer attached to the SiCWs ...............................................................................88
Figure 4.8: Representative histogram of the MagNP layer attached to the SiCW
surface fitted to the Weibull function (─). The top of the figure provides the statistical
relevance of the distribution...............................................................................................89
Figure 4.9: Measured thickness of the MagNP layer on the SiCWs from TEM images
vs. weight fraction of the MagNP in the MagSiCW. (where: the mean (―), median,
25% to 75% quartile, range, and the individual measurements are represented by the
blue fitted linear line, the middle line of the boxes, the upper and lower lines on the
boxes, the bars and the individual dots). ............................................................................90
Figure 4.10: Representative SEM image of MagSiCWs obtained for the 1:5 ratio ..........90
Figure 4.11: Magnetization curves for MagNPs and MagSiCWs (prepared with the
1:5 ratio). ............................................................................................................................91
Figure 4.12: Distribution of orientation for PEO composites with 0.16 vol. % and
0.58 vol. % of MagSiCWs. ................................................................................................93
Figure 4.13: (a) Stitched image of the composite thin film with 0.57 vol% of SiCW-
MagNP (the image is rotate 90 o clockwise); the black arrow describes the direction
of the net director; (b) the distribution of orientation from left, middle, and right
portions of the image. ...................................................................................................94,95

xiv
Figure 5.1: (a) Schematic diagram of the set-up for the ball drop experiment; (b) the
depth of measurement vs measured velocity for the glycerol..........................................101
Figure 5.2: Calculated viscosity of the glass sphere in the glycerol ...............................101
Figure 5.3: Experimental set-up for the observation of orientation of MagSiCWs at
low concentration. ............................................................................................................103
Figure 5.4: The apparent viscosity of the epoxy resin vs. the epoxy curing reaction
time at room temperature. ................................................................................................104
Figure 5.5: The degree of epoxy curing vs time of the reaction. .....................................105
Figure 5.6: The calculated time of orientation vs. the thickness of attached MagNP
within the initial epoxy resin............................................................................................108
Figure 5.7: Calculated characteristic time of magnetic orientation for MagSiCWs. .......108
Figure 5.8: The distribution of MagSiCWs’ orientation within a constant field (from
images taken at specific reactionary times) during the curing process of the neat
epoxy, as observed with optical microscopy. ..................................................................109
Figure 5.9: Experimentally measured time of orientation over the experimentally
measured apparent viscosity. ...........................................................................................110
Figure 6.1: The degree of epoxy curing over the time of reaction at room temperature 123
Figure 6.2: The plot of ln(heating rate/Tp2) vs. 1/Tp .......................................................124
Figure 6.3: The kinetics of the epoxy functional groups consumption during the
curing reaction at room temperature. ..............................................................................125
Figure 6.4: The kinetics of anhydride consumption during of the epoxy curing
reaction at room temperature. ..........................................................................................126
Figure 6.5: Change in the epoxy resin composition during the course of the curing
reaction for the composite materials (▲) and the neat epoxy resin (●). ........................126
Figure 6.6: TGA curves for MagSiCWs soaked in epoxy for 6 hours (──) and
original MagSiCWs (──). ...............................................................................................127
Figure 6.7: TEM image of the MagSiCWs’ surface after soaking in the curing epoxy
resin for 6 hours.. .............................................................................................................128

xv
Figure 6.8: SEM images of composite materials (a) with a magnetic orientation and
(b) without a magnetic orientation. ..................................................................................129
Figure 6.9: The level of MagSiCWs orientation in epoxy composite for the different
methods of magnetic field application. Continuous: the continuous application of
magnetic field to the composite for 4 hours (from 1hr to 5hrs into the curing).
Singular: the magnetic field was applied once for 15 mins at 1, 2, or 3.5 hrs (one
application per sample) during the curing. Pulsed: magnetic field was applied to a
single sample for 15min 4 times (at 1, 2, 3.5 and 5 hours) during the curing.................131
Figure 6.10: DSC traces for neat epoxy and epoxy/MagSiCW nanocomposites. (a) is
the first run and (b) is the second run. .............................................................................134
Figure 6.11: DMA results: (a) the storage modulus, E/ and (b) tan δ data for neat
epoxy and epoxy/MagSiCW composites. ........................................................................137
Figure 6.12: Magnetometer measurements of the oriented composite materials where
the Mag-SiCWs were oriented (left) parallel and (right) perpendicular to the magnetic
field. .................................................................................................................................142
Figure 6.13: Histogram of the fillers’ reordered angle alignment from the net director
within each of the composites. .........................................................................................144
Figure 6.14: The results from the calculated relative cross-linking using DMA
measurements (▲) and swelling experimentation (●) vs EMc, storage modulus above
40 oC. (The samples are signified from left to right as the non-oriented
MagSiCW/epoxy composite, neat epoxy, and oriented MagSiCW/epoxy composite).) .145
Figure 7.1 Layout of the silicon carbide whisker after three consecutive surface
modifications: (a) is bare SiCWs; (a-b border) - epoxy silane modification; (b) -
grafted P2VP; (c) - PAA layer .........................................................................................154
Figure 7.2: (a) the degree of curing versus the time of reaction at room temperature
and (b) the Kissenger plot.) ..............................................................................................158
Figure 7.3: The degree or the reaction calculated based on consumption of: (a) epoxy
groups, (b) anhydride groups. .........................................................................................160
Figure 7.4: ATR-FTIR results for the epoxy curing reaction: (a) degree of the epoxy
group consumption monitored by the 913 cm-1 peak, (b) degree of the anhydride
group consumption monitored by the 1780 cm-1 peak. .................................................161

xvi
Figure 7.5: The temperature dependence of DMA storage modulus for different
composite materials .........................................................................................................163
Figure 7.6: The DSC curves for the materials studied: (a) first run and (b) second run. .165
Figure 7.7: SEM images of the cross-section of: (a) SiCW-OH, (b) SiCW-EP, (c)
SiCW-P2VP, (d) SiCW-PAA composite materials .........................................................167
Figure 7.8: The graph of calculated values of relative cross-linking from DMA
measurements (▲) and swelling data (●) vs EMc. The samples are signified from left
to right as non-oriented (1), neat epoxy (2), oriented (3), SiCW-OH (4), SiCW-PAA
(5), SiCW-P2VP (6), and SiCW-EP (7)...........................................................................169
Figure 8.1: Schematic of methodology used for the surface modification of
MagSiCWs with PGMA. .................................................................................................176
Figure 8.2: SEM image of the 1:5 MagSiCW with the magnetic layer (circled in red)
identified as the low-stress transfer region. .....................................................................178
Figure 8.3: TEM image of the PGMA-MagSiCWs. (The red squares are the zoomed-
in regions of the image). ..................................................................................................179
Figure 8.4: TGA curve of the MagSiCW modified with PGMA. ...................................180
Figure 8.5: The temperature dependence of the storage modulus results for the
PGMA-MagSiCW epoxy composites (▲), non-oriented MagSiCWs epoxy composite
(●), and neat epoxy (■). ..................................................................................................181
Figure 8.6: The DSC curves for the PGMA-MagSiCW/epoxy composite,
MagSiCW/epoxy composite, and the neat epoxy samples: (a) first run and (b) second
run. ...................................................................................................................................183
Figure 8.7: SEM image of the cross-section of the PGMA-MagSiCW/epoxy
composite. ........................................................................................................................184
Figure 8.8: Histogram of the PGMA-MagSiCW fillers orientation in the epoxy
matrix. ..............................................................................................................................186

xvii
TABLES
Table 2.1: Typical properties of SiCWs ...........................................................................11
Table 2.2: Material properties of NiNPs ............................................................................12
Table 2.3: Material roperties of maghemite nanoparticles ................................................13
Table 2.4: Changes in mechanical properties of composite materials incorporating
magnetically oriented fillers. .............................................................................................23
Table 3.1: Synthetic conditions for NiNPs fabrication .....................................................44
Table 4.1; Student’s t-test results for the sets of MagSiCWs batches ..............................87
Table. 6.1: Magnetic properties of the nanocomposites. .................................................141
Table 6.2: The agglomeration and dispersity of the composite fillers within the cured
epoxy matrix. ...................................................................................................................143
Table 6.3: Results of swelling experiment. ......................................................................145
Table 7.1: Parameters of epoxy curing calculated using DSC data.. ...............................159
Table 7.2: Consumption of epoxy and anhydride functional groups after 48 hours of
curing at room temperature. .............................................................................................160
Table 7.3: DMA results for the materials studied. (EMc is the storage modulus at 40 oC
above the Tg and T is temperature). .................................................................................163
Table 7.4: DSC results for the materials studied: Tg1-h1 and Tg2-h1 is the first and
second Tgs from the first run; Tg-h2 is the Tg from the second run; ΔTg-h2 is the
subtraction of the offset from the onset of the Tg from the second run. ..........................165
Table 7.5: The microstructure data for the composites obtained from SEM images
analysis. ............................................................................................................................167
Table 7.6: Results of the swelling experiments, where m_d and m_eq are the dried
weight and swollen weight of the materials . ...................................................................168
Table 8.1: Thermo-mechanical properties of the PGMA-MagSiCW/epoxy composite
compared with neat epoxy and other composite materials studied..................................182

xviii
Table 8.2: The selected thermal properties of the materials studied. ...............................183
Table 8.3: Summary of the SEM image analysis ............................................................185

1
CHAPTER ONE
INTRODUCTION
In comparison to metals, ceramics, and polymers, composite materials have not
been fabricated and studied nearly as long1-2. Nevertheless, nowadays composites are
widely used in the aerospace, energy, and transportation industries due to an increased
demand for greater strength, stiffness, and fatigue resistance per weight of manufactured
components1.
It is recognized that composites with nanoscale fillers can drive the performance
of emerging and traditional materials to new heights by increasing the extent of the filler-
to-matrix interaction3 in comparison with traditionally used micron-scale fillers. Thus
far, the embedding of nanomaterials into composites has been achieved, but directional
arrangement has proved to be a challenging task4. Despite the advances with in-situ and
shear induced orientation methods4, the alignment of nanoparticulates is difficult to
control and unreliable, hampering nanocomposite improvements. Thus, the
implementation of nanomaterials with the ability of being oriented along magnetic fields
can create a highly controllable system with precisely designed properties.
To this end, the goal of the work reported in this dissertation is to develop
magnetically active nanoscale whiskers and study the effect of whiskers’ orientation in a
polymer matrix on nanocomposite’s behavior. The work was conducted as follows. First,
the methodology for the preparation of magnetically active silicon carbide whisker
(SiCW) nanofillers was developed. Next, their magnetic orientation in a polymer matrix

2
was studied. Then, nanocomposite materials were fabricated and their structure-property
relationships were investigated.
Specifically, Figure 1.1 shows the workflow for the fabrication of the composite
materials. Figure 1.1a and Figure 1.1b represent the synthesis and selection of the nickel
nanoparticles (NiNPs), iron oxide nanoparticles (MagNPs), and SiCWs. Figure 1.1c and
Figure 1.1d represent the modification of the nanomaterials to achieve preferable
interactions between them. Figure 1.1e illustrates the functionalization of the modified
SiCWs through mixing with modified magnetic nanoparticles to create magnetically
modified SiCWs. Figure 1.1f depicts the fabrication of the magnetically oriented
nanocomposites. At each step, the morphology, structure, and properties of the materials
were characterized using transmission electron microscopy (TEM), scanning electron
Figure 1.1: Diagram representation of the approach employed by this project: a) and b)
the selection and synthesis of nanoparticles and SiCWs; c) and d) surface modification of
the nanomaterials; e) the attachment of the nanoparticles to the whiskers; f) fabrication of
composites with oriented nanofillers
3
microscopy (SEM), thermal gravimetric analysis (TGA), differential scanning
calorimetry (DSC), dynamic mechanical analysis (DMA), and Fourier transform infrared
spectroscopy (FTIR).
This dissertation is structured as follows:
Chapter 2 is a literature review of the materials, their properties, and methods
used to modify the surface of the SiCWs and fabricate nanocomposite materials.
Chapter 3 describes the surface modification of SiCWs, NiNPs, and model nickel
and silica surfaces. Additionally, this chapter includes the fabrication and study of
the SiCWs modified with NiNPs (NiSiCWs) by polymer-polymer complexation.
Chapter 4 focuses on the surface modification of MagNPs. Furthermore, this
chapter discusses the fabrication and study of SiCWs modified with MagNPs
(MagSiCWs) by polymer-polymer complexation.
Chapter 5 describes the orientation of MagSiCWs in a magnetic field during the
curing of the epoxy matrix. It includes studies of the curing process of the neat
epoxy.
Chapter 6 is devoted to the influence of the MagSiCWs on the formation of the
epoxy cross-linked network and the effect of MagSiCWs on the properties of the
epoxy nanocomposite. This chapter also discusses methodologies applied to
achieve the magnetic orientation of the MagSiCWs and the impact of MagSiCWs
orientation on the composite’s properties.
Chapter 7 focuses on the modification of the SiC-epoxy interfacial region in the
composite materials. Specifically, hydroxyl functional groups, epoxy silane,

4
poly(2-vinylpyridine) (P2VP), and polyacrylic acid (PAA) were used to modify
the surface of the SiCWs, which were later dispersed into the epoxy matrix. Thus,
this chapter describes the effect of each surface modification on the formation and
properties of the nanocomposites.
Chapter 8 concentrates on the reinforcement of the MagSiCWs’ magnetic
nanoparticle layer with poly(glycidyl methacrylate) (PGMA). Specifically, the
PGMA reinforcement is used to increase the rigidity of the interphase to create
more thermally and mechanically sound composite material.
Chapter 9 concludes this work by summarizing the key findings in course of this
study.
Chapter 10 briefly outlines possible future work.

5
References
1. Chawla, K. K., Composite materials. Science and engineering. 3rd ed.; Springer
Science: New York, 2012.
2. Plueddemann, E. P., Interfaces in polymer matrix composites,. Composite
materials, Academic Press: New York, 1974; Vol. 6, p 294.
3. Hull, D.; Clyne, T. W., An introduction to composite materials. 2nd ed.;
Cambridge Univeristy Press: Cambridge, 1996.
4. Keledi, G.; Hari, J.; Pukanszky, B., Polymer nanocomposites: structure,
interaction, and functionality. Nanoscale 2012, 4 (6), 1919-38.

6
CHAPTER TWO
LITERATURE REVIEW
This chapter covers the main scientific topics discussed within this dissertation.
The background is broken into four major sections. The first section (Section 2.1)
presents an overview of epoxy nanocomposite materials. Next, Section 2.2 contains
principles of surface modification of nanomaterials. Then, the fabrication of composites
with oriented fillers are presented in Section 2.3. Finally, Section 2.4 contains a concise
description of nanocomposite materials’ properties.
2.1: Epoxy Nanocomposite Materials
In general, a composite can be defined as a phase-separated material with
characteristics defined by the combination of the characteristics of the individual
components1. Composite materials is not a new concept. Nature has many examples of
composite structures2-4. In the search for stronger and lighter materials, various structures
resembling natural composites have been used to create cross-ply laminates, particulate
dispersed, and fiber-reinforced composite materials5. Modern history denotes the first
significant use of composites occurring during World War II that was aimed to decrease
the weight of planes and extend flight distance. Nowadays, macro-scale composites are
the backbone of the commercial aerospace industry. Specifically, in comparison to their
aluminum counterparts, continuous carbon fiber composites deliver savings in weight and
gains in strength1. Recently, new types of advanced composites, such as nanocomposites,
biocomposites, self-reinforced composites, and self-healing composites, have been
emerging1.

7
Nanocomposite is defined as a composite material with one component that has at
least one dimension in the nanometer range1. In general, these composites are comprised
of a nanofiller (nanofibers, nanowhiskers, nanoplatelets, or nanoparticles) dispersed into
a polymeric, metallic, or ceramic matrix. The polymer matrix is more common6-8. The
first nanocomposites produced industrially were polymer nanoclay materials9-11.
Chemically, these clays are composed of layered magnesium aluminum silicates that
have a thickness of 1 nm and width ranging from 70 nm to 150 nm and are typically used
at 2–3 wt. % within the matrix1. These clays are not easily dispersible into a non-polar
polymer matrix. Thus, surface modification was used to create better surface interactions
between the polymers and the nanoclays. In general, from carbon nanotubes to nanoscale
rubber toughening particulates, the dispersibility is a very important factor for the
nanocomposite industry. As a result, the chemical functionalization of nanofillers’
surfaces is an active area of research for the nanocomposites12-14.
2.1.1: Epoxy Thermoset Resins
In general, polymer chains in thermosetting matrices are connected into networked
structure15 (Figure 2.1). Of all the thermosetting polymers for composite technologies,
epoxies are one of the most versatile and widely used16.
The epoxy functional group, also known as an oxirane, is a three-member cyclic
ether ring17. It is shown in Figure 2.2 as the group attached to R1. This cyclic ether
behaves differently from other cyclic ethers, like tetrahydrofuran (THF), due to the high
strain within the three-member ring17. When epoxy is polymerized, no reactant

8
byproducts are formed (Figure 2.2). This is very beneficial for the composite system, as
the presence of reactant byproducts may cause degradation of material’s properties18.
Additionally, the epoxy group can react with a large number of functional groups19. For
instance, Figure 2.2 shows the reaction of the epoxy with a hydroxyl group and
carboxylic acid. The reaction results in the opening of the epoxy ring producing an ether
or ester linkage17.
In this work Araldite 6005 diglycidyl ether of bisphenol A (DGEBA) (Figure 2.3)
is used as an epoxy material. It is a liquid resin modified with mono-functional reactive
Figure 2.1: Conceptual diagram of the thermoset formation.
Figure 2.2: The schematic representation of the reaction of the epoxy functional group
with hydroxyl and carboxylic functional groups.

9
diluents19. This epoxy resin is one of the most used commercially. It has good moisture
resistance, lower shrinkage during curing (2–3 %), and a higher thermal stability than
many other thermosetting resins1.
The anhydride curing agent used in this work is one of the most commercially
used reactants for the fabrication of epoxy based composite materials20. We chose to use
dodecyl succinic anhydride (DDSA) (Figure 2.4) as a hardener system to keep the
viscosity of the resin low. DDSA is used in many industrial applications, and the
properties of epoxy systems cured with DDSA are well known21-22.
2.1.2: Silicon Carbide Whiskers
For this research, SiCWs were selected to be high aspect ratio reinforcing agents
with an easily modifiable surface. The modification is designed to increase surface
interactions and modify the whiskers with magnetic particulates for the purpose of
orientating them within the matrix. Several experimental procedures have been published
Figure 2.3: The chemical structure of DGEBA.
Figure 2.4: The chemical structure of DDSA.

10
to create magnetic whiskers, rods, and fibers13, 23-28. In this work, the attachment of
magnetic nanoparticles was chosen as a route to make the SiCWs magnetically active.
The attached magnetic nanoparticles can be used to align the nanofillers within
the matrix using magnetic field. In conventional composites, the designed directionality
of the fillers has improved the specific strength and reduced the cost of many components
used in the aerospace, energy, and transportation industries1, 5. Hence, the designed
orientation of nanofillers is valuable for tailoring nanocomposite properties and
advancement of the nanocomposite industry. Thus, the magnetic orientation of SiCWs
modified with magnetic nanoparticles has been proposed as a route to create highly
ordered discontinuous (high aspect ratio) nanofillers within a composite matrix.
Research to diversify the application base for SiC nanostructures started in the
1990s29. The first major interest was in enhancing the luminescence efficiency of porous
silicon carbide fabricated using electrochemical etching29. Since then, various types of
silicon carbide nanomaterials have been produced. SiC nanoparticles and SiC
nanocrystals are mainly synthesized using vapor phase and solution-based reactions29.
SiC nanowires and nanofibers are primarily synthesized by vapor-solid growth and
vapor-liquid-solid growth with the assistance of a metal catalyst29. However, as this
technology has progressed, the industrial manufacturing of SiCWs has moved more
toward increased production with less control over the size and structure. For instance,
this research used industrially produced Silar SC-9M SiCWs. They are a proprietary
material from the Advanced Composite Materials LLC.30. Typical properties of SiCWs
are outlined in Table 2.1.

11
Table 2.1: Typical properties of SiCWs31-33.
Density (g/cm3) Thermal conductivity
(W/cmK)
Young’s modulus
(GPa)
3.21 3.2–4.9 442–448
Silar SC-9M SiCWs are described as very high modulus rigid rods30. A whisker is
a high aspect ratio material formed in a single crystal of ceramic or metal with no
interacting grain boundaries within the material’s structure34. In general, today’s SiCWs
are synthesized by either microwave heating of silica sol and activated carbon, or by the
methods relying on vapor-to-liquid-to-solid growth mechanisms35,36-43. Currently,
industrially inexpensive and renewable sources, like rice hulls, are often used to
manufacture SiCWs34. Using this process, 80–90 % of the material is produced as
whiskers. The whiskers contain alpha, beta, and mixed alpha and beta phases with
impurities of 0.1 wt. % oxygen; 0.1–0.8 wt. % of Mn Mg, Fe, and Al; and 100–1,000
ppm of Cr, K, Cu, Ni, and Na 34. Additionally, the SiCWs are stable up to 1800 oC34.
SiCWs, like the Silar SC-9M, have already being used in industrial applications to
improve the thermo-mechanical properties of composites. For instance, there have been
15 granted patents by the Advanced Composite Materials Corporation on the usage of
SiCWs. The applications of these patents range from laminated hybrid composites to
electromagnetic radiation absorption34, 44-48.
2.1.3: Nickel Nanoparticles
Ferromagnetic materials are being extensively incorporated into nanocomposite
films, gels, and capsules49. These materials are used in drug delivery, medical diagnosis,
magnetic recording, conductive paints, and stimuli responsive magnetic materials49-53.

12
Additionally, there is an increasing demand for materials with greater strength, thermal
resistance, and magnetic responsiveness. Of the ferromagnetic materials, nickel is
especially suited for use in these magneto-responsive materials due to its conductivity,
ferromagnetism, high Curie temperature, thermal stability, strength, and simple
procedures for the synthesis of NiNPs54. The combination of these properties makes
NiNPs an excellent choice for industrial ferromagnetic nanocomposites55. Some of
NiNPs’ properties are listed in Table 2.2.
Table 2.2: Material properties of NiNPs56-60.
Density
(g/cm3)
Saturation
magnetization (emu/g)
Remnant magnetization
(emu/g) Coercivity (Oe)
~8.90 20–55 3–7 40–100
NiNPs have been synthesized by ball milling, electrodeposition, thermal
decomposition, ligand stabilized solution-phase precipitation, decomposition of
organometallic precursors, chemical vapor deposition (CVD), and liquid phase
reduction61-65. Except for the liquid phase reduction, the synthetic procedures are
cumbersome, time consuming, and requiring excessive effort. On contrary, for instance,
hydrazine reduction, in its simplest form, takes just four chemicals: a stabilizer, reducing
agent, nickel salt, and solvent66. There are several types of variations with ligand
stabilizers, steric stabilizers, nucleating agents, and many other additives. However, the
base four components provide a sufficient foundation to synthesize the nanoparticles.
Hence, the simplicity of the reduction process gives plenty of room for control and
variations to tune the desired particle shape and size.

13
2.1.4: Iron Oxide Nanoparticles
Iron oxide particles are mostly comprised of magnetite, maghemite, hematite, and
wüstite phases67-68, which relate to different crystal structures and/or ratios of Fe to O in
the lattices67-68. These iron oxides are most notably known for the roles they play in
geological and biological sciences69-73. Mankind has proven iron oxides to be invaluable,
with applications ranging from pigments that decorate cave walls to the development of
steel processing68. Today, their properties and economic viability make them ideal for a
variety of traditional and emerging technologies74.
This research have used a mixture of iron oxide nanoparticles from US Research
Nanomaterials, Inc. The iron oxide mixture is mostly maghemite, denoted by the
prevalent reddish color in the colloidal dispersions68. It is known as a γ-Fe2O3 having a
Fe3+ cation in a hexagonal crystallographic system with a corundum structure67. This
structure has a HCP (001) anion stacking with the “a” and “c” lattice parameters of 0.504
nm and 1.37 nm68, respectively. Additionally, the maghemite top surface were found to
be Fe3O4 (111)75. The bulk material properties of maghemite nanoparticles are presented
in Table 2.3.
Table 2.3: Material properties of maghemite nanoparticles70, 76-77.
Density
(g/cm3)
Saturation
magnetization (emu/g) Magnetic susceptibility Coercivity (Oe)
4.86 60–80 8–21 ~20
The iron oxide nanoparticles used in this work were synthesized by a co-
precipitation method and obtained as a dry powder modified with polyvinylpyrrolidone
(PVP). The PVP modification delivered a surface open for further modification. Thus, the
iron oxide nanoparticles could readily be modified for the use in this research.
14
2.2: Surface Modification
Surface modification is used to improve affinity of the nanofillers to the polymer
matrix. For instance, solution-induced intercalation, in-situ polymerization, and melt
processing are used to introduce nanoclays into polymer matricies1, 9. These surface
modifications decrease the surface energy of the fillers and create favorable interactions
between the matrix and filler. The favorable interactions between the filler and matrix
increase interfacial adhesion and raise the dispersibility of the nanoparticulates in the
composite material. This is vital to the structural reinforcement and stress transfer within
nanocomposite systems. Furthermore, the integration of well-dispersed nanomaterials
into a polymer matrix has been shown to enhance material’s properties78-81.
Agglomeration of nanoparticulates can result in defect sites inside a composite82.
The application of an anchored polymer layer acting as a steric boundary, can prevent
aggregation of the nanoparticulates in the matrix83. Thus, nanolayer thin films of polymer
are often applied to nanomaterials via grafting or adsorption processes84-86. While
adsorption may be the easiest method to attach polymers to the surface, it is usually an
impractical approach due to the low bonding strength and inability to permanently
functionalize surfaces. However, adsorption may be useful for specific combinations of
polymers and surfaces that can complex via hydrogen or ionic bonding. Alternatively,
“grafting to” and “grafting from” techniques generally utilize chemical (covalent)
anchoring of the polymer chains87. The “grafting from” uses surface initiation of
polymerization to form surface anchored polymer chains. The “grafting to” method uses
already synthesized polymers to modify a surface. Unlike the “grafting from” approach,

15
the “grafting to” method is a simple and easily scalable surface modification process
involving just two steps: surface activation and modification. This research utilizes
surface complexation and the “grafting to” method to modify the surfaces of
nanoparticulate fillers. These surface modification techniques were chosen for their
relative ease of application and compatibility with the use of polyelectrolytes. These two
methods of surface modification (surface complexation and “grafting to”) are discussed
in the following sections.
2.2.1: Adsorption of PAA on Iron Oxides
Metal oxides’ reactivity with PAA is utilized in a number of practical
applications88. The reaction between PAA and most metal oxides typically creates
monodentate binding. Fe3O4, alumina, PbO, Ti2O3, and other ferrite nanomaterials
(MFe2O4: M= Zn, Fe, Co, and Mn) bond with PAA by forming carboxylate salts or
ferrite hydroxides89-92.
Specifically, the complex being formed between PAA and γ-Fe2O3 has not been
studied in details. However, it is assumed that the binding of PAA to the surface of
Fe3O4 and γ-Fe2O3 is similar, as their surface structures are identical (Figure 2.5)75.
The binding processes in Figure 2.5 were employed to form high-performance
flexible battery anodes93. The anchoring of PAA to Fe3O4 has been also attributed to
hydrogen and/or electrostatic bonding94-96.

16
2.2.2: “Grafting to” Anchoring of Polymer Chains
Polymer grafting provides resourceful means to engineer materials’ surface
characteristics, such as wettability, adhesion, biocompatibility, conductivity, antifogging,
and antifouling97. The “grafting to” technique is defined by application of previously
synthesized polymer to covalently bond to a surface or polymer chain of complementary
chemistry15. For the modification of inorganic surfaces, the “grafting to” technique is
particularly applicable due to the simplicity and scalability of the process. The most well-
known technique is the end-terminated “grafting to” method98 (Figure 2.6a). In addition,
surface modification can be conducted also via the functional groups distributed along the
polymer chains93, 99 (Figure 2.6b). In this case, ~20 % of the functional groups anchor to
the surfaces99 leaving ~80 % of the groups to interact with the environment.
Figure 2.5: Schematic representation of the possible bonding of PAA to the iron oxide
surface via (a) hydrogen bonding and (b) chelation.
a)
b)

17
Figure 2.6: The schematic representation of the “grafting to” technique using a) end-
terminated and b) functional groups methods.
a)
b)
2.2.3: Polymer-to-Polymer Complexation
The surface modifying polymers (including polyelectrolytes) can act as dispersing
or attachment agents depending on the system used. As a dispersing agent, the polymer
layer creates a steric boundary on the surface of a particulate to prevent aggregation of
the particulates and produce a stable colloidal dispersion. As an attachment agent, the
polymer layer binds the modified particulate to a specified surface. Generally, two
distinct polyelectrolytes can create a binding complex because of the attractive
interaction between their specific functional groups. 100-105 Additionally, these complexes
can be very sensitive to charges in density, ionic strength, temperature, polymer
concentration, and pH of the solution106.
With applications in biochemistry, biology, water purification, particle modification,
and medicine, polyelectrolytes have been used in very diverse areas107-109. This research
utilizes polyelectrolytes that can form complexes based on hydrogen bonding. Polymer-

18
Figure 2.7: Structure of PAA-P2VP complexes depending on the association ratio
between carboxylic and pyridine groups a) 2:1 and b) 1:1 (reprinted with permission).
a) b)
polymer hydrogen bonding is formed when a polymeric hydrogen donor is mixed with a
polymeric hydrogen acceptor110-113. These hydrogen bonds have uneven charge
distribution which can be seen as weak ionic bonding114.
This study utilizes a well-known complex formation between P2VP and PAA106, 114-
115. P2VP and PAA stand out as inexpensive hydrogen/ionic bonding polymers116. As for
the functional groups, the carboxylic acid interacts with the pyridine to form a 2:1
(acid:pyridine) complex (Figure 2.7). However, solvents capable of hydrogen-bonding,
such as alcohols, reduce the association ratio to a 1:1116 (Figure 2.7). The 1:1 ratio is
optimal for adhesion, creating strong hydrogen/ionic bonds between the polymer chains.
P2VP and PAA have similar bonding structures to poly(4-vinyl pyridine) P4VP
and polymethacrylic acid (PMMA). The complexes between PAA, PMMA, P2VP, and
P4VP were investigated by measuring the changes in their glass transition temperatures
(Tg). An increase in the Tg is directly correlated with the complex formation between
polymer chains. It was found that Tg of PAA based complexes was 20 °C higher than the
PMMA-based complexes114 (Figure 2.8). Therefore, PAA was selected in this work for
the complex formation. This (higher Tg) is also true for the P4VP complexes compared to

19
Figure 2.8: Dependence of Tg on the composition of the complexes a) PAA/P4VP, b)
PAA/P2VP, c) PMMA/P4VP, and d) PMMA/P2VP (the straight line corresponds to the
calculated linear additive rule values) (reprinted with permission).
Wt. % of PAA or PMMA in the complex
the P2VP complexes. However, P4VP is a more expensive polymer. Thus, P2VP was
selected for its much lower cost at the expense of a higher bond strength.
2.3: Fabrication of Nanocomposites with Orientated Dispersed Phase
Composite materials with oriented fillers have been a main contributor to the
modern materials portfolio15. However, the fabrication of such nanocomposites is not
straightforward1. The alignment of the oriented nanofillers must be maintained
throughout possible disruptions caused by thermal fluctuations, capillary forces, flow
dynamics, and polymer solution melt viscosity heterogeneity, which are often present
during composite fabrication117-119.
Various methods of controlling nanofiller orientation have been attempted
including tape casting, melt flow shear, slip casting, layer-by-layer deposition, electrical
field, and hot-pressing from a gel120-125. The fabricated composites have displayed
superior in-plane mechanical properties because of orientation of the fillers. However,
these methods are limited by their complex methodologies and/or film geometries126. The

20
magnetic orientation within bulk matrices has shown greater versatility in this aspect. To
date, results have been published for magnetically oriented composites involving the
following nanoscale fillers: alumina platelets118, 127-133, silver nanowires134, boron nitride
platelets135-137, carbon nanotubes138-140, carbon nanofibers141-142, lamellar clay
(montmorillonite)143, graphene/graphene oxide144-147 , Fe3O4 nanorods148, CaP rods149,
cellulose nanowhiskers,150 and SiC nanoparticles137.
2.3.1: The Theoretical Aspects of Magnetic Orientation
The magnetic orientation of nanofillers is an effective way to create high degree
of orientation within a composite matrix118. However, most high modulus nanofillers, like
carbon nanotubes and SiCWs, have a very low magnetic susceptibility151-153 and by
themselves are not suitable for this type of orientation. Therefore, magnetic nanoparticles
are used in a variety of ways to create highly aligned nanofillers118. Specifically, the
attachment of magnetic nanoparticles to the surface of non-magnetic rod-shaped
particulates can be employed to generate magnetic shell covering the nanofiller. An
applied magnetic field would cause the magnetic moment of the shell to orient in the
direction of the field. Hence, the orientation of the fillers decorated with the particles
would be in the direction of the applied magnetic field as well.
In this respect, Equation 2.1 can be used to predict the critical frequency for the
rotation of a paramagnetic rod in a rotating magnetic field154-155. The equation, describing
the rotation for a single nanorod, is given by:
cc wf 2 (2.1)

21
where fc is the critical frequency of the rod rotation or 1/τ (where: τ is the characteristic
time of orientation for a paramagnetic nanorod going from 90 o to 0 o orientation with the
net director); and, wc is the characteristic frequency.
The Equations 2.1-2.4 are used to estimate the materials characteristic time of orientation
(τ) using a drag coefficient, viscosity of the solution, and applied torque.
Namely, wc is defined by:
22
2
21B
Vw
o
mag
c
(2.2)
where χ is the magnetic susceptibility, B is the strength of the magnetic field, 𝜇 is the
vacuum permeability, Vmag is the volume of the magnetic material, and γ is the drag
coefficient155-157. The drag coefficient and volume of magnetic materials are defined as:
A
l
w
wd
l
w
)ln(3
3
(2.3)
)(4
22
pwww
mag ddl
V
(2.4)
where η is the viscosity of the matrix, dw is the diameter of the rod, lw is the length of the
rod, dw+p is the diameter of the rod plus the particles, and A ≈ 2.4156.

22
The development of magnetic orientation for the “as is” diamagnetic materials has
been challenging due to the extremely high magnetic field needed to orient them.
However, the attachment of magnetic nanoparticles allows for small magnetic fields to
induce the orientation118. Additionally, recently, the methods for the fabrication of
magnetically oriented nanocomposites have greatly improved158-160. As a result, the
magnetically oriented composites with improved mechanical characteristics have been
demonstrated4, 161.
2.3.2: Magnetic Orientation of Nanofillers
It was shown that the magnetic orientation and positioning of nanofillers has
offered the improvement of mechanical properties of nanocomposite materials. For
example, 3-dimensional reinforcement of methacrylate resins was achieved using low
magnetic fields on alumina nanoplatelets and nanorods modified with magnetite
nanoparticles118. Namely, the reinforcement is shown to improve tensile yield strength by
60-90 %, and tensile modulus by 260 % with 20 vol. % of nanomaterial fillers118. In
addition, an epoxy composite containing 27 vol. % of oriented alumina nanoplatelets
made using oscillating field and vibration table162, demonstrated a 140 % and 470 %
higher flexural modulus than the equivalent as-cast composite and the polymer matrix162,
respectively. The local reinforcement of polyvinyl alcohol (PVA), polyurethane (PU),
and polydimethylsiloxane (PDMS) using magnetic nanofillers has increased the elastic
modulus by 265 %, 478 %, and 558 %, respectively158. Magnetic alignment has even
been used in cellulose-cellulose composites to increases the modulus of paper by
approximately 700 %163. Furthermore, magnetically oriented carbon nanotubes (CNTs)

23
within an epoxy matrix composite have produced increase in the tensile modulus by 55 %
with 0.2 wt. % of multi-wall carbon nanotubes (MWCNT) and 40 % increase with 0.5 wt.
% of single-wall carbon nanotubes (SWCNT)159, 164. The data on composites with
magnetically oriented fillers are compiled and compared in Table 2.4.
Table 2.4: Changes in mechanical properties of composite materials incorporating
magnetically oriented fillers.
Matrix Filler Filler’s content
(vol.%)
Relative increase in
tensile modulus (%)
methacrylate resin alumina nanorods 20 260
PVA alumina nanorods 20 265
PU alumina nanorods 20 478
PDMS alumina nanorods 20 558
epoxy SWCNT 0.125 55
epoxy MWCNT 0.3125 40
cellulose cellulose nanocrystal 5 700
The magnetic alignment of nanofillers does not just improve the mechanical
properties, but also offers a variety of other benefits. It has been used to overcome the
shear alignment during extrusion149, for optical applications165, in electrically conductive
and insulating thin films134, 160, 166-167, thermally conductive composites168-169, and shape
memory materials161. For instance, application of the magnetic realignment to overcome
shear flow orientation is the method compatible with industrial-scale extrusion processes.
It could be applied to create stronger composite fibers and tapes149. On the other hand,
magnetic iron oxide nanorods based magnetically actuated liquid crystals have been
shown to control polarization and intensity of light 165. These effects can be integrated
into optical devices in a wide variety of fields (such as displays, actuators, and optical
modulators). Other scientists have shown the formation of optically transparent and
electrically conductive thin films using orientation of silver nanowires with attached

24
superparamagnetic nanoparticles134. Additionally, the variations in orientation of
graphene based sheets can create highly conductive166 or insulative167 composite
materials. Oriented MWCNTs can improve conductivity in composites160. Thermally
conductive composites have been created by the magnetic orientation of carbon
nanofibers in polyester, boron nitride-iron oxide nanoparticles in epoxy, and silicon
carbide-iron oxide nanoparticles in epoxy168-169. In another application of orientation,
bioinspired shape memory composites have used the magnetically aligned nanofillers to
mimic the internal structure of natural composites to control bending and twisting
actuation triggered by external stimuli161.
2.4: Properties of Composites
The properties of composites are derived from the combination of properties of
two or more materials. The composite components are not independent and can reveal
strong interfacial interactions that might influence the composite’s properties
significantly. Specifically, mechanical characteristics depend on stress transfer from the
matrix to the inclusions through the interface. Thus, the properties of the composite are
affected by the compatibility of the two or more components. In some instances the
composite components could be incompatible, causing agglomerations, weak interfacial
bonding, voids, or other possible defects in the composite material.
2.4.1: Predicting Composite’s Properties
A large number of theoretical models have been developed to predict composite
properties5. One of the most accepted methods to predict mechanical properties of
nanocomposites is the Halpin-Tsia model and equation170. This is a semi-empirical

25
equation developed to model the mechanical properties of oriented and non-oriented
discontinuous fillers dispersed into a polymer matrix. Equations 2.5 and 2.6 are used to
calculate the mechanical modulus in the direction of the oriented fillers dispersed in a
matrix.
where Eo is the predicted composite modulus; Em -matrix modulus; Ef - fibrous inclusions
modulus; f - fiber volume fraction; η- fiber-to-load transfer parameter for the Halpin-Tsia
equation; and ξ is the shear coefficient (~2 times the aspect ratio of a fiber).
These equations assume that the matrix only sustains the axial load, stress is
transmitted to the fiber through shear stress, all the fibers are aligned in the direction of
the stress, there is no transverse or thermal stress, and the fillers are equally dispersed in
the matrix171. This equation is used in this study to model the properties of magnetically
oriented SiCWs dispersed into the epoxy composite materials.
The modulus for randomly oriented fibers can be estimated using Equation 2.7172-
173.
where El and Et are the longitudinal and transverse moduli, respectively. We have
already estimated the longitudinal modulus, and the transverse modulus was calculated
by equations (4) and (5) assuming ξ equals 2174.
f
fEE mo
1
1
mf
mf
EE
EE
/
1/(2.6)
(2.5)
(2.7) t
El
Eo
E8
5
8
3
26
2.4.2: Surface Effects and Compatibility
Surface effects are determined by chemical and physical interactions at the
interface between the reinforcement and the matrix. The interface is a phase discontinuity
that can be sharp or gradual. This bi-dimensional region is a finite thickness through
which material’s parameters (such as the concentration, elemental composition, crystal
structure, elastic modulus, density, and the coefficient of thermal expansion) change from
the matrix to the filler1. It is one of the major contributing factors to the behavior of a
composite originated in the compatibility of the matrix and the fiber.
The compatibility of the components in composite materials is a complex term
related to chemical and physical relationships between the matrix and the filler5, 175.
Specifically, wettability of the composite inclusions by the matrix determines the
infiltration and spreading of the matrix on the surface of the fillers1. The surface
roughness of the nanofillers also plays an important role by either creating mechanical
interlocking or voids at the interface. Thus, these surface qualities determine the type of
bonding that governs the mechanical interactions at the interface.
In general, there are three major types of interfacial bonds: mechanical, physical,
and chemical1. Mechanical bonds involve interlocking or gripping effects at the interface
of the composite. This includes phenomena such as friction associated with the matrix
penetrating the roughness of nanofillers’ surface. Physical bonding is classified as weak
secondary bonding (energy lower than approximately 8–16 kJ/mol) and is associated with
van der Waals, polar, and hydrogen bonding. Lastly, chemical bonding is defined as

27
metallic, ionic, or covalent bonds with bonding energies ranging from 40 kJ/mol to 400
kJ/mol.
Today, the composite interface is understood as an interfacial phase, also known
as the interphase176-177. The interphase plays an important role in stress transfer as a
mechanical transition zone178-179. As a transitional zone, the interphase can be designed
by changing its thickness, mechanical properties, and the gradient of the mechanical
properties across the interphase179. The gradient of the interphase is defined as the
gradual or abrupt change of mechanical properties through the interphase zone. This can
be summarized using the interfacial shear strength (IFSS) theory. Mostly applied to the
continuous filler composites, the IFSS theory states that the shear modulus of the
interphase region determines the composite’s mechanical properties1, 177. In turn, the
shear modulus of the interphase is established by the structure of the interphase region.

28
2.5: References
1. Chawla, K. K., Composite materials. Science and engineering. Springer Science:
New York, 2013; Vol. 3.
2. Weiner, S.; Wagner, H. D., The material bone: Structure-mechanical function
relations. Annu Rev Mater Sci 1998, 28, 271-298.
3. Wainwright, S. A.; Biggs, W. D.; Curry, J. D.; Gosline, J. M., Mechanical design
in organisms. Princeton University Press: Princeton, 1982.
4. Elices, M., Structural biological materials. Pergamon Press: Amsterdam, 2000.
5. Hull, D.; Clyne, T., An introduction to composite materials. Cambridge
University Press: Cambridge, 1996.
6. Barrera, E. V.; Lozano, K., New technologies, new composites. Journal of the
Minerals, Metals & Materials Society 2000, 52 (11), A32-A32.
7. Barrera, E. V.; Shofner, M. L.; Corral, E. L., Carbon nanotubes: Science and
applications. CRC Press Taylor and Francis Group: Boca Raton, 2005.
8. Shofner, M. L.; Khabashesku, V. N.; Barrera, E. V., Processing and mechanical
properties of fluorinated single-wall carbon nanotube-polyethylene composites. Chem
Mater 2006, 18 (4), 906-913.
9. Ajayan, M. R.; Schadler, L. S.; Braun, P. V., Nanocomposite science and
technology. Wiley-VCH: Weinheim, 2003.
10. Koo, K. H., Polymer nanocomposites. Mcgraw-Hill: New York, 2006.
11. Lee, H. S.; Fasulo, P. D.; Rodgers, W. R.; Paul, D. R., TPO based
nanocomposites. Part 1. Morphology and mechanical properties. Polymer 2005, 46 (25),
11673-11689.
12. Yuan, Z. K.; Yu, J. H.; Rao, B. L.; Bai, H.; Jiang, N.; Gao, J.; Lu, S. R., Enhanced
thermal properties of epoxy composites by using hyperbranched aromatic polyamide
grafted silicon carbide whiskers. Macromol Res 2014, 22 (4), 405-411.
13. Carraro, M.; Gross, S., Hybrid materials based on the embedding of organically
modified transition metal oxoclusters or polyoxometalates into polymers for functional
applications: a review. Materials 2014, 7 (5), 3956-3989.
14. Gun’ko, Y. K., Chemical functionalisation of carbon nanotubes for polymer
reinforcement. In Carbon Nanotube-Polymer Composites, Tasis, D., Ed. The Royal
Society of Chemistry: Cambridge, 2013; Vol. 27.

29
15. Sperling, L. H., Introduction to physical polymer science. John and Wiley, Inc.:
Hoboken, 1986.
16. Inam, F., Epoxy – the hub for the most versatile polymer with exceptional
combination of superlative features. Epoxy 2014, 1, 1-2.
17. McMurry, J.; Simanek, E., Fundamentals of organic chemisty. 6th ed.; Thomson
Brooks/Cole: Belmont, 2007.
18. Grenier-Loustalot, M.-F.; Grenier, P., The role of impurities in the mechanisms
and kinetics of reactions of epoxy resins and their effects on final resin properties. Brit
Polym J 1990, 22, 303-313.
19. Huntsman Container Corporation, High preformance components. Huntsman, Ed.
Huntsman: North America, 2015.
20. Mika, T. F.; Bauer, R. S., Curing agents and modifiers In Epoxy Resins.
Chemistry and technology, May, C. A., Ed. Marcel Dekker: New York, 1988.
21. Cahill, P. J. Alkenyl-substituted succinic anhydride. US Patent 3855251 A, 1974.
22. Wolfe, N. G. Latent catalysts for one-component epoxy resin/anhydride
compositions. US Patent 3689444 A, 1972.
23. Chatrabhuti, S.; Chirachanchai, S., Single step coupling for multi-responsive
water-based chitin/chitosan magnetic nanoparticles. Carbohydr Polym 2013, 97 (2), 441-
50.
24. Ahmad, T.; Ganguli, A. K.; Ganguly, A.; Ahmed, J.; Wani, I. A.; Khatoon, S.,
Chemistry of reverse micelles: A versatile route to the synthesis of nanorods and
nanoparticles. In Nanotubes, Nanowires, Nanobelts and Nanocoils - Promise,
Expectations and Status, P. R. Bandaru; S. Grego; I. Kinloch, Eds. Materials Research
Society: Warrendale, 2009; Vol. 1142, pp 75-88.
25. Mu, B.; Zhang, W. B.; Wang, A. Q., Facile fabrication of superparamagnetic
coaxial gold/halloysite nanotubes/Fe3O4 nanocomposites with excellent catalytic property
for 4-nitrophenol reduction. J Mater Sci 2014, 49 (20), 7181-7191.
26. Jiao, H.; Wang, J. L., Thermal decomposition fabrication, growth mechanism, and
characterization of rod-like -Fe2O3. Synth React Inorg M 2014, 44 (9), 1354-1357.
27. Korneva, G.; Ye, H.; Gogotsi, Y.; Halverson, D.; Friedman, G.; Bradley, J.-C.;
Kornev, K. G., Carbon nanotubes loaded with magnetic particles. Nano Letters 2005, 5
(5), 879-884.

30
28. Tokarev, A.; Rubin, B.; Bedford, M.; Kornev, K. G., Magnetic nanorods for
optofluidic applications. AIP conference proceedings 2010, 1311, 204-209.
29. Fan, J.; Chu, P. K., Silicon carbide nanostructures fabrication, structure, and
properties. Springer: New York, 2014.
30. Advanced Composite Materials, L. Technical data sheet: Silar® SC-9M; Greer,
SC, 2012.
31. Merz, K. M.; Adamsky, R. F., Synthesis of the wurtzite form of silicon carbide. J
Am Chem Soc 1959, 81 (1), 250-251.
32. Burgemeister, E. A.; Vonmuench, W.; Pettenpaul, E., Thermal conductivity and
electrical properties of 6H silicon-carbide. J Appl Phys 1979, 50 (9), 5790-5794.
33. Su, C. M.; Wuttig, M.; Fekade, A.; Spenceer, M., Elastic and anelastic properties
of chemical-vapor-deposited epitaxial 3C-SiC. J Appl Phys 1993, 77 (11), 5611.
34. Sawyer, L. C. Process for dispersing silicon carbide whiskers. US Patent 4956316
A, 1990.
35. Wagner, R. S.; Ellis, W. C., Vapor-liquid-solid mechanism of single crystal
growth Appl Phys Lett 1964, 4 (5), 89-90.
36. Kuang, J. L.; Cao, W. B., Silicon carbide whiskers: Preparation and high
dielectric permittivity. J Am Ceram Soc 2013, 96 (9), 2877-2880.
37. Yang, W.; Araki, H.; Kohyama, A.; Thaveethavorn, S.; Suzuki, H.; Noda, T.,
Fabrication in-situ SiC nanowires/SiC matrix composite by chemical vapour infiltration
process. Mater Lett 2004, 58, 3145-3148.
38. Chu, Y. H.; Fu, Q. G.; Zhang, Z. Z.; Li, H. J.; Li, K. Z.; Lei, Q., Microstructure
and growth mechanism of SiC nanowires with periodically fluctuating hexagonal prisms
by CVD. J Alloy Compd 2010, 508 (2), L36-L39.
39. Wei, J.; Li, K. Z.; Chen, J.; Yuan, H. D., Synthesis of centimeter-scale ultra-long
SiC nanowires by simple catalyst-free chemical vapor deposition. J Cryst Growth 2011,
335 (1), 160-164.
40. Tang, C. C.; Fan, S. S.; Dang, H. Y.; Zhao, J. H.; Zhang, C.; Li, P.; Gu, Q.,
Growth of SiC nanorods prepared by carbon nanotubes-confined reaction. J Cryst
Growth 2000, 210 (4), 595-599.
41. Pan, Z. W.; Lai, H. L.; Au, F. C. K.; Duan, X. F.; Zhou, W. Y.; Shi, W. S.; Wang,
N.; Lee, C. S.; Wong, N. B.; Lee, S. T.; Xie, S. S., Oriented silicon carbide nanowires:
Synthesis and field emission properties. Adv Mater Res 2000, 12 (16), 1186-1190.

31
42. Vix-Guterl, C.; McEnaney, B.; Ehrburger, P., SiC material produced by
carbothermal reduction of a freeze gel silica-carbon artefact. J Eur Ceram Soc 1999, 19
(4), 427-432.
43. Zhou, W. M.; Liu, X.; Zhang, Y. F., Simple approach to -SiC nanowires:
Synthesis, optical, and electrical properties. Appl Phys Lett 2006, 89 (22), 223124.
44. Dawes, S. B.; Stempin, J. L.; Wexell, D. R. Multicomponent ceramic matrix
composites. US Patent 5153152 A, 1991.
45. Rogers, W. Pressureless sintering of whisker reinforced alumina composites. US
Patent 5656217 A.
46. Quantrille, T. E.; Rogers, W. M. Composite materials and devices comprising
single crystal silicon carbide heated by electromagnetic radiation. US Patent 8648284 B2,
2007.
47. Rogers, W. Silicon carbide fibers essentially devoid of whiskers and method for
preparation thereof. US Patent 20050013997 A1, 2004.
48. Quantrille, T. E.; Short, L. A. Functionalized silicon carbide and functionalized
inorganic whiskers for improving abrasion resistance of polymers. US Patent
20130059987 A1, 2013.
49. Ridi, F.; Bonini, M.; Baglioni, P., Magneto-responsive nanocomposites:
preparation and integration of magnetic nanoparticles into films, capsules, and gels. Adv
Colloid Interface Sci 2014, 207, 3-13.
50. Hironari, S.; Nakano, Y.; Matsushita, H.; Onoe, A.; Kanai, H.; Yamashita, Y.,
Effect of heat treatment on dielectric properties of X7R designated MLCs with Ni
internal electrodes. J Mater Synth Process 1998, 6, 415-418.
51. Smogunov, A.; Dal Corso, A.; Tosatti, E., Selective d-state conduction blocking
in nickel nanocontacts. Surf Sci 2002, 507, 609-614.
52. Hernandez, R.; Polizu, S.; Turenne, S.; Yahia, L., Characteristics of porous
nickel-titanium alloys for medical applications. Biomed Mater Eng 2002, 12, 37-45.
53. Zhang, W. X.; Wang, C. B.; Lien, H. L., Treatment of chlorinated organic
contaminants with nanoscale bimetallic particles. Catal Today 1998, 40 (4), 387-395.
54. Couto, G. G.; Klein, J. J.; Schreiner, W. H.; Mosca, D. H.; de Oliveira, A. J. A.;
Zarbin, A. J. G., Nickel nanoparticles obtained by a modified polyol process: Synthesis,
characterization, and magnetic properties. J Appl Polym Sci 2007, 311 (2), 461-468.

32
55. Eluri, R.; Paul, B., Synthesis of nickel nanopartices by hydrazine reduction
mechanistic study and continuous flow synthesis. J Nanopart Res 2012, 14, 800-814.
56. Anthony, J. W.; Bideaux, R. A.; Bladh, K. W.; Nichols, M. C., Handbook of
mineralogy. Mineral Data Publishing: Tucson, 1995.
57. Tsurin, V. A.; Yermakov, A. Y.; Uimin, M. A.; Mysik, A. A.; Shchegoleva, N.
N.; Gaviko, V. S.; Maikov, V. V., Synthesis, structure, and magnetic properties of iron
and nickel nanoparticles encapsulated into carbon. Phys Solid State 2013, 56 (2), 287-
301.
58. Hwang, J. H.; Dravid, V. P., Magnetic properties of graphitically encapsulated
nickel nanocrystals. J Mater Res 1996, 12 (4).
59. Wu, S.-H.; Chen, D.-H., Synthesis and characterization of nickel nanoparticles by
hydrazine reduction in ethylene glycol. J Colloid Interf Sci 2003, 259, 282-286.
60. Chen, D.-H.; Hsieh, C.-H., Synthesis of nickel nanoparticles in aqueous cationic
surfactant solutions. J Mat Chem 2002, 12, 2412-2415.
61. Degen, A.; Macek, J., Preparation of submicrometer nickel powders by the
reduction from nonaqueous media. Nanostruct Mater 1999, 12 (1-4), 225-228.
62. Koltypin, Y.; Fernandez, A.; Rojas, T. C.; Campora, J.; Palma, P.; Prozorov, R.;
Gedanken, A., Encapsulation of nickel nanoparticles in carbon obtained by the
sonochemical decomposition of Ni(C8H12)2. Chem Mater 1999, 11 1331-1335.
63. De Caro, D.; Bradley, J. S., Surface spectroscopic study of carbon monoxide
adsorption on nanoscale nickel colloids prepared from a zerovalent organometallic
precursor. Langmuir 1997, 13, 3067-3069.
64. Zhang, H. T.; Wu, G.; Chen, X. H.; Qiu, X. G., Synthesis and magnetic properties
of nickel nanocrystals. Mater Res Bull 2006, 41 (3), 495-501.
65. Steigerwald, M. L.; Alivisatos, A. P.; Gibson, J. M.; Harris, T. D.; Kortan, R.;
Muller, A. J.; Thayer, A. M.; Duncan, T. M.; Douglass, D. C.; Brus, L. E., Surface
derivatization and isolation of semiconductor cluster molecules. J Am Chem Soc 1988,
110 (10), 3046-3050.
66. Wu, Z. G.; Munoz, M.; Montero, O., The synthesis of nickel nanoparticles by
hydrazine reduction. Adv Powder Technol 2010, 21 (2), 165-168.
67. Teja, A. S.; Koh, P. Y., Synthesis, properties, and applications of magnetic iron
oxide nanoparticles. Prog Cryst Growth Ch 2009, 55 (1-2), 22-45.
68. Parkinson, G. S., Iron oxide surfaces. Surf Sci Rep 2016, 71 (1), 272-365.

33
69. Bertelsen, P.; Goetz, W.; Madsen, M. B.; Kinch, K. M.; Hviid, S. F.; Knudsen, J.
M.; Gunnlaugsson, H. P.; Merrison, J.; Nornberg, P.; Squyres, S. W.; Bell, J. F., 3rd;
Herkenhoff, K. E.; Gorevan, S.; Yen, A. S.; Myrick, T.; Klingelhofer, G.; Rieder, R.;
Gellert, R., Magnetic properties experiments on the Mars exploration Rover Spirit at
Gusev Crater. Science 2004, 305 (5685), 827-829.
70. Cornell, R. M.; Schwertmann, U., The iron oxides: Structure, properties,
reactions, occurrences and uses. Wiley-VCH: Weinheim, 2003.
71. Kishkinev, D. A.; Chernetsov, N. S., Magnetoreception systems in birds: a review
of current research. Biol Bull Rev 2015, 5, 46-62.
72. Kirschvink, J. L.; Kobayashi-Kirschvink, A.; Woodford, B. J., Magnetite
biomineralization in the human brain. P Natl Acad Sci USA 1992, 89 (16), 7683-7687.
73. Frankel, R. B.; Blakemore, R. P.; Wolfe, R. S., Magnetite in fresh water
magnetotactic bacteria. Science 1979, 203, 1355-1356.
74. Tartaj, P.; Morales, M. P.; Gonzalez-Carreño, T.; Veintemillas-Verdaguer, S.;
Serna, C. J., The iron oxides strike back: From biomedical applications to energy storage
devices and photoelectrochemical water splitting. Adv Mater Res 2011, 23 (5246-5249).
75. Bowker, M.; Hutchings, G.; Davies, P. R.; Edwards, D.; Davies, R.;
Shaikhutdinov, S.; Freund, H. J., Surface structure of gamma-Fe2O3 (111). Surf Sci 2012,
606 (21-22), 1594-1599.
76. Prene, P.; Tronc, E.; Jolivet, J.-P.; Livage, J., Magnetic properties of isolated -
Fe2O3 particles IEEE Trans Magn 1993, 29 (6), 2658 - 2660.
77. Dutta, P.; Manivannan, A.; Seehra, M. S.; Shah, N.; Huffman, G. P., Magnetic
properties of nearly defect-free maghemite nanocrystals. Phys Rev B 2004, 70 (17),
174428.
78. Bansal, A.; Yang, H.; Li, C.; Cho, K.; Benicewicz, B. C.; Kumar, S. K.; Schadler,
L. S., Quantitative equivalence between polymer nanocomposites and thin polymer films.
Nat Mater 2005, 4 (9), 693-698.
79. Putz, K.; Krishnamoorti, R.; Green, P. F., The role of interfacial interactions in
the dynamic mechanical response of functionalized SWNT-PS nanocomposites. Polymer
2007, 48 (12), 3540-3545.
80. Putz, K. W.; Mitchell, C. A.; Krishnamoorti, R.; Green, P. F., Elastic modulus of
single-walled carbon nanotube/poly(methyl methacrylate) nanocomposites. J Polym Sci
Pol Phys 2004, 42 (12), 2286-2293.

34
81. Ramanathan, T.; Liu, H.; Brinson, L. C., Functionalized SWNT/polymer
nanocomposites for dramatic property improvement. J Polym Sci Pol Phys 2005, 43 (17),
2269-2279.
82. Mittal, V., Need of new surface modification In Polymer Nanocomposites:
Advances in Filler Surface, Nova Science Publishers: New York, 2009.
83. Iijima, M.; Kamiya, H., Surface modification for improving the stability of
nanoparticles in liquid media. Kona Powder Part J 2009, 27 (27), 119-129.
84. Kolb, H. C.; Finn, M. G.; Sharpless, K. B., Click chemistry: Diverse chemical
function from a few good reactions. Angew Chem Int Edit 2001, 40 (11), 2004-2021.
85. Caruso, F., Nanoengineering of particle surfaces. Adv Mater Res 2001, 13 (1), 11–
22.
86. Bhattachary, A.; Misra, B. N., Grafting: a versatile means to modify polymers:
Techniques, factors and applications. Prog Polym Sci 2004, 29, 767-814.
87. Berger, S.; Synytska, A.; Ionov, L.; Elchhorn, K. J.; Stamm, M., Stimuli-
responsive bicomponent polymer janus particles by “grafting from”/“grafting to”
approaches. Macromolecules 2008, 41, 9669-9676.
88. Hu, H.; Saniger, J.; Garcia-Alejandre, J.; Castano, V. M., Fourier transform
infrared spectroscopy studies of the reaction between polyacrylic acid and metal oxides.
Mater Lett 1991, 12 (4), 281-285.
89. Wu, X. F.; Ding, Z.; Wang, W.; Song, N. N.; Khaimanov, S.; Tsidaeva, N., Effect
of polyacrylic acid addition on structure, magnetic and adsorption properties of
manganese ferrite nanoparticles. Powder Technol 2016, 295, 59-68.
90. Xiong, P.; Chen, Q.; He, M. Y.; Sun, X. Q.; Wang, X., Cobalt ferrite-polyaniline
heteroarchitecture: a magnetically recyclable photocatalyst with highly enhanced
performances. J Mater Chem 2012, 22 (34), 17485-17493.
91. Zhao, X. R.; Wang, W.; Zhang, Y. J.; Wu, S. Z.; Li, F.; Liu, J. P., Synthesis and
characterization of gadolinium doped cobalt ferrite nanoparticles with enhanced
adsorption capability for Congo Red. Chem Eng J 2014, 250, 164-174.
92. Chen, R.; Wang, W.; Zhao, X. R.; Zhang, Y. J.; Wu, S. Z.; Li, F., Rapid
hydrothermal synthesis of magnetic CoxNi1-xFe2O4 nanoparticles and their application on
removal of Congo red. Chem Eng J 2014, 242 (2014), 226-233.

35
93. Cheng, Y. H.; Chen, Z.; Zhu, M. F.; Lu, Y. F., Polyacrylic acid assisted assembly
of oxide particles and carbon nanotubes for high-performance flexible battery anodes.
Adv Energy Mater 2015, 5 (6), 1401207.
94. Wu, H. X.; Wang, T. J.; Jin, Y., Effects of -OH groups on Fe3O4 particles on the
heterogeneous coating in a hydrous alumina coating process. Ind Eng Chem Res 2007, 46
(3), 761-766.
95. Fresnais, J.; Yan, M.; Courtois, J.; Bostelmann, T.; Bee, A.; Berret, J. F.,
Poly(acrylic acid)-coated iron oxide nanoparticles: quantitative evaluation of the coating
properties and applications for the removal of a pollutant dye. J Colloid Interf Sci 2013,
395, 24-30.
96. Fresnais, J.; Berret, J. F.; Frka-Petesic, B.; Sandre, O.; Perzynski, R., Electrostatic
co-assembly of iron oxide nanoparticles and polymers: Towards the generation of highly
persistent superparamagnetic nanorods. Adv Mater Res 2008, 20 (20), 3877–3881.
97. Uyama, Y.; Kato, K.; Ikada, Y., Surface modification of polymers by grafting. In
Adv Polym Sci, Springer: Berlin, 1998; pp 1-39.
98. Ligoure, C.; Leibler, L., Thermodynamics and kinetics of grafting end-
functionalized polymers to an interface. J Phys-Paris 1990, 51 (12), 1313-1328.
99. Guiselin, O., Irreversable adsorption of a concentrated polymer solution.
Europhys Lett 1991, 17 (3), 225-230.
100. Coleman, M. M.; Draf, J. F.; Painter, P. C., Specific interactions and the
miscibility of polymer blends. Technomic Publishing: Lancaster, 1991.
101. Dong, J.; Ozaki, Y.; Nakashima, K., Infrared, Raman, and near-infrared
spectroscopic evidence for the coexistence of various hydrogen-bond forms in
poly(acrylic acid). Macromolecules 1997, 30 (4), 1111-1117.
102. Water-soluble polymers: Synthesis, solution properties, and applications.
Americal Chemical Society: Washington, DC, 1991; Vol. 467.
103. Usaitis, A.; Maunu, S. L.; Tenhu, H., Aggregation of the interpolymer complex of
poly(methacrylic acid) and poly(vinyl pyrrolidone) in aqueous solutions. Eur Polym J
1997, 33 (2), 219-223.
104. Illiopoulos, I.; Halary, J. L.; Audebert, R., Polymer complexes stabilized through
hydrogen bonds. Influence of “structure defects” on complex formation: Viscometry and
fluorescence polarization measurements. J Polym Sci A Polym Chem 1988, 26, 275-284.

36
105. Zhu, L.; Jiang, M.; Liu, L.; Zhou, H.; Fan, L. J.; Zhang, Y.; Zhang, Y. B.; Wu, C.,
Intermacromolecular complexation due to specific interactions. 6. Miscibility and
complexation between poly{styrene-co-[p(2-hydroxypropan-2-yl)Styrene]} and poly[n-
butyl methacrylate-co-(4-vinylpyridine)]. J Macromol Sci Phys 1998, B37 (6), 805-826.
106. Kaczmarek, H.; Szalla, A.; Kaminska, A., Study of poly(acrylic acid)-
poly(vinylpyrrolidone) complexes and their photostability. Polymer 2001, 42 (14), 6057-
6069.
107. Phillipp, B.; Dautzenberg, H.; Linow, K. J.; Kotz, J.; Dawydoff, W.,
Polyelectrolyte complexes - recent developments and open problems. Prog Polym Sci
1988, 14, 91-172.
108. Tripathi, B. P.; Dubey, N. C.; Stamm, M., Functional polyelectrolyte multilayer
membranes for water purification applications. J Hazard Mater 2013, 252-253, 401-12.
109. Nypelo, T.; Osterberg, M.; Zu, X. J.; Laine, J., Preparation of ultrathin coating
layers using surface modified silica nanoparticles. Colloids Surf A 2011, 392 (1), 313-
321.
110. Shannon, P. C.; Lochhead, R. Y., Polyacid microstructural effects in
complexation with poly(vinylpyrrolidone). Polym Prepr ACS 1996, 37, 471.
111. Chatterjee, S. K.; Sethi, K. R.; Yadav, D., Selectivity in interpolymer
complexation involving nonionic polymers, polycarboxylic acid and phenolic polymer.
Polymer 1987, 28 (3), 519-524.
112. Chatterjee, S. K.; Yadav, J. B.; Sethi, K. R., Influence of grafting on the
thermodynamic parameters and stability constants of some intermacromolecular
complexes of poly(methacrylic acid) and a graft copolymer. Angew Makromol Chem
1987, 154, 121-130.
113. Bimendina, L. A.; Roganov, V. V.; Bekturov, E. A., Hydrodynamic properties of
complexes poly(methacrylic acid) - polyvinylpyrrolidone in solutions. Vysokomol Soedin
1974, A16 (12), 2810-2814.
114. Zhou, X.; Goh, S. H.; Lee, S. Y.; Tan, K. L., XPS and FTi.r. studies of
interactions in poly(carboxylic acid) poly(vinylpyridine) complexes. Polymer 1998, 39
(16), 3631-3640.
115. Wang, L. Y.; Fu, Y.; Wang, Z. Q.; Fan, Y. G.; Zhang, X., Investigation into an
alternating multilayer film of poly(4-vinylpyridine) and poly(acrylic acid) based on
hydrogen bonding. Langmuir 1999, 15 (4), 1360-1363.

37
116. Fujimori, K.; Trainor, G.; Costigan, M., Complexation and rate of polymerization
of acrylic acid and methacrylic acid in the presence of poly(4-vinylpyridine) in dilute
methanol solution. J Polym Sci A Polym Chem 1984, 22, 2479-2487.
117. Faure, B.; Wetterskog, E.; Gunnarsson, K.; Josten, E.; Hermann, R. P.; Bruckel,
T.; Andreasen, J. W.; Meneau, F.; Meyer, M.; Lyubartsev, A.; Bergstrom, L.; Salazar-
Alvarez, G.; Svedlindh, P., 2D to 3D crossover of the magnetic properties in ordered
arrays of iron oxide nanocrystals. Nanoscale 2013, 5 (3), 953-60.
118. Erb, R. M.; Libanori, R.; Rothfuchs, N.; Studart, A. R., Composites reinforced in
three dimensions by using low magnetic fields. Science 2012, 335 (6065), 199-204.
119. Odenbach, S., Ferrofluids - magnetically controlled suspensions. Colloid Surf A
2003, 217 (1-3), 171-178.
120. Libanori, R.; Munch, F. H. L.; Montenegro, D. M.; Studart, A. R., Hierarchical
reinforcement of polyurethane-based composites with inorganic micro- and nanoplatelets.
Compos Sci Technol 2012, 72 (3), 435-445.
121. Bonderer, L. J.; Studart, A. R.; Gauckler, L. J., Bioinspired design and assembly
of platelet reinforced polymer films. Science 2008, 319 (5866), 1069-1073.
122. Lin, T. H.; Huang, W. H.; Jun, I. K.; Jiang, P., Bioinspired assembly of surface-
roughened nanoplatelets. J Colloid Interf Sci 2010, 344 (2), 272-278.
123. Gurbuz, S. N.; Dericioglu, A. F., Effect of reinforcement surface functionalization
on the mechanical properties of nacre-like bulk lamellar composites processed by a
hybrid conventional method. Mat Sci Eng C-Mater 2013, 33 (4), 2011-2019.
124. Bonderer, L. J.; Feldman, K.; Gauckler, L. J., Platelet-reinforced polymer matrix
composites by combined gel-casting and hot-pressing. Part II: Thermoplastic
polyurethane matrix composites. Compos Sci Technol 2010, 70 (13), 1966-1972.
125. Kacir, L.; Narkis, M.; Ishai, O., Aligned short glass fiber-epoxy composites.
Composites 1978, 9 (2), 89-92.
126. Corni, I.; Harvey, T. J.; Wharton, J. A.; Stokes, K. R.; Walsh, F. C.; Wood, R. J.,
A review of experimental techniques to produce a nacre-like structure. Bioinspir Biomim
2012, 7 (3), 031001.
127. Libanori, R.; Erb, R. M.; Studart, A. R., Mechanics of Platelet-Reinforced
Composites Assembled Using Mechanical and Magnetic Stimuli. ACS Applied Materials
& Interfaces 2013, 5 (21), 10794-10805.

38
128. Erb, R. M.; Cherenack, K. H.; Stahel, R. E.; Libanori, R.; Kinkeldei, T.;
Munzenrieder, N.; Troster, G.; Studart, A. R., Locally Reinforced Polymer-Based
Composites for Elastic Electronics. ACS Applied Materials & Interfaces 2012, 4 (6),
2860-2864.
129. Erb, R. M.; Sander, J. S.; Grisch, R.; Studart, A. R., Self-shaping composites with
programmable bioinspired microstructures. Nat Commun 2013, 4, 1712.
130. Kokkinis, D.; Schaffner, M.; Studart, A. R., Multimaterial magnetically assisted
3D printing of composite materials. Nat Commun 2015, 6, 8643.
131. Le Ferrand, H.; Bouville, F.; Niebel, T. P.; Studart, A. R., Magnetically assisted
slip casting of bioinspired heterogeneous composites. Nat Mater 2015, 14 (11), 1172-9.
132. Martin, J. J.; Fiore, B. E.; Erb, R. M., Designing bioinspired composite
reinforcement architectures via 3D magnetic printing. Nat Commun 2015, 6, 8641.
133. Studart, A. R.; Erb, R. M., Bioinspired Materials that Self-Shape through
Programmed Microstructures. Soft Matter 2014, 10.
134. Trotsenko, O.; Tokarev, A.; Gruzd, A.; Enright, T.; Minko, S., Magnetic field
assisted assembly of highly ordered percolated nanostructures and their application for
transparent conductive thin films. Nanoscale 2015, 7 (16), 7155-7161.
135. Yuan, C.; Duan, B.; Li, L.; Xie, B.; Huang, M.; Luo, X., Thermal conductivity of
polymer-based composites with magnetic aligned hexagonal boron nitride platelets. ACS
Appl Mater Interfaces 2015, 7 (23), 13000-6.
136. Lin, Z.; Liu, Y.; Raghavan, S.; Moon, K. S.; Sitaraman, S. K.; Wong, C. P.,
Magnetic alignment of hexagonal boron nitride platelets in polymer matrix: toward high
performance anisotropic polymer composites for electronic encapsulation. ACS Appl
Mater Interfaces 2013, 5 (15), 7633-40.
137. Kim, K.; Ju, H.; Kim, J., Vertical particle alignment of boron nitride and silicon
carbide binary filler system for thermal conductivity enhancement. Composites Science
and Technology 2016, 123, 99-105.
138. Yamamoto, N.; Manohara, H.; Platzman, E., Magnetically anisotropic additive for
scalable manufacturing of polymer nanocomposite: iron-coated carbon nanotubes. Mater
Res Express 2016, 3 (2).
139. Malkina, O.; Mahfuz, H.; Sorge, K.; Rondinone, A.; Chen, J.; More, K.; Reeves,
S.; Rangari, V., Magnetic Alignment of SWCNTs Decorated with Fe3O4 to Enhance
Mechanical Properties of SC-15 Epoxy. Aip Advances 2013, 3 (4).

39
140. Kazemikia, K.; Bonabi, F.; Asadpoorchallo, A.; Shokrzadeh, M., Influence of the
concentration of carbon nanotubes on electrical conductivity of magnetically aligned
MWCNT-polypyrrole composites. B Mater Sci 2016, 39 (2), 457-462.
141. Pech-May, N. W.; Vales-Pinzon, C.; Vega-Flick, A.; Cifuentes, A.; Oleaga, A.;
Salazar, A.; Alvarado-Gil, J. J., Study of the Thermal Properties of Polyester Composites
Loaded with Oriented Carbon Nanofibers Using the Front-Face Flash Method. Polymer
Testing 2016, 50, 255-261.
142. Das, A.; Raffi, M.; Megaridis, C.; Fragouli, D.; Innocenti, C.; Athanassiou, A.,
Magnetite (Fe3O4)-filled carbon nanofibers as electro-conducting/superparamagnetic
nanohybrids and their multifunctional polymer composites. Journal of Nanoparticle
Research 2015, 17 (1).
143. Lv, F. Z.; Xu, L. N.; Xu, Z. X.; Fu, L. L.; Zhang, Y. H., Fabrication and
characterization of the orientated MMT/PI composite films via relatively low magnetic
field. J Appl Polym Sci 2015, 132 (1), 41224.
144. Yan, H. Y.; Tang, Y. X.; Long, W.; Li, Y. F., Enhanced thermal conductivity in
polymer composites with aligned graphene nanosheets. J Mater Sci 2014, 49 (15), 5256-
5264.
145. Yan, H. Y.; Wang, R. R.; Li, Y. F.; Long, W., Thermal conductivity of
magnetically aligned graphene-polymer composites with Fe3O4-decorated graphene
nanosheets. J Electron Mater 2015, 44 (2), 658-666.
146. Ding, L.; Liu, L. P.; Li, P. G.; Lv, F. Z.; Tong, W. S.; Zhang, Y. H., Dielectric
Properties of Graphene-Iron Oxide/Polyimide Films with Oriented Graphene. Journal of
Applied Polymer Science 2016, 133 (12).
147. Le Ferrand, H.; Bolisetty, S.; Demirors, A. F.; Libanori, R.; Studart, A. R.;
Mezzenga, R., Magnetic assembly of transparent and conducting graphene-based
functional composites. Nat Commun 2016, 7, 12078.
148. Wang, M. S.; He, L.; Zorba, S.; Yin, Y. D., Magnetically Actuated Liquid
Crystals. Nano Letters 2014, 14 (7), 3966-3971.
149. Martin, J. J.; Riederer, M. S.; Krebs, M. D.; Erb, R. M., Understanding and
Overcoming Shear Alignment of Fibers during Extrusion. Soft Matter 2015, 11 (2), 400-
405.
150. Li, D. S.; Liu, Z. Y.; Al-Haik, M.; Tehrani, M.; Murray, F.; Tannenbaum, R.;
Garmestani, H., Magnetic alignment of cellulose nanowhiskers in an all-cellulose
composite. Polym Bull 2010, 65 (6), 635-642.
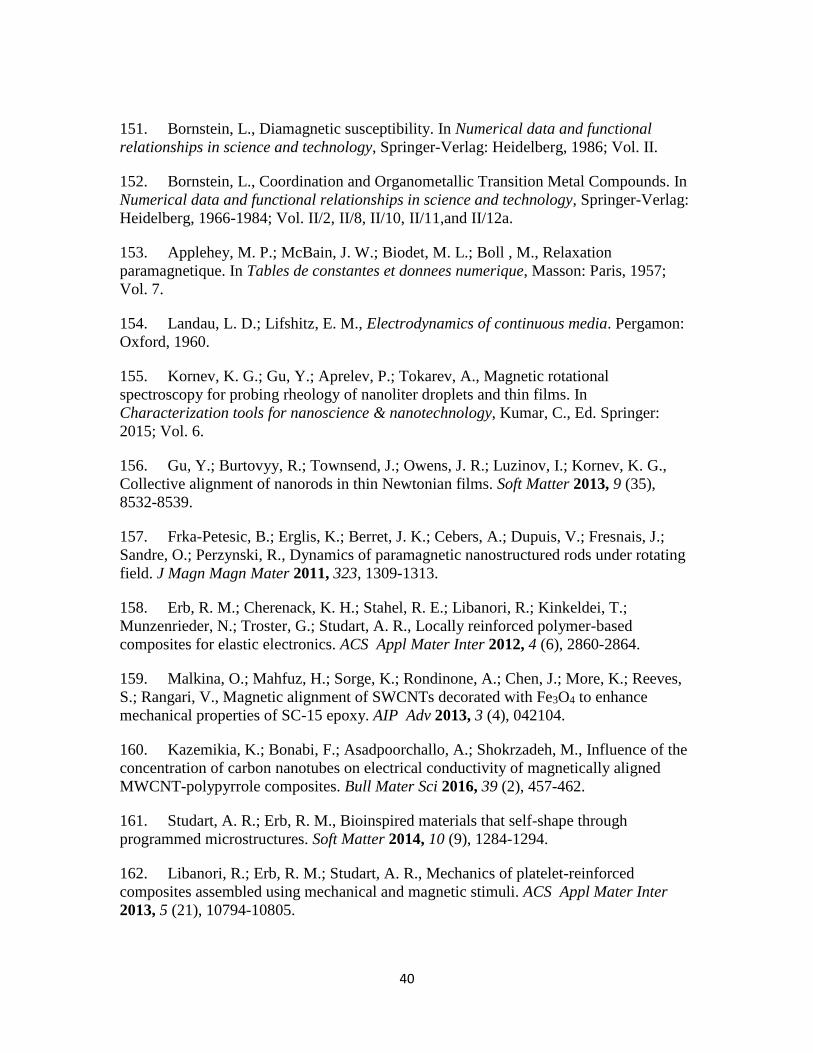
40
151. Bornstein, L., Diamagnetic susceptibility. In Numerical data and functional
relationships in science and technology, Springer-Verlag: Heidelberg, 1986; Vol. II.
152. Bornstein, L., Coordination and Organometallic Transition Metal Compounds. In
Numerical data and functional relationships in science and technology, Springer-Verlag:
Heidelberg, 1966-1984; Vol. II/2, II/8, II/10, II/11,and II/12a.
153. Applehey, M. P.; McBain, J. W.; Biodet, M. L.; Boll , M., Relaxation
paramagnetique. In Tables de constantes et donnees numerique, Masson: Paris, 1957;
Vol. 7.
154. Landau, L. D.; Lifshitz, E. M., Electrodynamics of continuous media. Pergamon:
Oxford, 1960.
155. Kornev, K. G.; Gu, Y.; Aprelev, P.; Tokarev, A., Magnetic rotational
spectroscopy for probing rheology of nanoliter droplets and thin films. In
Characterization tools for nanoscience & nanotechnology, Kumar, C., Ed. Springer:
2015; Vol. 6.
156. Gu, Y.; Burtovyy, R.; Townsend, J.; Owens, J. R.; Luzinov, I.; Kornev, K. G.,
Collective alignment of nanorods in thin Newtonian films. Soft Matter 2013, 9 (35),
8532-8539.
157. Frka-Petesic, B.; Erglis, K.; Berret, J. K.; Cebers, A.; Dupuis, V.; Fresnais, J.;
Sandre, O.; Perzynski, R., Dynamics of paramagnetic nanostructured rods under rotating
field. J Magn Magn Mater 2011, 323, 1309-1313.
158. Erb, R. M.; Cherenack, K. H.; Stahel, R. E.; Libanori, R.; Kinkeldei, T.;
Munzenrieder, N.; Troster, G.; Studart, A. R., Locally reinforced polymer-based
composites for elastic electronics. ACS Appl Mater Inter 2012, 4 (6), 2860-2864.
159. Malkina, O.; Mahfuz, H.; Sorge, K.; Rondinone, A.; Chen, J.; More, K.; Reeves,
S.; Rangari, V., Magnetic alignment of SWCNTs decorated with Fe3O4 to enhance
mechanical properties of SC-15 epoxy. AIP Adv 2013, 3 (4), 042104.
160. Kazemikia, K.; Bonabi, F.; Asadpoorchallo, A.; Shokrzadeh, M., Influence of the
concentration of carbon nanotubes on electrical conductivity of magnetically aligned
MWCNT-polypyrrole composites. Bull Mater Sci 2016, 39 (2), 457-462.
161. Studart, A. R.; Erb, R. M., Bioinspired materials that self-shape through
programmed microstructures. Soft Matter 2014, 10 (9), 1284-1294.
162. Libanori, R.; Erb, R. M.; Studart, A. R., Mechanics of platelet-reinforced
composites assembled using mechanical and magnetic stimuli. ACS Appl Mater Inter
2013, 5 (21), 10794-10805.

41
163. Li, D. S.; Liu, Z. Y.; Al-Haik, M.; Tehrani, M.; Murray, F.; Tannenbaum, R.;
Garmestani, H., Magnetic alignment of cellulose nanowhiskers in an all-cellulose
composite. Polym Bull 2010, 65 (6), 635-642.
164. Moaseri, E.; Karimi, M.; Baniadam, M.; Maghrebi, M., Improvements in
mechanical properties of multi-walled carbon nanotube-reinforced epoxy composites
through novel magnetic-assisted method for alignment of carbon nanotubes. Compos A-
Appl Sci Manuf 2014, 64, 228-233.
165. Wang, M. S.; He, L.; Zorba, S.; Yin, Y. D., Magnetically actuated liquid crystals.
Nano Lett 2014, 14 (7), 3966-3971.
166. Le Ferrand, H.; Bolisetty , S.; Demirors, A. F.; Libanori, R.; Studart, A. R.;
Mezzenga, R., Magnetic assembly of transparent and conducting graphene-based
functional composites. Nat Commun 2016, 7, 12078.
167. Ding, L.; Liu, L. P.; Li, P. G.; Lv, F. Z.; Tong, W. S.; Zhang, Y. H., Dielectric
properties of graphene-iron oxide/polyimide films with oriented graphene. J Appl Polym
Sci 2016, 133 (12), 43041.
168. Pech-May, N. W.; Vales-Pinzon, C.; Vega-Flick, A.; Cifuentes, A.; Oleaga, A.;
Salazar, A.; Alvarado-Gil, J. J., Study of the thermal properties of polyester composites
loaded with oriented carbon nanofibers using the front-face flash method. Polym Test
2016, 50, 255-261.
169. Kim, K.; Ju, H.; Kim, J., Vertical particle alignment of boron nitride and silicon
carbide binary filler system for thermal conductivity enhancement. Compos Sci Technol
2016, 123, 99-105.
170. Halpin, J. C.; Kardos, J. L., Halpin-tsai equations - review. Polym Eng Sci 1976,
16 (5), 344-352.
171. McCrum, N. G.; Buckley, C. P.; Bucknall, C. B., Principles of polymer
engineering. 2nd ed.; Oxford Univeristy Press: Oxford, New York, 1997.
172. Tsai, S. W.; Pagano, N. J., Invariant properties of composite materials In
Composite materials workshop, Tsai S. W.; Halpin, J. C.; Pagano, N. J., Eds. Technomic
Publishing Company: St. Louis, 1968; p 233.
173. Nielsen, L. E., Mechanical properties of polymers and composites. Dekker: New
York, 1974; Vol. 2, p 462.
174. Fornes, T. D.; Paul, D. R., Modeling properties of nylon 6/clay nanocomposites
using composite theories. Polymer 2003, 44 (17), 4993-5013.

42
175. Broutman, L. J.; Krock, R. H., Interfaces in polymer matrix composites.
Academic Press: New York, London, 1974; Vol. 6.
176. Chen, L.; Jin, H.; Xu, Z. W.; Shan, M. J.; Tian, X.; Yang, C. Y.; Wang, Z.;
Cheng, B. W., A design of gradient interphase reinforced by silanized graphene oxide
and its effect on carbon fiber/epoxy interface. Mater Chem Phys 2014, 145 (1-2), 186-
196.
177. Qin, W. Z.; Vautard, F.; Askeland, P.; Yu, J. R.; Drzal, L., Modifying the carbon
fiber-epoxy matrix interphase with silicon dioxide nanoparticles. RSC Adv 2015, 5 (4),
2457-2465.
178. Cheng, X.; Putz, K. W.; Wood, C. D.; Brinson, L. C., Characterization of local
elastic modulus in confined polymer films via AFM indentation. Macromol Rapid Comm
2015, 36 (4), 391-397.
179. Wang, S. Q.; Nair, S.; Hurley, D.; Lee, S. H., Characterizing interphase properties
in fiber reinforced polymer composite with advanced AFM based tools. Adv Mater Res
2010, 123-125, 403-406.

43
CHAPTER THREE
MODIFICATION OF SIC WHISKERS WITH NICKEL NANOPARTICLES
3.1: Introduction
This chapter is devoted to the synthesis and characterization of NiNPs, the
nanoparticles surface modification via polymer grafting, and the attachment of NiNPs to
the surface of SiCWs using polymer-to-polymer complexation. There are several major
methods for the preparation of nanoparticles1-5. To obtain NiNPs, we selected a chemical
procedure published elsewhere6. This method was chosen because it yields nickel
nanoparticles with no surface modifiers and of a controllable size. Thus, the surface of the
NiNPs could be readily modified without further processing. To anchor NiNPs to SiCWs
the particles were modified with P2VP grafted layer. To modify the surfaces, the melt state
“grafting to” method was used to attach carboxyl-terminated P2VP to the SiCWs and PAA
to the NiNPs7-10. Then, polymer-to-polymer complexation, between the basic pyridine
groups of P2VP and acid carboxyl groups of PAA, was used to attach the NiNPs to the
surface of the SiCWs11. To the best of our knowledge, the attachment of nanoparticles to
SiCWs using this type of complexation has never been carried out before.
3.2: Experimental
3.2.1: The Synthesis of Nickel Nanoparticles
The prepared NiNPs were the result of four different synthesis involving the same
initial formulation of reactants. In general, we followed the procedure described by Wu et
al6. The assumed chemical mechanism of the reaction used is described in the article as
follows:

44
Ni2+ + 6C2H5OH → [Ni(C2H5OH)6]2+ (3.1)
[Ni(C2H5OH)6]2+ + mN2H4 → 6C2H5OH + [Ni(N2H4)m]2+ (3.2)
[Ni(N2H4)m]2+ + 2OH- → Ni(OH)2 + mN2H4 (3.3)
2Ni(OH)2 + N2H4 → 2Ni + N2 + 4H2O (3.4)
According to the authors of the article6, a 1:5:10 molar ratio of Ni2+:N2H2:KOH
yielded the smallest NiNPs. To reproduce these results, the temperature of the solution was
monitored using a thermometer in the outer water bath. The mixing of the solution was
done in a closed flask either by magnetic stirring at a constant rate of 60 rpms or by
sonication using a VWR SymphonyTM heated sonicator. As the reaction reached
completion, the color of the solution changed from bluish green to dark black12. The
synthetic conditions employed to fabricate NiNPs are shown in Table 3.1.
Table 3.1: Synthetic conditions for NiNPs fabrication.
Synthesis of NiNPs Temperature (oC) Mixing technique Time (hours)
S1 24±2 magnetic stirring 2
S2 24±2 sonication 2
S3 22 - 42 sonication 2
S4 37±4 sonication 2
S1 and S2 are the same reactions with different mixing techniques. The temperature
in S3 synthesis was varied by constantly increasing it over 2 hours from 22 oC to 42 oC.
Lastly, S4 was conducted at 37 oC to investigate the effect of increased temperature on the
product. The obtained nanoparticles were dispersed in water and cleaned 3 times by
centrifugation at 5000 RPMs for 15 min. using a Precision Durafuge 100 centrifuge and
redispresing in water. Finally, the NiNPs were transferred to methanol, magnetically
separated, and redispersed into fresh methanol to reduce oxidation.

45
3.2.2: Modification of Model Nickel Surfaces with PGMA and polyethylene glycol
(PEG)
Model nickel surfaces were obtained by sputtering Ni onto a Si wafer using physical
vapor deposition (PVD) technique. The obtained nickel films were cleaned by 18 W air
plasma for 5 min13. Then, the samples were rinsed with high-purity DI water and dried in
a stream of ultra-high purity nitrogen. These nickel films were dip-coated with a 3 wt. %
PGMA solution in chloroform. The deposited polymer layers were dried and annealed at
120 oC for 1 hour. Then, the surface morphology and thickness of the polymer layers were
evaluated by atomic force microscopy (AFM) and ellipsometry, respectively.
Next, carboxyl-terminated PEG was used as a model polymer to assess general
polymer graftability to the PGMA covered nickel surface. The powder of PEG (Mw=5,000
g/mol) was deposited onto the surface modified with PGMA. PEG was grafted onto the
surface in a molten state at 115oC for 2 hours to anchor the polymer chains to the surface.
Then, the unattached PEG was washed away by several rising cycles with chloroform. The
surface morphology and thickness of the grafted layer was evaluated by AFM and
ellipsometry, respectively.
3.2.3: Modification of NiNPs with PGMA, PEG, and PAA
The NiNPs were dispersed in methyl ethyl ketone (MEK) at ~0.3 wt. %. Then, this
dispersion was added dropwise to a solution of 1.0 wt. % PGMA (Mn=100,000 g/mol) in
MEK while being constantly sonicated with the SymphonyTM sonicator. The two solutions
were mixed in 1:1 volume ratio. Next, the resulting solution was dried by rotary
evaporation under a nitrogen stream. The dried polymer with dispersed NiNPs was

46
annealed at 60 oC for 30 min. The obtained PGMA-modified NiNPs were cleaned off
residual PGMA three times via centrifugation and redispersing in MEK.
The PGMA-modified NiNPs were dispersed in methanol at ~0.3 wt. % and mixed
with a 1.0 wt. % carboxyl-terminated PEG (Mn=5,000 g/mol) or PAA (Mw=100,000 g/mol)
methanol solution that was sonicated with the SymphonyTM sonicator. The two solutions
were mixed in a 1:1 volume ratio. This resulting solution was rotary evaporated under a
nitrogen stream and annealed at 120 oC for 30 min. for the PAA/NiNPs system and 115 oC
for 2 hours for the PEG/NiNPs system. The PAA and PEG modified NiNPs were cleaned
3 times via centrifugation and redispersing in methanol. The PEG-modified NiNPs were
analyzed by TEM and TGA.
3.2.4: Thermal Cleaning of SiCWs
The Silar SC-9M, silicon carbide whiskers were purchased from Advanced
Composite Materials, LLC. These industrial grade SiCWs were analyzed by TGA to
estimate their purity. As silicon carbide is known for being stable up to 1000 oC in air14,
the weight loss of the SiCWs was used to measure the amount of processing impurities in
the supplied SiCWs. As a standard practice, the TGA was run at 20 oC/min to 700 oC in
air. An example of the TGA trace is shown in Figure 3.1.
The weight reduction of the sample observed below 500 oC was assigned to the
reaction of processing impurities with air. The composition of the impurities was not
characterized. However, silicon carbide is known to accumulate oxygen and free carbon
on its surface14. These surface impurities caused a 0.2 wt. % weight loss at 500 oC. As a

47
result of these findings, the temperature of 400 oC was chosen to clean the SiCWs by
burning off any of the possible impurities in air.
Typically, 1 g of the SiCWs was cleaned at a time. First, the SiCWs were placed
into a non-glazed ceramic porcelain crucible (stable until 1200 oC). Next, the crucible with
the SiCWs was placed into the center of a Lindberg/Blue 1000 oC ceramic lined oven with
a Eurotherm 2416 temperature controller. The oven was then heated to 400 oC in 20 min.
and held at 400 oC for one hour. Then, the oven was cooled down to room temperature at
~3 oC/min. in air at atmospheric pressure. The controlled heating and cooling rate were
used to reduce residual thermal stresses in the SiCWs. After this thermal cleaning, the
SiCWs were again tested for impurities using TGA. The TGA was run in air at 20 oC/min
to 700 oC (Figure 3.2). The cleaned SiCWs had a minute weight gain of 0.02 wt. % by 700
oC.
Figure 3.1: TGA of as-received SiCWs.

48
The thermal cleaning treatment was instrumental in clearing the surface off
impurities and making the surface functional groups available for further modification. A
SEM image was obtained to show the appearance of the cleaned SICWs (Figure 3.3).
Figure 3.2: TGA of thermally cleaned SiCWs.
Figure 3.3: SEM image of the thermally cleaned SiCWs.

49
3.2.5: Size Separation of SiCWs
The size separation of the industrially manufactured SiCWs was carried out to
reduce the possibility of defects in the composite caused by agglomerates and small
particulates. Agglomerations introduce packed assemblies that resin cannot penetrate
during fabrication. Small particulates are structural defects that considerably decrease the
stress transfer due to their low aspect ratio.
To separate the two unwanted phases from the rest of the SiCW material,
combination of gravity sedimentation and centrifugation was used. First, gravity
sedimentation was utilized to separate SiCWs agglomerates. Acetone was chosen as the
liquid media for the sedimentation, because stable dispersion of SiCWs could be obtained
in this solvent. The working concentration of the whiskers was chosen by comparing the
suspensions’ color change over time. Suspensions of 2, 4, and 8 wt. % were initially
evaluated. The 2 wt. % suspension held its color for the longest time and was used for
further separation procedures. The suspension of 2 wt. % of SiCWs in 40 ml of acetone
was sonicated for 15 min. Then, the 40 ml centrifugation tubes containing the dispersed
SiCWs were shaken vigorously and placed standing straight up for 20 s. Afterwards, the
top portion of the suspension was pipetted off until 10 ml of suspension was left. This
procedure was repeated three more times, producing 90 ml of suspension.
After the gravity sedimentation, a centrifugation separation process was employed
to remove small particulates. They were identified by their inability to sediment during
centrifugation from a methanol suspension. Thus, the SiCWs were dispersed in methanol
and centrifuged at 5000 rpms for 15 min. The sediment was kept, but the top solution was

50
decanted. This centrifugation process was repeated between three to six times before a clear
methanol layer above the sediment of the whiskers was achieved. The separation procedure
was identical for all batches of the SiCWs used in this work. The obtained whiskers were
imaged by SEM and found to have diameters in the range of 0.2–0.6 μm (0.42 μm average)
and lengths from 2 to16 μm (4.2 μm average).
3.2.6: “Grafting to” of PGMA and P2VP to the Silicon Wafer Surface
The silicon wafers were cleaned using a “piranha” solution (1 vol. part of 30 wt. %
solution of hydrogen peroxide and 3 vol. parts of concentrated sulfuric acid) and washed
with deionized (DI) water13. Next, the cleaned silicon wafers were dip-coated in a 3 wt. %
solution of PGMA (Mw=100,000 g/mol) in acetone. The thin polymer layer of PGMA was
dried and annealed at 60 oC for 1 hour in a vacuum oven. Then, the wafer was cleaned three
times by washing it in acetone and dried under a stream of nitrogen. The layer thickness
and morphology were determined by ellipsometry and AFM, respectively.
Next, a 1 wt% solution of P2VP (Mw=53,000 g/mol) in MEK was dip-coated onto
the surface of the PGMA-modified silicon wafer. The polymer films were annealed at 115
oC overnight in a vacuum oven. The excess P2VP was removed by rinsing with MEK three
times. The surface thickness and morphology were determined by ellipsometry and AFM,
respectively.
3.2.7: “Grafting to” of PGMA and P2VP to SiCWs
The SiCWs were dispersed in acetone at ~0.1 wt. %. Then, this dispersion was
added dropwise to a 1.0 wt. % solution of PGMA (Mw=100,000 g/mol) in acetone. The

51
solutions were mixed in 1:1 volume ratio while being sonicated with the SymphonyTM
sonicator. The resulting suspension was dried by rotary evaporation under a stream of
nitrogen and annealed at 60 oC for 1 hour. The PGMA-modified SiCWs were then cleaned
three times by centrifugation and redispersing in acetone.
Next, the PGMA-modified SiCWs were dispersed in MEK at ~0.1 wt. %. The
SiCWs dispersion in MEK were added dropwise to a sonicated 1.0 wt. % solution of
carboxyl-terminated P2VP (Mw=53,000 g/mol) and MEK. The two solutions were added
in a 1:1 volume ratio. Then, the MEK was rotary evaporated under a stream of nitrogen
and the resulting film was annealed at 115 oC for 24 hours. These P2VP-modified SiCWs
were cleaned three times in MEK by centrifugation and redispersing in the fresh solvent
and transferred to methanol.
3.2.8: Modification of Silicon Wafers with Epoxy Silane and P2VP
A silicon wafer was cleaned using “piranha” solution and washed with DI water.
Then, the cleaned silicon wafer was placed into a 5 wt. % solution of epoxy silane ((3-
glycidyloxypropyl) trimethoxysilane), ES in toluene for 24 hours while being shaken
gently. During this process the epoxy silane was anchored to the wafer’s surface15. This
modified surface was rinsed with toluene and methanol prior to starting the P2VP
grafting process.
The epoxy silane-covered silicon wafers were dip-coated in a 2 wt. % solution of
P2VP in MEK. The obtained polymer film was annealed at 115 oC overnight in a vacuum
oven. Then, the excess P2VP was rinsed off with the solvent three to four times. The

52
thickness and surface morphology of the polymer and epoxy silane films were determined
using ellipsometry and AFM, respectively.
3.2.9: Modification of SiCWs with Epoxy Silane and P2VP
The modification of SiCWs was conducted using the ES solution in toluene.
Namely, 1 wt% suspension of SiCWs in toluene was added dropwise to a 5 wt% ES
solution to reach a 1:1 ES/SiCW ratio by weight. The mixture was shaken for 24 h. Then,
the SiCWs were centrifuged and rinsed with toluene and methanol three times each to
remove any unattached silane. Afterwards, modified SiCWs were transferred to methyl
ethyl ketone (MEK) purchased from Acros Organics.
The epoxy silane covered SiCWs were dispersed in MEK at ~0.2 wt. % and then
added dropwise into a 2 wt. % solution of the P2VP in MEK. The dispersion and the
solution were mixed in a 1:1 volume ratio. Then, the mixture was dried under nitrogen
using rotary evaporator. The P2VP/SiCWs system was annealed at 115 oC for 24 hours in
a vacuum oven. Then, the excess P2VP was removed from the SiCWs by centrifuging and
redispersing the whiskers in MEK three times. The morphology and thickness of the
polymer layer were determined by TEM and TGA, respectively.
3.2.10: Modification of SiC Whiskers with Magnetic NiNPs
After the surface modification of the NiNPs and SiCWs was completed, the NiNPs
were attached to the SiCWs using polymer-polymer complexation. The NiNPs modified
with PAA and the SiCWs covered with P2VP were dispersed in methanol to obtain a 5
mg/ml and 10 mg/ml suspensions, respectively. The NiNP suspension was sonicated for
15 min. Then, the suspension of SiCWs was added dropwise to the NiNP suspension while

53
sonicating over a 15 min. period of time. The mixture was shaken for 24 hours and, then,
separated using gravity sedimentation.
3.2.11: TGA Measurements
TGA was used to determine the weight loss associated with the attached polymer.
The PGMA modified SiCWs were heated at 7 oC/min to 700 oC in air. The modified NiNPs
and SiCWs were heated at 7 oC/min and 20 oC/min to 600 oC in air; 7 oC/min was chosen
to maximize the amount of degradation at a specific temperature, and 20 oC/min was
chosen as a secondary method of measurement.
3.2.12: Procedure for the Calculation of Polymer Thickness from TGA Data
The thickness of polymer bound to the surface of the particulates is directly related
to the amount of weight loss in the TGA experiment and depends on the surface area of the
particulates. It was assumed that the polymer is uniformly distributed across the surface of
the particulates. Equation 3.5 and 3.6 were used to calculate the thickness (t) of the polymer
attached to the cylindrical (whiskers) and spherical (particles) nanoparticulates,
respectively. These equations are derived from geometrical considerations.
𝑡 = 𝑅𝑛𝑝 (√1 +𝑀𝑝𝜌𝑛𝑝
𝑀𝑛𝑝𝜌𝑝− 1) (3.5)
𝑡 = 𝑅𝑛𝑝 (√1 +𝑀𝑝𝜌𝑛𝑝
𝑀𝑛𝑝𝜌𝑝
3− 1) (3.6)
where Rnp is the radius of the nanoparticulate (whisker or nanoparticle), ρnp and ρp are the
densities of the nanoparticulates and polymer, Mp and Mnp are the weight fractions for the
polymer and nanoparticulates as indicated by TGA, respectively.

54
3.2.13: TEM Imaging of the Nanoparticulates
The NiNPs, polymer-modified NiNPs, SiCWs, polymer-modified SiCWs, and
SiCWs modified with NiNP were dispersed in methanol at ~0.5 wt. % and drop-casted onto
an Formvar/carbon TEM grid. Then, the particles were imaged employing a Hitachi 7600
TEM operated in a high-resolution mode. Using the Hitachi HD2000, the particulates were
imaged with Z-contrast, scanning, and transmission modes.
3.2.14: XRD Measurements
The NiNPs’ crystal structure was determined using an Ultima IV, Rigaku Corp.
XRD. 0.015 g of the NiNPs dispersed in methanol were drop-casted onto a 1” diameter
glass slide and dried overnight. The glass slide was then placed into an aluminum sample
holder and the diffraction pattern was collected from 30o to 90o at 40 kV beam intensity
and scan speed of 0.55 deg./min..
3.2.15: Magnetic Measurements
The NiNPs magnetic properties were measured using MicroMag Magnetometer,
Cambridge Measurements Corp. The NiNP dispersion was dried and 3–5 mg of
nanoparticles were casted into an adhesive tape. The tape was attached to the
magnetometer’s probe holder using a silicone gel. Then, the magnetization curves were
collected from 400 to -400 A/m at scan speed of 12.5 A/m/min.

55
3.3: Results and Discussion
3.3.1: Synthesis and Modification of Nickel Nanoparticles
Synthesis of NiNPs
During the formation of nanoparticulates, the increase in temperature will increase
the reaction rate and decrease the nucleation rate16. Consequently, the temperature of the
NiNPs synthesis was varied to find a compromise between the nucleation and growth rates
to synthesize the NiNPs with required diameter. Another factor significantly influencing
the formation of NiNPs is the agitation of the reaction media. In turn, the sonication and
magnetic stirring were used to vary the particle size. These methods have different intensity
of agitation to break up nickel hydroxide into small particulates for the reduction process.
Specific conditions for the synthetic procedure are outlined in Table 3.1.
The size of the particles synthesized in S1, S2, S3, and S4 synthetic procedures
were determined from SEM images using Gwyddion image processing software; the sizes
of 60–70 nanoparticles were measured manually for each synthesis.
As shown in Figure 3.4, S1, S2, S3, and S4 had rather large size distribution, as
denoted by the standard deviations of the diameter values. The sonicated solutions, in
general, yielded smaller nanoparticles. S3 had the smallest nanoparticles with an average
diameter of 60 nm, which is 10 nm smaller than the next closest value. S1 resulted in the
largest synthesized nanoparticles. The nanoparticles processed in S1 were analyzed in more
detail by SEM, XRD, and magnetometry (Figure 3.5).

56
S1 S2 S3 S4
0
20
40
60
80
100
120
Dia
mete
r (n
m)
Synthesis
Figure 3.4: The measured diameters of the synthesized NiNPs.
Figure 3.5: (a, b) SEM images, (c) XRD pattern and (d) magnetization curve of the S1
synthesized NiNPs.
57
The synthesized particles were nearly spherical with a 100 ± 20 nm diameter
(Figures 3.5a and b). The particles’ surface was quite rough, as typically found for the
NiNPs obtained via the reduction process 6. The XRD pattern indicated the presence of a
single fcc crystal phase with three characteristic peaks (2θ = 44.6 o, 52.0 o, 76.5 o) (Figure
3.5c) corresponding to pure metallic nickel17. No nickel oxide was detected within the XRD
detection limit. Considering the detection limit for this XRD is a few percent for mixtures18,
~1–2 nm of an oxide layer for 100 nm particles might be present on the surface of the
nanoparticles. A film of such thickness can be attributed to a natural oxide layer typically
formed on the nanoparticles’ surface. The absence of the nickel oxide in the XRD pattern
suggests that no additional nickel oxide (aside from the one naturally formed on the
surface) is present in the synthesized particles.
Magnetic measurements (Figure 3.5d) confirmed the ferromagnetic nature of the
material with the saturation magnetization of approximately 30 emu/g, remnant
magnetization of 7.1 emu/g, and coercivity of 90 Oe. These results differ from bulk Ni19,
but are similar to the results reported for NiNPs6, 20.
The particles obtained from the different synthesis were used in different
experiments. The S1 nanoparticles were utilized to study the “grafting to” surface
modification. Although the NiNPs obtained with S1 synthesis were not of the targeted size
for the project, they provided a model surface to demonstrate the concept of grafting to
nanoparticulates. The smallest nanoparticles (S3) were chosen to magnetically modify the
SiCWs because they could provide the highest packing density on the surface. Therefore,
the S3 synthesis was chosen to be used to functionalize the whiskers.

58
Modification of NiNPs’ Surface
Preliminary studies were used to prove that the Ni surface could be uniformly
modified via polymer grafting. For this purpose single crystal silicon wafers were sputtered
with nickel to produce a 100 ± 10 nm film, as described in the dissertation by Galabura13.
Figure 3.6 is an AFM image showing the surface morphology of the as deposited nickel
film. The AFM images revealed that the silicon wafer surface was uniformly covered by
nickel. These nickel films were cleaned and activated with plasma and then dip coated in
a PGMA solution in chloroform. The PGMA films were annealed and rinsed to obtain a
6–7 nm layer on the nickel substrate (Figure 3.7a). The process of grafting is described in
detail elsewhere13, 21. The PGMA layer acts as the anchoring layer for the end carboxyl
groups of the PEG. In fact, the grafting of the PEG resulted in a film with a thickness of 13
± 1 nm (Figure 3.7). The AFM images revealed uniform coverage of the surface by both
the PGMA and PEG. The increase in the polymer film thickness and change in morphology
confirmed the grafting of PEG to the nickel substrate.
Figure 3.6: AFM topography image of the as deposited nickel film. The image size is
0.8x0.8 μm2. The vertical scale is 5 nm.

59
Modification of NiNPs by Grafting of PGMA and PEG
Using the developed grafting procedures, PGMA and PEG were effectively
anchored to the surface of NiNPs. First, the bare NiNPs (Figure 3.8a) were grafted with
PGMA. The grafted PGMA layer (Figure 3.8b) was measured to be approximately 1–2 nm.
Lastly, the PEG was grafted to the surface creating a 10–12 nm polymer shell (Figure 3.8c).
These TEM images confirm that PGMA and PEG can be grafted to the NiNPs.
Figure 3.7: AFM topography image of the grafted (a) PGMA and (b) PEG films on the
nickel substrate. The image size is 0.8x0.8 μm2. The vertical scale is (a) 5 nm and (b) 20
nm.
Figure 3.8: TEM images of NiNPs at various stages of the modification process: (a) bare
NiNPs, (b) PGMA-modified NiNPs, and (c) PEG-modified NiNPs. The scale bar is 50 nm.

60
Additionally, the end-terminated PEG demonstrated the effectiveness of carboxylic acid to
epoxy anchoring of functionalized macromolecules.
Grafting of PAA to PGMA anchored to NiNPs
The developed grafting procedures were used to covalently bond PAA to the
surface of the NiNPs. PAA was chosen to modify the nanoparticles due to the carboxylic
acid groups reactivity with epoxy and ability to complex with other polymers. Thus, the
NiNPs were mixed, dried, and cured in bulk PGMA. The PGMA modified NiNPs were
dispersed into a concentrated solution of PAA in methanol. This solution was dried and
annealed to create a film of PAA covalently bonded to the surface of the NiNPs.
Figure 3.9 is an image of the NiNPs with grafted PAA on the surface. This image
reveals the thickness of the grafted layer on the level of 10 ± 9 nm. The thickness was
calculated from the average film thickness of ~65 particles. A sample of the PAA-modified
Figure 3.9: TEM image of NiNPs modified with PGMA and PAA.
61
NiNPs was also analyzed with TGA to estimate the grafting thickness by weight loss. The
TGA results indicated a weight loss of 33.4 %. Using Equation 3.6 (density of the polymer
is assumed to be 1 g/cm3), the PAA film thickness was calculated to be 23 nm (2.3 times
larger than the TEM results). Thus, the bulk sample has a large variation in the polymer
grafting thickness and/or shape and size variation of particulates. However, since the layer
of PAA was anchored to the surface of the NiNPs successfully, these modified NiNPs were
used in further experimentation to evaluate their ability to attach to SiCWs modified with
P2VP.
3.3.2: Modification of SiCWs
Modification of Silicon Wafers with Grafted PGMA and P2VP
The modification of a silicon wafer with carboxyl-terminated P2VP using a PGMA
anchoring layer was done to prove that nanofilms could be produced with the polymer
grafting. The silicon wafer provides a natural silica oxide layer that represents the surface
of the SiCWs. The analysis of the AFM image of the PGMA-grafted surface presented in
Figure 3.10a, shows that the layer has a root mean square (RMS) AFM roughness of 1.4
nm. Additionally, ellipsometry thickness measurements resulted in an average layer height
of 5 ± 1 nm (averaged from 10 samples). Next, P2VP was grafted to the PGMA-modified
silicon wafer (Figure 3.10b). The grafted P2VP film thickness was measured by
ellipsometry to be 15.0 ± 0.7 nm (averaged from 10 samples). The uniformity of the grafted
P2VP film was confirmed using AFM. From the AFM image, the RMS roughness was
measured to be 1.7 nm (Figure 3.10b). The modification of the model surfaces, shown in

62
Figure 3.10a and b, was successful at producing a uniform P2VP-grafted layer onto the
silicon surface and the methodology used could be transferred to the SiCWs.
Surface Modification of SiCWs by the Grafting of P2VP via PGMA Layer
The SiCWs were modified with PGMA and carboxyl-terminated P2VP by the
“grafting to” technique to create a P2VP polymer film on the whiskers’ surface (Figure
3.11). TEM was used to investigate the thickness of the PGMA-layer grafted to the SiCWs.
At first glance, the PGMA appeared to be grafted as a layer with thickness of several
nanometers (Figure 3.11a). However, it was found that some of the SiCWs were not
modified individually (Figure 3.11b). Namely, PGMA bridging between SiCWs was
observed. Therefore, TGA was used to determine the average polymer thickness on the
SiCWs (Figure 3.12) to evaluate the degree of bridging
Figure 3.10: AFM topography images of the grafted (a) PGMA and (b) P2VP. The images
size is 10x10 μm2. The vertical scale is (a) 25 nm and (b) 40 nm. (The craters in the PGMA
film are related to high humidity causing water condensation during the film drying).

63
.
It was observed that the modified SiCWs had a 1.9 % weight loss up to 450 oC.
Using Equation 3.5 (assumed density of the polymer was 1 g/cm3) the polymer thickness
Figure 3.11: TEM images of a SiCW modified with the PGMA layer: (a) the end of a
SiCW (the film is barely visible); (b) the bridging of the PGMA layers between two SiCWs.
Figure 3.12: TGA curve of PGMA-modified SiCWs.
0 100 200 300 400 500 600 700
98.0
98.5
99.0
99.5
100.0
100.5
Re
lative
we
igh
t (%
)
Temperature (oC)

64
of the layer was found to be ~7 nm. This was just 1–2 nm different from the model silicon
wafer system, indicating that the bridging of the whiskers by the PGMA is not a prevailing
phenomenon. Therefore, it was assumed that the PGMA bridging would not affect the next
modification with carboxyl-terminated P2VP.
Figure 3.13 is a TEM image of the P2VP grafted to SiCWs. From TEM imaging it
was concluded that P2VP layer was grafted to the SiCWs surface and has thickness of
about 12±5 nm (averaged over 10 whiskers). These results were comparable to the
modification of the model surface. Thus, the presence of the surface curvature did not
influence the grafting of the polymer. However, the results of the TGA analysis did not
complement the TEM image analysis (Figure 3.14).
100nm
Figure 3.13: TEM image of a SiCW modified with carboxyl-terminated P2VP.

65
In fact, the modified SiCWs lost about 20 wt. % of the sample, which calculates to
approximately 70 nm of combined (PGMA and P2VP) polymer layer grafted to the surface
(Equation 3.5, polymer density-1 g/cm3). It results in 63 nm of P2VP after subtracting
PGMA contribution (7 nm). This is approximately 5.3 times larger than the measured film
in the Figure 3.13 and 4.2 times larger than the results for the model surface. These TGA
results indicate that bridging and non-uniform grafting of PGMA can have a significant
effect on the polymer grafting and cannot be ignored. Indeed, the extent of bridging was
found, with additional TEM imaging, to be excessive (Figure 3.15).
The circles in the TEM image, for both Figure 3.15a and b, are used to highlight
the regions of bridging between the SiCWs. The polymer is seen to be spanning gaps of up
to several hundred nanometers between the whiskers. These results were used to conclude
that PGMA is not suitable for the surface modification of SiCWs in the experimental
0 100 200 300 400 500 600
80
85
90
95
100
Weig
ht
Perc
ent
(%)
Temperture (oC)
Figure 3.14: TGA curve for the P2VP-modified SiCWs.

66
conditions used. Thus, a low molecular weight surface modifier (epoxy silane) was utilized
in the fabrication of uniformly coated surfaces.
Surface Modification of SiCWs with an Epoxy Silane and P2VP
Surface modification of inorganic materials with epoxy silane is well established
surface modification procedure to cover inorganic materials with reactive epoxy groups7-8,
22. Initially, model surfaces (silicon wafers) were used to verify the modification
procedure. The epoxy silane was deposited onto the surface of the wafer from a toluene
solution. The ellipsometry measurements indicated a deposition of 3.0 ± 0.5 nm thick
epoxy silane film. Additionally, the AFM images indicated that, indeed, uniform epoxy
silane layer with RMS roughness of 1.3 nm was fabricated (Figure 3.16a). The thickness
of the grafted P2VP film was determined to be 9.0 ± 0.4 nm using ellipsometry. Then,
AFM imaging was used to evaluate the uniformity of the film (Figure 3.16b). It was found
that the grafted layer covers the surface of the wafer uniformly and has RMS roughness of
Figure 3.15: Additional TEM images of SiCWs modified with PGMA and P2VP

67
less than 1 nm. Since, the modification of the model surface with epoxy silane and P2VP
was successful we used this methodology for modification of SiCWs.
Modification of SiCWs with Epoxy Silane and P2VP
The SiCWs were modified with the epoxy silane from a solution in toluene. The
resulting modified SiCWs were analyzed by TGA (Figure 3.17-3.18). The weight loss
associated with of the epoxy silane was ~2 wt. %. With a density of 1.1 g/cm3 assuming
uniform coverage of the average SiCW, the epoxy silane film thickness was calculated to
be 6 nm (using Equation 3.5). This is approximately the same thickness of the epoxy silane
as was found on the silicon wafer. The epoxy silane-modified SiCWs were further
processed by grafting the carboxyl-terminated P2VP. The thickness of the P2VP was
determined using TGA and TEM. First, TGA was used to determine the weight loss
Figure 3.16: AFM topography image of (a) the epoxy silane layer (1 x 1 μm2) and (b)
grafted P2VP polymer film (10 x 10 μm2). The vertical scale is 10 nm.

68
associated with decomposition of the polymer (Figure 3.18). The P2VP-modified SiCWs
lost ~2 wt, % of the polymer, which calculated to be 6 nm of grafted polymer (using
Equation 3.5). TEM image (Figure 3.19) reveals uniform polymer surface coverage
without bridging.
Figure 3.18: TGA curve for the SiCWs modified with P2VP via epoxy silane.
0 100 200 300 400 500 600
95
96
97
98
99
100
Re
lative w
eig
ht
(%)
Temperature (oC)
Figure 3.17: TGA curve for the SiCWs modified with epoxy silane
0 100 200 300 400 500 600
95
96
97
98
99
100
Wie
ght P
erc
ent (%
)
Temperature (oC)

69
Indeed, with a very thorough search throughout the entire sample, no noticeable
bridging of the polymer layers was found. The image shown in Figure 3.19 was presumed
to be a representative image of the P2VP modified SiCWs. The thickness of the polymer
layer in Figure 3.19 is two times higher than the one obtained from TGA and 4 nm thicker
than the polymer film grafted to the model silicon wafer. In general, the results prove that
the silane-based modification is suitable methodology for the polymer grafting to SiCWs.
3.3.3: Modification of SiCWs with NiNPs
After attaching PAA and P2VP to the surface of NiNPs and SiCWs, respectively,
the attachment of the NiNPs to the SiCWs was accomplished using the polymer-to-polymer
complexation between PAA and P2VP23-24. In general, we foresee that the complexation
approach could potentially serve as a universal modification technique to attach magnetic
nanoparticulates. The complexation methodology for the magnetic functionalization of the
SiCWs with NiNPs was successful to the large extent. However, we found that only a small
number of NiNPs was attached to the surface of the SiCWs (Figure 3.20). The whiskers
Figure 3.19: TEM image of the SiCWs modified with epoxy silane and P2VP.

70
were not uniformly covered with the particles. It was prevalent throughout all images
showing an average of 275 ± 132 nanoparticles per whisker, which corresponds to 38 ± 18
nanoparticles/µm2. Calculated maximum packing density of the NiNPs is approximately
311 nanoparticles/µm2, which is one order of magnitude larger than the observed
experimental value. Thus, the magnetic modification was possible, but resulted in low
density of the nanoparticles on the surface. The magnetically modified SiCWs were found
to be magnetically active as observed by magnetic rotational spectroscopy (MRS).
However, the low and non-uniform coverage warps the magnetic moment in the system.
Thus, the whiskers, though observing overall direction, were not oriented exactly along the
magnetic field (Figure 3.21).
The two main factors that could have affected the nanoparticle attachment are
ineffective complexation between P2VP and PAA and/or blockage of the surface by
residuals originated from the nanoparticle synthesis. Thus, the research on modification of
SiCWs with NiNPs was not pursued further.
a) b)
Figure 3.20: Representative (a) TEM and (b) z-contrast images of SiCWs functionalized
with NiNPs.

71
\\
3.4: Conclusions
The following conclusions can be derived as a result of our study reported in
Chapter 3:
Polymer modification of the nanoparticulates was successfully attained after the
methodologies were elaborated for the model surfaces.
NiNPs were attached to the surface of SiCWs via polymer-polymer complexation.
The modification of the SiCWs with magnetic NiNPs was concluded to
substantially underperform with respect to the theoretical calculations of
nanoparticle packing and creation of strictly aligned orientation of the whiskers in
a magnetic field.
a) b)
Figure 3.21: Dark field images of a SiCW modified with NiNPs orienting in the magnetic
field. The magnetic field direction is denoted by the white arrow. The direction was
changed by 90 o from (a) to (b).

72
3.5: References
1. Degen, A.; Macek, J., Preparation of submicrometer nickel powders by the
reduction from nonaqueous media. Nanostruct Mater 1999, 12 (1-4), 225-228.
2. Koltypin, Y.; Fernandez, A.; Rojas, T. C.; Campora, J.; Palma, P.; Prozorov, R.;
Gedanken, A., Encapsulation of nickel nanoparticles in carbon obtained by the
sonochemical decomposition of Ni(C8H12)2. Chem Mater 1999, 11 1331-1335.
3. De Caro, D.; Bradley, J. S., Surface spectroscopic study of carbon monoxide
adsorption on nanoscale nickel colloids prepared from a zerovalent organometallic
precursor. Langmuir 1997, 13, 3067-3069.
4. Zhang, H. T.; Wu, G.; Chen, X. H.; Qiu, X. G., Synthesis and magnetic properties
of nickel nanocrystals. Mater Res Bull 2006, 41 (3), 495-501.
5. Steigerwald, M. L.; Alivisatos, A. P.; Gibson, J. M.; Harris, T. D.; Kortan, R.;
Muller, A. J.; Thayer, A. M.; Duncan, T. M.; Douglass, D. C.; Brus, L. E., Surface
derivatization and isolation of semiconductor cluster molecules. J Am Chem Soc 1988,
110 (10), 3046-3050.
6. Wu, Z. G.; Munoz, M.; Montero, O., The synthesis of nickel nanoparticles by
hydrazine reduction. Adv Powder Technol 2010, 21 (2), 165-168.
7. Luzinov, I.; Julthongpiput, D.; Liebmann-Vinson, A.; Cregger, T.; Foster, M. D.;
Tsukruk, V. V., Epoxy-terminated self-assembled monolayers: Molecular glues for
polymer layers. Langmuir 2000, 16 (2), 504-516.
8. Luzinov, I.; Julthongpiput, D.; Malz, H.; Pionteck, J.; Tsukruk, V. V., Polystyrene
layers grafted to epoxy-modified silicon surfaces. Macromolecules 2000, 33 (3), 1043-
1048.
9. Tsyalkovsky, V.; Klep, V.; Ramaratnam, K.; Lupitskyy, R.; Minko, S.; Luzinov,
I., Fluorescent reactive core-shell composite nanoparticles with a high surface
concentration of epoxy functionalities. Chem Mater 2008, 20 (1), 317-325.

73
10. Tsyalkovsky, V.; Burtovyy, R.; Klep, V.; Lupitskyy, R.; Motornov, M.; Minko,
S.; Luzinov, I., Fluorescent nanoparticles stabilized by poly(ethylene glycol) containing
shell for pH-triggered tunable aggregation in aqueous environment. Langmuir 2010, 26
(13), 10684-92.
11. Zhou, X.; Goh, S. H.; Lee, S. Y.; Tan, K. L., XPS and FTIR studies of
interactions in poly(carboxylic acid)/poly (vinylpyridine) complexes. Polymer 1998, 39
(16), 3631-3640.
12. Eluri, R.; Paul, B., Synthesis of nickel nanoparticles by hydrazine reduction:
mechanistic study and continuous flow synthesis. J Nanopart Res 2012, 14 (4).
13. Galabura, Y. Synthesis and characterization of nanoscale polymer films grafted to
metal surfaces. Ph.D. Thesis, Clemson University, Clemson, SC, 2014.
14. Properties of Silicon Carbide. Institution of Engineering and Technology:
Stevenage, 1995; Vol. 1.
15. Zdyrko, B.; Klep, V.; Luzinov, I., Synthesis and surface morphology of high-
density poly(ethylene glycol) grafted layers. Langmuir 2003, 19 (24), 10179-10187.
16. Kwon, S. G.; Hyeon, T., Kinetics of colloidal chemical synthesis of monodisperse
spherical nanocrystals. In Nanoscale Materials in Chemistry, 2nd ed.; Klabunde, K. J.;
Richards, R. M., Eds. John Wiley And Sons, Inc.: Hoboken, 2009; pp 127-155.
17. Jette, E. R.; Foote, F., Precision determination of lattice constants. J Chem Phys
1935, 3 (10), 605-616.
18. Lifshin, E., X-ray Characterization of Materials. Wiley-VCH: Weinheim, 1999.
19. O’Handley, R. C., Modern magnetic materials: principles and applications.
Wiley: New York, 2000.
20. Lu, H. M.; Zheng, W. T.; Jiang, Q., Saturation magnetization of ferromagnetic
and ferrimagnetic nanocrystals at room temperature. J Phys D Appl Phys 2007, 40 (2),
320-325.

74
21. Zdyrko, B.; Iyer, K. S.; Luzinov, I., Macromolecular anchoring layers for polymer
grafting: comparative study. Polymer 2006, 47 (1), 272-279.
22. Tsukruk, V. V.; Luzinov, I.; Julthongpiput, D., Sticky Molecular Surfaces:
Epoxysilane Self-Assembled Monolayers. Langmuir 1999, 15 (9), 3029-3032.
23. Huntsman Packaging, High preformance components. Huntsman, Ed. Huntsman:
North America, 2015.
24. Kaczmarek, H.; Szalla, A.; Kaminska, A., Study of poly(acrylic acid)-
poly(vinylpyrrolidone) complexes and their photostability. Polymer 2001, 42 (14), 6057-
6069.

75
CHAPTER FOUR
MODIFICATION OF SICWs WITH MAGNETIC IRON OXIDE
NANOPARTICLES
4.1: Introduction
Since the functionalization of SiCWs with NiNPs (Chapter 3) did not yield the
targeted result, MagNPs modified with PAA were selected to be the next option for the
modification of the whiskers. MagNPs were preferred because of their commercial
availability, magnetism, easily modifiable surfaces, and the range of available sizes and
morphologies1-2. The PAA to MagNPs bonding via the formation of insoluble salt was
envisioned to create a simple and easily controlled route for the surface modification1. It
is important to point out that the surface of commercially available MagNPs is typically
modified. The surface modification is used to control the surface-to-surface interactions
and size of the particulates during their synthesis3. Hence, the attachment of PAA to the
particles’ surface could be hindered by the modifications. Thus, it was necessary to select
particles, which possess surface modifiers compatible with the process of anchoring of
PAA. In fact, the MagNPs selected for this study were covered with PVP, which can
form a complex with PAA4.
In general, this chapter describes our research on the modification of SiCWs with
MagNPs via polymer-to-polymer complexation. The surface-bound PAA was used to
create complexation with the P2VP-modified SiCWs5. The surface morphology and
structure of the MagSiCWs were studied using SEM, TEM imaging and magnetometry.

76
Specifically, the goal of the characterization of the surface was to determine the
morphology and thickness of the magnetic nanoparticles layer. The magnetic
modification of the SiCWs was performed utilizing the dispersions of the MagNPs of
different concentrations. Finally, to test the magnetic orientation of the whiskers, the
MagSiCWs were dispersed and oriented into a polyethylene oxide (PEO) thin film.
4.2: Experimental
4.2.1: Size Separation of Iron Oxide Nanoparticles
The MagNPs were ordered from US Research Nanomaterials, Inc. and composed
mostly of magnetite. The MagNPs were cleaned and separated in methanol in three
stages. First, they were dispersed into methanol at 10 wt. %. Then, they were ball-milled
with glass balls (1 mm in diameter) on a high setting for one hour in a IKA® Ultra
Turrax® tube disperser with a ST-20/50 dispersion tube. Then, a Precision-Durafuge 100
centrifuge was used at 5000 rpms for 15 min to remove large agglomerates from the
suspension. The centrifuge was used three times on the same suspension. After each
centrifugation, the top portion of the supernatant was decanted and kept. Next, an
Eppendorf-mini spin plus centrifuge was used at 10000 rpms for 3 min. The decanted
portion of the nanoparticle suspension was centrifuged 3 more times, and each time the
sediment was kept for further use. The nanoparticle suspension after this process was the
color of maghemite (rusty)2, 6. After size separation was completed, the particles were
imaged by TEM.

77
4.2.2: Surface Modification of Iron Oxide Nanoparticles
The obtained MagNPs were redispersed in methanol to make a 0.3 wt. % colloidal
suspension. Then, 3 wt. % solution of PAA (Mw=100,000 g/mol) in methanol was
prepared and sonicated. The nanoparticles suspension was added dropwise (1:1 final
volume ratio) into the sonicated PAA solution. Finally, this PAA/MagNPs suspension
was shaken for 24 hours and cleaned three times by repetitive centrifugation at 10000
rpms, magnetic separation and redispresion in methanol. The magnetic separation was
carried out using a ~200 G neodymium magnet placed at the bottom of the vail
containing the nanoparticles dispersion. The formation of PAA-anchored layers was
monitored using TEM and TGA.
4.2.3: Fabrication of Magnetically Functionalized SiCWs
Two dispersions (SiCWs modified with P2VP and MagNPs modified with PAA
in methanol) were mixed under continuous sonication in 1:10, 1:8.6, 1:5, and 1:2 weight
ratios (MagNPs:SiCWs). The concentration of SiCWs dispersion was on the level of 1-2
wt. %. During the procedure, the dispersion of SiCWs was added dropwise to the
dispersion of sonicated MagNPs. Such order of mixing ensured the particles would
modify the whiskers and prevent nanoparticle bridging between the whiskers.
After each of the modifications was conducted, visual observation based on color
of the layer above the sediment (clear, no color) indicated absence of any visually
detectable amount of free nanoparticles. These magnetic whiskers were dispersed in

78
methanol and vigorously shaken for 24 hours. Then, to finalize the functionalization, the
whiskers were added dropwise to a sonicated 2 wt. % solution of PAA in methanol. This
secondary modification completed the coverage of the SiCWs with a final PAA layer
complexing with any P2VP available on SiCWs surface. The final SiCW suspension was
shaken for 24 hours. After the shaking, the MagSiCWs were cleaned in methanol by
magnetic separation and centrifugation.
The attachment of MagNPs to the surface of SiCWs allowed for proximity
agglomeration and collection of the MagSiCWs using a magnet. The whiskers modified
with MagNPs showed an immediate response to a magnetic field. The magnet was held
near the bottom of the vial containing dispersion for 15 min, and then the top portion of
the liquid was decanted off. Then, centrifugation at 5000 rpm was done for 15 min. The
solvent layer above sediment was decanted, and the sediment of SiCWs was redispersed
in methanol and used for further studies. The MagSiCWs were characterized by TEM.
4.2.4: Magnetic Characterization
An alternating gradient field magnetometer (AGM 2900 Princeton Measurement,
Inc.) was used to characterize the magnetic properties of materials. For each sample, the
induced magnetic moment was measured as a function of the applied magnetic field. The
applied magnetic field was slowly increased to a maximum of 400 kA/m and then
decreased to -400 kA/m. The resulting hysteresis loops were analyzed. Magnetic

79
characterization and data interpretation were conducted by Pavel Aprelev under the
guidance of Prof. K. Kornev.
Samples of MagNPs and MagSiCWs were prepared by drying at room
temperature, weighing, and encapsulating in scotch tape to prevent the loss of material.
The dry magnetic samples were mounted on the magnetic probe and their hysteresis
curves were measured.
No magnetic hysteresis was observed and the magnetization curves were
consistent with the behavior of paramagnetic materials described by the Langevin
function7-8:
cotp B
p
B p
m H k Tm Nm
k T m H
where m is the magnetic moment of the sample, H is the magnitude of the external
magnetic field measured in Teslas, N is the number of magnetic domains in the sample,
mp is the magnetic moment of a single domain, kB is the Boltzmann constant, and T is the
absolute temperature. The magnetic moment of the sample was calculated by fitting the
magnetization curves with the Langevin equation (1) and extracting the product Nmp7, 9-
10. A comparison between the samples was made after normalizing the saturation
magnetic moment by the mass of the sample.
(4.1)

80
4.2.5: Orientation of MagSiCWs in PEO Composite Film
PEO with a molecular weight of 1,000,000 g/mol was used as a matrix for the
model composite film. PEO was dissolved to form 2.1 wt. % solution in methanol. The
PEO solution was purified by multiple centrifugations at 5000 rpm to remove any non-
soluble materials. Then, the MagSiCWs were dispersed into the PEO methanol solution.
The concentration of MagSiCWs in the PEO matrix was 0.5 wt. % (~0.16 vol. %) and
1.84 wt. % (~0.58 vol. %).
The PEO-MagSiCW composite films were fabricated by dip-coating silicon
wafers into the suspension of the whiskers in the PEO solution. Specifically, silicon
wafers were cut into 1x4 cm rectangles and cleaned by sonication in DI water for a total
of 45 min, replacing the water every 15 min. Then, the wafers were placed into a
“piranha” solution (25 vol. % of 30 % hydrogen peroxide and 75 vol. % of concentrated
sulfuric acid) for 30 min. at 60–80 oC and rinsed with DI water. After the cleaning and
drying, the silicon wafers were dip-coated into a 2 wt. % solution of pure PEO in
methanol at 5.4 mm/s velocity. Using the AFM scratch technique11, pure PEO thin films
were found to be 300 ± 20 nm thick. The AFM measurements were performed in tapping
mode at 1–2 Hz on a Dimension 3100 (Veeco Instruments) microscope using silicon
probes (50 N/m spring constant).
The dip-coating of the PEO-MagSiCWs mixture in methanol was accomplished
employing the same parameters as used for the pure PEO solution in methanol. However,
the drying of the dip-coated wafer was carried out in a vial between two parallel
neodymium magnets (K&J Magnetics) (Figure 4.1a). The distance between the magnets

81
Figure 4.1: (a) The experimental set-up used for drying of the PEG-MagSiCW film; (b)
magnetic field in-between the magnets.
was about 6 cm. The vial was used to slow down the evaporation of the methanol during
the film formation. This allowed more time for the SiCWs to orient in the direction of the
magnetic field. Figure 4.1b shows the magnetic field gradient in-between the magnets
observed in the experiments. The magnetic field was measured using a DTM-133 digital
teslameter.
The field over the sample varied from 216 G at the very center of the sample to
320 G at the ends of the wafer (Figure 4.1b). The orientation of the whiskers was imaged
using an Olympus MVX10-TLU optical microscope.
4.3: Results and Discussion
4.3.1: Size of the MagNPs
The MagNPs’ surface chemistry and size are important factors in polymer
modification. Thus, after the size separation, the MagNPs were imaged using TEM
(Figure 4.2) to determine the size distribution in the material. TEM imaging indicated
that the nanoparticles have variable shape, which was expected considering the co-
a) b)
0 1 2 3 4 5 6 7
200
250
300
350
400
450
500F
ield
(G
au
ss)
Distance Between Magnets (cm)Distance along the magnet-magnet line

82
Figure 4.2: TEM image of the bare MagNPs obtained after separation processing.
Figure 4.3: The particle size distribution fitted to the Weibull function (─). The top of
the figure provides the statistical relevance of the distribution.
precipitation synthesis. The size of the MagNPs was measured manually from TEM
images using Gwyddion software. Specifically, 635 individual nanoparticles were
carefully identified and measured using the representative nanoparticle diameter or
longest dimension of the shape (if the shape was non-spherical). The radius size
distribution of individual MagNPs was identified through JMP® statistical software
(Figure 4.3).
Radius (nm)

83
Figure 4.4: (a) TEM image of MagNPs modified with PAA and (b) TGA curves of
original and modified MagNPs.
The mean radius of the MagNPs was 7.1 ± 3.7 nm. The top portion of the Figure
4.3 shows the range using the bars, the statistical median with outer quartiles of 25% and
75% using the boxes, the mean using the diamond within the boxes, and the statistical
outliers using the dots outside of the bars. The histogram of the MagNPs’ radius (Figure
4.3) was fitted with the Weibull statistical function (─). The function parameters were
identified as 8.08 for the scale and 2.04 for the shape12. The shape parameter is the slope
of the probability plot, meaning it changes with the behavior of the distribution peak. The
scale parameter is equal to the broadening and sharpening of the distribution peak.
4.3.2: Modification of MagNPs with PAA
The MagNPs were modified with PAA via adsorption from methanol solution.
The modified MagNPs were analyzed by TEM and TGA (Figure 4.4). Figure 4.4a shows
the image of an agglomerate of the MagNPs uniformly covered with PAA. This image
was used to estimate the PAA layer’s thickness.

84
The thickness of PAA was measured at selected locations. The thickness was
found to be ~10 nm (Figure 4.4a). However, the polymer film was not easily identified
due to the significant aggregation of the nanoparticles. To further estimate the thickness
of the polymer layer, TGA was used to measure the amount of polymer attached to the
surface through weight loss (Figure 4.4b). The observed weight loss associated with PAA
was ~3 wt. %. Equations 4.2 and 4.3 from Mefford et al.12 were used to determine the
thickness of the anchored polymer layer:
𝜎 = (𝑊𝑝𝑁𝐴𝜌𝑚𝑎𝑔
𝑀𝑛𝑊𝑚𝑎𝑔⁄ ) ∗ ∫ (
𝑟
3) 𝑃(𝑟)𝑑𝑟
∞
0 (4.2)
𝑡 =𝜎 ∗ 𝑀𝑛
𝑁𝐴 ∗ 𝜌𝑝⁄ (4.3)
where 𝜎 is the chain density per particle, t is the thickness of PAA on the surface, Wp and
Wmag is the weight fractions of polymer and MagNPs, respectively, NA is Avogadro’s
number, ρmag and ρp is the density of the MagNPs and PAA, respectively, r is the radius
of the measured MagNPs, and the P(r) is the Weibull probability function for the MagNP
radius distribution (fitted line in Figure 4.3). Using Equations 4.2 and 4.3, the polymer
layer thickness was found to be 0.5 nm. This result did not match TEM observations. The
discrepancy was caused by the modification of MagNP aggregates and not individual
particles. Additionally, Equation 3.6 was used to estimate that PAA layer was ~0.3 nm,
which is approximately the same result as obtained from Equations 4.2 and 4.3.
The size of nanoparticle agglomerates were identified using SEM imaging of the
magnetically functionalized SiCWs (Section 4.3.3). The diameter of the agglomerates
structure was measured by identifying the shape of the agglomerates and drawing a circle

85
Figure 4.5: The nanoparticle agglomerate size distribution fitted to the Weibull function.
The top of the figure provides the statistical relevance of the distribution.
around the structure. The diameter of the circle was then identified as the agglomerate
diameter. Approximately, 500 measurements were made (Figure 4.5).
The average agglomerate was determined to be 55.3 ± 39.0 nm in radius. The top
portion of Figure 4.5 shows the range using the bars, the statistical median with outer
quartiles of 25 % and 75 % using the boxes, the mean using the line within the boxes, and
the statistical outliers using the dots outside of the bars. The agglomerate distribution was
fitted to a Weibull plot identifying the scale and shape parameters to be 60.56 and 1.52
for the agglomerate structure. Then, using Equations 4.2 and 4.3, about 5 nm polymer
layer was estimated to be on the surface of the nanoparticle agglomerates. This result is in
good agreement with the thickness of PAA layer obtained from TEM. This indicated that
the agglomerate structures are being modified by the PAA. Thus, particle agglomerates
were identified as the major nanoparticle structure, which were used for the SiCWs
modification.
Radius (nm)

86
4.3.3: Modification of SiCWs with MagNPs
The functionalization of SiCWs with MagNPs was a critical step in the process of
creating oriented SiCWs. As SiCWs are not magnetic, it would take great amount of
force from shear or electric fields to orient them. Thus, our solution to this problem was
to attach MagNPs to the SiCW’s surface via polymer complexation in a solution and add
a magnetic moment to the SiCWs.
After grafting and adsorbing P2VP and PAA polyelectrolytes to the whiskers and
particles, respectively, MagNPs and SiCWs dispersions were mixed together at various
ratios to target high packing density and the uniform coverage of the whiskers.
Specifically, the MagNPs and SiCWs were mixed in the following weight ratios: 1:2, 1:5,
1:8.6, and 1:10 (MagNPs:SiCWs). Then, the whiskers modified with MagNPs were
imaged using SEM and TEM. The analysis of the MagNPs layer was done by measuring
distance from the whisker’s surface to the outer edge of the MagNP layer. 3-9 whiskers
were measured for each produced batch with ~50 equally spaced measurements taken
from the surface of each whisker.
The measurements were averaged and plotted in Figure 4.6a. Figure 4.6b shows a
representative image of the SiCW surface morphology.
The apparent thicknesses of MagNP layers attached to the SiCWs were 158 ± 55
nm, 111 ± 47 nm, 66 ± 45 nm, and 57 ± 32 nm for the 1:2, 1:5, 1:8.6, and 1:10 of
MagNP:SiCW ratio, respectively. The functionalized surface uniformity was gauged
through the standard deviation of the average apparent thickness. In all cases uneven
surface structures were created with a maximum standard deviation of 60 nm and

87
Figure 4.6: (a) The average thickness of the attached MagNPs layer vs weight fraction of
magnetic nanoparticles; (b) the SEM image of the MagSiCWs for the 1:10 ratio.
minimum of 32 nm (Figure 4.6a). Student’s statistical t-test was done for the apparent
thickness results to determine whether the results obtained for the different ratios are
statistically different.
With the help of Dr. William Bridges and Dr. Brooke Russell from the
Mathematical Sciences Department of Clemson University, the statistical difference of
the thickness values was estimated (Table 4.1).
Table 4.1: Student’s t-test results for the sets of MagSiCWs batches .
Batch Batch Difference Std Err Dif p-Value
1:2 1:10 0.095 0.015 <0.001
1:5 1:10 0.049 0.023 0.0006
1:2 1:5 0.046 0.012 0.0006
The p-value results indicated that there was a statistical difference between the
results obtained for different batches of the MagSiCWs13.
In the next step of statistical analysis, the thickness measurements were divided
into the batch (or weight ratio), the whiskers, the side of whiskers, and the individual
measurements (Figure 4.7). Additionally, the whiskers were assumed to be independent
1:2
1:5 1:8.6 1:10

88
Figure 4.7: Schematic diagram of the statistical analysis methodology for the MagNPs
layer attached to the SiCWs.
from each other. As such, the statistical analysis was the comparison of whiskers by
functionalization which was broken up into sides of the whiskers and then the side of the
whiskers had individually measured points along the whisker. To prove the independence
of the whiskers, the sides and the individually measured points of the whiskers were
analyzed.
The measured points of the individual sides were compared in the order they were
measured along the surface. However, no pattern was found from analyzing the ordered
surface measurement. Thus, the thickness of the magnetic nanoparticle layer was

89
Figure 4.8: Representative histogram of the MagNP layer attached to the SiCW surface
fitted to the Weibull function (─). The top of the figure provides the statistical relevance
of the distribution.
randomly distributed along the surface of the whisker13. Then, the measured points along
the whiskers were compared with the distribution of a Weibull plot (Figure 4.8).
The distributions were considered unimodal and semi-symmetric. The distribution
of thickness measurements for each whisker was fitted to the Weibull expression (Figure
4.8). Additionally, the Cramer-von Mises Watson test gave an average value of .087,
which was less than the tabulated 0.25, meaning that the Weibull fit was statistically
good13. The top portion of Figure 4.8 indicates the range, the statistical median with outer
quartiles of 25 % and 75 %, and the mean represented by the bars, the boxes, and the
diamond within the boxes. Then, the variance for these was low in comparison to the
overall distribution, meaning the whisker-to-whisker and surface-to-surface thickness
differences were not statistically significant.
However, the overall variance of the individual measurements by batch showed
statistical significance. Thus, the functionalization measurements were compared by the
weight ratio of MagNPs to SiCWs. It appeared that the functionalization thicknesses were
Thickness (µm)

90
Figure 4.9: Measured thickness of the MagNP layer on the SiCWs from TEM images vs.
weight fraction of the MagNP in the MagSiCW. (where: the mean (―), median, 25% to
75% quartile, range, and the individual measurements are represented by the blue fitted
linear line, the middle line of the boxes, the upper and lower lines on the boxes, the bars
and the individual dots).
Figure 4.10: Representative SEM image of MagSiCWs obtained for the 1:5 ratio.
statistically significant by the weight ratio of MagNPs to the SiCWs. The statistical trend
of thickness to batch is shown in Figure 4.9. It reveals that the individual batches were
significantly different from each other and the 1:8.6 did not have statistical relevance.
Weight fraction of MagNPs in MagSiCW

91
Figure 4.11: Magnetization curves for MagNPs and MagSiCWs (prepared with the 1:5
ratio).
The 1:5 weight ratio of MagNPs to SiCWs was selected for further studies due to
the average thickness of 111 nm of MagNPs layer being very close to the size of MagNPs
aggregates. A representative image of the 1:5 SiCWs is shown in Figure 4.10.
4.3.4: Magnetic Characterization of the MagSiCWs
We determined the parameters of the Langevin equation (4.1) – mp and Mg – for
the MagNPs and MagSiCWs. The parameter Mg was used to analyze the amount of
magnetic material attached to the whiskers. Additionally, the parameter mp was
compared between MNPs and MagSiCWs to investigate the effect of magnetic
interaction between individual nanoparticles on total magnetization of material. A typical
plot of MagNPs and MagSiCWs magnetic moment vs. applied field along with their
Langevin fit is presented in Figure 4.11.
-0.6 -0.4 -0.2 0.0 0.2 0.4 0.6-1.0
-0.5
0.0
0.5
1.0
Magnetic Field (T)
MagNPs
Data
Fit
MagSiCWs
Data
Fit
Ma
gn
eti
c M
om
en
t (*
10
-5 A
m2
)

92
The magnetization curve shows that there is no significant ferromagnetic
coercivity or remnant magnetization of either MagNPs or MagSiCWs at the fields
investigated. This is consistent with the expectation and is due to the superparamagnetic
properties of iron oxide nanoparticles used in this research. Moreover, the average
magnetic moment of each nanoparticle in the MNP samples and in the MagSiCW
samples are practically the same, mp = (2.2±0.1)*10-19 Am2 and mp = (2.2±0.2)*10-19
Am2 , respectively. This indicates that the particle-to-particle interactions caused by the
attachment of the MagNPs to each other and to the SiCWs do not significantly affect the
magnetic properties of the MagNPs. The results also confirmed a significant level of
attachment of the magnetic nanoparticles to the whisker surface.
Since the magnetic properties of the nanoparticles are not affected by the
attachment, the ratio of the Mg values for MagNPs and MagSiCWs can serve as a
verification of the mass ratio between the nanoparticles and the silicone-carbide whiskers
in the MSiCWs sample. The saturation mass magnetization for MagNPs and MagSiCWs
are Mg = 0.064±0.01 Am2/g and Mg = 0.0055±0.002 Am2/g, respectively. From this
measurement, it follows that the mass concentration of magnetic nanoparticles in
MagSiCWs sample is 9±4%.
4.3.5: Study of Orientation of MagSiCWs in a PEO Matrix
To demonstrate the possibility of magnetic orientation for the functionalized
SiCWs, thin film composites were fabricated with PEO as a matrix. The orientation of the
MagSiCWs in a viscous polymer solution (formed as the composite film was drying) was
used to confirm the possibility of the magnetic alignment in a dynamically changing
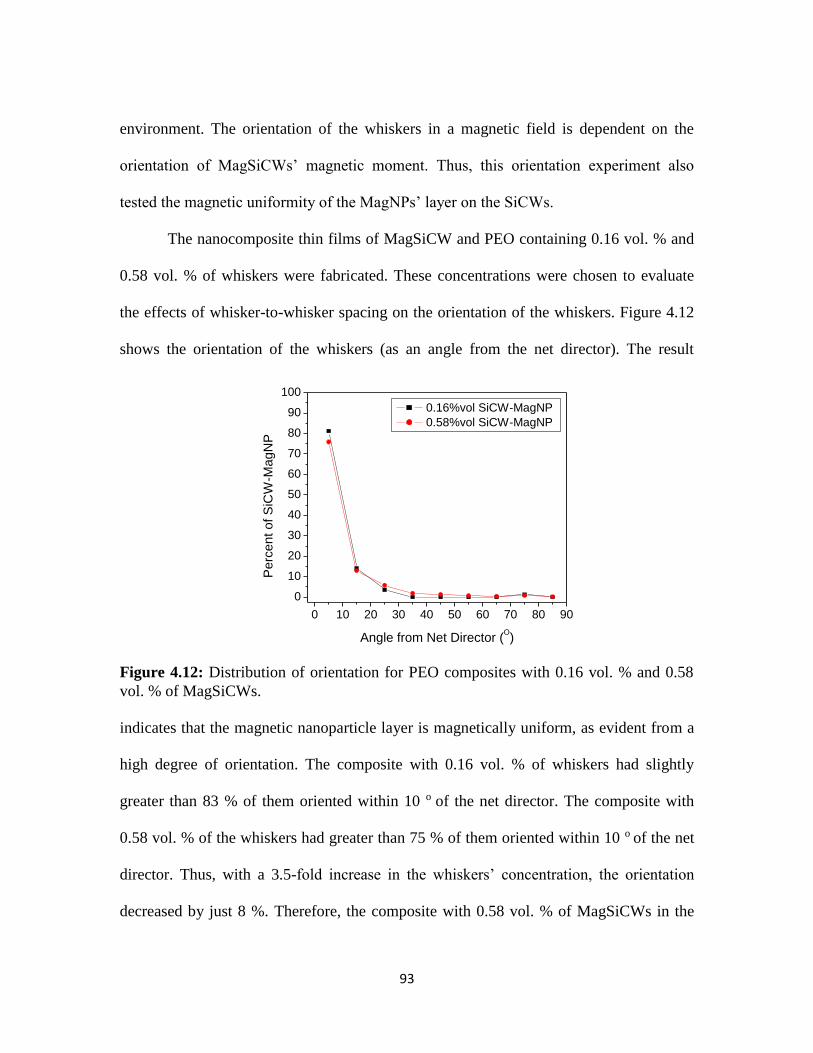
93
Figure 4.12: Distribution of orientation for PEO composites with 0.16 vol. % and 0.58
vol. % of MagSiCWs.
environment. The orientation of the whiskers in a magnetic field is dependent on the
orientation of MagSiCWs’ magnetic moment. Thus, this orientation experiment also
tested the magnetic uniformity of the MagNPs’ layer on the SiCWs.
The nanocomposite thin films of MagSiCW and PEO containing 0.16 vol. % and
0.58 vol. % of whiskers were fabricated. These concentrations were chosen to evaluate
the effects of whisker-to-whisker spacing on the orientation of the whiskers. Figure 4.12
shows the orientation of the whiskers (as an angle from the net director). The result
indicates that the magnetic nanoparticle layer is magnetically uniform, as evident from a
high degree of orientation. The composite with 0.16 vol. % of whiskers had slightly
greater than 83 % of them oriented within 10 o of the net director. The composite with
0.58 vol. % of the whiskers had greater than 75 % of them oriented within 10 o of the net
director. Thus, with a 3.5-fold increase in the whiskers’ concentration, the orientation
decreased by just 8 %. Therefore, the composite with 0.58 vol. % of MagSiCWs in the
0 10 20 30 40 50 60 70 80 90
0
10
20
30
40
50
60
70
80
90
100
Pe
rce
nt
of
SiC
W-M
ag
NP
Angle from Net Director (O)
0.16%vol SiCW-MagNP
0.58%vol SiCW-MagNP

94
PEO matrix was used in further experiments to allow more whiskers to be observed. The
orientation vs the field gradient was quantified for 0.58 vol. % composite film.
a)

95
Figure 4.13: (a) Stitched image of the composite thin film with 0.58 vol% of SiCW-
MagNP (the image is rotate 90 o clockwise); the black arrow describes the direction of
the net director; (b) the distribution of orientation from left, middle, and right portions of
the image.
Figure 4.13b shows the difference in the whiskers’ orientation over long distances
in the sample. Specifically, Figure 4.13a is a stitched image of the composite film with
0.58 vol. % of MagSiCWs in PEO. The image is 2.4 mm long, showing macro-scale
orientation. The center of the image correlates to the center of the applied magnetic field
(Figure 4.1b). The field varied by 0.3 G from the center of the image to each edge (Figure
4.13a).The average orientation of the entire sample is 7.8o, while the orientation varies by
2.7 o from the middle to the right of the image and 2.2 o from the middle to the right of
the image. Where, the average orientation from the magnetic field is 8.3 o, 6.1 o, and 8.8 o
for the left, middle, and right portions of the stitched image (Figure 4.13b). The middle of
Figure 4.13a has the highest degree of orientation, along with the lowest applied
magnetic field and gradient within the composite. It appears that not strength of magnetic
0 10 20 30 40 50 60 70 80 90
0
10
20
30
40
50
60
70
80
90
100
Pe
rce
nt
SiC
W-M
ag
NP
Angle from Net Director (O)
Left
Middle
Right
b)

96
field, but rather its uniformity caused by equal fields from both magnets is a decisive
factor in the orientation.
4.4: Conclusion
The following conclusions can be drawn as a result of the study reported in Chapter
5:
The SiCWs can be magnetically modified using polymer-to-polymer
complexation of PAA adsorbed to MagNPs with the grafted P2VP on the SiCWs.
The most uniform and highly packed layer of MagNPs on SiCW’s surface was
fabricated using 1:5 weight ratio of the nanoparticles to the whiskers.
The modification of the SiCWs with the MagNPs did not affect the magnetic
properties of the nanoparticles.
High degree of orientation of MagSiCWs by a magnetic field could be achieved
within a dynamically changing viscous environment.

97
4.5: References:
1. Cheng, Y. H.; Chen, Z.; Zhu, M. F.; Lu, Y. F., Polyacrylic acid assisted assembly
of oxide particles and carbon nanotubes for high-performance flexible battery anodes.
Adv Energy Mater 2015, 5 (6), 1401207.
2. Cornell, R. M.; Schwertmann, U., The iron oxides: Structure, properties,
reactions, occurrences and uses. Wiley-VCH: Weinheim, 2003.
3. Teja, A. S.; Koh, P. Y., Synthesis, properties, and applications of magnetic iron
oxide nanoparticles. Prog Cryst Growth Ch 2009, 55 (1-2), 22-45.
4. Lau, C.; Mi, Y., A study of blending and complexation of poly(acrylic
acid)/poly(vinyl pyrrolidone). Polymer 2002, 43 (3), 823-829.
5. Zhou, X.; Goh, S. H.; Lee, S. Y.; Tan, K. L., XPS and FTIR studies of
interactions in poly(carboxylic acid)/poly(vinylpyridine) complexes. Polymer 1998, 39
(16), 3631-3640.
6. Parkinson, G. S., Iron oxide surfaces. Surf Sci Rep 2016, 71 (1), 272-365.
7. Gu, Y.; Burtovyy, R.; Townsend, J.; Owens, J. R.; Luzinov, I.; Kornev, K. G.,
Collective Alignment of Nanorods in Thin Newtonian Films. Soft Matter 2013, 9 (35),
8532-8539.
8. Chikazumi, S. O.; Graham, C. D., Physics of ferromagnetism. 2nd ed.; Oxford
University Press: Oxford ; New York, 2009; p 655.
9. Gu, Y.; Kornev, K. G., Ferromagnetic Nanorods in Applications to Control of the
In-Plane Anisotropy of Composite Films and for In Situ Characterization of the Film
Rheology. Advanced Functional Materials 2016, 26 (22), 3796-3808.
10. Aprelev, P.; Gu, Y.; Burtovyy, R.; Luzinov, I.; Kornev, K. G., Synthesis and
Characterization of Nanorods for Magnetic Rotational Spectroscopy. Journal of Applied
Physics 2015, 118, 074901.
11. Seeber, M.; Zdyrko, B.; Burtovvy, R.; Andrukh, T.; Tsai, C. C.; Owens, J. R.;
Kornev, K. G.; Luzinov, I., Surface grafting of thermoresponsive microgel nanoparticles.
Soft Matter 2011, 7 (21), 9962-9971.
12. Mefford, O. T.; Carroll, M. R. J.; Vadala, M. L.; Goff, J. D.; Mejia-Ariza, R.;
Saunders, M.; Woodward, R. C.; St Pierre, T. G.; Davis, R. M.; Riffle, J. S., Size analysis
of PDMS-magnetite nanoparticle complexes: Experiment and theory. Chem Mater 2008,
20 (6), 2184-2191.
13. Cowan, G., Statistical data analysis. Oxford University Press: Oxford, New York,
1998.

98
CHAPTER FIVE
ORIENTATION OF MAGETICALLY MODIFIED SIC WHISKERS IN A
CURING EPOXY MATRIX
5.1: Introduction
As discussed in the previous chapter, the SiCWs can be functionalized with
MagNPs and the whiskers orient in a polymer matrix with the application of a magnetic
field. The obtained results demonstrated that macroscale orientation is possible in a
polymer solution to form nanocomposite thin films. In this chapter, the results on the
study of the orientation of MagSiCWs within a complex reacting system, epoxy resin,
are presented. Specifically, this chapter focuses on the relationship between the
orientation of the MagSiCWs in the epoxy matrix and the kinetics of the epoxy curing.
The epoxy system could create challenges for the orientation during resin curing.
These challenges arise due to local stoichiometry for reactive groups at the surface,
whisker-to-whisker cross-linking, and variations in the cross-linking density of epoxy
polymer1-2. These events are directly related to the polymerization of the epoxy. To this
end, in this study, the polymerization of the epoxy resin was monitored by following the
viscosity and reaction kinetics.
First, the viscosity was measured on the macroscale to determine the working
time for the orientation of the MagSiCWs. This was completed using the ball drop
method3-4. Second, the kinetics of the epoxy curing was monitored using DSC with a
method developed by Abenojara et al.5 Next, the time required for magnetic orientation
of the whiskers was theoretically estimated by modeling the characteristic time of

99
orientation for a super-paramagnetic nanorod in a liquid6-8. It was assumed that the
MagSiCWs did not interact with each other by physical contact or magnetic interaction.
Additionally, the material response to the magnetic field was assumed to be super-
paramagnetic.
Finally, the functionalized whiskers were dispersed into the epoxy and the real-
time magnetic orientation was conducted. A low concentration of the whiskers was used
to minimize the whisker-to-whisker interactions. The MagSiCW/epoxy system was cast
into a glass mold to image the whiskers’ rotation in the magnetic field. Two magnets
placed on either side of the glass mold were used to create a quasi-uniform magnetic
field. The images of an identified set of whiskers were taken every 1 min. to monitor how
fast the whiskers were orienting in the magnetic field. These images were compiled to
show the influence of local viscosity/system changes on the magnetic orientation of the
whiskers.
5.2: Experimental
5.2.1: Ball Drop Methodology
After mixing with a hardener and catalyst, the epoxy was poured into a 20-ml
glass test tube with a diameter of 1.5 cm. The test tube was placed upright next to a ruler
and a microscope. Then, a glass sphere, measuring 2 mm in diameter, was placed on the
surface of the epoxy resin. As the sphere dropped into the epoxy, a meniscus would
appear between the glass sphere and the epoxy. A microscope was used to monitor the
retraction of the meniscus from the glass sphere. The retraction of the meniscus signified
the complete immersion of the sphere in epoxy. As the sphere moved down and away

100
from the resin surface, the speed of the sphere was monitored as the sphere crossed the 2-
cm marking and passed the 4–5 cm vertical distance in the resin, where 0 cm was at the
surface of the epoxy resin. A ruler was used to measure the distance the glass sphere had
traveled during a given time period. Using Equation 5.1, the velocity of the dropping
sphere, Vs, was used to calculate the apparent epoxy viscosity, η3-4:
s
LS
V
gr
9
)(2 2
where ρS and ρL are the density of the glass sphere (~2.6 g/cm3) and liquid resin (~1
g/cm3), g is gravitational acceleration (9.8 m/s2), and r is the radius of the sphere (1 mm).
The measurements were conducted at room temperature.
5.2.2: Calibration of the Ball Drop Experiment
The validity of the experimental procedure to evaluate viscosity was checked by
measuring the viscosity of glycerol. A diagram showing how the measurements were
conducted is depicted in Figure 5.1. For each experiment, a separate ball was dropped.
The time counting started at 2-3 cm mark. The time at which the ball passed certain
centimeter points (depth of the measurement) on the ruler was registered. Three or four
balls were dropped for each measurement. The measurements were conducted at room
temperature. In addition, the use of a different glass sphere for each measurement did not
have a significant effect on the result variability. The results from the terminal velocity
experiment are shown in Figure 5.1b. The obtained results show that the average velocity
of the sphere is 0.0046 ± 0.0003 m/s (calculated as an average of all the average
velocities for the sphere traveled through the glycerol).
(5.1)

101
Figure 5.1: (a) Schematic diagram of the set-up for the ball drop experiment; (b) the
depth of measurement vs measured velocity for the glycerol.
Figure 5.2: Calculated viscosity of the glass sphere in the glycerol.
From these data, a curve can be made using the velocity, measured at different
depths to calculate the viscosity, as shown in Figure 5.2. The depth of measurement in
a) b)

102
Figure 5.2 is designated by the centimeter marking at which the timer was started, e.g.,
the 3-cm marking in Figure 5.1a. Each of the measurements was repeated three to four
times with a different ball.
Figure 5.2 shows the viscosity of the glycerol as determined in the experiment.
The glycerol viscosity reported in literature (0.79 Pa*s9) was compared with these
measurements. The comparison indicated that apparent viscosity measured here was
within 30 % of the viscosity of glycerol reported elsewhere. Therefore, the experimental
procedure was utilized to estimate the relative change of neat epoxy viscosity during the
curing reaction.
5.2.3: Orientation of MagSiCWs in Epoxy at a Low Concentration
The orientation of the MagSiCWs in the epoxy resin was monitored using optical
microscopy. To conduct the measurements, the magnetically modified whiskers were
dispersed into methanol. Then, the MagSiCW methanol solution was added to the
bisphenol-A epoxy and mixed. The methanol was then evaporated from the solution by
nitrogen stream and vacuum pumped for 10–15 min. The MagSiCWs were dispersed into
the neat epoxy resin at a 0.03 wt. % concentration. Next, DDSA hardener and tertiary
amine catalyst were mixed with the MagSiCWs/epoxy in 1: 1.37: 0.07 proportions for the
epoxy:hardener:catalyst. After mixing, the solution was vacuum pumped (to remove the
bubbles) and then poured into the glass mold. Three layers of double-sided scotch tape
were used as a separator between two glass slides comprising the mold. Two neodymium
magnets were used to create a quasi-uniform 202 G magnetic field to align the whiskers.
The whisker orientation was observed using Olympus MVX10 stereoscope (Figure 5.3).

103
Figure 5.3: Experimental set-up for the observation of orientation of MagSiCWs at low
concentration.
5.3: Results and Discussion
5.3.1: Epoxy Curing
The ball drop method was used to determine the apparent viscosity of the epoxy
resin during curing. Specifically, the change in drag was monitored as a glass sphere
moved through the epoxy resin3-4. The initial viscosity for the uncured resin was found to
be 8.8 Pa*s. The change in apparent viscosity in the course of the curing calculated using
Equation 5.1 is presented in Figure 5.4.
It was found that the epoxy resin reached the gel-point at ~45 hrs, where the
measured viscosity increased exponentially. It is necessary to point out that viscosity
measurements using a 2 mm diameter glass sphere does not capture fully local viscosity
in the vicinity of the whisker being oriented in the epoxy resin. However, the working
time for epoxy materials is dependent on the macroscale observations. Thus, the gel point
and working time of the epoxy resin is determined to be ~45 hours at room temperature.

104
Figure 5.4: The apparent viscosity of the epoxy resin vs. the epoxy curing reaction time
at room temperature.
To complement the viscosity measurement, DSC was used to monitor the extent
of the curing reaction by measuring the magnitude of the released heat related to the
polymerization process. The extent of the curing was determined after 3, 6, 12, 24, and 48
hours of the epoxy curing at room temperature5. The sample of interest was heated from 0
oC to 160 oC at 15 oC/min. Obtained exothermic peak (representing the amount of
uncured epoxy at room temperature) was integrated to obtain the heat of the reaction5.
The calculated value was divided by the initial exotherm (representing the “just prepared”
epoxy resin) to yield the percentage of epoxy material that had not reacted. When
subtracted from 100 % the value gave the extent (degree) of the reaction (Figure 5.5).
0 10 20 30 40 50
0
200
400
600
800
Appare
nt V
iscosity (
Pa*s
)
Time of Reaction (hrs)

105
Figure 5.5: The degree of epoxy curing vs time of the reaction.
The reaction shows a linear trend of progression over time. After ~ 45 hours the
resin reached gelation at room temperature with ~20 % of the material reacted. This left
80 % of the epoxy matrix unreacted. This 80 % of the epoxy are cured at 75 oC in our
curing protocol. Therefore, in principle, curing of the epoxy resin at higher temperature
where viscosity of epoxy resin is much lower, could change the orientation of the
whiskers.
5.3.2: Modeling the Characteristic Time of Orientation
The model for predicting the characteristic time of magnetic orientation
considered the governing forces (drag, moment of torque, and magnetic susceptibility)
affecting the orientation in a viscous liquid. On contrary, inertial forces have a minor role
in the dynamics of nanorods in a composite structure8, 10. Hence, the system for
orientation is primarily controlled by the torque of an applied magnetic field countered by
0
5
10
15
20
0 20 40
Deg
ree
of
Rea
ctio
n (
%)
Time of Reaction(hrs)
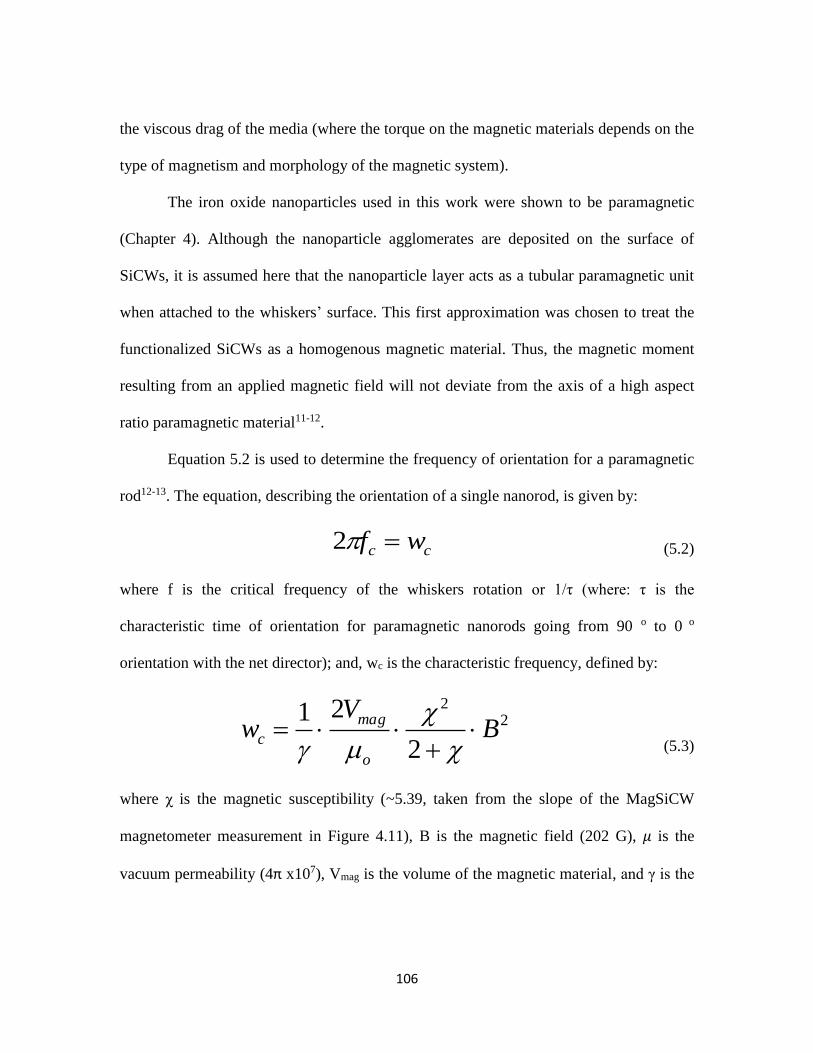
106
the viscous drag of the media (where the torque on the magnetic materials depends on the
type of magnetism and morphology of the magnetic system).
The iron oxide nanoparticles used in this work were shown to be paramagnetic
(Chapter 4). Although the nanoparticle agglomerates are deposited on the surface of
SiCWs, it is assumed here that the nanoparticle layer acts as a tubular paramagnetic unit
when attached to the whiskers’ surface. This first approximation was chosen to treat the
functionalized SiCWs as a homogenous magnetic material. Thus, the magnetic moment
resulting from an applied magnetic field will not deviate from the axis of a high aspect
ratio paramagnetic material11-12.
Equation 5.2 is used to determine the frequency of orientation for a paramagnetic
rod12-13. The equation, describing the orientation of a single nanorod, is given by:
cc wf 2 (5.2)
where f is the critical frequency of the whiskers rotation or 1/τ (where: τ is the
characteristic time of orientation for paramagnetic nanorods going from 90 o to 0 o
orientation with the net director); and, wc is the characteristic frequency, defined by:
22
2
21B
Vw
o
mag
c
(5.3)
where χ is the magnetic susceptibility (~5.39, taken from the slope of the MagSiCW
magnetometer measurement in Figure 4.11), B is the magnetic field (202 G), 𝜇 is the
vacuum permeability (4π x107), Vmag is the volume of the magnetic material, and γ is the

107
drag coefficient8, 11, 13. The drag coefficient and volume of magnetic materials are defined
as:
A
l
w
wd
l
w
)ln(3
3
(5.4)
)(4
22
pwww
mag ddl
V
(5.5)
where η is the initial viscosity of the epoxy resin (~9 Pa*sec), dw is the diameter of the
whisker (400 nm), lw is the average length of the whisker (4200 nm), dw+p is the diameter
of the whisker plus the particles (dw+p>419 nm), and A ≈ 2.48.
Equations 5.3, 5.4, and 5.5 were combined and used to estimate the number of
magnetic nanoparticles needed to create a reasonably practical characteristic time of
orientation (Figure 5.6). The equations were applied to the starting parameters of the
epoxy resin. The number of nanoparticles attached to the SiCWs was changed by
increasing the thickness of the magnetic layer.
The characteristic time of orientation exponentially declines from 250 seconds as
more particles are evenly distributed across the surface of the SiCW. Namely, the
characteristic time is asymptotically approaching 10 sec. The typically fabricated
MagSiCWs possessing a thickness of 110 nm of magnetic nanoparticles were estimated
to have a 24.5 s characteristic time of orientation. Thus, to further evaluate the kinetics of
MagSiCWs’ rotation, the changes in apparent viscosity during curing were used to
determine how the MagSiCWs would orient in the reacting matrix (Figure 5.7).

108
Figure 5.6: The calculated time of orientation vs. the thickness of attached MagNP
within the initial epoxy resin.
Figure 5.7: Calculated characteristic time of magnetic orientation for MagSiCWs.
The characteristic time is linearly dependent on the drag coefficient and
0 20 40 60 80 100 120 1400
50
100
150
200
250
Ch
ara
cte
ristic T
ime
of
Orie
nta
tio
n (
se
c)
Thickness of Magnetic Layer (nm)
0 500 1000 1500 2000 2500
0
200
400
600
800
Viscosity of Solution
Time of Reaction
Characteristic Time of Orientation (s)
Ap
pa
ren
t V
isco
sty
of
Ma
trix
(Pa
*se
c)
0
10
20
30
40
50
Tim
e o
f R
ea
ctio
n (
hrs
)

109
Figure 5.8: The distribution of MagSiCWs’ orientation within a constant field (from
images taken at specific reactionary times) during the curing process of the neat epoxy,
as observed with optical microscopy.
consequently, on viscosity of the medium. Hence, the viscosity will greatly limit the
rotation of the whisker when the viscosity reaches 200 Pa*s or ~40 hours into the
reaction (Figure 5.4). The characteristic time at this point would be equal to 10 min.
5.3.3: Magnetic Orientation of MagSiCWs in a Curing Epoxy Resin
The experimental assessment of the characteristic time for the rotation of
MagSiCWs were performed in the low concentration orientation experiments during the
curing of the neat epoxy system. Low concentration of the MagSiCWs was used to avoid
indirect (ex: whisker-to-whisker resin mediated effects) and direct (ex: whisker-to-
whisker contact) interactions. Figure 5.8 displays the time of orientation against the time

110
Figure 5.9: Experimentally measured time of orientation over the experimentally
measured apparent viscosity.
of the curing reaction, where each point is a histogram showing the distribution of
whisker at that time point. For each of these histograms, the orientation of 40–50
MagSiCWs was experimentally measured. It can be observed that the whiskers had
random orientation prior to the application of magnetic field.
As, a constant 202 G magnetic field was applied to the samples the orientation of
the whiskers was observed and monitored. Five hours into the reaction, the rotation of the
whiskers slowed down significantly, although, the increase in the resin viscosity was just
from 9 to 12 Pa*s. The epoxy matrix had only cured to a maximum of 5 % during this
time span. In Figure 5.9, the time necessary for the orientation is plotted against the
apparent viscosity of the epoxy material. The time of orientation was recorded when the
average orientation of the whiskers was less than 10 o from the net director.
9.0 9.5 10.0 10.5 11.0 11.5 12.0
3
4
5
6
7
8
Tim
e for
Orienta
tion (
min
)
Viscosity (Pa*sec)

111
The theoretical calculations showed a linear trend for the change of orientation
time vs viscosity (Figure 5.7), therefore the exponential trend observed in the experiment
(Figure 5.9) was unexpected. The trend shows that the real system is more complex than
the model one. It was predicted via modeling that the orientation time for the whiskers
would be on the level of seconds at these viscosities. However, their real orientation time
was on a scale of minutes. In practical terms, it can be pointed that the orientation of
whiskers must be done before the overall viscosity of the epoxy resin reaches 11.5 Pa*s
or the reaction time reaches 6.5 hours. The deviation might be related to the local
viscosity increases within the vicinity of the whiskers. It can be caused by grafting of the
epoxy polymer to the whiskers via PAA on the MagSiCW’s surface. Such grafting would
increase the hydrodynamic radius of the whisker and, as the result, rise the drag value.
The described changes would conclude in larger value of the characteristic time.
5.4: Conclusions
The following conclusions can be made as a result of the study reported in Chapter 5:
The orientation time was predicted via modeling to have a linear trend with
increase in the apparent viscosity. However, the orientation of the MagSiCWs in
the experiment did not follow the model calculations.
The experimental orientation time for the MagSiCWs increased exponentially as
the reaction progressed from 4.5 hours to 6.5 hours. The whiskers required
orientation time on a scale of minutes.

112
It was hypothesized that the orientation of the MagSiCWs was influenced more
by the local interaction of the curing epoxy resin with the whisker surface
modified with the grafted layer of epoxy polymer.

113
5.5: References
1. Putz, K. W.; Palmeri, M. J.; Cohn, R. B.; Andrews, R.; Brinson, L. C., Effect of
cross-link density on interphase creation in polymer nanocomposites. Macromolecules
2008, 41 (18), 6752-6756.
2. Kim, B.; Choi, J.; Yang, S.; Yu, S.; Cho, M., Influence of crosslink density on the
interfacial characteristics of epoxy nanocomposites. Polymer 2015, 60, 186-197.
3. Stokes, G. G., On the effect of the internal friction of fluids on the motion of
pendulums. Trans Cambridge Philos Soc 1851, 9, 8-105.
4. Lamb, H., Hydrodynamics. 6th ed.; Cambridge University Press Cambridge,
1932.
5. Abenojara, J.; Encinasa, N.; del Realb, J. C.; Martínez, M. A., Polymerization
kinetics of boron carbide/epoxy composites. Thermochim Acta 2014, 575, 144-150.
6. Gu, Y.; Kornev, K. G., Alignment of magnetic nanorods in solidifying films. Part
Part Syst Char 2013, 30 (11), 958-963.
7. Gu, Y.; Kornev, K. G., Ferromagnetic nanorods in applications to control of the
in‐plane anisotropy of composite films and for in situ characterization of the film
rheology. Adv Func Mater 2016, 26 (22), 3796-3808.
8. Tokarev, A.; Kaufman, B.; Gu, Y.; Andrukh, T.; Adler, P. H.; Kornev, K. G.,
Probing viscosity of nanoliter droplets of butterfly saliva by magnetic rotational
spectroscopy. Appl Phys Lett 2013, 102 (3), 33701.
9. Segur, J. B.; Oberstar, H. E., Viscosity of glycerol and its aqueous solutions. Ind
Eng Chem 1951, 43 (9), 2117-2120.
10. Tokarev, A.; Luzinov, I.; Owens, J. R.; Kornev, K. G., Magnetic rotational
spectroscopy with nanorods to probe time-dependent rheology of microdroplets.
Langmuir 2012, 28 (26), 10064-71.
11. Frka-Petesic, B.; Erglis, K.; Berret, J. F.; Cebers, A.; Dupuis, V.; Fresnais, J.;
Sandre, O.; Perzynski, R., Dynamics of paramagnetic nanostructured rods under rotating
field. J Magn Magn Mater 2011, 323 (10), 1309-1313.
12. Landau, L. D.; Lifshitz, E. M., Electrodynamics of continuous media. Pergamon:
Oxford 1960.
13. Kornev , K. G.; Gu, Y.; Aprelev, P.; Tokarev, A., Magnetic rotational
spectroscopy for probing rheology of nanoliter droplets and thin films. In

114
Characterization Tools for Nanoscience & Nanotechnology, Kumar, C., Ed. Springer:
2015; Vol. 6.

115
CHAPTER SIX
FABRICATION AND STUDY OF MAGNETICALLY ORIENTED SICW/EPOXY
NANOCOMPOSITES
6.1: Introduction
The study of the orientation of the SiCWs showed that the working period for
orientation was about 6 hours. However, this time is shorter than the one predicted by
modeling. Therefore, it was hypothesized that the whiskers actively participate in the
curing of the epoxy taking place in their vicinity. Namely, the surface carboxylic acid
groups react with the epoxy functional groups causing the formation of an extended
interphase zone1-2. To this end, this chapter describes an experiment aiming to clarify this
matter. The MagSiCWs were extracted from the curing epoxy composite (after reacting for
5 hours) and examined using TGA and SEM. This experiment helped us to evaluate the
level of grafting of the epoxy resin to the MagSiCWs. It is necessary to note that the
mechanism and kinetics of the epoxy/anhydride curing have previously been investigated3-
6,7. In addition, the effects of fillers and additives on the epoxy/anhydride resin systems
have been studied for SiO2 surfaces using DSC7. None of these studies considered the effect
of surface chemistry on the epoxy curing reaction. Thus, in this part of the work DSC and
ATR-FTIR were used to elucidate the influence of MagSiCWs on the curing reaction4, 7.
The methodology for the magnetic orientation of MagSiCWs in epoxy composite
materials was developed. Specifically, three methods of magnetic field application were
used to find an optimal protocol to apply magnetic field for orientation of the SiCWs. Neat
epoxy and the composite materials with oriented and non-oriented SiCWs were fabricated
and their mechanical and thermal properties were evaluated. First, thermo-mechanical

116
properties were investigated using dynamic mechanical analysis (DMA). DMA provided
insights into the interfacial and structural aspect of the mechanical properties8-11. Second,
the thermal properties of the composite materials were investigated using DSC. DSC
analysis contributed additional information on the composites’ Tg12-14. The glass transition
and thermo-mechanical behavior of the composites have been used to investigate the
interphase zone1, 8, 14-16. Additionally, the composite materials’ magnetic properties were
studied. After characterization of the composites, their microstructure was investigated
using variable pressure SEM and swelling experiments9.
6.2: Experimental
6.2.1: Fabrication of the Composites
The 5 mg/ml methanol suspension of MagSiCWs was mixed with pure epoxy resin,
DGEBA, and dried overnight under a stream of nitrogen to remove methanol. Then, the
epoxy resin was prepared at 0.41:0.56:0.03 volume ratios between DGEBA/dodecyl
succinic anhydride (DDSA) hardener/N-benzyl dimethyl amine (BDMA) catalysts. Then,
the resin was vacuumized to remove any air bubbles created during mixing. The same
procedure was utilized for the fabrication of the neat epoxy resins used in this work for
comparison purpose.
After the material was prepared, the resin suspensions of MagSiCWs were poured
into a Teflon mold. Teflon was chosen because it is one of the few materials epoxy does
not adhere to and it is thermally stable at the curing temperature of the epoxy. The epoxy
resin was cured at room temperature until the gelation point (about 48 hours) and, then,
placed into an oven for 24 hours at 75 oC to complete the curing process. Parameters of
curing kinetics, whiskers content in the matrix, Tg and the degree of curing were
117
determined using DSC and ATR-FTIR, TGA and DSC, respectively. In addition, SEM
imaging was utilized for characterization of the composite morphology, optical microscope
was used to observe orientation kinetics, and DMA was employed to obtain Tg and moduli
of the nanocomposites.
6.2.2: Curing Kinetics Monitored using DSC
The exothermic peaks related to the epoxy curing process were recorded with DSC
using a methodology described elsewhere17. The DSC measurements were carried out for
samples initially cured at room temperature for 3, 6, 12, 24, and 48 hours.
6.2.3: Curing Kinetics Monitored using FTIR
The utilization of the ATR-FTIR technique allowed acquiring IR spectra with very
little material used. As the prepared epoxy and composite resins were curing at room
temperature (at ambient humidity), the samples were drop casted by a glass pipette onto an
ATR crystal at 0, 3, 6, 12, 24 and 48 hours into the reaction. The obtained results were
converted to the degree of reaction by integrating the 913 cm-1 and 1780 cm-1 FTIR peaks
of epoxy and anhydride functional groups involved in the curing. The initial values for
spectral peaks were normalized to the 1470 cm-1 methyl peak. The 1470 cm-1 peak was
chosen because the methyl groups are not involved in the reaction and the area under the
peak was approximately the same throughout the course of the reaction. Then, Equation
6.1 was used to calculate the degree of reacted functional groups (α):
𝛼 = (1 −𝐴𝑡
𝐴𝑜) ∗ 100 (6.1)
where, At and Ao – normalized peak’s area for the time t and original area at time 0,
respectively.

118
6.2.4: Determination of the Amount of Epoxy Grafted to MagSiCWs
The whiskers were mixed with the epoxy resin of the given composition (as stated
previously). Then, the mixture was left to react for 5 hours and then was dissolved in
methanol. From this solution, the whiskers were magnetically separated for further
analysis. Four cleaning cycles of rinsing with methanol were performed to remove non-
grafted epoxy. The difference between the MagSiCWs removed from the epoxy and
original MagSiCWs’ surface structure was investigated using TGA and SEM/TEM. The
TGA was used to determine the addition weight gain by the whiskers due to the epoxy
grafting. The TGA runs were performed up to 750 oC at 20 oC/min in a dry air environment.
The surface morphology of the MagSiCWs was imaged by Hitachi HD2000 SEM/TEM.
For the imaging the samples were dispersed in MEK and drop-casted onto a Formvar
carbon, and copper wire TEM grids.
6.2.5: Orientation of MagSiCWs in Epoxy Resin
A 216 G magnetic field was used to orient the MagSiCWs in the epoxy matrix.
Three different methods were conceived and studied to determine the method that provides
the highest degree of the whiskers orientation. The magnetic field was applied after the
composite resin had already been cast into the mold. The first method of orientation was
called the ‘singular’ method. It was a one-time magnetic alignment for 15 min. at 1, 2, or
3.5 hours into the curing process. The next method of orientation was called the ‘pulsed’
method. It included a pulsed magnetic alignment applied to a single sample for 15 min. at
4 separate times, 1, 2, 3.5, and 5 hours during the curing of the epoxy resin. The last method
of orientation was called the ‘continuous’ alignment method. In the method magnetic field
was applied to the composite continuously for the 5 hours of the curing process.

119
6.2.6: Thermo-Mechanical Characterization by DMA
Neat epoxy, non-oriented nanocomposites, and oriented nanocomposites were
fabricated for the DMA testing. They were casted into the mold with a length of ~8.00 mm,
a width of ~5.00 mm, and a thickness of ~0.34 mm. Then, the ‘pulsed’ orientation method
was utilized to align the MagSiCWs. After the curing process, the composite samples were
extracted from the Teflon mold and tested. The DMA testing was run at 2 oC/min from -
20 oC to 150 oC using frequencies of 1, 2, and 5 Hz applying 5 μm amplitude of oscillation.
Three to four parallel samples were fabricated and analyzed.
6.2.6: Thermal Characterization using DSC
The DSC samples were prepared from the mold-casted epoxy and thermally cured
and composite samples. They were weighed in the range of 5–10 mg and sealed into an
aluminum pan with an aluminum lid. The first DSC run was from -10 oC to 150 oC at 15
oC/min. Then, the samples were cooled to -10 oC at 15 oC/min and run for the second time
from -10 oC to 150 oC at 15 oC/min.
6.2.7: Magnetic Characterization of the Composite Materials
The samples of the composite materials were cut into 3x3 mm squares with a
thickness of approximately 0.34 mm. The average difference between the side lengths was
0.2 mm. Magnetization curves were measured for two samples of non-oriented composite
and three samples of oriented composite. Samples of nanocomposite materials were cut
into 3-mm squares having a thickness of approximately 0.34 mm. The average difference
in length between the sides of the squares was 200 μm. Magnetic hysteresis loops were
measured for two samples of nanocomposite with non-oriented embedded nanorods and
three samples of nanocomposite with oriented embedded nanorods. For each sample, two

120
magnetic hysteresis measurements were performed: one measurement with the magnetic
field oriented along one side of the sample and the other measurement with the magnetic
field oriented along the other side of the sample. By comparing the hysteresis loops along
each side of the sample, an estimation of magnetic anisotropy was made for oriented and
non-oriented nanocomposites. Magnetic characterization and data interpretation was
conducted by Pavel Aprelev under the guidance of Prof. K. Kornev.
6.2.8: SEM Analysis of Composites’ Microstructure
SEM was used to evaluate the microstructure of the composite materials. The
samples were dipped into liquid nitrogen and broken in the longitudinal direction. The
samples were then attached to an aluminum SEM puck with a carbon tape to have the
broken edge facing a detector. The distribution and orientation of the nanoparticulates were
analyzed manually using Gwyddion software. The distribution of the SiCWs in the matrix
was evaluated by selecting 25–35 random whiskers per an image and measuring the
distance to the next closest whiskers (usually 8–13 whiskers). The distance was measured
between the centers of the whiskers. The orientation was analyzed by identifying the
whiskers’ shape and drawing a line through the center of the whisker going from one end
of the whisker to another end. Then, the orientation from the set net director was calculated
using the Gwyddion software. There were some groups/agglomerates of whiskers within
the composite matrix. These agglomerates were counted and the number per unit area of
the sample was calculated. This procedure was performed for two to three images and two
different samples for each set. The size of the agglomerates was determined by drawing a
box around them and measuring its size.

121
6.2.9: Determination of Composites’ Cross-Linking Density
In a thermoset composite material, cross-linking density is one of the most
important structural characteristics. The density of cross-links can be determined using
statistical thermodynamics of elasticity and data on swelling of the thermoset in a solvent9.
The thermodynamic expression involving cross-linking density is presented in its
simplified form in Equation 6.29:
where EMc represents the modulus of the material 40 degrees past the mechanical Tg
(denoted by the loss modulus peak), R is the gas constant, T is the temperature in Kelvin
of EMc, and ρx-link is the cross-linking density9.
The swelling experiment relied on the diffusion of a solvent into the cross-linked
composite. Acetone was chosen as the solvent, as it is a good solvent for phthalic anhydride
cross-linked epoxy18. The weight of the sample was measured before and after the swelling.
The swelling maximum for the composite was reached after ~24 hours in the solvent.
Therefore, the composite samples were placed into a glass vial containing 10–15 ml of
acetone and left in dark at room temperature for 24 hours. The weight gain of the sample
is equivalent to the amount of solvent swelling the sample. The swelling data was used to
calculate the cross-linking density using the Flory-Rhener expression for the tetra
functional affine network, Equation 6.39:
𝜌𝑥−𝑙𝑖𝑛𝑘 = 2 ∗ln(1−𝑣2)+𝑣2+𝜒𝑣2
2
𝑉1(𝑣22
−𝑣21/3
)
𝐸𝑀𝑐 ≈𝜌𝑥−𝑙𝑖𝑛𝑘
2𝑅𝑇
(6.3)
(6.2)

122
where 𝜌𝑥−𝑙𝑖𝑛𝑘 is the cross-linking density, 𝑣2 is the volume fraction of the polymer at
equilibrium, 𝜒 is the polymer-solvent interaction parameter (~0.418), and 𝑉1 is the molar
volume of the solvent. For this experiment, 𝑣2 was determined using Equation 6.4:
𝑣2 = (1 + (𝑚𝑒𝑞−𝑚𝑑
𝑚𝑑) (
𝜌2
𝜌1))−1
where 𝜌1 and 𝜌2 are the densities of the polymer (~1 g/cm3) and solvent (0.79 g/cm3), and
𝑚𝑑 and 𝑚𝑒𝑞 are the dried mass and swollen mass of the composite materials. Thus, by the
change in weight of the material due to swelling, a rough estimate of the cross-linking
density can be made.
6.3: Results and Discussion
6.3.1: Curing of Epoxy Resin in the Presence of MagSiCWs
The study of chemical reaction between functional groups on the MagSiCW’s
surface and epoxy resin is described in this section. It is well-known that carboxylic acid
groups, of PAA, can react with epoxy19. Therefore, DSC and ATR-FTIR were used to study
the kinetics of the epoxy resin curing in the presence of the MagSiCWs. First, DSC was
used to investigate the extent of the reaction. Then, ATR-FTIR was used to determine the
chemical pathway of the epoxy curing.
Studies of Epoxy Curing using DSC
The degree of epoxy curing at room temperature for the composites was monitored
and compared with the one determined for neat epoxy polymerization (Figure 6.1). The
obtained results showed that the whiskers changed the curing rate. In the presence of the
whiskers, the resin cured ~20 % faster than the neat epoxy, indicating that the whiskers
(6.4)

123
chemically interacted with the curing matrix. To further investigate the effect of
MagSiCWs on the polymerization of epoxy, the temperature of the curing was varied to
evaluate the activation energy (Ea) of the reaction. The Ea for the neat epoxy and the epoxy
with MagSiCWs were determined using DSC. The Kissinger method was used, as
published elsewhere7. The experimental results are shown in Figure 6.2, where the heating
rate divided by Tp squared (Tp - peak temperature of the reaction exotherm) is plotted
versus 1/Tp.
The slope of this line was taken as Ea/R, from the Arrhenius-like equation proposed
by Kissinger:
ln (ℎ𝑒𝑎𝑡𝑖𝑛𝑔 𝑟𝑎𝑡𝑒
𝑇𝑝2 ) = −
𝐸𝑎
𝑅𝑇𝑝+ ln (𝐴) (6.4)
0 10 20 30 40 50
0
5
10
15
20
25
De
gre
e o
f R
ea
ctio
n (
%)
Time of Reaction (hours)
MagSiCWs in Epoxy
Neat Epoxy
Figure 6.1: The degree of epoxy curing over the time of reaction at room temperature

124
where the heating rate value is from the DSC experiments, Tp is the peak temperature, Ea
is the activation energy for the reaction, R is the gas constant, and A is the pre-exponential
factor.
The Ea of the neat epoxy and the composite were 78.2 J/mol and 72.5 J/mol,
respectively. MagSiCWs can be considered to be a reaction accelerant due to a 6 J/mol
decrease in the activation energy7 caused by the presence of the whiskers.
The increased rate of polymerization may cause changes in the structure of the
matrix and cross-linking density in comparison to the neat epoxy system7, 20. It is suggested
that the change in the polymerization is related to the high concentration of PAA carboxyl
groups on the surface of the whiskers. This indicates that PAA creates an alternative
reactive pathway that accelerates the curing at the beginning of the process. In turn, these
changes in local concentrations are hypothesized to change the matrix structure. Thus,
ATR-FTIR was used to characterize the mechanism of the curing reaction4.
2.32 2.36 2.40 2.44 2.48
-9.6
-9.2
-8.8
-8.4 Comp-Func-SiCW
Neat Epoxy
ln (
he
atin
g r
ate
/Tp
2)
1/Tp (1/1000K)
Figure 6.2: The plot of ln(heating rate/Tp2) vs. 1/Tp
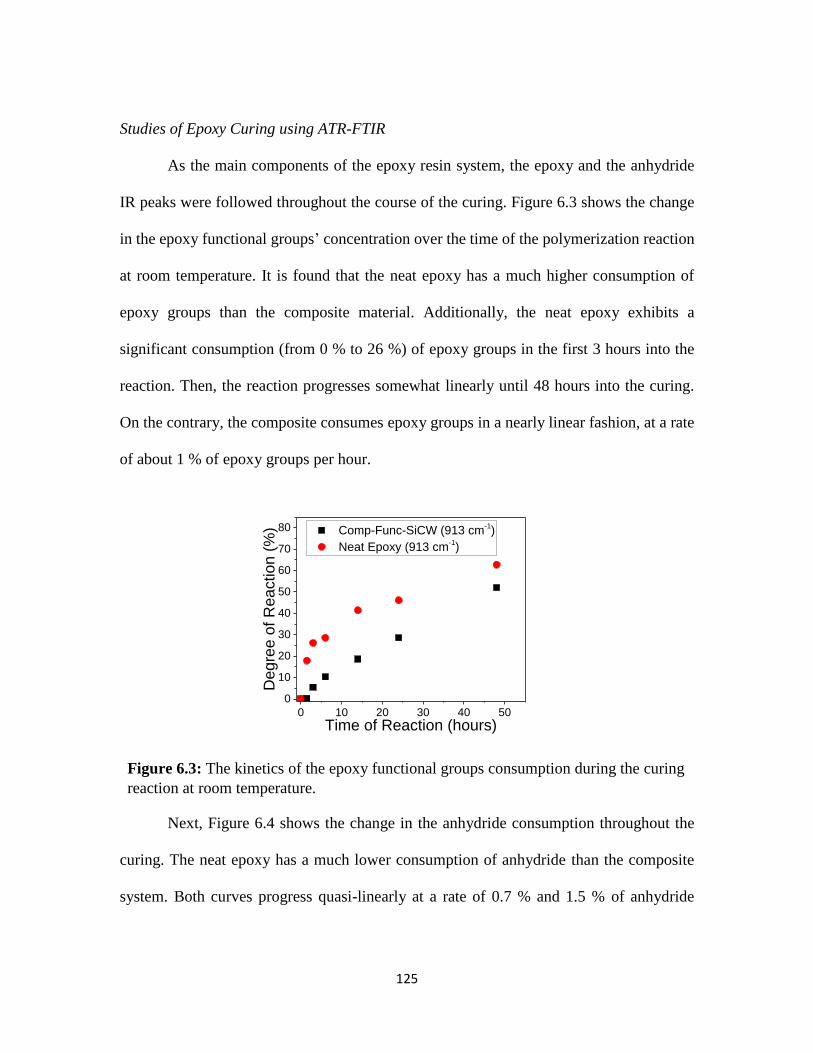
125
Studies of Epoxy Curing using ATR-FTIR
As the main components of the epoxy resin system, the epoxy and the anhydride
IR peaks were followed throughout the course of the curing. Figure 6.3 shows the change
in the epoxy functional groups’ concentration over the time of the polymerization reaction
at room temperature. It is found that the neat epoxy has a much higher consumption of
epoxy groups than the composite material. Additionally, the neat epoxy exhibits a
significant consumption (from 0 % to 26 %) of epoxy groups in the first 3 hours into the
reaction. Then, the reaction progresses somewhat linearly until 48 hours into the curing.
On the contrary, the composite consumes epoxy groups in a nearly linear fashion, at a rate
of about 1 % of epoxy groups per hour.
Next, Figure 6.4 shows the change in the anhydride consumption throughout the
curing. The neat epoxy has a much lower consumption of anhydride than the composite
system. Both curves progress quasi-linearly at a rate of 0.7 % and 1.5 % of anhydride
0 10 20 30 40 50
0
10
20
30
40
50
60
70
80
De
gre
e o
f R
ea
ctio
n (
%)
Time of Reaction (hours)
Comp-Func-SiCW (913 cm-1)
Neat Epoxy (913 cm-1)
Figure 6.3: The kinetics of the epoxy functional groups consumption during the curing
reaction at room temperature.

126
groups consumed per hour for the neat epoxy and the composite, respectively. Based on
these results, a diagram of the reaction was compiled to show how the composition of the
epoxy resin is changing with the curing extent (Figure 6.5).
The reaction pathway is directly related to the chemical reactions between the
substances in the material. For instance, if the dependence is linear, the curing is due to a
3hrs
6hrs
12hrs
24hrs
48hrs
3hrs 6hrs
12hrs 24hrs
48hrs
0
20
40
60
80
0 20 40 60 80
Deg
ree
of
An
hyd
rid
e
Co
nsu
mp
tion
(%
)
Degree of Epoxy Consumption (%)
0 10 20 30 40 50
0
10
20
30
40
50
60
70
80
De
gre
e o
f R
ea
ctio
n (
%)
Time of Reaction (hours)
Comp-Func-SiCW (1780 cm-1)
Neat Epoxy (1780 cm-1)
Figure 6.4: The kinetics of anhydride consumption during the epoxy curing reaction at
room temperature.
Figure 6.5: Change in the epoxy resin composition during the course of the curing reaction
for the composite materials (▲) and the neat epoxy resin (●).

127
1:1 reaction of the epoxy and the anhydrides. In turn, the epoxy group consumption is
favored in the neat epoxy resin, and the anhydride groups consumption is favored in the
composite epoxy system. Hence, the functionalized whiskers cause the polymerization
process to change its chemical pathway to the preferential consumption of the DDSA to
form ester or acid linkages bonds with the acrylic acid or epoxy groups3. It is necessary to
point out that the change in the chemical processes occurring during the epoxy
polymerization can change the internal structure of the composite materials.
6.3.2: Grafting of Epoxy Polymer to MagSiCWs
Now that the change in the polymerization process is observed, the possibility of
grafting epoxy polymer to MagSiCWs was investigated. First, TGA was used to determine
if the anchoring of epoxy polymer to the MagSiCWs’ surface (Figure 6.6) is occurring.
86
88
90
92
94
96
98
100
102
0 100 200 300 400 500 600
Wei
gh
t P
erce
nt
(%)
Temperature (°C)
Figure 6.6: TGA curves for MagSiCWs soaked in epoxy for 6 hours (──) and original
MagSiCWs (──).

128
The TGA data shown in Figure 6.6 revealed that epoxy polymer was grafted to the
whiskers. Indeed, the MagSiCWs separated from the resin lost 11.4 wt. %, while the non-
reacted MagSiCWs lost just 8.0 wt. % when heated up to 600 oC. The average surface
coverage was calculated using Equation 3.5. It was found that the MagSiCWs were covered
with the polymer layer of 12 nm thickness. This would translate to a swelled polymer layer
on the order of 60–120 nm from surface. (The estimation is based on the swelling ability
of polymer brushes21.) Next, the surface morphology of the MagSiCWs reacted with the
epoxy was imaged using TEM. Figure 6.7 shows the morphology of the SiCW after curing
in the epoxy for 6 hours. The grafted epoxy is not clearly seen in the image. Therefore, the
growth of the epoxy chains is suggested to be within the agglomerated MagNPs attached
Figure 6.7: TEM image of the MagSiCWs’ surface after soaking in the curing epoxy resin
for 6 hours.

129
to the SiCWs. Thus, it could be concluded that the epoxy polymer interpenetrated the
agglomerate structures and created a MagNPs/PAA/Epoxy/DDSA composite as the
interphase.
6.3.3: Magnetic Orientation Methods for MagSiCWs in the Epoxy Resin
The ‘singular’, ‘pulsed’, and ‘continuous’ magnetic field application methods were
used to determine the most effective methodology for the orientation of MagSiCWs at 3
vol. % in the epoxy matrix. To observe the orientation the samples were broken in liquid
nitrogen in the longitudinal direction and imaged. The typical images are shown in Figure
6.8. The images clearly show the microstructure of the nanocomposites, such as, the
particulates’ spatial distribution and orientation. It is obvious that the orientation of the
whiskers in the composite is directly related to the applied magnetic field. A histogram of
the level of the MagSiCWs’ orientation is plotted in Figure 6.9 for the different magnetic
field application methods.
a) b)
Figure 6.8: SEM images of composite materials (a) with a magnetic orientation and (b)
without a magnetic orientation.

130
The distribution was determined from the measurement of 450–600 different whiskers
from two to three images for each sample made. The ‘singular’ method had three parallel
samples, while the ‘pulsed’ and ‘continuous’ methods had two parallel samples.
The comparison between the methods of magnetic alignment indicated that the 'pulsed'
method of alignment resulted in the highest degree of orientation. The average orientation
for the ‘pulsed’ alignment had an average orientation of 24o from the net director. In
contrast, the average orientation for the ‘singular’ and ‘continuous’ methods were 36o and
30o, respectively. We suggest that in the ‘singular’ alignment method, local internal stresses
developed during the curing of the epoxy and the associated matrix relaxation decreased
the level of the orientation after the magnetic field was released. In addition, the total
orientation time in this method was significantly shorter than for the ‘pulsed’ and
‘continuous’ methods. In the ‘continuous’ method the sample was influenced by the
magnetic field for an extended period enabling MagSiCWs to attain higher level of
alignment and preventing possible relaxation of the whiskers. However, with an extended
application of the magnetic field the migration of the whiskers to the magnets was initiated.
Therefore, we concluded that the migration could disrupt uniformity of the distribution of
the whiskers in the epoxy matrix. Conversely, the short-term application of the magnetic
field in the ‘pulsed’ method allowed high orientation levels to be attained due to the
sufficiently long cumulative time of interaction with the magnetic field and prevention of
excessive relaxation resulting from repetitive application. Hence, the ‘pulsed’ method was
selected for fabrication of the nanocomposite materials in this research.

131
Figure 6.9: The level of MagSiCWs orientation in epoxy composite for the different
methods of magnetic field application. Continuous: the continuous application of magnetic
field to the composite for 4 hours (from 1hr to 5hrs into the curing). Singular: the magnetic
field was applied once for 15 mins at 1, 2, or 3.5 hrs (one application per sample) during
the curing. Pulsed: magnetic field was applied to a single sample for 15min 4 times (at 1,
2, 3.5 and 5 hours) during the curing.
0-10
10-2
0
20-3
0
30-4
0
40-5
0
50-6
0
60-7
0
70-8
0
80-9
0 --
0
5
10
15
20
25
30
35
40 Singular application 1.0hr
Singular application 2.0hr
Singular application 3.5hr
Pe
rce
nt
Ma
teri
al (%
)
Angle from Net Director (o)
0-10
10-2
0
20-3
0
30-4
0
40-5
0
50-6
0
60-7
0
70-8
0
80-9
0 --
0
5
10
15
20
25
30 Pulsed application
Pe
rce
nt
Ma
teri
al (%
)
Angle from Net Director (o)
0-10
10-2
0
20-3
0
30-4
0
40-5
0
50-6
0
60-7
0
70-8
0
80-9
0 --
0
5
10
15
20
25
30 No magnetic orientation
Pe
rce
nt
Ma
teri
al (%
)
Angle from Net Director (o
)
0-10
10-2
0
20-3
0
30-4
0
40-5
0
50-6
0
60-7
0
70-8
0
80-9
0 --
0
5
10
15
20
25
30 Continuous apllication
Perc
en
t M
ate
rial (%
)
Angle from Net Director (o
)
132
6.3.4: Properties of the MagSiCW/Epoxy Composite Materials
Interphase formation
Thermal transitions and mechanical behavior of nanocomposite materials have
been reported to significantly deviate from the values recorded for the unfilled polymer
matrix.1, 14-15, 22-27 The observed positive or negative deviations are associated with the
formation of an interphase in the vicinity of the nanoscale filler. The polymer chains
involved in the interphase demonstrated fundamental changes in mobility (relaxation time)
due to interaction with the filler surface. In the nanocomposites (possessing a high ratio
between the surface of the filler and the volume of the matrix), extended interphase zones
were found, which can percolate through the entire nanocomposite and dominate the
properties of the material.1 In addition, for thermoset materials (like epoxy resins)
synthesized in the presence of the nanoscale filler, chemical reaction and/or interaction
between the monomers and the surface can also change the chemical structure of the
polymer materials, such as cross-linking density.
In general, formation of extended interphases has been reported for epoxy
nanocomposites. Using microscopy and nanoindentation methods the extent of the
interfacial region in the composites was determined to be between tens of nanometers and
several microns.1, 14, 22-23, 28-30 If the surface of the filler was interacting with the epoxy
matrix, formation of interphases with thicknesses between hundreds of nanometers and
several microns were reported.28, 31-32 In terms of mechanical properties, the interphase
region can demonstrate a higher or lower modulus in comparison to the bulk polymer.
Within a single interphase, variation of the modulus from lower to higher values compared

133
to the modulus for the bulk material was reported as well.28 We note that in some examples
the glass transition temperature (Tg) of the epoxy composite material increased through
incorporation of the nanoscale filler, indicating formation of an interphase possessing a
higher glass transition temperature.1, 14 Conversely, many examples of depressed Tg are
reported for epoxy composites.1
Because the influence of the MagSiCWs on the curing process is significant, we
assume the formation of interphases in the nanocomposites with thicknesses between
hundreds of nanometers and several microns. We can identify at least three distinct
structural domains in the nanocomposite material: (A) an MagNP layer impregnated with
epoxy polymer with the thickness of approximately 110 nm and the epoxy matrix near the
layer, (B) a domain located next to the domain A, and (C) an epoxy network unaffected by
the presence of the MagSiCWs. The domains A and B constitute the interphase in the
nanocomposite.
Thermal characterization of the nanocomposites
We conducted DSC studies of the nanocomposites to observe the behavior of the epoxy
materials in the Tg region. Figure 6.10a illustrates that the behavior of the "as fabricated"
neat epoxy and nanocomposite materials is quite different in the Tg region. The neat epoxy
and non-oriented composite clearly demonstrated enthalpic relaxations associated with the
transition from a nonequilibrium conformational state of the polymer chains to an
equilibrium state upon annealing.14 The midpoint Tg value of the neat epoxy was observed
to be ~ 60oC and is approximately 13oC higher than that of the non-oriented composite.
The observed result indicated formation of an extended interphase with a lower Tg value

134
Figure 6.10: DSC traces for neat epoxy and epoxy/MagSiCW nanocomposites. (a) is the
first run and (b) is the second run.
30 40 50 60 70 80 90
-0.6
-0.5
-0.4
-0.3
-0.2
-0.1
0.0
Neat Epoxy
Nonoriented MagSICWs
Oriented MagSiCWs
Heat
Flo
w (
W/g
)
Temperature (o
C)
(a)
30 40 50 60 70 80 90
-0.6
-0.5
-0.4
-0.3
-0.2
-0.1
0.0
He
at
Flo
w (
W/g
)
Temperature (o
C)
Neat Epoxy
Nonoriented MagSiCWs
Oriented MagSiCWs
(b)

135
near the MagSiCWs. The magnetic orientation of the whiskers dramatically changes the
behavior of the material upon heating. The oriented composite has a Tg transition where
the midpoint Tg value is only about 2oC less than that of the neat epoxy. The DSC
measurements also revealed that the oriented composite had no visible enthalpic relaxation
and had an exceptionally extended (~30oC) Tg region. The region starts at the similar to
non-oriented composite temperature and ends at the temperature higher than that for the
neat epoxy. The observed results point to the formation of an extended interphase where
both higher Tg and lower Tg zones are present.
From our analysis of the experimental results we propose the following coarse-
grained model for the oriented and non-oriented epoxy-MagSiCW composite material. We
suggest that the low Tg region (domain A with polymer chains possessing higher mobility
than bulk epoxy) is located closer to the whisker surface and is associated with epoxy
network disruption caused by the highly porous layer of nanoparticles and the high
concentration of carboxylic groups of PAA. Domain B has a higher Tg value than the neat
epoxy with chains having lower mobility caused by connectivity of the cross-linked chains
to the solid surface via the chains involved in the domain A. Such behavior of the interfacial
region in epoxy composites has been experimentally observed via nanomechanical
measurements.28 From straightforward geometrical considerations, it is obvious that the
volume fraction of domain B in the oriented composites is higher than in the non-oriented
material. The reason is the significant overlap between domains B for the randomly
distributed whiskers. Therefore, in the oriented composite, where the higher Tg value of

136
domain B compensates for the lower Tg value of domain A, the glass transition temperature
approaches that of the neat epoxy material. In the non-oriented nanocomposite, having a
smaller extent of domain B, the Tg compensation does not occur.
Figure 6.10b demonstrates the DSC results for the second run, in which the
fabrication history of the materials is erased via annealing. The DSC traces now show no
visible signs of enthalpic relaxations indicating that polymer chains in the epoxy approach
their equilibrium conformations. In general, the midpoint Tg values are similar to the ones
obtained for "as fabricated" materials. The Tg region of the oriented composite materials is
reduced in breadth and is comparable to the Tg value of the neat epoxy matrix, whereas the
non-oriented composites again demonstrated lower Tg values. The obtained results
indicated that the proposed coarse-grain model for the composite materials can be applied
for the annealed samples as well, and the differences in Tg values of different materials are
not artefacts of the fabrication procedure.
Thermomechanical properties of the nanocomposites
The neat epoxy, the epoxy with randomly orientated MagSiCWs, and the
directionally oriented MagSiCW nanocomposites were tested by tensile DMA to evaluate
their mechanical properties at different temperatures. The dependence of the storage
modulus, E/ for the materials is presented in Figure 11a. It is evident that below Tg the
composites exhibited higher modulus than the pure epoxy matrix pointing to the efficient
stress transfer from the matrix to the whiskers in the mechanical measurements. The room
temperature value of E/ for the neat epoxy was 1.52 ± 0.02 GPa. The randomly oriented

137
Figure 6.11: DMA results: (a) the storage modulus, E/ and (b) tan δ data for neat epoxy
and epoxy/MagSiCW composites.
-40 -20 0 20 40 60 80 100 120 140 160
0
500
1000
1500
2000
2500(1) Neat epoxy
(2) Nonoriented MagSiCWs
(3) Oriented MagSiCWs
Sto
rag
e m
od
ulu
s (
MP
a)
Temperature (o
C)
1
2
3
(a)
0 20 40 60 80 100 120 140 160
0.0
0.5
1.0
1.5
2.0
2.5
3.0
Tan
d (
E"/E
')
Temperature (oC)
Neat epoxy
Nonoriented MagSiCWs
Oriented MagSiCWs
(b)

138
nanocomposite had a tensile modulus of 1.9 ± 0.1 GPa. The material with aligned
MagSiCWs had a tensile modulus of 2.2 ± 0.1 GPa measured in the direction of the fiber
orientation. These results reveal approximately 25% improvement was attained by just
adding the filler and an approximately 45% increase in the modulus was realized by adding
the MagSiCWs and orientating them.
We compared the obtained storage modulus values with those predicted by the
Halpin-Tsai model that is commonly used for estimation of nanocomposite mechanical
properties.27, 33-34 The Halpin-Tsai model is a semi-empirical equation for prediction of the
modulus of a discontinuous composite structure. The model is based on the assumptions
that only the matrix sustains the axial load and transmits stress to the fiber through shear
stress and that all fibers are well dispersed in the matrix.35 The Halpin-Tsai model
equations express the longitudinal and transverse engineering moduli in the following
form:
where, Eo is the predicted composite modulus; Em is the matrix modulus; Ef is the fibrous
inclusions modulus (450 GPa for SiCW36); f is the fiber volume fraction; η fiber-to-load
transfer parameter for the Halpin-Tsai equation; and ξ is the shear coefficient (~ two times
the aspect ratio of a fiber for the longitudinal, fiber direction modulus; and 2 for the
f
fEE mo
1
1
mf
mf
EE
EE
/
1/
(6.6)
(6.7)

139
transversal, perpendicular to fiber direction, modulus). The average aspect ratio for the
whiskers used in this research is approximately 10. This equation, therefore, predicts the
longitudinal modulus of our composite material with aligned whiskers to be 2.4 GPa, while
the result from our experimentation is 2.2 GPa. The calculated theoretical and experimental
results are in a good agreement. We associate the slightly lower values for the experimental
modulus with non-ideal (24o instead of the ideal 0o) orientation of MagSiCWs in the
material. The modulus for randomly oriented fibers can be estimated using equation 6.8:37-
38
where El and Et are the longitudinal and transverse moduli, respectively. We have already
estimated the longitudinal modulus, and the transverse modulus was calculated by
equations (6.6) and (6.7) assuming ξ equals 2.33 Next, using Equation 6.8, the modulus for
the composite with randomly distributed whiskers was found to be approximately 1.9 GPa
in excellent agreement with the DMA results. In general, the comparison between the
calculated and experimental values for oriented and non-oriented epoxy/MagSiCW
composites clearly indicated that efficient matrix–whisker stress transfer existed in the
nanocomposites.
The temperature dependence of tan δ (E/// E/) is shown in Figure 11b. E// is the loss
modulus determined in the DMA experiment. The position of the tan δ peak indicates the
glass transition temperature of the material when variable stress is applied to the sample.
As in DSC measurements, the lowest Tg value (67oC) was observed for the epoxy
(6.8) t
El
Eo
E8
5
8
3

140
composite with non-oriented MagSiCWs, which is significantly lower than that of the neat
epoxy material (Tg = 77oC). However, the Tg value measured by DMA for the
nanocomposite with oriented MagSiCWs (83oC) is higher indicating that mobility of
polymer chains is restrained in the whisker direction in comparison with the bulk epoxy.
We also note that the width of the tan δ peak is significantly greater for the composites
with asymmetry into the higher temperature region. The width of the transition is related
qualitatively to the homogeneity of the epoxy network (variation in cross-linked density)
and, therefore, to the variation in mobility of polymer chains.39-41 Therefore, as was already
determined from the DSC measurements, zones with noticeable differences in network
density are present in the nanocomposites. The asymmetry of the dependence of the tan δ
peak on temperature corroborates formation of interphase domains possessing chains with
mobility changed by the presence of the whiskers.
Noticeable differences in the height of the tan δ peaks are observed for the materials
as well. The peak height is a measure of interfacial stress transfer in composite materials,
where smaller values point toward a higher degree of elastic response to the stress
applied.39 The oriented composite has the lowest tan δ peak, and the non-oriented
composites have the highest tan δ peak. This behavior of the oriented nanocomposite
materials is indicative of lower loss (more elastic) material, if compared with the neat
epoxy and non-oriented composite. In general, DMA results confirm our suggestion that
an extended interphase with variable properties is formed in the nanocomposites and that
the interphase formation is affected by the orientation of the MagSiCWs in a positive way
leading to a nanocomposite with superior mechanical properties.

141
Magnetic Characterization
Magnetization curves were measured for composites consisting of non-oriented and
magnetically oriented MagSiCWs with a pure epoxy sample as a control. The magnetic
response of a pure epoxy sample was measured to be negligibly small, while the
nanocomposites were observed to be significantly magnetic with superparamagnetic
characteristics. To characterize the magnetic anisotropy, two magnetic measurements were
performed for each sample: one measurement with the in-plane magnetic field oriented
along one side of the sample and the other measurement with the in-plane magnetic field
oriented along the other side of the sample. Thus, for the oriented nanocomposites, the
measurements were conducted along the direction of orientation of the nanorods (mp|| ,
Mg||) and perpendicularly to the direction of orientation of the nanorods, (mp , Mg ).
Results of the magnetic measurements are presented in Table 6.1.
Table. 6.1: Magnetic properties of the nanocomposites.
Type of sample and measurements Magnetic moment of
each particle, mp [2Am ]
Mass magnetization,
Mg [2Am
g ]
Non-oriented average – direction 1 1.92*10-19 3.78*10-4
Non-oriented average – direction 2 1.96*10-19 3.68*10-4
Oriented average – parallel 1.92*10-19 4.84*10-4
Oriented average – perpendicular 1.83*10-19 4.86*10-4
Typical plots of the magnetization curves for non-oriented and oriented samples are
presented in Figure 6.12, however, the graphical representations do not allow one to
distinguish the results.

142
For quantitative evaluation of these differences, one can introduce the order
parameters as || ||pm p p pm m m and
|| ||gM g g gM M M . These parameters
provide a metric for the nanorod orientation in the sample. As a reference, an estimation of
magnetic anisotropy was made for non- oriented samples. Following the same procedure,
we obtained pm = 0.02 and
gM = 0.03. These values define the accuracy of our
measurements of anisotropy. For oriented samples, the order parameters were measured as
pm = 0.05±0.02 and gM = 0.0±0.03. This suggests that the nanorod orientation does not
affect the magnetic properties of the composite at high fields when the magnetic moments
are co-aligned with the field, but does demonstrate an anisotropy at the lower fields when
the magnetic moments are not completely aligned with the field. These weak fields
Figure 6.12: Magnetometer measurements of the oriented composite materials where the
Mag-SiCWs were oriented (left) parallel and (right) perpendicular to the magnetic field.
-0.8 -0.4 0.0 0.4 0.8-2
-1
0
1
2
Magnetic Field (T)
Direction 1
Direction 2
Mag
ne
tic
Mo
me
nt
(*10
-6 A
m2) Nonoriented MSiCWs
-0.8 -0.4 0.0 0.4 0.8-1.0
-0.5
0.0
0.5
1.0
Magnetic Field (T)
Parallel
Perpendicular
Ma
gn
eti
c M
om
en
t (*
10
-6 A
m2)
Oriented MSiCWs

143
correspond to the Langevin dependence shown in Figure 6.12 at the fields roughly below
0.4 Tesla.
6.3.5: Composite Microstructure Analysis
The composite microstructure is comprised of the distribution of the particulate
orientation, particulate dispersity, and the cross-linking density of the epoxy matrix. These
were investigated by variable pressure SEM and swelling experiments. The analysis was
important to draw general conclusions from the structure-to-properties relationship.
MagSiCW/Epoxy Composite Microstructure Analysis
The composite microstructure was analyzed from images like the one presented in
Figure 6.8. The number of agglomerates and whiskers’ dispersity was measured. The
summary of the composite microstructural analysis is reported in Table 6.2. The composite
materials’ distribution of MagSiCW does not significantly varies between non-oriented and
oriented samples. However, there is a significantly more aggregates in the oriented
samples. Additionally, the oriented composites have a higher aspect ratio of the aggregates.
We suppose that the aggregation is caused by additional application of a magnetic field.
The MagSiCWs are forced together by the whisker-to-whisker magnetic interactions
creating a greater aspect ratio for the composite aggregates.
Table 6.2: The agglomeration and dispersity of the composite fillers within the cured
epoxy matrix.
Summary
Distance
between
fillers (μm)
# of
aggregates/mm
Length of
aggregates (μm)
Width of
aggregates
(μm)
Non-oriented 10.9 ± 5.9 80 ± 3 10.6 ± 3.6 5.1 ± 3.6
Oriented 9.4 ± 4.8 171 ± 44 10.9 ± 3.4 3.6 ± 3.4

144
Next, the orientation of the particulates was measured and recorded for each
composite. The level of orientation was measured from longitudinally broken composite
samples. The whiskers were identified by hand drawing a line down the center of the
whiskers from end to end. Then, the angle of orientation was taken between the net director
and the line using Gwyddion software. Approximately 200–300 randomly selected
whiskers were measured for each image, with two to four SEM images from two to three
samples. The orientation of the non-oriented and oriented composite materials is shown in
Figure 6.13.
It can be pointed that the orientation of the whiskers without the application of the
magnetic field was practically random. However, the oriented composite shows a shift in
the alignment with ~64 % of the filler oriented within 30 o of the net director.
Analysis of the Relative Cross-Linking Density in Epoxy and Composite Materials
First, the composite materials’ cross-linking density was calculated from the
storage modulus at 40 oC above the Tg (EMc) using Equation 6.2. The modulus was equal
0
5
10
15
20
25
30
0 10 20 30 40 50 60 70 80 90
Per
cent
Mat
eria
l (%
)
Angle from Net Director (o)
N-MagNPO-MagNP
Figure 6.13: Histogram of the fillers’ orientation from the net director within each of the
composites.

145
3.5 MPa, 1.5 MPa, and 5.4 MPa for neat epoxy, epoxy with non-oriented whiskers and
epoxy with oriented whiskers, respectively. These cross-linking densities from DMA
results were compared to the relative cross-linking density extrapolated from the swelling
experimentation. The swelling results for the composite materials are presented in Table
6.3.
Table 6.3: Results of swelling experiments.
Sample Neat Epoxy MagSiCW/Epoxy
- No Orientation
MagSiCW/Epoxy
- Orientation
𝑚𝑑 (g) 0.016±0.003 0.015±0.006 0.011±0.001
𝑚𝑒𝑞 − 𝑚𝑑 (g) 0.006±0.001 0.009±0.002 0.004±0.001
These parameters were plugged into Equation 6.4 to obtain the volume fraction of
polymer in the sample to then used in Equation 6.3 to calculate the relative cross-linking
density of the samples. For each one of these samples, three to four measurements were
averaged to estimate the standard deviation.
0.0
0.2
0.4
0.6
0.8
1.0
1.2
1.4
1.6
1.8
0 2 4 6
Rel
ativ
e C
ross
-lin
k
Den
sity
EMc (MPa)
Figure 6.14: The results from the calculated relative cross-linking using DMA
measurements (▲) and swelling experimentation (●) vs EMc, storage modulus above 40oC.
(The samples are signified from left to right as the non-oriented MagSiCW/epoxy composite,
neat epoxy, and oriented MagSiCW/epoxy composite).

146
It was found that the composite samples with oriented MagSiCWs show a dramatic
increase in cross-linking density in comparison with the non-oriented composite (Figure
6.14). This result supports formation of extended interphase domain B in the oriented
composite possessing higher level of crosslinking. On the other hand, EMc results (Equation
6.2) do not fit the experimental results of the solvent swelling for the oriented composite.
This suggests that the orientation of the fillers is absorbing more stress, creating a higher
elastic modulus, although the oriented composite and the neat epoxy share approximately
the same cross-linking density. Hence, the EMc of the oriented composite was 1.6 times
larger than the neat epoxy and 3.5 times larger than the non-oriented composite. We
associate the decrease in Tg for the non-oriented composite with formation of interphase
with lower Tg inside layer of MagNP and in close proximity to the whiskers’ surface. It
appeared that the orientation of the whiskers to a certain extend alleviate this problem.
6.4: Conclusions
The following conclusions can be determined as a result of our study reported in
Chapter 6:
The MagSiCWs change the chemical pathway of the epoxy reaction, accelerating
the polymerization reaction that prefers to consume the anhydride hardener vs
DGEBA epoxy groups.
The grafting of the epoxy polymer to the surface of the MagSiCWs is observed.
The best orientation of whiskers in the epoxy matrix composite is achieved using
the ‘pulsed’ application of a magnetic field.

147
The oriented and non-oriented MagSiCW composites had a greater storage
modulus than the neat epoxy. However, the glass transition temperature determined
from DMA was only improved by the whisker orientation.
The thermal properties revealed that the composite with orientation yielded no
enthalpic relaxation along with a ΔTg that is 3x the length of the other composite
materials.
The composite materials’ magnetic properties on the macro-scale were considered
super-paramagnetic. Additionally, when a field was applied perpendicular and
parallel to the orientation of the composite material, these composite properties
were the same.
Microstructural analysis showed that the magnetically oriented composite had a
higher degree of packing and more agglomerates. However, the agglomerates did
have a higher aspect ratio than the non-oriented composites.
Microstructural analysis of the amorphous polymer structure showed that the
oriented composites had a much greater cross-linking density than the non-oriented
composites.
148
6.5: References
1. Putz, K. W.; Palmeri, M. J.; Cohn, R. B.; Andrews, R.; Brinson, L. C., Effect of
cross-link density on interphase creation in polymer nanocomposites. Macromolecules
2008, 41 (18), 6752-6756.
2. Cheng, X.; Putz, K. W.; Wood, C. D.; Brinson, L. C., Characterization of local
elastic modulus in confined polymer films via AFM indentation. Macromol Rapid Comm
2015, 36 (4), 391-397.
3. Kolar, F.; Svitilova, J., Kinetics and mechanism of curing epoxy/anhydride
systems. Acta Geodyn Geomater 2007, 4 (3), 85-92.
4. Chu, F. D. J.; Robertson, R. E., The effect of adherends on the curing of an epoxy
adhesive. J Adhesion 1995, 52 (1-4), 149-166.
5. Jung, J. C.; Lee, S. K.; Lee, K. S.; Choi, K. Y., Chain-length effect of alkenyl
succinic anhydride on thermal and mechanical properties of the cured epoxy resins.
Angewandte Makromolekulare Chemie 1991, 185, 129-136.
6. Park, W. H.; Lee, J. K., A study on isothermal cure behavior of an epoxy-
rich/anhydride system by differential scanning calorimetry. Journal of Applied Polymer
Science 1998, 67 (6), 1101-1108.
7. Harsch, M.; Karger-Kocsis, J.; Holst, M., Influence of fillers and additives on the
cure kinetics of an epoxy/anhydride resin. European Polymer Journal 2007, 43 (4), 1168-
1178.
8. Murayama, T., Dynamic mechanical analysis of polymeric mateiral. Elsevier
Scientific Publishing Group: Amsterdam, 1978.
9. Chen, J. S.; Ober, C. K.; Poliks, M. D.; Zhang, Y. M.; Wiesner, U.; Cohen, C.,
Controlled degradation of epoxy networks: analysis of crosslink density and glass
transition temperature changes in thermally reworkable thermosets. Polymer 2004, 45
(6), 1939-1950.

149
10. Kennedy, J. M.; Banerjee, A.; Cano, R. J., Characterization of interfacial bond
strength by dynamic analysis. J Compos Mater 1990, 26 (6), 869-882.
11. Wu, H. F.; Gu, W.; Lu, G. Q.; Kampe, S. L., Non-destructive characterization of
fibre-matrix adhesion in composites by vibration damping. Journal of Materials Science
1997, 32 (7), 1795-1798.
12. Donth, E., Characteristic length of the glass transition. J Polym Sci Part B Polym
Phys 1996, 34, 2881-2892.
13. Lu, H. B.; Nutt, S., Enthalpy relaxation of layered silicate-epoxy nanocomposites.
Macromol Chem Phys 2003, 204 (15), 1832-1841.
14. Lu, H. B.; Nutt, S., Restricted relaxation in polymer nanocomposites near the
glass transition. Macromolecules 2003, 36 (11), 4010-4016.
15. Putz, K. W.; Mitchell, C. A.; Krishnamoorti, R.; Green, P. F., Elastic modulus of
single-walled carbon nanotube/poly(methyl methacrylate) nanocomposites. J Polym Sci
Pol Phys 2004, 42 (12), 2286-2293.
16. Ramanathan, T.; Liu, H.; Brinson, L. C., Functionalized SWNT/polymer
nanocomposites for dramatic property improvement. J Polym Sci Pol Phys 2005, 43 (17),
2269-2279.
17. Abenojara, J.; Encinas, N.; Del Real, J. C.; Martínez, M. A., Polymerization
kinetics of boron carbide/epoxy composites. Thermochim Acta 2014, 575, 144-150.
18. Jackson, P. L.; Huglin, M. B.; Cervenka, A., Use of inverse gas chromatography
to quantify interactions in anhydride cured epoxy resins. Polym Int 1994, 35 (2), 135-143.
19. Zdyrko, B.; Klep, V.; Luzinov, I., Synthesis and surface morphology of high-
density poly(ethylene glycol) grafted layers. Langmuir 2003, 19 (24), 10179-10187.
20. Montserrat, S., Physical aging studies in epoxy resins. I. Kinetics of the enthalpy
relaxation process in a fully cured epoxy resin. J Polym Sci Pol Phys 1994, 32 (3), 509-
522.

150
21. Brown, H. R.; Char, K.; Deline, V. R., Enthalpy-driven swelling of a polymer
brush. Macromolecules 1990, 23 (13), 3383-3385.
22. Rittigstein, P.; Priestley, R. D.; Broadbelt, L. J.; Torkelson, J. M., Model polymer
nanocomposites provide an understanding of confinement effects in real nanocomposites.
Nat. Mater. 2007, 6 (4), 278-82.
23. Bansal, A.; Yang, H.; Li, C.; Cho, K.; Benicewicz, B. C.; Kumar, S. K.; Schadler,
L. S., Quantitative equivalence between polymer nanocomposites and thin polymer films.
Nat Mater 2005, 4 (9), 693-8.
24. Hussain, F.; Hojjati, M.; Okamoto, M.; Gorga, R. E., Review article: Polymer-
matrix nanocomposites, processing, manufacturing, and application: An overview. J
Compos Mater 2006, 40 (17), 1511-1575.
25. Zhou, Y. X.; Hosur, M.; Jeelani, S.; Mallick, P. K., Fabrication and
characterization of carbon fiber reinforced clay/epoxy composite. Journal of Materials
Science 2012, 47 (12), 5002-5012.
26. Al-Saleh, M. H.; Sundararaj, U., Review of the mechanical properties of carbon
nanofiber/polymer composites. Compos Part A Appl S 2011, 42 (12), 2126-2142.
27. Putz, K.; Krishnamoorti, R.; Green, P. F., The role of interfacial interactions in
the dynamic mechanical response of functionalized SWNT-PS nanocomposites. Polymer
2007, 48 (12), 3540-3545.
28. Steffan, C. E.; Liu, H.; Winter, R. M.; Cabibil, H.; Lozano, J.; Celio, H.; White, J.
M.; Houston, J. E., The Relationship Between Nanomechanical and Chemical Properties
in Polymer Composites. In Proceedings of the Society of Experimental Mechanics IX
International Congress on Experimental Mechanics, 2000; pp 920-923.
29. Diez-Pascual, A. M.; Gomez-Fatou, M. A.; Ania, F.; Flores, A., Nanoindentation
assessment of the interphase in carbon nanotube-based hierarchical composites. J Phys
Chem C 2012, 116 (45), 24193-24200.

151
30. Yedla, S. B.; Kalukanimuttam, M.; Winter, R. M.; Khanna, S. K., Effect of shape
of the tip in determining interphase properties in fiber reinforced plastic composites using
nanoindentation. J Eng Mater-T Asme 2008, 130 (4), 15.
31. Williams, J. G.; Li, F. P.; Miskioglu, I., Characterization of the interphase in
epoxy/aluminum bonds using atomic force microscopy and a nanoindenter. J Adhes Sci
Technol 2005, 19 (3-5), 257-277.
32. Downing, T. D.; Kumar, R.; Cross, W. M.; Kjerengtroen, L.; Kellar, J. J.,
Determining the interphase thickness and properties in polymer matrix composites using
phase imaging atomic force microscopy and nanoindentation. J Adhes Sci Technol 2000,
14 (14), 1801-1812.
33. Fornes, T. D.; Paul, D. R., Modeling properties of nylon 6/clay nanocomposites
using composite theories. Polymer 2003, 44 (17), 4993-5013.
34. Libanori, R.; Erb, R. M.; Studart, A. R., Mechanics of platelet-reinforced
composites assembled using mechanical and magnetic stimuli. ACS Appl Mater
Interfaces 2013, 5 (21), 10794-805.
35. Halpin, J. C.; Kardos, J. L., The Halpin-Tsai equations : A review. Polymer
Engineering and Science 1976, 16 (5), 344-352.
36. Compton, B. G.; Lewis, J. A., 3D-printing of lightweight cellular composites. Adv
Mater 2014, 26 (34), 5930-5.
37. Tsai, S. W.; Pagano, N. J., Invariant properties of composite materials In
Composite materials workshop, Tsai S. W.; Halpin, J. C.; Pagano, N. J., Eds. Technomic
Publishing Company: St. Louis, 1968; p 233.
38. Nielsen, L. E., Mechanical properties of polymers and composites. Vol. 2.
Dekker: New York, 1974; p 462.
39. Vennerberg, D.; Rueger, Z.; Kessler, M. R., Effect of silane structure on the
properties of silanized multiwalled carbon nanotube-epoxy nanocomposites. Polymer
2014, 55 (7), 1854-1865.

152
40. Miyagawa, H.; Misra, M.; Drzal, L. T.; Mohanty, A., Biobased epoxy/layered
silicate nanocomposites: Thermophysical properties and fracture behavior evaluation. J
Polym Environ 2005, 13 (2), 87-96.
41. Miyagawa, H.; Rich, M. J.; Drzal, L. T., Amine-cured epoxy/clay
nanocomposites. I. Processing and chemical characterization. Journal of Polymer Science
Part B-Polymer Physics 2004, 42 (23), 4384-4390.
153
CHAPTER SEVEN
THE EFFECT OF INTERFACIAL MODIFICATION ON SICW/EPOXY
COMPOSITE FORMATION AND PROPERTIES
7.1: Introduction
It is well established that nanoscale fillers can improve mechanical, electrical, and
optical properties of polymer composite materials1-5. To a significant extent, such
improvements are caused by interactions at the interface between fillers and a matrix
(nano-confinement effects)6-8. Therefore, in this work, the interfacial effects within the
SiCWs/epoxy composites were investigated further by modifying SiCWs’ surface with
different materials to determine the influence of surface modification on the composite’s
properties.
In general, the interfacial interactions within composites have been considered
from a chemical and structural points of view9. Thus, depending on the application, a
variety of surface modifications can be employed to improve the matrix/filler
interactions. For example, carbon fibers are processed with nitric acid to create favorable
surface chemistry and increased roughness for improvement of epoxy composites10.
However, it is still not entirely understood how surface modification can affect the
material’s properties and structure of a nanocomposite.
In this chapter of the dissertation, we examine the effect of whisker surface
modification on the epoxy composite system. As in, SiCWs have been used in
nanoparticulate-enhanced polymer coatings11, multi-component ceramic matrix
composites12 and epoxy carbon fiber composites13-15 for reinforcement, abrasion,

154
resistance and thermal conductivity. However, published works have not paid significant
attention to interfacial interactions in SiCWs-based composites. To this end, this part of
the study focuses on the SiCW nanoparticulate surface modification targeting thermo-
mechanical reinforcement of epoxy composites. For this specific purpose, we examined
the formation and properties of the composites as a function of the interaction at the
epoxy/SiCW interfaces. A schematic of surface modification for the SiCWs is presented
in Figure 7.1. Specifically, the following surface modifications were conducted: “a” is the
inner darkest region representing the thermally cleaned SiCWs (SiCW-OH); “a–b” is the
black solid line representing the epoxy silane modification (SiCW-Ep); “b” is the greyed
middle area representing the grafted P2VP layer (SiCW-P2VP); “b–c” is the black dashed
line representing the PAA to P2VP complexation; and “c” is the grey outer-layer of the
whiskers representing the attached PAA (SiCW-PAA).
Figure 7.1: Layout of the silicon carbide whisker after three consecutive surface
modifications: (a) is bare SiCWs; (a-b border) - epoxy silane modification; (b) - grafted
P2VP; (c) - PAA layer.

155
7.2: Experimental
7.2.1: Surface Modification
To clean the surface and create the surface hydroxyl groups, the SiCWs (SiCW-
OH) were heat treated at 400 oC for 1 hour in an air environment. Next, 1 gram of the
cleaned SiCWs were mixed with DI water and shaken for 24 hours. To separate the
agglomerates from the solution, the water suspension was left to settle for 20 s and then
decanted. The decanted portion of SiCWs was dispersed in methanol at a 2 wt. %. Then,
the SiCW suspension in methanol was cleaned three times by repetitive sequential
centrifugation, decanting and redispersing in methanol. The final cleaned whiskers had an
average length of 4700 nm and a diameter of 400 nm, as was determined by SEM
imaging.
For the surface modification, we used methodology reported elsewhere16-20. To
modify the surface of SiCWs with the epoxy-silane (SiCW-EP), the SiCWs were mixed
into a 2.5 wt. % solution of epoxy silane in toluene and shaken for 24 hours. Next, the
SiCWs modified with epoxy silane were cleaned in fresh toluene and methanol by several
centrifugation and redispersion cycles.
To obtain SiCWs modified with P2VP (SiCW-P2VP), the SiCW-EP was
dispersed in MEK and added dropwise to a 5 wt. % of P2VP solution in MEK. This
solution was rotary evaporated and placed inside a vacuum oven at 120 oC for 24 hours.
To remove non-grafted polymer, the SiCW-P2VPs were cleaned 3 times with fresh MEK
using centrifugation and redispersion cycle.

156
Finally, to deposit the PAA layer by complexation21 on the SiCWs (SiCW-PAA),
the SiCW-P2VP were dispersed into methanol at 1 wt. % and added dropwise (at 1:1
volume ratio) to 2 wt. % PAA solution in methanol. This mixture was shaken for 24
hours. The SiCW-PAA was cleaned in fresh methanol 3 times using redispersion,
centrifugation cycle.
7.2.2: Composite Fabrication
As reported in the previous chapter, the SiCWs were mixed with the epoxy resin
and then the hardener and catalyst were added. The epoxy, hardener, and catalyst volume
ratio was 1:1.37:0.07. To prepare composite material, the epoxy matrix/whiskers mixture
was casted into Teflon mold at room temperature. The mixture was cured at room
temperature for 48 hours, and then at 75 oC for 24 hours. According to DSC results, these
time-temperature conditions were sufficient to fully cure the polymer matrix. The volume
fraction of the whiskers in the matrix was approximately 3 %.
7.2.3: Epoxy Curing Reaction
The activation energy (Ea) and degree of reaction (α) for the curing were
determined using DSC to gauge the effect of temperature on the reaction and to monitor
the real-time progression of the reaction. The activation energy of the pure epoxy and
composites was determined using the Kissinger method22. Namely, the peak temperatures
(Tp), defined by the exothermic peak of the epoxy curing reaction were obtained by
heating the epoxy resin at a rate of 10, 30, and 40 oC/min. The resultant Tps were plotted
against the natural logarithm of the heating rate divided by Tp2. Ea was obtained from the

157
slope of the dependence. The α at specific time point of 3, 6, 12, 24, and 48 hours was
determined using Equation 6.1
7.2.4: Thermo-Mechanical Characterization using DMA
Tensile DMA testing was run at 2 oC/min from -20 oC to 150 oC using frequencies
of 1, 2, and 5 Hz and applying 5 μm amplitude of oscillation. Each of the samples was
approximately the same dimensions with a length of 8.00 mm, a width of 5.00 mm, and a
thickness of 0.34 mm.
7.2.5: Thermal Characterization using DSC
The DSC samples were prepared from the mold casted and thermally cured epoxy
and composite samples. The samples of 5–10 mg were sealed into an aluminum pan with
an aluminum lid. The first DSC run was at 15 oC/min from -10 oC to 150 oC. Then, the
samples were cooled at 15 oC/min to -10 oC and run for a second time at 15 oC/min from
-10 oC to 150 oC.
7.2.6: Composite Microstructure Analysis by SEM
SEM was used to evaluate the microstructure of the composite materials. The
samples were dipped into liquid nitrogen and broken in the longitudinal direction. The
samples were then attached to an aluminum SEM puck with a carbon tape to have the
fractured edge facing the SEM detector. The images were analyzed using Gwyddion
software to determine the distribution of the SiCWs in the epoxy matrix. The distribution
was quantified by randomly selecting 25–35 whiskers and measuring the distance to the
next closest, typically 8–13,whiskers. The distance to the next closest identifiable
whiskers was measured between the centers of the whiskers. Additionally, whisker

158
Figure 7.2: (a) the degree of curing versus the time of reaction at room temperature and
(b) the Kissenger plot.
agglomerates within the composite matrix were counted, their size and concentration
were measured. The length and width of the aggregates were measured by drawing a box
around them. This was done for two to three images and two different samples of the
materials.
7.2.7: Determination of the Composites’ Cross-Linking Density for the Epoxy
Matrix
The density of cross-links was determined from the storage modulus value above
Tg and swelling results for the thermoset23. The relevant methodologies are described in
Chapter 6.
7.3: Results and Discussion
7.3.1: Curing of Epoxy Resin in the Presence of Modified SiCWs
Studies of Epoxy Curing using DSC
The extent of epoxy polymerization in the presence of modified SiCWs versus
time of the polymerization at room temperature is shown in Figure 7.2a. Using the on the
a) b)
0 10 20 30 40 50
0
10
20
30
40
50
De
gre
e o
f R
ea
ctio
n (
%)
Time of Reaction (hours)
Neat Epoxy
SiCW-OH
SiCW-Ep
SiCW-P2VP
SiCW-PAA
2.28 2.30 2.32 2.34 2.36 2.38 2.40 2.42 2.44 2.46
-9.8
-9.6
-9.4
-9.2
-9.0
-8.8
-8.6
-8.4
Neat Epoxy
SiCW-OH
SiCW-Ep
SiCW-P2VP
SiCW-PAA
ln(h
eating r
ate
/Tp^2
)
1/Tp (1/1000K)

159
Kissinger model based Arrhenius equation (Equation 6.5), the Ea was determined using
the dependencies shown in Figure 7.2b. The degree of curing after 48 hours of the
reaction and Ea values are reported in Table 7.1.
Table 7.1: Parameters of epoxy curing calculated using DSC data.
Sample Ea (J/mol) α48hrs (%)
neat epoxy 78.20 21.2
SiCW-OH 79.72 44.3
SiCW-Ep 78.45 25.0
SiCW-P2VP 77.90 22.7
SiCW-PAA 74.01 17.1
The results show no significant variations in the activation energy, except for the
SiCW-PAA modification, which has a 4.2 J/mol difference from the neat epoxy (Table
7.1). The value for SiCW-PAAs is very close to the Ea for MagSiCWs (72.5 J/mol). This
finding indicated that the chemical events occurring during the epoxy curing are similar
for SiCW-PAAs and MagSiCWs. The obtained results revealed that the surface
modifications significantly influence the rate of the curing. For instance, the epoxy with
SiCW-OH was 44.3% cured after 48 hours of room-temperature curing. This is
significantly higher rate than the one for the neat epoxy and the neat epoxy with SiCW-
EP, showing 21.2 % and 25.0 % of curing for the same time of the reaction. However,
these results do not reflect the details of chemical aspects of the curing reaction.
Studies of Epoxy Curing using ATR-FTIR
The effect of surface modification on the curing reaction chemical pathway was studied
using ATR-FTIR. As the epoxy and anhydride consumption were the two main chemicals
participating in the curing process, their functional groups were followed with IR
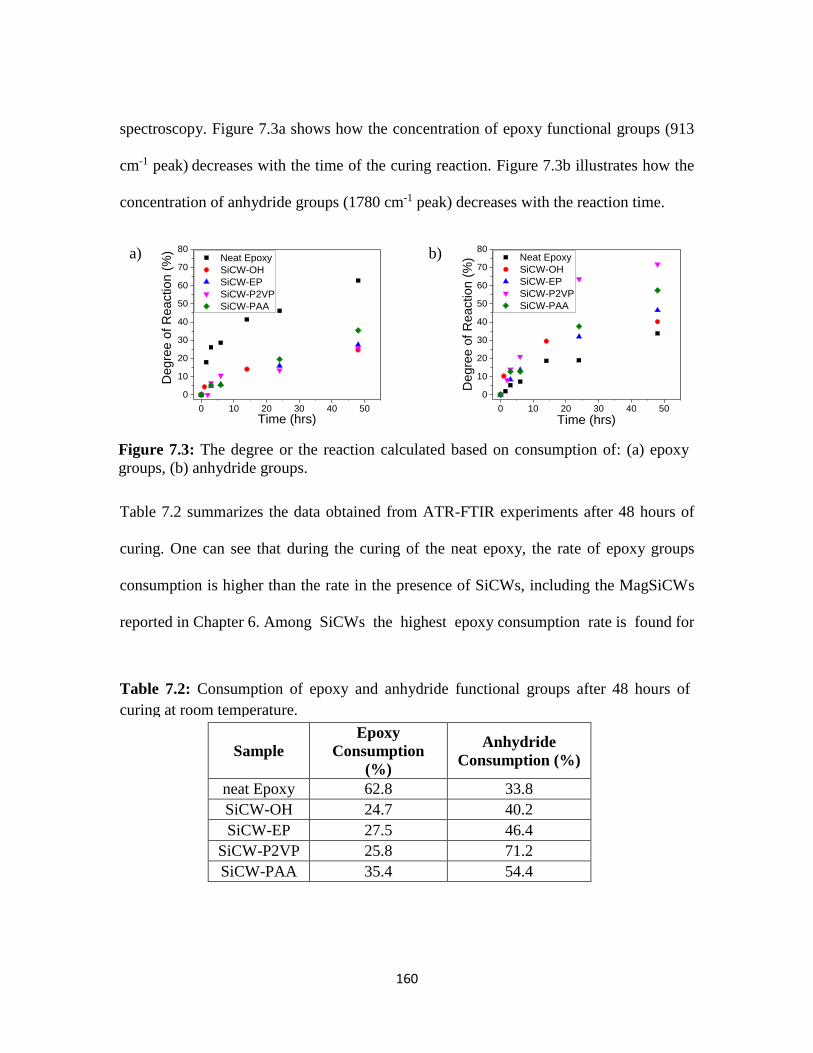
160
Figure 7.3: The degree or the reaction calculated based on consumption of: (a) epoxy
groups, (b) anhydride groups.
Table 7.2: Consumption of epoxy and anhydride functional groups after 48 hours of
curing at room temperature.
spectroscopy. Figure 7.3a shows how the concentration of epoxy functional groups (913
cm-1 peak) decreases with the time of the curing reaction. Figure 7.3b illustrates how the
concentration of anhydride groups (1780 cm-1 peak) decreases with the reaction time.
Table 7.2 summarizes the data obtained from ATR-FTIR experiments after 48 hours of
curing. One can see that during the curing of the neat epoxy, the rate of epoxy groups
consumption is higher than the rate in the presence of SiCWs, including the MagSiCWs
reported in Chapter 6. Among SiCWs the highest epoxy consumption rate is found for
Sample
Epoxy
Consumption
(%)
Anhydride
Consumption (%)
neat Epoxy 62.8 33.8
SiCW-OH 24.7 40.2
SiCW-EP 27.5 46.4
SiCW-P2VP 25.8 71.2
SiCW-PAA 35.4 54.4
0 10 20 30 40 50
0
10
20
30
40
50
60
70
80
De
gre
e o
f R
ea
ctio
n (
%)
Time (hrs)
Neat Epoxy
SiCW-OH
SiCW-EP
SiCW-P2VP
SiCW-PAA
0 10 20 30 40 50
0
10
20
30
40
50
60
70
80
De
gre
e o
f R
ea
ctio
n (
%)
Time (hrs)
Neat Epoxy
SiCW-OH
SiCW-EP
SiCW-P2VP
SiCW-PAA
b) a)

161
Figure 7.4: ATR-FTIR results for the epoxy curing reaction: (a) degree of the epoxy
group consumption monitored by the 913 cm-1 peak, (b) degree of the anhydride group
consumption monitored by the 1780 cm-1 peak.
SiCWs covered with PAA layer. We associate the observed result with high rate of
epoxy-carboxylic group reaction. The anhydride groups are consumed at much different
rates varying from 33.8–71.2 % per 48 hours for SiCWs with different surface
modifications. The rate is the lowest for the unmodified epoxy.
The anhydride consumption showed unique signatures for different types of
SiCWs. It can be observed that the SiCW-P2VP acted as a catalyst causing very fast
consumption (71.4 %) of the anhydride groups. It is known that nitrogen-containing
substances catalyze the reaction of anhydride with epoxy24-25. Hence, the basic nitrogen
of the P2VP could have catalyzed the opening of the anhydride. At the same time, the
epoxy consumption is not dramatically affected by the presence of SiCW-P2VP.
The ATR-FITR results were used to reveal the difference in chemical pathway of
epoxy curing in the presence of SiCWs in comparison to the neat epoxy. This is shown in
Figure 7.4 by plotting the degree of anhydride vs. the degree of epoxy consumed in the
0
20
40
60
80
0 20 40 60 80
Deg
ree
of
An
hyd
rid
e
Co
nsu
mp
tion
(%
)
Degree of Epoxy Consumption (%)
Neat Epoxy
SiCW-OH

162
curing reaction. Most of all, the epoxy polymerization in the presence of SiCW-P2VP
was the most different from the neat epoxy and other composite materials, showing the
rapid consumption of the anhydride with much less consumption of the epoxy groups.
The other whiskers show nearly the same chemical pathway, within 2 % of each other at
any given point. However, the overall rate of the curing was the highest for SiCWs-PAA
and the slowest for SiCWs-OH. These results also different from the ones for MagSiCW
epoxy composites. 48 hours into the reaction, the MagSiCWs epoxy composite had
consumed ~75 % of the anhydride groups and ~50 % of the epoxy groups (Figure 6.6).
This outpaces the consumption rate for the rest of the composite material. To conclude,
the chemical composition of SiCWs definitely plays a significant role in the epoxy
polymerization. It is suggested that to understand the processes involved additional
studies are needed in the future.
7.3.2: Properties of the SiCW/Epoxy Composites
Thermo-Mechanical Characterization
The cured epoxy composite materials were tested employing DSC and DMA to
study their thermal and mechanical properties. Figure 7.5 shows the storage modulus (E’)
dependence on temperature for the neat epoxy and composite materials obtained from the
DMA measurements. Table 7.3 summarizes the results of the DMA experiments. It is
obvious that the moduli of the composites at room temperature are very close and are
approximately 60 % higher than the modulus of the neat epoxy material. On the other
hand, the DMA-measured glass transition (Tg), defined by the peak of the loss modulus
(E”), is observed to vary by 10 oC. The tan δ peak (the highest value of E”/E’ ratio)
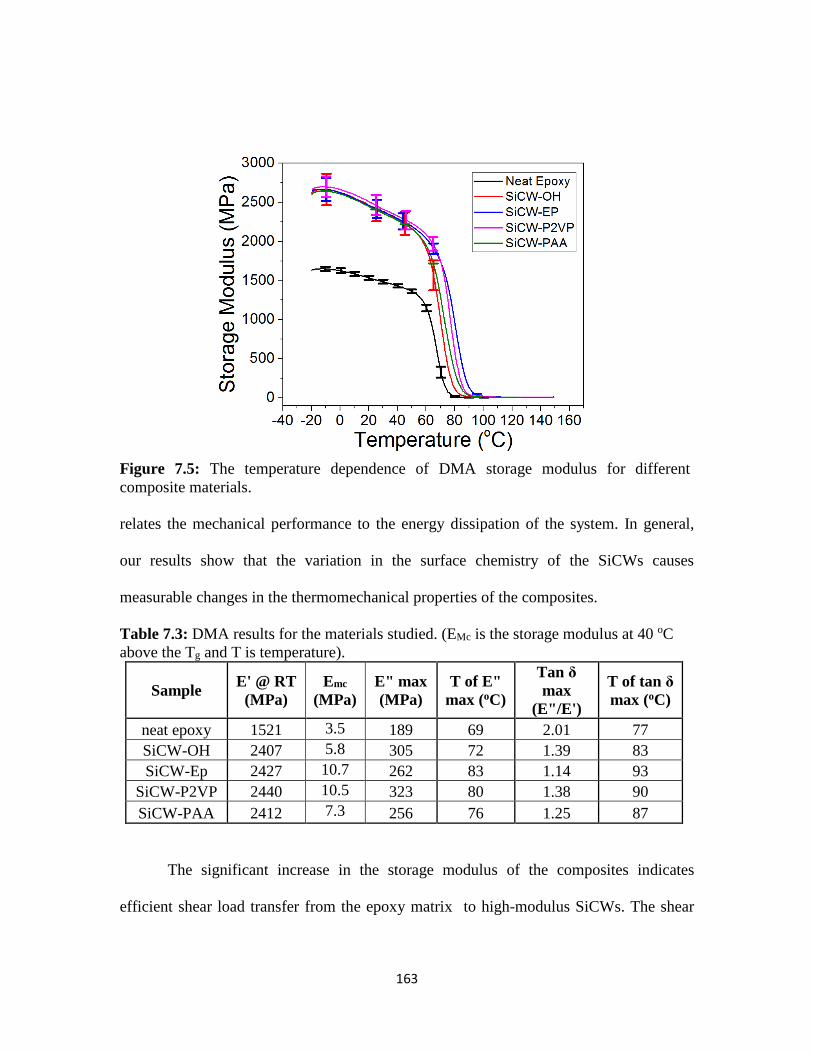
163
Figure 7.5: The temperature dependence of DMA storage modulus for different
composite materials.
relates the mechanical performance to the energy dissipation of the system. In general,
our results show that the variation in the surface chemistry of the SiCWs causes
measurable changes in the thermomechanical properties of the composites.
Table 7.3: DMA results for the materials studied. (EMc is the storage modulus at 40 oC
above the Tg and T is temperature).
Sample E' @ RT
(MPa)
Emc
(MPa)
E" max
(MPa)
T of E"
max (oC)
Tan δ
max
(E"/E')
T of tan δ
max (oC)
neat epoxy 1521 3.5 189 69 2.01 77
SiCW-OH 2407 5.8 305 72 1.39 83
SiCW-Ep 2427 10.7 262 83 1.14 93
SiCW-P2VP 2440 10.5 323 80 1.38 90
SiCW-PAA 2412 7.3 256 76 1.25 87
The significant increase in the storage modulus of the composites indicates
efficient shear load transfer from the epoxy matrix to high-modulus SiCWs. The shear

164
load transfer is possible because of good bonding of the matrix to the whisker’s surface.
It is necessary to point that all the samples reported in this chapter show improved
mechanical properties if compared to the non-oriented and oriented MagSiCW/epoxy
composites (Chapter 6). Additionally, the composites showed improvement in Tg values.
The Tg was the highest for SiCW-EP and SiCW-P2VP. The lowest Tg was found for the
SiCW-OH epoxy composites.
The highlighted material properties show increase in the Tg, denoted by the
increase in the peak temperature of the loss modulus. Additionally, the decrease in the
intensity of tan δ peak and the increase in the tan δ peak temperature are observed. In
general, the change in the surface chemistry of the SiCWs did not dramatically affect the
thermo-mechanical properties of the composite materials below Tg. However, variations
in E’ after Tg are found in the changes of the tan δ and the EMc. We associate the variation
in the properties with the influence of SiCW’s surface chemistry on the cross-linking
density of the epoxy resin.
Thermal Characterization
DSC measurements were used in conjunction with the DMA results. We carried
out two DSC runs for each material studied (Figure 7.6). The DCS curves for the first run
(Figure 7.6a) show the presence of “double” Tg and enthalpic relaxations. Table 7.4
summarizes the DSC data. In general, we found that material’s behavior in the Tg region
is quite complex, and DCS data are not directly related to the thermal transitions
determined by DMA. It appeared that the epoxy polymer chains behave differently in the
vicinity of the whiskers. Indeed, the composite materials have one Tg near the neat epoxy

165
Figure 7.6: The DSC curves for the materials studied: (a) first run and (b) second run.
Tg and then a second Tg at a higher temperature. As Tg is dependent on the free volume, it
is hypothesized that the surface groups change the packing of the materials near the
surface of the whiskers. These effect can be connected to the various rates and
mechanisms of polymerizations near the surface caused by surface functional groups
participating in the epoxy curing. As a result, level of epoxy cross-linking is different at
different locations of the composite.
Table 7.4: DSC results for the materials studied: Tg1-h1 and Tg2-h1 is the first and second
Tgs from the first run; Tg-h2 is the Tg from the second run; ΔTg-h2 is the subtraction of
the offset from the onset of the Tg from the second run.
Sample Tg1-h1 (°C) Tg2-h1 (°C) Tg-h2 (°C) ΔTg-h2 (°C)
Neat Epoxy 63.3 - 59.5 7.1
SiCW-OH 54.3 65.4 57.6 7.5
SiCW-Ep 58.7 76.3 63.0 10.0
SiCW-P2VP 56.2 71.1 58.7 11.3
SiCW-PAA 55.7 65.9 54.6 6.8
Table 7.4 is used to highlight the main points of the data presented in Figure 7.6.
It shows the detected Tgs and the breadth of the transition (ΔTg). When the epoxy
materials are annealed well above Tg via heating in DSC up to 150 oC (first run), the
a) b)

166
enthalpic relaxations are not present in the DSC curves of the second run. The materials
also have a single Tg after the annealing. The breadth of the Tg transitions are quite
similar for all materials and are on the level of 7-10 oC. In general, after the annealing we
observed randomization of the epoxy network in the materials with Tgs located within ±5
degrees of the Tg of the neat epoxy. It is necessary to point that in DMA experiment the
Tgs of composite materials are significantly higher than the one for the neat epoxy. We
suggest that DMA experiment is more sensitive to anchoring of the network to the SiCWs
surface.
7.3.3: Composite Microstructure Analysis
The microstructure of the composite materials to a significant degree determines
properties of the materials . Thus, the filler spatial distribution within the composite was
investigated using SEM. The epoxy matrix structure was obtained from the swelling and
DMA experiments to estimate the polymers’ cross-linking density.
Composite Microstructure Analysis using SEM
The microstructure of the composites was investigated using variable pressure
SEM and carrying out swelling experiments. We were interested in determining how the
composition of the interface influences the structure of the composite. The spacing
between the whiskers and the number of the filler agglomerates per surface (cross-
section) area were of the main interest. The images shown in Figure 7.7 are representative
images characterizing dispersity and orientation the SiCWs in the composite materials.
The orientation of the whiskers in the composites was determined to be random. The
values of the filler interspacing and number of agglomerates are reported in Table 7.5.

167
Figure 7.7: SEM images of the cross-section of: (a) SiCW-OH, (b) SiCW-EP, (c)
SiCW-P2VP, (d) SiCW-PAA composite materials.
Table 7.5: The microstructure data for the composites obtained from SEM images
analysis.
Sample Whisker-whisker distance (μm) # of agglomerates/mm2
SiCW-OH 11.5 ± 7.7 199.3 ± 41.8
SiCW-Ep 10.1 ± 19.2 86.1 ± 21.3
SiCW-P2VP 6.7 ± 4.0 34.4 ±11.3
SiCW-PAA 10.8 ± 5.3 115.6 ± 22.6
The results indicate that SiCW-P2VP has the highest level of packing along with
the lowest amount of agglomerates. The microstructure of other composite materials
studied is nearly the same. The whisker-to-whisker distance was run through a standard

168
Student’s t-test to determine whether there were any statistical differences between the
samples. It was found that SiCW-EP, SiCW-PAA, and SiCW-OH are statistically similar.
This suggests that they all share the same level of spacial distribution, which is high in
comparison to SiCW-P2VP. We suggest that this is caused by the P2VP polymer layer
that was “end grafted” to the surface of the fillers. The grafted polymer chains stretch
from the surface, providing steric stabilization of the whiskers and preventing
aggregation. At low filler concentration used in this work, the level of SiCWs dispersity
does not have a significant effect on the composite properties. However, in future work
with composites of higher concentration of the whiskers end-grafted P2VP should be
used for the exterior whisker surface modification.
Relative Cross-Linking Density in the Neat Epoxy and Composite Materials
The solvent swelling data and EMc (storage modulus 40 oC above the Tg) were
used to estimate the cross-linking density of the epoxy matrix in the composite materials.
The methodology is the same as presented in Chapter 6. The obtained results from
swelling experiments are presented in Table 7.6. Three to five samples were used for
each of the data points.
Table 7.6: Results of the swelling experiments.
Sample Neat Epoxy SiCW-OH
/Epoxy
SiCW-P2VP
/Epoxy
SiCW-P2VP
/Epoxy
SiCW-P2VP
/Epoxy
𝑚𝑑 (g) 0.016±0.003 0.015±0.001 0.017±0.001 0.016±0.003 0.011±0.005
𝑚𝑒𝑞 −
𝑚𝑑 (g) 0.006±0.001 0.007±0.001 0.006±0.0003 0.006±0.0003 0.005±0.001
Equation 6.4 was used to obtain the volume fraction of the polymer in the
sample. Relative cross-linking density was calculated by Equation 6.3 23. In addition,

169
Figure 7.8: The graph of calculated values of relative cross-linking from DMA
measurements (▲) and swelling data (●) vs EMc. The samples are signified from left to
right as non-oriented (1), neat epoxy (2), oriented (3), SiCW-OH (4), SiCW-PAA (5),
SiCW-P2VP (6), and SiCW-EP (7).
relative cross-linking density value was calculated using EMc from Table 7.3 and
Equation 6.123.The results of the calculations are plotted in Figure 7.8.
Figure 7.8 demonstrates the comparison of the swelling data to cross-linking
density calculated from DMA results. The results show a certain mismatch in the
mechanical and swelling cross-linking density estimations for the composites. The linear
trend that follows the DMA data does not match the cross-linking density values obtained
from the swelling experiment. The linear increase in DMA cross-linking data is caused
by the distributed elastic stresses at the interfaces in the composites. The swelling data
show that the cross-linking density of the matrix is approximately the same for all the
composites. Thus, we suppose that the cross-linking density, for all the samples reported
0.0
0.5
1.0
1.5
2.0
2.5
3.0
0 5 10
Rel
ativ
e C
ross
-lin
kin
g D
ensi
ty
Emc (MPa)
1
2
3 4
5
6 7

170
in this chapter, is approximately the same as the neat epoxy. It appears that the most
efficient stress transfer through interface at the temperatures above Tg restricting mobility
of epoxy network is occurring in SiCW-P2VP and SiCW-Ep composites.
7.4: Conclusions
The following conclusions can be made from the study reported in Chapter 7:
In terms of epoxy curing kinetics, the addition of SiCW-PAA to the epoxy resin
decreases the activation energy of the curing, similar to the MagSiCWs.
The other whiskers studied did not significantly change the Ea, when compared to the
neat epoxy resin.
The highest rate of epoxy polymerization reaction was observed for the unmodified
(cleaned) SiCW-OH possessing hydroxyl groups on their surface. The curing process
of the epoxy in the presence of the whiskers is characterized by the highest value of
the pre-exponential factor in the Arrhenius equation.
The IR spectroscopy results indicated that the chemical pathways for the epoxy resin
curing are affected by the whiskers addition. Specifically, there is an accelerated
consumption of DDSA hardener in the presence of the filler.
The DMA results showed an increase in storage modulus at room temperature of
~60% for all composites in comparison with the neat epoxy material. These results
indicated that all types of modified whiskers have good and quite similar adhesion to
the matrix, which results in an effective stress transfer from the matrix to the filler.
As the temperature of measurements increased, more differences in the modulus of
the composite materials were observed. The highest value of Tg was found for SiCW-

171
Ep, while the lowest Tg was observed for the unmodified clean whiskers. In general,
the Tg determined in DMA measurements for the composites was higher than that of
the neat epoxy.
The Tg values determined from the DSC measurements were the highest for SiCW-
Ep. The lowest Tg was demonstrated by epoxy filled with SiCW-PAA. However, Tgs
for the composite materials are within ±5 degrees of that of pure epoxy.
Significant residual stresses were present in the neat epoxy material and in the
nanocomposites, as indicated by the presence of the enthalpic relaxation. The stresses
can be readily alleviated via thermal annealing and controlled cooling.
The microstructure of the composites was found to be quite similar, with the
exception of the composite containing SiCW-P2VP. The SiCW-P2VP composite had
the highest level of packing and the lowest amount of agglomerates.
The SiCW-P2VP’s superior dispersibility did not translate to enhancement in the
mechanical characteristics of the composite materials below Tg.
This study indicated that the surface modification of the SiCW, in many aspects,
significantly influences the formation and properties of the SiCW/epoxy composite
materials.
These results were used to identify the MagNP interphase on the MagSiCW as a
problematic region within the MagSiCW/epoxy nanocomposite materials.

172
7.5: References
1. Yuan, Z. K.; Yu, J. H.; Rao, B. L.; Bai, H.; Jiang, N.; Gao, J.; Lu, S. R., Enhanced
thermal properties of epoxy composites by using hyperbranched aromatic polyamide
grafted silicon carbide whiskers. Macromol Res 2014, 22 (4), 405-411.
2. Jancar, J.; Douglas, J. F.; Starr, F. W.; Kumar, S. K.; Cassagnau, P.; Lesser, A. J.;
Sternstein, S. S.; Buehler, M. J., Current issues in research on structure-property
relationships in polymer nanocomposites. Polymer 2010, 51 (15), 3321-3343.
3. Winey, K. I.; Vaia, R. A., Polymer nanocomposites. Mrs Bull 2007, 32 (4), 314-
319.
4. Schmidt, G.; Malwitz, M. M., Properties of polymer-nanoparticle composites.
Curr Opin Colloid In 2003, 8 (1), 103-108.
5. Balazs, A. C.; Emrick, T.; Russell, T. P., Nanoparticle polymer composites: where
two small worlds meet. Science 2006, 314 (5802), 1107-10.
6. Putz, K. W.; Palmeri, M. J.; Cohn, R. B.; Andrews, R.; Brinson, L. C., Effect of
cross-link density on interphase creation in polymer nanocomposites. Macromolecules
2008, 41, 6752-6756.
7. Lu, H. B.; Nutt, S., Restricted relaxation in polymer nanocomposites near the
glass transition. Macromolecules 2003, 36, 4010-4016.
8. Rittigstein, P.; Torkelson, J. M., Polymer-nanoparticle interfacial interactions in
polymer nanocomposites: Confinement effects on glass transition temperature and
suppression of physical aging. J Polym Sci Pol Phys 2006, 44 (20), 2935-2943.
9. Plueddemann, E. P., Interfaces in polymer matrix composites,. Composite
materials, Academic Press: New York, 1974; Vol. 6, p 294.
10. Chawla, K. K., Composite materials: Sceince and engineering. 3rd ed.; Springer
Science: 2012.

173
11. Tiwari, A.; Hihara, L. H. Nanoparticulate-enhanced coatings. US20120251807
A1, 2012.
12. Dawes, S. B.; Stempin, J. L.; Wexell, D. R. Multicomponent ceramic matrix
composites. US5153152 A, 1992.
13. Han, S.; Chung, D. D. L., Strengthening and stiffening carbon fiber epoxy
composites by halloysite nanotubes, carbon nanotubes and silicon carbide whiskers. Appl
Clay Sci 2013, 83-84 (83-84), 375-382.
14. Wang, W. X.; Takao, Y.; Matsubara, T.; Kim, H. S., Improvement of the
interlaminar fracture toughness of composite laminates by whisker reinforced
interlamination. Composites Science and Technology 2002, 62 (6), 767-774.
15. Zhou, Y. X.; Hosur, M.; Jeelani, S.; Mallick, P. K., Fabrication and
characterization of carbon fiber reinforced clay/epoxy composite. J Mater Sci 2012, 47
(12), 5002-5012.
16. Luzinov, I.; Julthongpiput, D.; Tsukruk, V. V., Thermoplastic elastomer
monolayers grafted to a functionalized silicon surface. Macromolecules 2000, 33 (20),
7629-7638.
17. Luzinov, I.; Julthongpiput, D.; Malz, H.; Pionteck, J.; Tsukruk, V. V., Polystyrene
layers grafted to epoxy-modified silicon surfaces. Macromolecules 2000, 33 (3), 1043-
1048.
18. Luzinov, I.; Julthongpiput, D.; Liebmann-Vinson, A.; Cregger, T.; Foster, M. D.;
Tsukruk, V. V., Epoxy-terminated self-assembled monolayers: Molecular glues for
polymer layers. Langmuir 2000, 16 (2), 504-516.
19. Tsyalkovsky, V.; Klep, V.; Ramaratnam, K.; Lupitskyy, R.; Minko, S.; Luzinov,
I., Fluorescent reactive core-shell composite nanoparticles with a high surface
concentration of epoxy functionalities. Chem Mater 2008, 20 (1), 317-325.
20. Tsyalkovsky, V.; Burtovyy, R.; Klep, V.; Lupitskyy, R.; Motornov, M.; Minko,
S.; Luzinov, I., Fluorescent nanoparticles stabilized by poly(ethylene glycol) containing

174
shell for pH-triggered tunable aggregation in aqueous environment. Langmuir 2010, 26
(13), 10684-92.
21. Zhou, X.; Goh, S. H.; Lee, S. Y.; Tan, K. L., XPS and FTIR studies of
interactions in poly(carboxylic acid)/poly(vinylpyridine) complexes. Polymer 1989, 39
(16), 3631-3640.
22. Harsch, M.; Karger-Kocsis, J.; Holst, M., Influence of fillers and additives on the
cure kinetics of an epoxy/anhydride resin. Eur Polym J 2007, 43 (4), 1168-1178.
23. Chen, J.-S.; Obera, C. K.; Poliks, M. D.; Zhang, Y.; Wiesner, U.; Cohenc, C.,
Controlled degradation of epoxy networks: analysis of crosslink density and glass
transition temperature changes in thermally reworkable thermosets. Polymer 2004, 45,
1939-1950.
24. Jung, J. C.; Lee, S. K.; Lee, K. S.; Choi, K. Y., Chain-length effect of alkenyl
succinic anhydride on thermal and mechanical-properties of the cured epoxy-resins.
Angewandte Makromolekulare Chemie 1991, 185, 129-136.
25. Kolar, F.; Svitilova, J., Kinetics and mechanism of curing epoxy/anhydride
systems. Acta Geodyn Geomater 2007, 4 (3), 85-92.
175
CHAPTER EIGHT
THE REINFORCEMENT OF MagSiCWs
8.1: Introduction
The study reported in Chapter 7 resulted in the understanding that stress transfer
at the MagSiCW-epoxy interface was not optimized. Specifically, the magnetic
nanoparticle layer deposited on the surface of SiCWs causes a reduction in the modulus
and Tg of the composite material in comparison to the composite incorporating whiskers
without the nanoparticles. Hence, in order to enhance the mechanical properties of the
material, a reinforcement of the magnetic interphase was explored aiming to create a
higher level of shear stress transfer through matrix-whisker boundary1. To this end, we
envisioned that an additional polymer encapsulation of the “fluffy” MagNPs layer would
alleviate the interfacial weaknesses. In fact, pre-impregnation is often used on macroscale
composites to ensure good wetting and infusion of complex fibrous materials with
polymers2. In our case, the “fluffy” layer of magnetic nanoparticles can be considered a
complex “fractal-like” structure, which is necessary to infiltrate with polymer to reinforce
the interfacial structure. Specifically, the MagNPs layer requires a polymer with binding
groups capable of covalently reacting with carboxylic acid groups of PAA covering the
nanoparticles. Hence, for this purpose, we selected PGMA, which has the epoxy
functional groups able to react with a plethora of different groups to create a covalently
bound network3-6. As such, it was thought to be an efficient reinforcing agent.
The melt state “grafting to” method, a well-known and easily applied
methodology for the application of PGMA to many different surfaces, was selected for

176
Figure 8.1: Schematic of methodology used for the surface modification of MagSiCWs
with PGMA.
the PGMA anchoring3. The bulk state melt grafting would allow for highly dense packing
of the macromolecules onto the surface. However, there is possible drawback, since the
fillers could be “welded” together or create excessive bridging, as seen in Chapter 3 with
the bridging of SiCWs with PGMA.
8.2: Experimental
8.2.1: Surface Modification of MagSiCWs with PGMA
The MagSiCWs were dispersed into methanol at 1.3 wt. %. Then, they were
added dropwise to a sonicated 5 wt. % solution of PGMA in MEK. The resulting solution
was roto-evaporated under nitrogen flow for 2.5 hours creating a composite film of
MagSiCWs dispersed in PGMA. Then, the film was heated to 120 oC for 1 hour under
nitrogen. The MagSiCWs were then redispersed in methanol and cleaned twice by
magnetic separating, decanting and redispersing in a fresh portion of methanol. Figure
8.1 is a schematic representation of the methodology used to modify the MagSiCWs’
surface with the PGMA (PGMA-MagSiCW).

177
8.2.2: TGA Measurements
The PGMA-MagSiCWs samples (3-5 mg) were purged with dry air for 10 min.
Then, they were heated in an air environment up to 600 oC at 20 oC/min.
8.2.3: Fabrication of Epoxy Composites
As reported in Chapters 6 and 7, the PGMA-MagSiCWs were dispersed in
methanol and mixed with epoxy resin. After methanol was evaporated from the mixture,
the hardener and catalyst were added. The epoxy:hardener:catalyst volume ratio was
1:1.37:0.07. To prepare the composite sample, the epoxy matrix/whiskers mixture was
casted into a Teflon mold. The mixture was cured at room temperature for 48 hours, and
then at 75 oC for 24 hours. According to DSC data, the time-temperature conditions were
sufficient to fully cure the polymer matrix. The volume fraction of whiskers in the matrix
was approximately 3 vol. %.
8.2.4: DMA Measurements
Tensile DMA testing was run at 2 oC/min from -20 oC to 150 oC using frequencies
of 1, 2, and 5 Hz and applying 5 μm amplitude of oscillation. Each of the samples had
approximately the same length, width, and thickness of 8.0 mm, 5.0 mm, and 0.34 mm.
8.2.5: DSC Measurements
The DSC measurements were conducted for samples of 3–5 mg. The DSC was
run from -20 oC to 150 oC at the heating rate of 15 oC/min. Then, the sample was cooled
down back to -20 oC at 15 oC/min and then heated for a second time up to 150 oC a at 15
oC/min.

178
Figure 8.2: SEM image of the 1:5 MagSiCW with the magnetic layer (circled in red)
identified as the low-stress transfer region.
8.2.6: SEM Imaging
The composite sample was immersed in liquid nitrogen and broken in
longitudinal direction. Then, using carbon tape, the composite was attached to the face of
an SEM disk propped up to see the longitudinal cross-section.
8.3: Results and Discussion
8.3.1: Identification of the Interphase
The interphase of the composite was thought to be a “fluffy” lower modulus
region. Thus, the identified mechanically weak region in the composite is assigned to be
the MagNP layer modifying the surface of the SiCWs (Figure 8.2). This weak interfacial
region does not provide the optimal structure for stress transfer within the epoxy
composite materials. Thus, the proposed reinforcement would create a more elastically
efficient interphase within the composite. Hence, the melt state “grafting to” of PGMA
was used to cement the attached MagNP layer to the SiCWs’ surface.
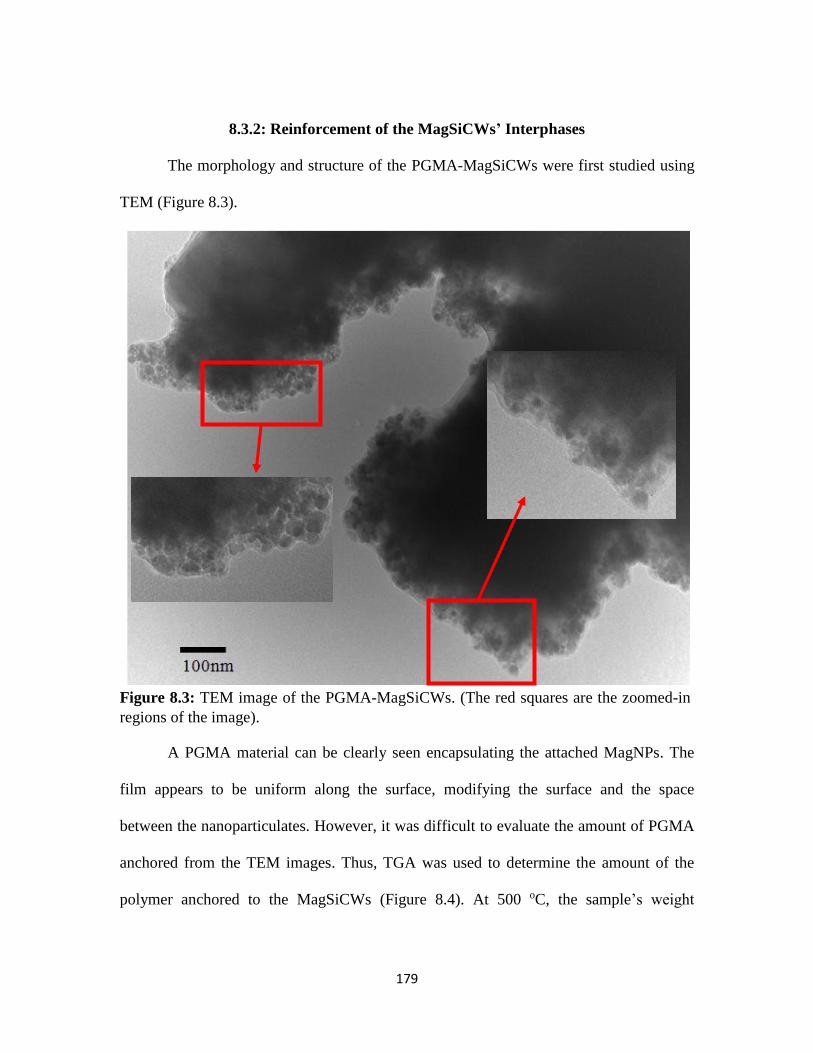
179
Figure 8.3: TEM image of the PGMA-MagSiCWs. (The red squares are the zoomed-in
regions of the image).
8.3.2: Reinforcement of the MagSiCWs’ Interphases
The morphology and structure of the PGMA-MagSiCWs were first studied using
TEM (Figure 8.3).
A PGMA material can be clearly seen encapsulating the attached MagNPs. The
film appears to be uniform along the surface, modifying the surface and the space
between the nanoparticulates. However, it was difficult to evaluate the amount of PGMA
anchored from the TEM images. Thus, TGA was used to determine the amount of the
polymer anchored to the MagSiCWs (Figure 8.4). At 500 oC, the sample’s weight

180
Figure 8.4: TGA curve of the MagSiCW modified with PGMA.
decreased by 24.4 %. Using Equation 3.5 and comparing the results to the already present
polymer on the surface (8.0 wt. %), the thickness of the PGMA layer was calculated to be
~90 nm. This does not correlate well with the image analysis. We suggested that the
excessive amount of PGMA is due to the bridging between SiCWs, which was also
observed for the modification of bare SiCWs (Chapter 3) and/or impregnation of the
~100 nm MagNP surface layer. However, the PGMA-MagSiCWs were found to be
magnetic and modified with the PGMA layer. Therefore, they were determined to be
suitable of fabrication of the composite material.
8.3.3: DMA Study of PGMA-MagSiCW/Epoxy Composites
The DMA testing was foreseen as a technique that could directly reveal the
interfacial improvement of the MagSiCWs. In comparison to the neat epoxy, the
MagSiCWs’ epoxy composite without orientation had a higher modulus but a reduced Tg
(Chapter 6). Thus, the enhancement of these properties would determine whether the
60
70
80
90
100
0 100 200 300 400 500 600
Wei
gh
t (%
)
Temperture (oC)

181
Figure 8.5: The temperature dependence of the storage modulus results for the PGMA-
MagSiCW epoxy composites (▲), non-oriented MagSiCWs epoxy composite (●), and
neat epoxy (■).
interphase improvement was achieved with the PGMA grafting. The PGMA-MagSiCWs
were mixed with the epoxy resin and cured (no magnetic orientation was applied). Figure
8.5 demonstrates the thermo-mechanical properties of the obtained PGMA-MagSiCW
epoxy composites in comparison to the neat epoxy and the non-oriented MagSiCWs
epoxy composites.
The DMA results are summarized in Table 8.1. The data indicate that the room
temperature storage modulus for the PGMA-MagSiCWs/epoxy composite is ~20 %
higher than that for the MagSiCW/epoxy material, 46 % greater than that for the neat
epoxy and within a standard deviation of the other materials containing non-oriented
SiCWs (Chapter 7). Additionally, the thermal properties have improved dramatically.
The DMA Tg increased by 30oC comparing with the former MagSiCW, by 20oC
-40 -20 0 20 40 60 80 100 120 140 160
0
500
1000
1500
2000
2500
3000
Sto
rag
e M
od
ulu
s (
MP
a)
Temperature (oC)

182
comparing with the neat epoxy, and it was approximately 10–20oC higher than that for
the other composites containing SiCWs.
Table 8.1: Thermo-mechanical properties of the PGMA-MagSiCW/epoxy composite
compared with the neat epoxy and MagSiCWs non-oriented composite.
Table 8.1 shows that the peak temperatures of E” and tan δ of PGMA-MagSiCWs
material are greater than those of the other samples. At the same time, the peak value of
tan δ is much lower than that for the other materials. These results indicated an efficient
stress transfer in the composite. The transfer appears to be better than the one in all the
other composite samples except for the SiCW-Ep (1.14 MPa). The enhanced composite
properties show that the reinforcement of the interfacial region can be done with PGMA,
improving the thermo-mechanical properties of the composite material.
8.3.4: DSC Study of PGMA-MagSiCW/Epoxy Composites
The composite samples were investigated using DSC to identify the Tg of the
materials in static conditions. Figure 8.6a and Table 8.2 shows Tg for the composites
containing MagSiCWs and PGMA-MagSiCW along with the neat epoxy. The Tg of the
PGMA-MagSiCW/epoxy composite was the highest (79.3 oC) with clear presence of
enthalpic relaxation. The level of enthalpic relaxation observed for the PGMA reinforced
whiskers was less prominent than that for the other presented samples.
Sample E’ (@RT)
(MPa)
E” Peak
(MPa)
Peak
Temp. (oC)
Tan δ Peak
(MPa)
Peak Temp.
(oC)
Neat Epoxy 1521 189 69 2.01 77
MagSiCW-No
Orientation 1868 242 55 2.53 67
PGMA-
MagSiCWs 2226 243 89 1.15 99

183
Figure 8.6: The DSC curves for the PGMA-MagSiCW/epoxy composite,
MagSiCW/epoxy composite, and the neat epoxy samples: (a) first run and (b) second
run.
Table 8.2: The selected thermal properties of the materials studied.
Sample Tg-h1 (oC) Tg-h2 (oC)
Neat Epoxy 63.3 59.5
Non-oriented SiCWs 50.4 47.0
PGMA-MagSiCWs 79.3 65.6
20 40 60 80 100-0.6
-0.5
-0.4
-0.3
-0.2
-0.1
Heat F
low
(W
/g)
Temperature(oC)
PGMA-MagSiCW
Neat Epoxy
MagSiCW
20 40 60 80 100
-0.6
-0.5
-0.4
-0.3
-0.2
-0.1
He
at
Flo
w (
W/g
)
Temperature (oC)
PGMA-MagSiCW
Neat Epoxy
MagSiCW
a)
b)

184
Figure 8.7: SEM image of the cross-section of the PGMA-MagSiCW/epoxy composite.
The newly fabricated material have improved thermal properties in comparison to
the other composites and the neat epoxy. As the only parameter changing was the PGMA
modification, the increased Tg could only be attributed to increases in the local cross-
linking density of the epoxy bulk. In addition, the PGMA-reinforcing layer cemented the
fluffy MagNP layer on the surface of the SiCWs, creating a greater rigidity of the
interphase, which was manifested through the DMA measurements shown in Section
8.2.3.
8.3.5: Nanocomposites’ Microstructure
The composite microstructure of the PGMA-MagSiCW/epoxy nanocomposite
was observed with SEM (Figure 8.7). The imaged microstructures showed randomly
oriented and evenly dispersed whiskers within the epoxy matrix. The PGMA-MagSiCWs
were manually analyzed using Gwydion software using four images from three different
samples to obtain the dispersity, concentration of aggregates per unit area, and the size of
the aggregates (Table 8.3).

185
Table 8.3: Summary of the SEM image analysis.
Summary
Distance
between fillers
(μm)
# of agg./mm2 Length of agg.
(μm)
Width of agg.
(μm)
Non-oriented
MagSiCWs 10.9 ± 5.9 80 ± 3.0 10.6 ± 3.6 5.2 ± 3.6
PGMA-
MagSiCWs 11.1 ± 7.7 247 ± 47 10.3 ± 3.1 4.8 ± 1.7
Table 8.3 shows that the dispersity of the components went down as the
reinforced sample had significantly more aggregates. Specifically, the PGMA-
MagSiCW/epoxy composite has the highest number of agglomerates per unit area of any
of the composite materials prepared in this work. However, this did not significantly
hinder the composite’s properties. These results also show the aggregates were of low
aspect ratio, ~2. Thus, we suggest that the aggregates originated from the bridging
between the whiskers as a result of PGMA grafting. However, the concentration of
aggregates was under the critical number for hindering the improvement in composite
properties. Another result of the microstructure analysis was that there was no orientation
in the composite film. The orientation of the PGMA-MagSiCWs in the composite was
manually measured using Gwyddion. The results are shown in Figure 8.8.
The random distribution is similar to the previously studied non-oriented
MagSiCW/epoxy composite materials. Thus, the composites have the same
microstructure allowing for a direct comparison of properties.

186
Figure 8.8: Histogram of the PGMA-MagSiCW fillers orientation in the epoxy matrix.
8.4: Conclusions
The following conclusions can be made as a result of the study reported in
Chapter 8:
The macromolecule reinforcement of the composite interfacial structure improved
thermal and thermo-mechanical properties of the composite by structurally
cementing the magnetic particulates on the surface of the SiCWs.
The obtained composite had increased Tg and the modulus in comparison to its
counterpart composite (with MagSiCWs) and the neat epoxy.
The microstructure of the composite materials showed a higher concentration of
agglomerates with a lower packing density of the dispersed filler along with a
completely random distribution.
The composite material containing PGMA-MagSiCWs increased thermal and
mechanical properties indicated that the application of PGMA created a densely
packed interphase with a greatly increased rigidity and cross-linking density.
0
10
20
30
0 20 40 60 80
Per
cent
mat
eria
l (%
)
Orientation from net director (o)

187
8.5: References
1. Plueddemann, E. P., Interfaces in polymer matrix composites,. Composite
materials, Academic Press: New York, 1974; Vol. 6, p 294.
2. Chawla, K. K., Composite materials: Science and engineering. 3rd ed.; Springer
Science: New York, 2013.
3. Zdyrko, B.; Klep, V.; Luzinov, I., Synthesis and surface morphology of high-
density poly(ethylene glycol) grafted layers. Langmuir 2003, 19 (24), 10179-10187.
4. Yu, W. H.; Kang, E. T.; Neoh, K. G., Controlled grafting of well-defined epoxide
polymers on hydrogen-terminated silicon substrates by surface-initiated ATRP at ambient
temperature. Langmuir 2004, 20 (19), 8294-8300.
5. Draper, J.; Luzinov, I.; Minko, S.; Tokarev, I.; Stamm, M., Mixed polymer
brushes by sequential polymer addition: anchoring layer effect. Langmuir 2004, 20 (10),
4064-4075.
6. Edmondson, S.; Huck, W. T. S., Controlled growth and subsequent chemical
modification of poly(glycidyl methacrylate) brushes on silicon wafers. J Mater Chem
2004, 14 (4), 730-734.

188
CHAPTER NINE
CONCLUSIONS
This chapter is devoted to concluding the body of work presented in this
dissertation. The study of SiCW/epoxy composite materials resulted in a number of
observations about the nanocomposites fabrication, their structure and properties. The
following major conclusions can be drawn:
The fabrication of magnetically active SiC whiskers is possible using polymer-to-
polymer complexation of absorbed PAA and grafted P2VP at the interfaces of iron
oxide nanoparticles and SiC whiskers, respectively.
The magnetically active SiC whiskers can be effectively oriented within a curing
epoxy matrix.
The addition of the whiskers with and without orientation can dramatically improve
the composite materials’ properties. Additionally, the orientation of the whiskers
has a significant positive effect on the composites’ Tg.
The magnetic layer was identified as a “fluffy” region negatively influencing the
mechanical and thermal properties of the composite materials.
The “fluffy” magnetic layer attached to the SiC whiskers can be structurally
reinforced by the addition of PGMA utilizing the melt state “grafting to” technique.
The reinforcement of the “fluffy” magnetic layer resulted in the further
improvement of the nanocomposite’s properties.

189
CHAPTER TEN
FUTURE WORK
Although, this body of work established a methodology for the fabrication of
magnetically oriented SiCW/epoxy composite materials, there are still related
scientific/engineering aspects that were not addressed and might be the subjects of the
future work. Some of them are listed below:
Preparation of SiCWs modified with monolayer of magnetic nanoparticles. Such
modification could potentially reduce or eliminate the “fluffiness” of the interfacial
region leading to the boost in mechanical and thermal properties. The experimental
effort related to this aspect would involve:
wet synthesis of magnetic nanoparticles of a desired size;
study of surface modification of the nanoparticle with PAA of different
molecular weights aiming to produce individually modified particles, but
not aggregates;
development of an experimental procedure for the attachment of the
particles to P2VP modified SiCWs with minimal inter-whisker bridging
and particle multilayer formation.
Fabrication of the newly prepared whisker/epoxy composites (with and without
orientation) utilizing the methodologies developed in this work and studying their
thermal and thermo-mechanical
Study the dynamics of the orientation MagSiCW in epoxy resin and its dependence
on the size and number of the nanoparticles comprising the magnetic monolayer;

190
Fabrication and evaluation of properties of the composite materials with high
volume fraction of the fillers including:
dynamics of the whiskers orientation in the situation of increasing whisker-
whisker interaction at high loads;
influence of whiskers’ surface chemistry on epoxy curing and evolution of
epoxy matrix’s properties at high concentration of the fillers;
relevancy of the theoretical models used for calculation of the mechanical
properties of composite materials with directionally aligned nanofillers.
Fabrication and evaluation of properties of multilayered composite materials with
the filler oriented at different angle in each layer.

191
APPENDIX
MATERIALS AND INSTRUMENTATION
3.1: Materials
3.1.1: Nanoparticles
Absolute Ethyl Alcohol (99.5%):
Company Identification: Acros, Inc
CAS Number: 64-17-5
Nickel (III) Chloride Hexahydrate:
Company Identification: Acros, Inc
CAS Number: 1310-58-3
Potassium Hydroxide [KOH]:
Company Identification: EMD Millipore
CAS Number: 1310-58-3
Hydrazine Hydrate (78-82%) (iodometric):
Company Identification: Sigma Aldrich
CAS Number: 10217-52-4

192
Iron oxide nanoparticles (99.5%):
Company Identification: US Research Nanomaterials Inc.
CAS Number: 1317-61-9
3.1.2: Whiskers
Silicon Carbide Whiskers:
Company Identification: Advanced Composite Materials, LLC.
Component Identification: Silar SC-9M
3.1.3: Surface Modification
Silicon Wafer:
Company Identification: University Wafer
Component Identification: silicon crystal <100> 725-850nm (oxide layer)
Identification number: 1978
The wafers were used to study surface modification.
Hydrogen peroxide [H2O2]:
Company Identification: Acros Organics.
Component Identification: Hydrogen Peroxide (30% in Water) (Without Stabilizer),
Reagent ACS.
CAS Number: 7722-84-1

193
Sulfuric acid 98% [H2SO4]:
Company Identification: Acros Organics.
Component Identification: Sulfuric Acid, Reagent ACS
CAS Number: 7664-93-9
Toluene:
Company Identification: Acros Organics
Component Identification: Toluene, Reagent ACS
CAS Number: 108-88-3
Methyl ethyl ketone [MEK]:
Company Identification: Acros Organics
Component Identification: 2-Butanone, 99+%
CAS Number: 78-93-3
Acetone:
Company Identification: VWR International LLC
Component Identification: Acetone, ACS
CAS Number: 67-64-1

194
Methanol:
Company Identification: VWR International LLC
Component Identification: Methanol, ACS
CAS Number: 67-56-1
Polyglycidyl methacrylate [PGMA] (Structure 3.1):
The PGMA (Mn=100,000 g/mole, PDI~2.7) was synthesized by radical
polymerization and purified by multiple precipitations in ether following the procedure
described elsewhere[1, 2]. It was used as the initial modifier in the grafting process for
the silicon wafers and nanoparticulates.
(3-Glycideloxypropel)trimethoxysilane ≥98% [epoxy silane] (Structure 3.2):
(3-Glycideloxypropel)trimethoxysilane was ordered from Sigma Aldrich. It was
dispersed in toluene and used for the initial polymer modification of model Si wafers and
silicon carbide whiskers.
(S3.1)
(S3.2)
195
Carboxy-terminated polyethylene glycol [PEG] (Structure 3.3):
Polyethylene glycol monomethyl ether (Mn=5000 g/mol) was obtained from Sigma-
Aldrich and modified with succinic anhydride to form a carboxy-terminated derivative
following procedure reported elsewhere [1]. The PEG molecule was used to study the
polymer grafting to nickel model surfaces and nickel nanoparticles.
Carboxy-terminated poly (2-vinyl pyridine) [P2VP] (Structure 3.4):
The carboxy-terminated poly (2-vinyl pyridine) (Mn=53000 g/mole, PDI=1.06) was
purchased from Polymer Source Inc., Canada.
Polyacrylic acid [PAA] (Structure 3.5):
The PAA (Mw=100,000g/mol) from Sigma-Aldrich was dispersed in water at 35 % and
diluted with methanol to form a 2-5% solution of PAA in solution. This solution was
(S3.4)
(S3.3)

196
used for modification of model surfaces by dip-coating from solution and iron oxide
nanoparticles by adsorption.
3.1.4: Composite Fabrication
PEO (Structure 3.6):
Polyethylene oxide (Mn=1000000 g/mol) was obtained from Sigma-Aldrich.
Methanol:
Company Identification: VWR International LLC
Component Identity: Methanol, ACS
CAS Number: 67-56-1
(S3.5)
(S3.6)

197
Araldite 6005 epoxy resin:
Company Identification: Electron Mcroscopy Science (EMS).
Component Identification: 4-(1,1-Dimethylene) phenoxymethyl Ooxirane; Phenol, 4,4-
(1-methylethylidene bis polymer with (chloromethyl) oxirane
CAS Number:3101-60-8
Dodecyl Succinic Anhydride [DDSA]:
Company Identification: Electron Microscopy Science (EMS).
Z-Benzyl dimethylamine [BDMA]:
Company Identification: Electron Microscopy Science (EMS).
Teflon plates:
Company Identification: Fluoro-Plastics
Size: 1” x 3” x 1/8”
Double Sided Scotch Tape:
Company Identification: Scotch tape
Size: ~1mm thickness

198
3.2: Instrumentation
3.2.1: Model Surface Morphology
Atomic Force Microscopy [AFM]:
Company Identification: Digital Instruments, Inc.
Component Identification: Dimension 3100 microscope
Ellipsometry:
Company Identification: InOmTech,Inc.
Component Identification: COMPEL automatic Ellipsometer (70° angle of incidence)
3.2.2: Nano-Particulates Morphology
Scanning Electron Microscopy [SEM]:
Company Identification: Hitachi
Component Identification: HD2000
Transmission Electron Microscopy [TEM]:
Company Identification: Hitachi
Component Identification: 7600
TEM Grids:
Company Identification: Electron Microscopy Science
Component Identification: FCF-200-Cu (Formvar carbon film on 200 mesh copper grids)

199
3.2.3: Composite Microstructure
Scanning Electron Microscopy [SEM]:
Company Identification: Hitachi
Component Identification: SU6600
3.2.4: Optical Characterization
Laser profilometer:
Company Identification: Olympus
Component Identification: LEXT
High Resolution Optical Microscopy:
Company Identification: Olympus
Component Identification: MVX10
3.2.5: Magnetic Characterization
Magnetometer:
Company Identification: Princeton Measurements Coperation
Component Identification: MicroMag Magnetometer
Model: 2900-02C

200
3.2.6: Thermo-Mechanical Characterization
Dynamic Mechanical Analysis [DMA]:
Company Identification: TA Instruments
Component Identification: DMA Q800
Set up: Tensile Testing
3.2.7: Thermal Characterization:
Differential Scanning Calorimeter:
Company Identification: TA Instruments
Component Identification: DSC Q1000
Thermal Gravimetric Analysis:
Company Identification: TA Instruments
Component Identification: TGA Q5000:
3.2.8: Chemical Characterization
IR Spectroscopy:
Company Identification: Nicolet
Component Identification: Magna-IR Spectrometer 550

201
REFERENCES:
1. B. Zdyrko, V. Klep, and I. Luzinov, Synthesis and surface morphology of high-
density poly(ethylene glycol) grafted layers. Langmuir, 2003. 19(24): p. 10179-
10187.
2. B. Zdyrko, V. Klep, and I. Luzinov, Macromolecular anchoring layers for
polymer grafting: comparative study. Polymer 2006, 2006. 47(1): p. 272-279.