FAA Airline Project
66
By: Amanda Camp, Annie Kang, and Nick Lal OFFICE OF AVIATION CONSUMER PROTECTION: FAA DELAY DATA ANALYSIS
-
Upload
nicholas-lal -
Category
Data & Analytics
-
view
34 -
download
0
Transcript of FAA Airline Project

By: Amanda
Camp, Annie
Kang, and
Nick Lal
OFFICE OF AVIATION
CONSUMER
PROTECTION: FAA
DELAY DATA
ANALYSIS

About 20% of the total fl ights throughout the country are delayed
There are five possible causes for arrival delays at an airport: air carrier issues, inclement weather, issues due to the National Aviation System, security issues, and late arriving aircrafts.
The LEADING cause of arrival delays is due to air carriers, and the least likely cause is security.
WHAT ARE THE LEADING CAUSES OF
ARRIVAL DELAYS IN THE U.S.?
American Flights in 2013
Total Flights: 5852743
% of Flights..:
Total Delayed Flights: 1124319 19%
Total Flights On-Time: 4634155 79%
Total Flights Cancelled: 81265 1%
Total Flights Diverted: 13004 0%

ON AVERAGE, AROUND 80 ARRIVAL
FLIGHTS ARE DELAYED TO EACH
AIRPORT BY 15 MINUTES OR MORE EACH
MONTH
Mean 77.02397753
Median 25
Mode 6
Standard Deviation 198.0042217
Range 5268
Minimum 0
Maximum 5268
0.00%
10.00%
20.00%
30.00%
40.00%
50.00%
60.00%
70.00%
80.00%
90.00%
100.00%
0
1000
2000
3000
4000
5000
6000
7000
20 40 60 80 100 200 300 400 500 1000 2000 3000 4000 5000 More
Fre
qu
en
cy
Bins
Arrivals Delayed by 15 Minutes
Frequency
Cumulative %

THE GREATEST NUMBER OF FLIGHTS ARE
DELAYED DUE TO PROBLEMS WITHIN THE
CONTROL OF THE AIR CARRIER
% of Delays Due to Carriers
Mean 36%
Median 34%
% Delays Due To Weather
Mean 3%
Median 1%
% Delays Due To National Airline Security
Mean 28%
Median 25%
% Delays Due To Security
Mean 0%
Median 0%
% Delays Due To Late Aircraft
Mean 32%
Median 32%

CARRIER DELAYS ALSO CONSTITUTE THE
GREATEST AMOUNT OF TIME DELAYED
% of Time Delayed Due to Carrier
Mean 37%
Median 35%
% of Time Delayed Due to Weather
Mean 4%
Median 1%
% of Time Delayed Due to NAS
Mean 22%
Median 18%
% of Time Delayed Due to Security
Mean 0%
Median 0%
% of Time Delayed Due to Late Aircraft
Mean 36%
Median 36%

CONTRARY TO MEDIA PORTRAYAL, SECURITY
ISSUES ARE ACTUALLY THE LEAST LIKELY
CAUSE OF AN AIRPORT DELAY
% of Delays Due to Carriers
Mean 36%
Median 34%
% Delays Due To Weather
Mean 3%
Median 1%
% Delays Due To National Airline Security
Mean 28%
Median 25%
% Delays Due To Security
Mean 0%
Median 0%
% Delays Due To Late Aircraft
Mean 32%
Median 32%
% of Time Delayed Due to Carrier
Mean 37%
Median 35%
% of Time Delayed Due to Late Aircraft
Mean 36%
Median 36%
% of Time Delayed Due to NAS
Mean 22%
Median 18%
% of Time Delayed Due to Weather
Mean 4%
Median 1%
% of Time Delayed Due to Security
Mean 0%
Median 0%
De
cre
asin
g
Perc
enta
ges

BECAUSE CARRIER DELAYS HAVE THE
LOWEST VARIABILITY, AIR CARRIER
DELAYS CAN BE EXPECTED TO REMAIN A
LEADING CAUSE FOR ARRIVAL DELAYS
261% 258% 204% 301% 307% 404% 293% 367% 415% 287% 259% 347% 363% 550% 304%
Arrival
flights
Arrival
Delay
Carrier
Count
Weather
Count
NAS
Count
Security
Count
Late Aircraft
Count
Arrivals
cancelled
Arrivals
diverted
Arrival
delay
Carrier
delay
Weather
delay
NAS
delay
Security
delay
Late aircraft
delay
The Coefficient of Variation

Summary
Statistics
and
Histogram
s
ANNEX

ARRIVAL FLIGHTS: TOTAL
Arrival Flights
Mean 397.9292222
Standard Error 8.55599391
Median 125
Mode 31
Standard Deviation 1037.641367
Sample Variance 1076699.607
Kurtosis 85.96928549
Skewness 7.588277263
Range 18776
Minimum 1
Maximum 18777
Sum 5852743
Count 14708
Bins Frequency Cumulative %
75 4568 31.06%
150 3629 55.73%
225 1880 68.51%
300 1017 75.43%
375 589 79.43%
450 552 83.19%
525 392 85.85%
600 345 88.20%
675 191 89.50%
750 136 90.42%
825 124 91.26%
900 107 91.99%
975 79 92.53%
1500 349 94.90%
2000 166 96.03%
More 584 100.00%
Summary Statistics Histogram Data

ARRIVAL FLIGHTS: TOTAL
0.00%
10.00%
20.00%
30.00%
40.00%
50.00%
60.00%
70.00%
80.00%
90.00%
100.00%
0
500
1000
1500
2000
2500
3000
3500
4000
4500
5000
75 150 225 300 375 450 525 600 675 750 825 900 975 1500 2000 More
Fre
qu
en
cy
Bins
Total Arrivals
Frequency
Cumulative %
ARRIVAL FLIGHTS: DELAYED
Summary Statistics Histogram Data
Bins Frequency Cumulative %
20 6620 45.01%
40 2918 64.85%
60 1476 74.89%
80 858 80.72%
100 557 84.51%
200 1215 92.77%
300 330 95.02%
400 182 96.25%
500 119 97.06%
1000 277 98.95%
2000 135 99.86%
3000 16 99.97%
4000 2 99.99%
5000 1 99.99%
More 1 100.00%
Arrival Delay 15+ more
Mean 77.02397753
Standard Error 1.638862983
Median 25
Mode 6
Standard Deviation 198.0042217
Sample Variance 39205.6718
Skewness 7.774677335
Range 5268
Minimum 0
Maximum 5268
Sum 1124319
Count 14597

ARRIVAL FLIGHTS: DELAYED
0.00%
10.00%
20.00%
30.00%
40.00%
50.00%
60.00%
70.00%
80.00%
90.00%
100.00%
0
1000
2000
3000
4000
5000
6000
7000
20 40 60 80 100 200 300 400 500 1000 2000 3000 4000 5000 More
Fre
qu
en
cy
Bins
Arrivals Delayed by 15 Minutes
Frequency
Cumulative %

ARRIVAL FLIGHTS: DIVERTED
Bins Frequency Cumulative %
0 10390 70.64%
1 2465 87.40%
2 764 92.60%
3 324 94.80%
4 181 96.03%
5 134 96.94%
6 83 97.50%
7 55 97.88%
8 47 98.20%
9 44 98.50%
10 25 98.67%
More 196 100.00%
Summary Statistics Histogram Data
Arrivals Diverted
Mean 0.884144683
Standard Error 0.030261682
Median 0
Mode 0
Standard Deviation 3.670032147
Sample Variance 13.46913596
Skewness 15.67436129
Range 151
Minimum 0
Maximum 151
Sum 13004
Count 14708

ARRIVAL FLIGHTS: DIVERTED
0.00%
10.00%
20.00%
30.00%
40.00%
50.00%
60.00%
70.00%
80.00%
90.00%
100.00%
0
2000
4000
6000
8000
10000
12000
0 1 2 3 4 5 6 7 8 9 10 More
Fre
qu
en
cy
Bins
Arrivals Diverted
Frequency
Cumulative %

ARRIVAL FLIGHTS: CANCELLED
Bins Frequency Cumulative %
0 6261 42.57%
2 3608 67.10%
4 1617 78.09%
6 843 83.83%
8 562 87.65%
10 315 89.79%
20 715 94.65%
30 279 96.55%
40 139 97.49%
50 87 98.08%
100 168 99.22%
500 112 99.99%
More 2 100.00%
Summary Statistics Histogram Data
Arrivals Cancelled
Mean 5.525224368
Standard Error 0.167235171
Median 1
Mode 0
Standard Deviation 20.28170351
Sample Variance 411.3474972
Skewness 11.5532291
Range 640
Minimum 0
Maximum 640
Sum 81265
Count 14708

ARRIVAL FLIGHTS: CANCELLED
0.00%
10.00%
20.00%
30.00%
40.00%
50.00%
60.00%
70.00%
80.00%
90.00%
100.00%
0
1000
2000
3000
4000
5000
6000
7000
0 2 4 6 8 10 20 30 40 50 100 500 More
Fre
qu
en
cy
Bins
Arrivals Cancelled
Frequency
Cumulative %

CARRIER COUNT
Bins Frequency Cumulative %
5 5056 34.38%
10 2932 54.31%
15 1761 66.28%
20 1122 73.91%
25 800 79.35%
30 551 83.10%
35 396 85.79%
40 290 87.76%
45 265 89.56%
50 196 90.90%
100 777 96.18%
500 552 99.93%
1000 9 99.99%
More 1 100.00%
Summary Statistics Histogram Data
Carrier Count
Mean 21.19381493
Standard Error 0.355918393
Median 8.71
Mode 0
Standard Deviation 43.16455251
Sample Variance 1863.178593
Skewness 6.889807062
Range 1117.2
Minimum 0
Maximum 1117.2
Sum 311718.63
Count 14708

CARRIER COUNT
0.00%
10.00%
20.00%
30.00%
40.00%
50.00%
60.00%
70.00%
80.00%
90.00%
100.00%
0
1000
2000
3000
4000
5000
6000
5 10 15 20 25 30 35 40 45 50 100 500 1000 More
Fre
qu
en
cy
Bins
Delays Caused by Carrier
Frequency
Cumulative %

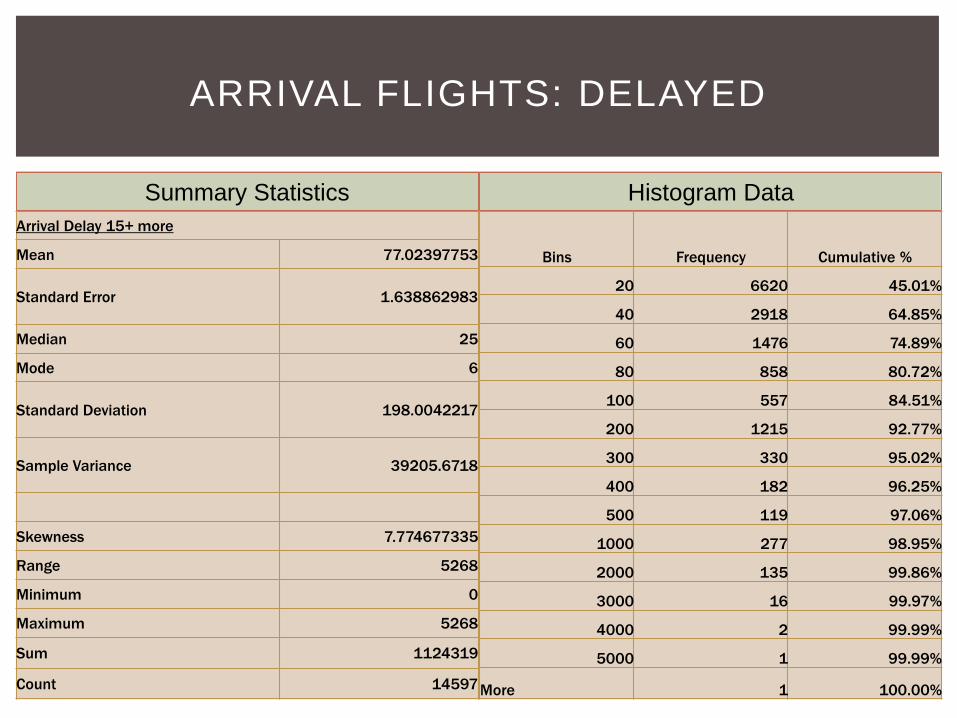
WEATHER COUNT
Bins Frequency Cumulative %
1 9530 64.79%
2 1773 76.85%
3 924 83.13%
4 563 86.96%
5 386 89.58%
6 291 91.56%
7 219 93.05%
8 151 94.08%
9 120 94.89%
10 82 95.45%
20 435 98.41%
30 118 99.21%
40 46 99.52%
50 22 99.67%
100 41 99.95%
More 7 100.00%
Summary Statistics Histogram Data
Weather Count
Mean 2.168992385
Standard Error 0.053754894
Median 0.48
Mode 0
Standard Deviation 6.519207796
Sample Variance 42.50007028
Skewness 11.59905053
Range 210.73
Minimum 0
Maximum 210.73
Sum 31901.54
Count 14708
WEATHER COUNT
0.00%
10.00%
20.00%
30.00%
40.00%
50.00%
60.00%
70.00%
80.00%
90.00%
100.00%
0
2000
4000
6000
8000
10000
12000
1 2 3 4 5 6 7 8 9 10 20 30 40 50 100 More
Fre
qu
en
cy
Bins
Delays Caused by Weather
Frequency
Cumulative %
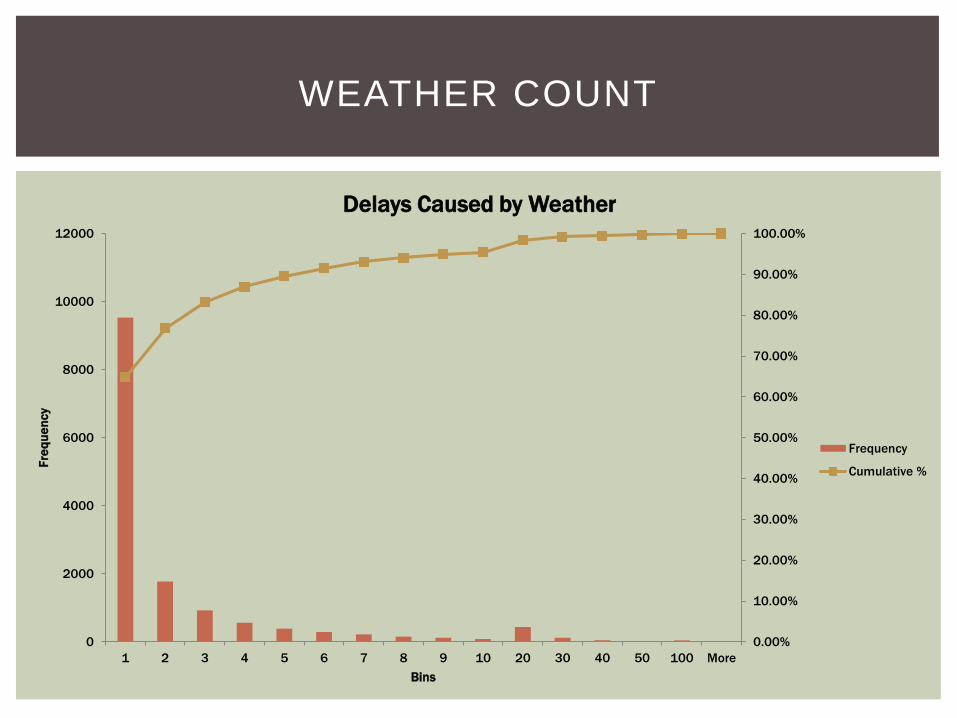
NAS COUNT
Bins Frequency Cumulative %
5 6643 45.17%
10 2701 63.53%
15 1470 73.52%
20 853 79.32%
25 594 83.36%
30 383 85.97%
35 289 87.93%
40 207 89.34%
45 155 90.39%
50 136 91.32%
100 597 95.38%
500 608 99.51%
2000 71 99.99%
More 1 100.00%
Summary Statistics Histogram Data
NAS count
Mean 23.43713693
Standard Error 0.592349667
Median 6
Mode 0
Standard Deviation 71.83812011
Sample Variance 5160.715501
Skewness 9.470748734
Range 2401.79
Minimum 0
Maximum 2401.79
Sum 344713.41
Count 14708

NAS COUNT
0.00%
10.00%
20.00%
30.00%
40.00%
50.00%
60.00%
70.00%
80.00%
90.00%
100.00%
0
1000
2000
3000
4000
5000
6000
7000
5 10 15 20 25 30 35 40 45 50 100 500 2000 More
Fre
qu
en
cy
Bins
Delays Caused by the National Aviation System
Frequency
Cumulative %

SECURITY COUNT
Bins Frequency Cumulative %
0 12909 87.77%
0.5 520 91.30%
1 716 96.17%
2 328 98.40%
3 116 99.19%
4 53 99.55%
5 30 99.76%
6 18 99.88%
7 6 99.92%
8 4 99.95%
9 4 99.97%
10 1 99.98%
11 1 99.99%
12 2 100.00%
More 0 100.00%
Summary Statistics Histogram Data
Security Count
Mean 0.139990481
Standard Error 0.004669121
Median 0
Mode 0
Standard Deviation 0.56625481
Sample Variance 0.320644509
Skewness 7.479995736
Range 11.23
Minimum 0
Maximum 11.23
Sum 2058.98
Count 14708

SECURITY COUNT
80.00%
82.00%
84.00%
86.00%
88.00%
90.00%
92.00%
94.00%
96.00%
98.00%
100.00%
102.00%
0
2000
4000
6000
8000
10000
12000
14000
0 0.5 1 2 3 4 5 6 7 8 9 10 11 12 More
Fre
qu
en
cy
Bins
Delays by Security
Frequency
Cumulative %

LATE AIRCRAFT COUNT
Bins Frequency Cumulative %
0 1200 8.16%
10 7263 57.54%
20 2493 74.49%
30 1051 81.64%
40 639 85.98%
50 400 88.70%
100 825 94.31%
200 403 97.05%
500 316 99.20%
1000 105 99.91%
1500 10 99.98%
More 3 100.00%
Summary Statistics Histogram Data
Late-aircraft Count
Mean 29.50291814
Standard Error 0.713528352
Median 7.47
Mode 0
Standard Deviation 86.53425217
Sample Variance 7488.176799
Skewness 7.657446284
Range 1699.38
Minimum 0
Maximum 1699.38
Sum 433928.92
Count 14708

LATE AIRCRAFT COUNT
0.00%
10.00%
20.00%
30.00%
40.00%
50.00%
60.00%
70.00%
80.00%
90.00%
100.00%
0
1000
2000
3000
4000
5000
6000
7000
8000
0 10 20 30 40 50 100 200 500 1000 1500 More
Fre
qu
en
cy
Bins
Delays by Late Aircraft
Frequency
Cumulative %
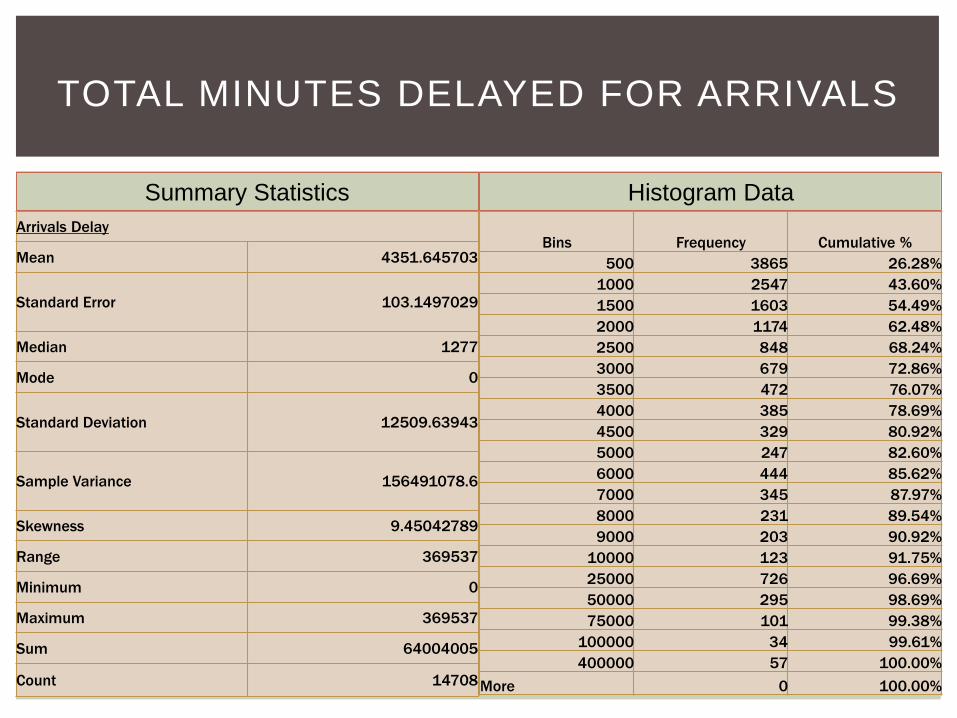
TOTAL MINUTES DELAYED FOR ARRIVALS
Summary Statistics Histogram Data
Arrivals Delay
Mean 4351.645703
Standard Error 103.1497029
Median 1277
Mode 0
Standard Deviation 12509.63943
Sample Variance 156491078.6
Skewness 9.45042789
Range 369537
Minimum 0
Maximum 369537
Sum 64004005
Count 14708
Bins Frequency Cumulative %
500 3865 26.28%
1000 2547 43.60%
1500 1603 54.49%
2000 1174 62.48%
2500 848 68.24%
3000 679 72.86%
3500 472 76.07%
4000 385 78.69%
4500 329 80.92%
5000 247 82.60%
6000 444 85.62%
7000 345 87.97%
8000 231 89.54%
9000 203 90.92%
10000 123 91.75%
25000 726 96.69%
50000 295 98.69%
75000 101 99.38%
100000 34 99.61%
400000 57 100.00%
More 0 100.00%

TOTAL MINUTES DELAYED FOR ARRIVALS
0.00%
10.00%
20.00%
30.00%
40.00%
50.00%
60.00%
70.00%
80.00%
90.00%
100.00%
0
500
1000
1500
2000
2500
3000
3500
4000
4500
Fre
qu
en
cy
Bins
Total Minutes Delayed by Arrivals
Frequency
Cumulative %

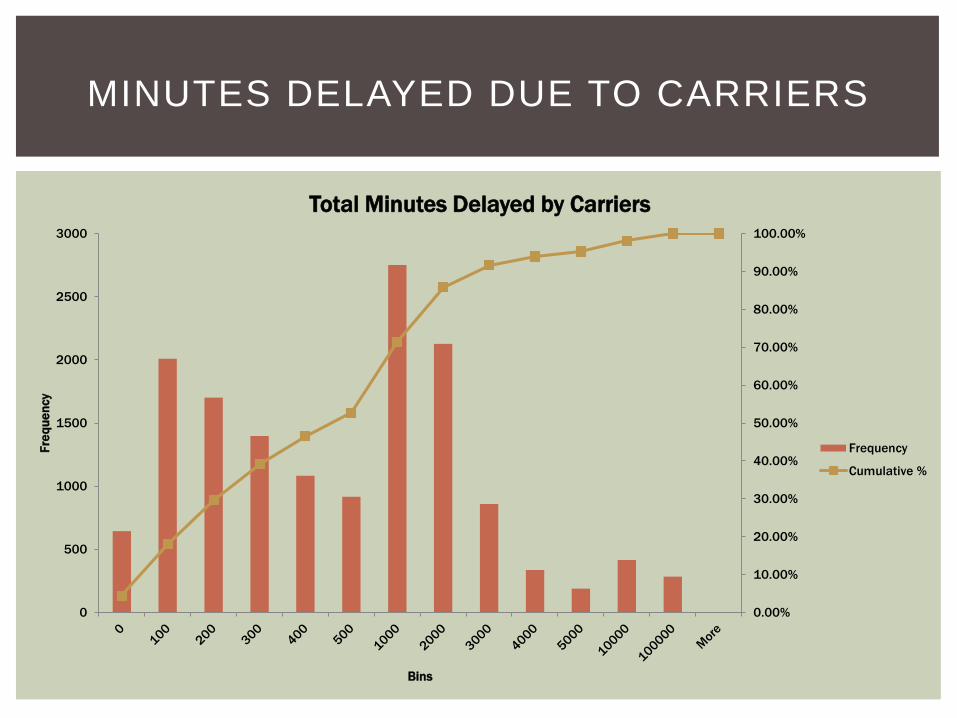
MINUTES DELAYED DUE TO CARRIERS
Summary Statistics Histogram Data
Carrier Delay
Mean 1274.532499
Standard Error 27.24166249
Median 455.5
Mode 0
Standard Deviation 3303.774666
Sample Variance 10914927.04
Skewness 11.07371632
Range 106746
Minimum 0
Maximum 106746
Sum 18745824
Count 14708
Bins Frequency Cumulative %
0 644 4.38%
100 2009 18.04%
200 1701 29.60%
300 1397 39.10%
400 1083 46.46%
500 915 52.69%
1000 2751 71.39%
2000 2126 85.84%
3000 859 91.68%
4000 335 93.96%
5000 189 95.25%
10000 415 98.07%
100000 283 99.99%
More 1 100.00%
MINUTES DELAYED DUE TO CARRIERS
0.00%
10.00%
20.00%
30.00%
40.00%
50.00%
60.00%
70.00%
80.00%
90.00%
100.00%
0
500
1000
1500
2000
2500
3000
Fre
qu
en
cy
Bins
Total Minutes Delayed by Carriers
Frequency
Cumulative %

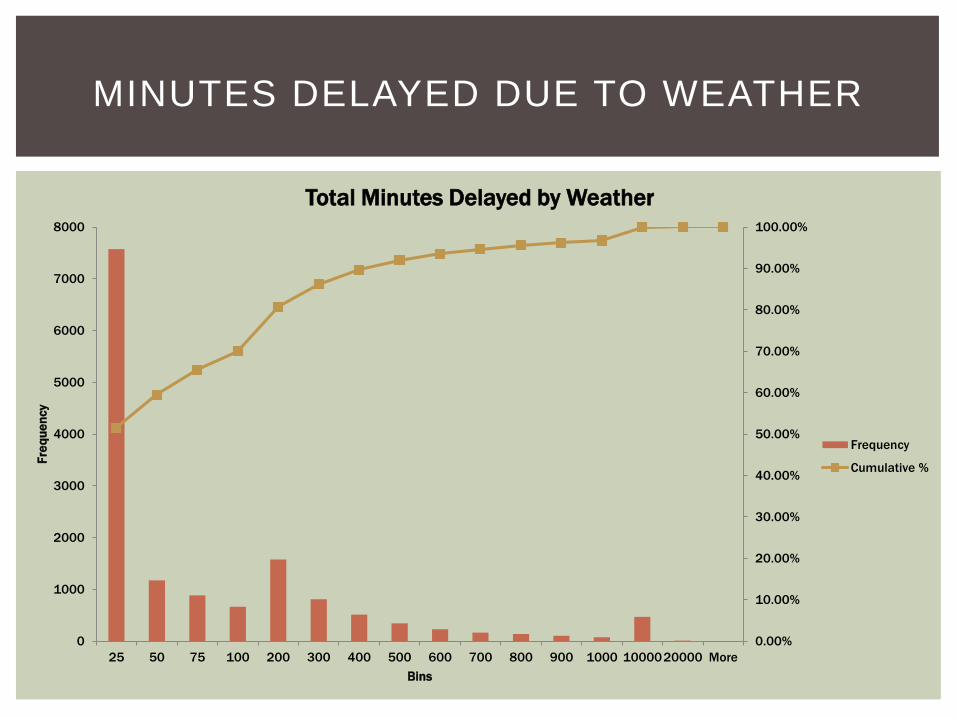
MINUTES DELAYED DUE TO WEATHER
Summary Statistics Histogram Data
Weather Delay
Mean 175.7867147
Standard Error 5.031176426
Median 22
Mode 0
Standard Deviation 610.1636866
Sample Variance 372299.7245
Skewness 12.39887612
Range 16771
Minimum 0
Maximum 16771
Sum 2585471
Count 14708
Bins Frequency Cumulative %
25 7574 51.50%
50 1172 59.46%
75 883 65.47%
100 662 69.97%
200 1576 80.68%
300 808 86.18%
400 512 89.66%
500 341 91.98%
600 227 93.52%
700 163 94.63%
800 136 95.55%
900 102 96.25%
1000 74 96.75%
10000 468 99.93%
20000 10 100.00%
More 0 100.00%
MINUTES DELAYED DUE TO WEATHER
0.00%
10.00%
20.00%
30.00%
40.00%
50.00%
60.00%
70.00%
80.00%
90.00%
100.00%
0
1000
2000
3000
4000
5000
6000
7000
8000
25 50 75 100 200 300 400 500 600 700 800 900 1000 1000020000 More
Fre
qu
en
cy
Bins
Total Minutes Delayed by Weather
Frequency
Cumulative %

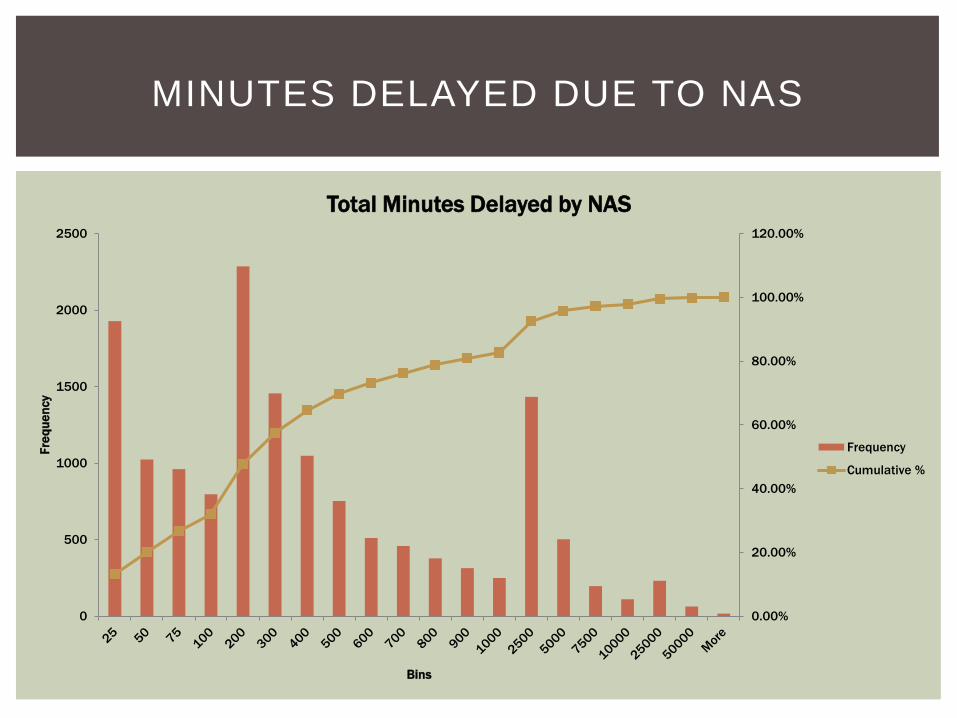
MINUTES DELAYED DUE TO NAS
Summary Statistics Histogram Data
NAS Delay
Mean 1069.657125
Standard Error 31.98706205
Median 222
Mode 0
Standard Deviation 3879.280322
Sample Variance 15048815.81
Skewness 11.42397302
Range 137443
Minimum 0
Maximum 137443
Sum 15732517
Count 14708
Bins Frequency Cumulative %
25 1928 13.11%
50 1024 20.07%
75 960 26.60%
100 796 32.01%
200 2286 47.55%
300 1456 57.45%
400 1048 64.58%
500 752 69.69%
600 511 73.16%
700 458 76.28%
800 377 78.84%
900 313 80.97%
1000 249 82.66%
2500 1433 92.41%
5000 502 95.82%
7500 195 97.14%
10000 110 97.89%
25000 231 99.46%
50000 63 99.89%
More 16 100.00%
MINUTES DELAYED DUE TO NAS
0.00%
20.00%
40.00%
60.00%
80.00%
100.00%
120.00%
0
500
1000
1500
2000
2500
Fre
qu
en
cy
Bins
Total Minutes Delayed by NAS
Frequency
Cumulative %

MINUTES DELAYED DUE TO SECURITY
Summary Statistics Histogram Data
Security Delay
Mean 6.448667392
Standard Error 0.29263602
Median 0
Mode 0
Standard Deviation 35.48988504
Sample Variance 1259.53194
Skewness 15.0786857
Range 1482
Minimum 0
Maximum 1482
Sum 94847
Count 14708
Bins Frequency Cumulative %
0 12909 87.77%
0.5 0 87.77%
1 27 87.95%
1.5 0 87.95%
2 41 88.23%
4 61 88.65%
6 66 89.09%
8 81 89.65%
10 72 90.13%
20 401 92.86%
30 294 94.86%
40 145 95.85%
50 133 96.75%
100 230 98.31%
10000 248 100.00%
More 0 100.00%

MINUTES DELAYED DUE TO SECURITY
80.00%
82.00%
84.00%
86.00%
88.00%
90.00%
92.00%
94.00%
96.00%
98.00%
100.00%
0
2000
4000
6000
8000
10000
12000
14000
0 0.5 1 1.5 2 4 6 8 10 20 30 40 50 100 10000 More
Fre
qu
en
cy
Bins
Total Minutes Delayed by Security
Frequency
Cumulative %

MINUTES DELAYED DUE TO LATE
AIRCRAFTS
Summary Statistics Histogram Data
Late_Aircraft Delay
Mean 1825.220696
Standard Error 45.69513595
Median 445
Mode 0
Standard Deviation 5541.748142
Sample Variance 30710972.47
Skewness 8.64330444
Range 127300
Minimum 0
Maximum 127300
Sum 26845346
Count 14708
Bins Frequency Cumulative %
25 1834 12.47%
50 567 16.32%
75 469 19.51%
100 462 22.65%
200 1528 33.04%
300 1151 40.87%
400 964 47.42%
500 764 52.62%
600 700 57.38%
700 546 61.09%
800 456 64.19%
900 444 67.21%
1000 365 69.69%
1500 1213 77.94%
2500 1151 85.76%
5000 1062 92.98%
7500 313 95.11%
10000 184 96.36%
100000 530 99.97%
More 5 100.00%

MINUTES DELAYED DUE TO LATE
AIRCRAFTS
0.00%
10.00%
20.00%
30.00%
40.00%
50.00%
60.00%
70.00%
80.00%
90.00%
100.00%
0
200
400
600
800
1000
1200
1400
1600
1800
2000
Fre
qu
en
cy
Bins
Total Minuted Delayed by Late Aircraft
Frequency
Cumulative %

PERCENT OF FLIGHTS DELAYED
Summary Statistics Histogram Data
% of arrivals Delayed
Mean 20%
Standard Error 0%
Median 19%
Mode 0%
Standard Deviation 11%
Sample Variance 0.01
Skewness 1.41
Range 100%
Minimum 0%
Maximum 100%
Sum 295502%
Count 1470800%
Bin Frequency Cumulative %
0.1 2313 15.73%
0.2 5837 55.41%
0.3 4272 84.46%
0.4 1729 96.21%
0.5 407 98.98%
0.6 86 99.56%
0.7 24 99.73%
0.8 6 99.77%
0.9 3 99.79%
1 31 100.00%
More 0 100.00%

PERCENT OF FLIGHTS DELAYED
0.00%
10.00%
20.00%
30.00%
40.00%
50.00%
60.00%
70.00%
80.00%
90.00%
100.00%
0
1000
2000
3000
4000
5000
6000
7000
0.1 0.2 0.3 0.4 0.5 0.6 0.7 0.8 0.9 1 More
Fre
qu
en
cy
Bin
Percent of Total Flights that are Delayed
Frequency
Cumulative %
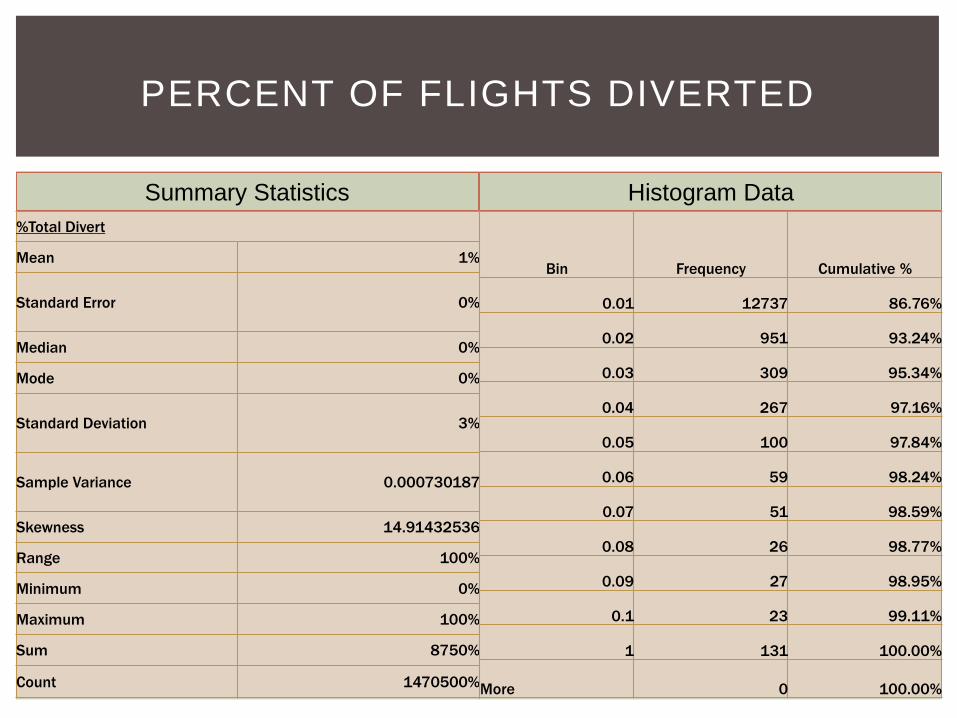
PERCENT OF FLIGHTS DIVERTED
Summary Statistics Histogram Data
%Total Divert
Mean 1%
Standard Error 0%
Median 0%
Mode 0%
Standard Deviation 3%
Sample Variance 0.000730187
Skewness 14.91432536
Range 100%
Minimum 0%
Maximum 100%
Sum 8750%
Count 1470500%
Bin Frequency Cumulative %
0.01 12737 86.76%
0.02 951 93.24%
0.03 309 95.34%
0.04 267 97.16%
0.05 100 97.84%
0.06 59 98.24%
0.07 51 98.59%
0.08 26 98.77%
0.09 27 98.95%
0.1 23 99.11%
1 131 100.00%
More 0 100.00%

PERCENT OF FLIGHTS DIVERTED
80.00%
82.00%
84.00%
86.00%
88.00%
90.00%
92.00%
94.00%
96.00%
98.00%
100.00%
0
2000
4000
6000
8000
10000
12000
14000
0.01 0.02 0.03 0.04 0.05 0.06 0.07 0.08 0.09 0.1 1 More
Fre
qu
en
cy
Bin
Percent of Total Flights that are Diverted
Frequency
Cumulative %
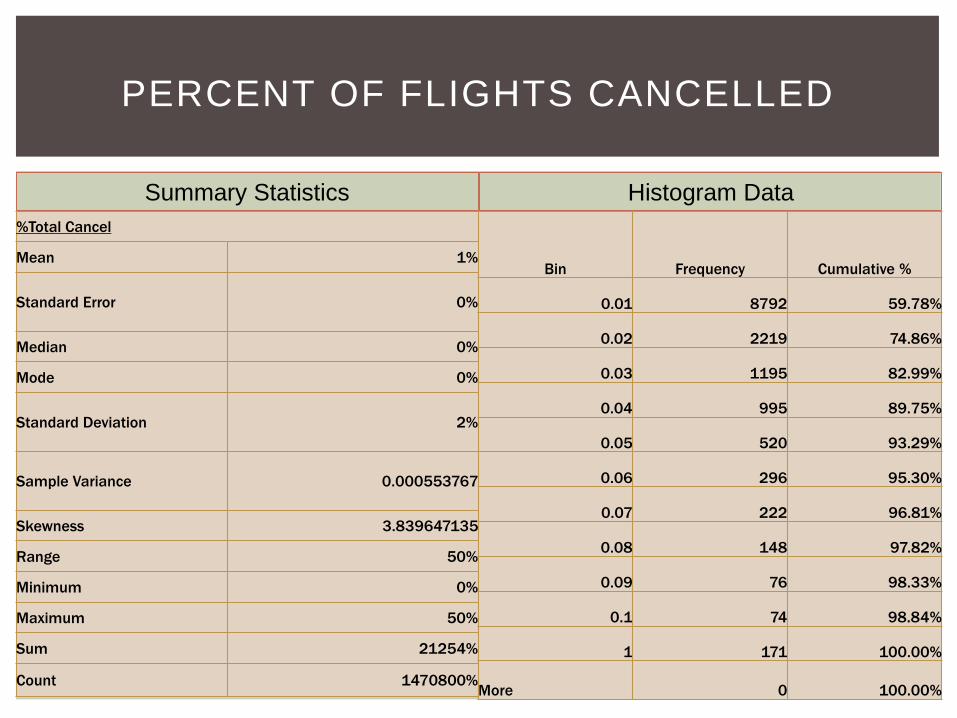
PERCENT OF FLIGHTS CANCELLED
Summary Statistics Histogram Data
%Total Cancel
Mean 1%
Standard Error 0%
Median 0%
Mode 0%
Standard Deviation 2%
Sample Variance 0.000553767
Skewness 3.839647135
Range 50%
Minimum 0%
Maximum 50%
Sum 21254%
Count 1470800%
Bin Frequency Cumulative %
0.01 8792 59.78%
0.02 2219 74.86%
0.03 1195 82.99%
0.04 995 89.75%
0.05 520 93.29%
0.06 296 95.30%
0.07 222 96.81%
0.08 148 97.82%
0.09 76 98.33%
0.1 74 98.84%
1 171 100.00%
More 0 100.00%

PERCENT OF FLIGHTS CANCELLED
0.00%
10.00%
20.00%
30.00%
40.00%
50.00%
60.00%
70.00%
80.00%
90.00%
100.00%
0
1000
2000
3000
4000
5000
6000
7000
8000
9000
10000
0.01 0.02 0.03 0.04 0.05 0.06 0.07 0.08 0.09 0.1 1 More
Fre
qu
en
cy
Bin
Percent of Total Flights that are Cancelled
Frequency
Cumulative %
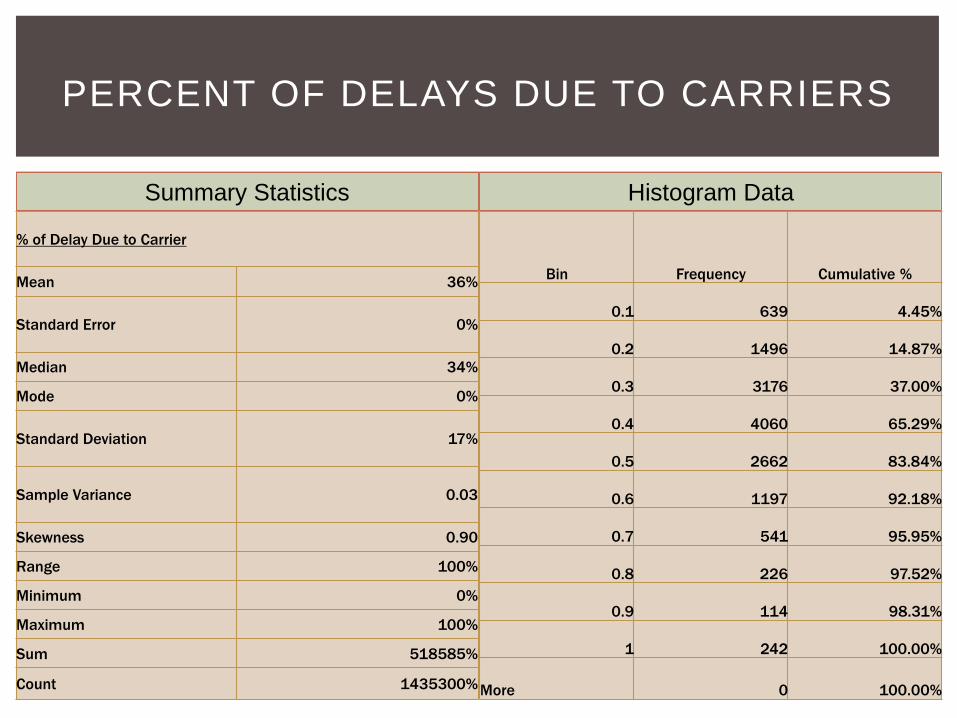
PERCENT OF DELAYS DUE TO CARRIERS
Summary Statistics Histogram Data
% of Delay Due to Carrier
Mean 36%
Standard Error 0%
Median 34%
Mode 0%
Standard Deviation 17%
Sample Variance 0.03
Skewness 0.90
Range 100%
Minimum 0%
Maximum 100%
Sum 518585%
Count 1435300%
Bin Frequency Cumulative %
0.1 639 4.45%
0.2 1496 14.87%
0.3 3176 37.00%
0.4 4060 65.29%
0.5 2662 83.84%
0.6 1197 92.18%
0.7 541 95.95%
0.8 226 97.52%
0.9 114 98.31%
1 242 100.00%
More 0 100.00%

PERCENT OF DELAYS DUE TO CARRIERS
0.00%
10.00%
20.00%
30.00%
40.00%
50.00%
60.00%
70.00%
80.00%
90.00%
100.00%
0
500
1000
1500
2000
2500
3000
3500
4000
4500
0.1 0.2 0.3 0.4 0.5 0.6 0.7 0.8 0.9 1 More
Fre
qu
en
cy
Bin
Percent of Delays Caused by Carriers
Frequency
Cumulative %

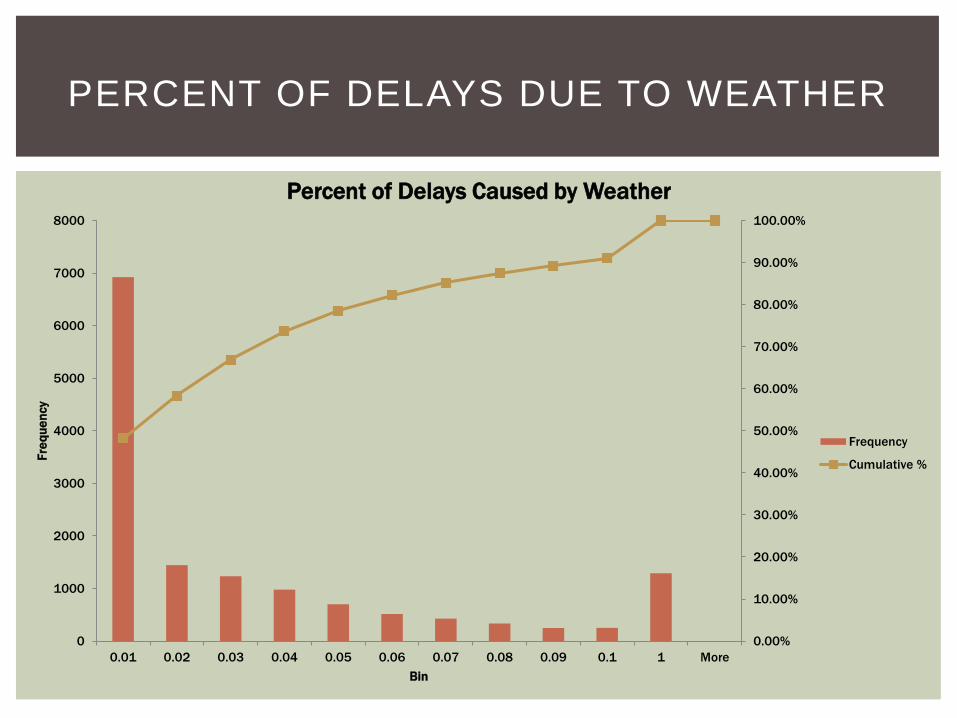
PERCENT OF DELAYS DUE TO WEATHER
Summary Statistics Histogram Data
% Delays Due To Weather
Mean 3%
Standard Error 0%
Median 1%
Mode 0%
Standard Deviation 6%
Sample Variance 0.00
Skewness 4.81
Range 100%
Minimum 0%
Maximum 100%
Sum 48431%
Count 1435300%
Bin Frequency Cumulative %
0.01 6924 48.24%
0.02 1447 58.32%
0.03 1233 66.91%
0.04 978 73.73%
0.05 701 78.61%
0.06 517 82.21%
0.07 429 85.20%
0.08 335 87.54%
0.09 248 89.26%
0.1 251 91.01%
1 1290 100.00%
More 0 100.00%
PERCENT OF DELAYS DUE TO WEATHER
0.00%
10.00%
20.00%
30.00%
40.00%
50.00%
60.00%
70.00%
80.00%
90.00%
100.00%
0
1000
2000
3000
4000
5000
6000
7000
8000
0.01 0.02 0.03 0.04 0.05 0.06 0.07 0.08 0.09 0.1 1 More
Fre
qu
en
cy
Bin
Percent of Delays Caused by Weather
Frequency
Cumulative %
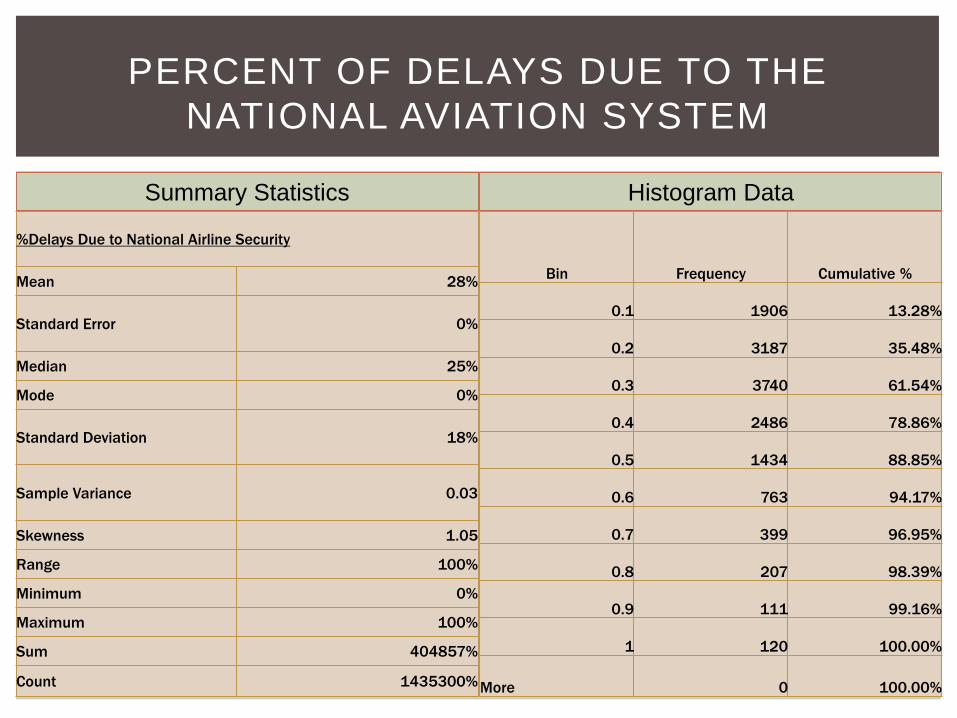
PERCENT OF DELAYS DUE TO THE
NATIONAL AVIATION SYSTEM
Summary Statistics Histogram Data
%Delays Due to National Airline Security
Mean 28%
Standard Error 0%
Median 25%
Mode 0%
Standard Deviation 18%
Sample Variance 0.03
Skewness 1.05
Range 100%
Minimum 0%
Maximum 100%
Sum 404857%
Count 1435300%
Bin Frequency Cumulative %
0.1 1906 13.28%
0.2 3187 35.48%
0.3 3740 61.54%
0.4 2486 78.86%
0.5 1434 88.85%
0.6 763 94.17%
0.7 399 96.95%
0.8 207 98.39%
0.9 111 99.16%
1 120 100.00%
More 0 100.00%

PERCENT OF DELAYS DUE TO THE
NATIONAL AVIATION SYSTEM
0.00%
10.00%
20.00%
30.00%
40.00%
50.00%
60.00%
70.00%
80.00%
90.00%
100.00%
0
500
1000
1500
2000
2500
3000
3500
4000
0.1 0.2 0.3 0.4 0.5 0.6 0.7 0.8 0.9 1 More
Fre
qu
en
cy
Bin
Percent of Delays Caused by the National Aviation System
Frequency
Cumulative %

PERCENT OF DELAYS DUE TO SECURITY
Summary Statistics Histogram Data
%Delays Due To Security
Mean 0%
Standard Error 0%
Median 0%
Mode 0%
Standard Deviation 2%
Sample Variance 0.000358375
Skewness 28.26042357
Range 100%
Minimum 0%
Maximum 100%
Sum 3373%
Count 1435300%
Bin Frequency Cumulative %
0.01 13735 95.69%
0.02 248 97.42%
0.03 109 98.18%
0.04 76 98.71%
0.05 32 98.93%
0.06 32 99.16%
0.07 17 99.28%
0.08 20 99.41%
0.09 13 99.51%
0.1 15 99.61%
1 56 100.00%
More 0 100.00%

PERCENT OF DELAYS DUE TO SECURITY
93.00%
94.00%
95.00%
96.00%
97.00%
98.00%
99.00%
100.00%
0
2000
4000
6000
8000
10000
12000
14000
16000
0.01 0.02 0.03 0.04 0.05 0.06 0.07 0.08 0.09 0.1 1 More
Fre
qu
en
cy
Bin
Percent of Delays Caused by Security
Frequency
Cumulative %
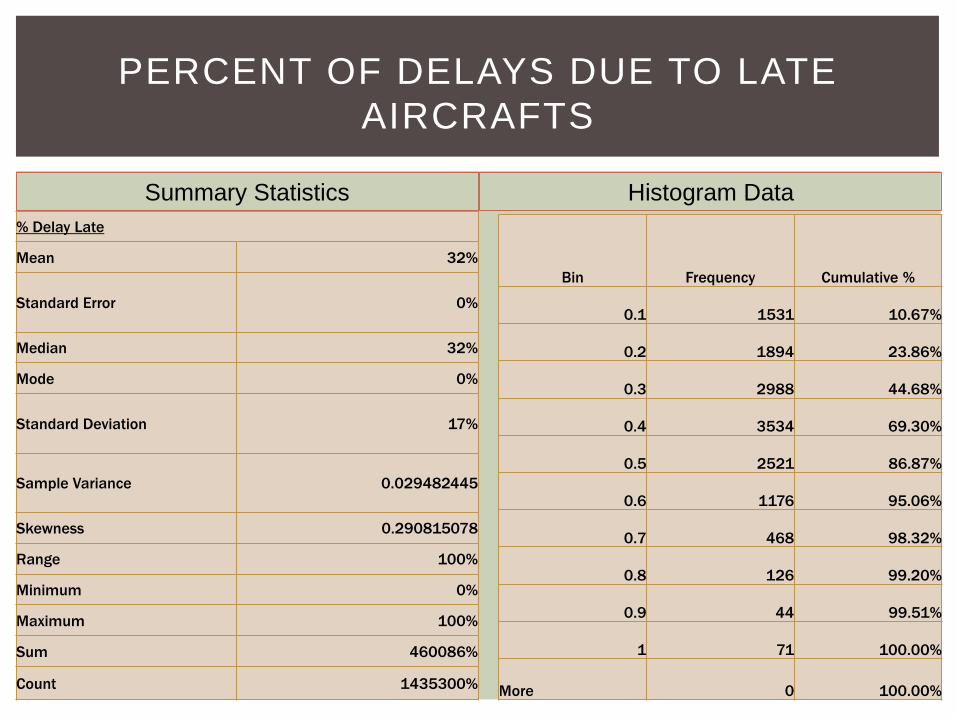
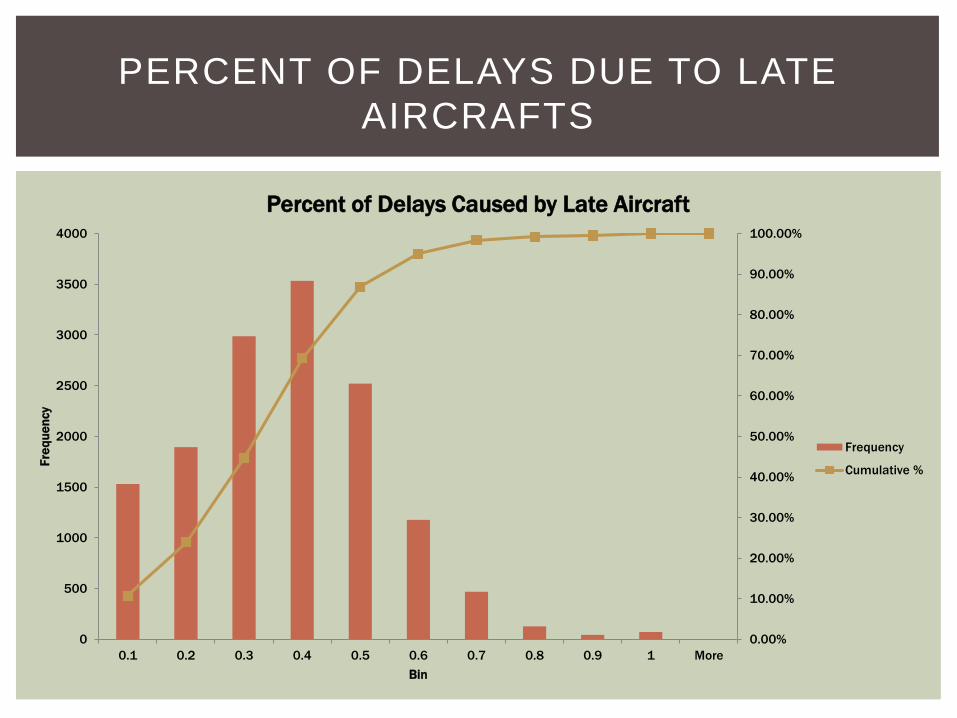
PERCENT OF DELAYS DUE TO LATE
AIRCRAFTS
Summary Statistics Histogram Data
% Delay Late
Mean 32%
Standard Error 0%
Median 32%
Mode 0%
Standard Deviation 17%
Sample Variance 0.029482445
Skewness 0.290815078
Range 100%
Minimum 0%
Maximum 100%
Sum 460086%
Count 1435300%
Bin Frequency Cumulative %
0.1 1531 10.67%
0.2 1894 23.86%
0.3 2988 44.68%
0.4 3534 69.30%
0.5 2521 86.87%
0.6 1176 95.06%
0.7 468 98.32%
0.8 126 99.20%
0.9 44 99.51%
1 71 100.00%
More 0 100.00%
PERCENT OF DELAYS DUE TO LATE
AIRCRAFTS
0.00%
10.00%
20.00%
30.00%
40.00%
50.00%
60.00%
70.00%
80.00%
90.00%
100.00%
0
500
1000
1500
2000
2500
3000
3500
4000
0.1 0.2 0.3 0.4 0.5 0.6 0.7 0.8 0.9 1 More
Fre
qu
en
cy
Bin
Percent of Delays Caused by Late Aircraft
Frequency
Cumulative %

PERCENT OF DELAY TIME DUE TO
CARRIERS
Summary Statistics Histogram Data
%Time Carrier
Mean 37%
Standard Error 0%
Median 35%
Mode 0%
Standard Deviation 20%
Sample Variance 0.038341367
Skewness 0.770654734
Range 100%
Minimum 0%
Maximum 100%
Sum 534127%
Count 1435300%
Bin Frequency Cumulative %
0.1 860 5.99%
0.2 1578 16.99%
0.3 2975 37.71%
0.4 3465 61.85%
0.5 2426 78.76%
0.6 1370 88.30%
0.7 762 93.61%
0.8 369 96.18%
0.9 249 97.92%
1 299 100.00%
More 0 100.00%

PERCENT OF DELAY TIME DUE TO
CARRIERS
0.00%
10.00%
20.00%
30.00%
40.00%
50.00%
60.00%
70.00%
80.00%
90.00%
100.00%
0
500
1000
1500
2000
2500
3000
3500
4000
0.1 0.2 0.3 0.4 0.5 0.6 0.7 0.8 0.9 1 More
Fre
qu
en
cy
Bin
Percent of Minutes Delayed by Carriers
Frequency
Cumulative %
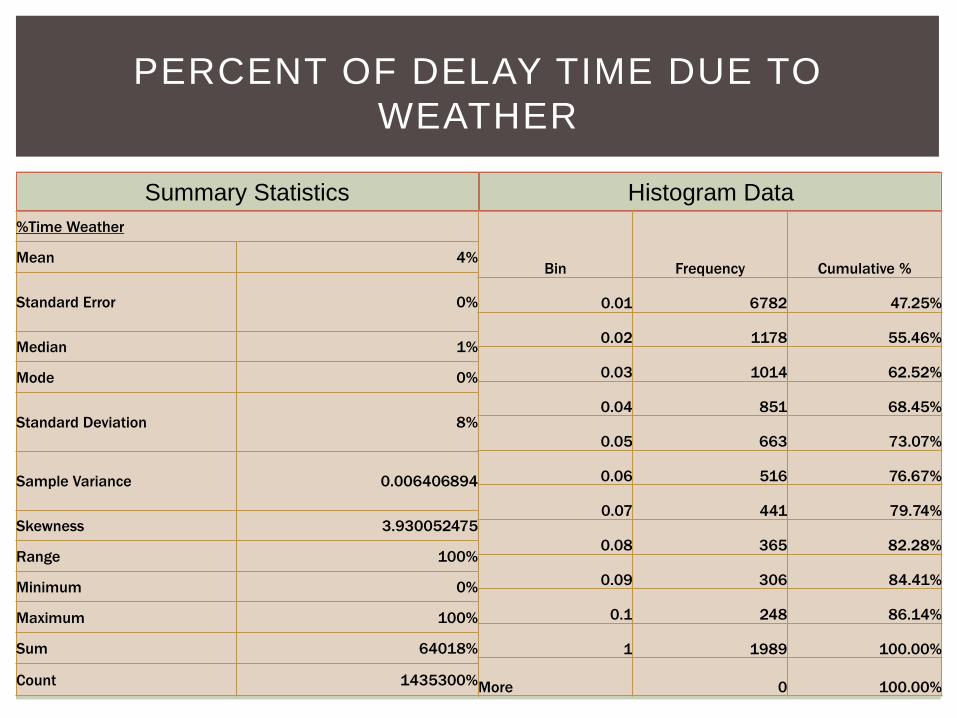
PERCENT OF DELAY TIME DUE TO
WEATHER
Summary Statistics Histogram Data
%Time Weather
Mean 4%
Standard Error 0%
Median 1%
Mode 0%
Standard Deviation 8%
Sample Variance 0.006406894
Skewness 3.930052475
Range 100%
Minimum 0%
Maximum 100%
Sum 64018%
Count 1435300%
Bin Frequency Cumulative %
0.01 6782 47.25%
0.02 1178 55.46%
0.03 1014 62.52%
0.04 851 68.45%
0.05 663 73.07%
0.06 516 76.67%
0.07 441 79.74%
0.08 365 82.28%
0.09 306 84.41%
0.1 248 86.14%
1 1989 100.00%
More 0 100.00%

PERCENT OF DELAY TIME DUE TO
WEATHER
0.00%
10.00%
20.00%
30.00%
40.00%
50.00%
60.00%
70.00%
80.00%
90.00%
100.00%
0
1000
2000
3000
4000
5000
6000
7000
8000
0.01 0.02 0.03 0.04 0.05 0.06 0.07 0.08 0.09 0.1 1 More
Fre
qu
en
cy
Bin
Percent of Minutes Delayed Weather
Frequency
Cumulative %

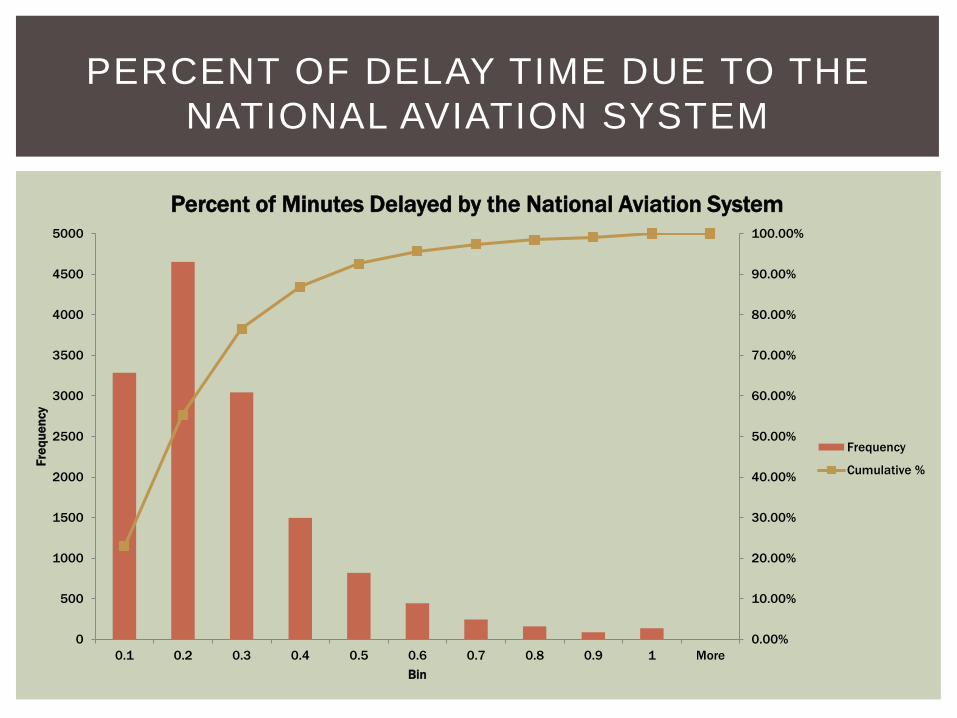
PERCENT OF DELAY TIME DUE TO THE
NATIONAL AVIATION SYSTEM
Summary Statistics Histogram Data
Bin Frequency Cumulative %
0.1 3284 22.88%
0.2 4651 55.28%
0.3 3042 76.48%
0.4 1496 86.90%
0.5 817 92.59%
0.6 444 95.69%
0.7 242 97.37%
0.8 158 98.47%
0.9 85 99.07%
1 134 100.00%
More 0 100.00%
%Time NAS
Mean 22%
Standard Error 0%
Median 18%
Mode 0%
Standard Deviation 18%
Sample Variance 0.030664586
Skewness 1.658969918
Range 100%
Minimum 0%
Maximum 100%
Sum 320851%
Count 1435300%
PERCENT OF DELAY TIME DUE TO THE
NATIONAL AVIATION SYSTEM
0.00%
10.00%
20.00%
30.00%
40.00%
50.00%
60.00%
70.00%
80.00%
90.00%
100.00%
0
500
1000
1500
2000
2500
3000
3500
4000
4500
5000
0.1 0.2 0.3 0.4 0.5 0.6 0.7 0.8 0.9 1 More
Fre
qu
en
cy
Bin
Percent of Minutes Delayed by the National Aviation System
Frequency
Cumulative %

PERCENT OF DELAY TIME DUE TO
SECURITY
Summary Statistics Histogram Data
%Time Security
Mean 0%
Standard Error 0%
Median 0%
Mode 0%
Standard Deviation 2%
Sample Variance 0.000486315
Skewness 24.59182084
Range 100%
Minimum 0%
Maximum 100%
Sum 3386%
Count 1435300%
Bin Frequency Cumulative %
0.01 13835 96.39%
0.02 202 97.80%
0.03 85 98.39%
0.04 53 98.76%
0.05 33 98.99%
0.06 28 99.18%
0.07 19 99.32%
0.08 10 99.39%
0.09 13 99.48%
0.1 9 99.54%
1 66 100.00%
More 0 100.00%

PERCENT OF DELAY TIME DUE TO
SECURITY
94.00%
95.00%
96.00%
97.00%
98.00%
99.00%
100.00%
0
2000
4000
6000
8000
10000
12000
14000
16000
0.01 0.02 0.03 0.04 0.05 0.06 0.07 0.08 0.09 0.1 1 More
Fre
qu
en
cy
Bin
Percent of Minutes Delayed by Security
Frequency
Cumulative %

PERCENT OF DELAY TIME DUE TO LATE
AIRCRAFTS
Summary Statistics Histogram Data
%Time Late
Mean 36%
Standard Error 0%
Median 36%
Mode 0%
Standard Deviation 19%
Sample Variance 0.037344155
Skewness 0.113840621
Range 100%
Minimum 0%
Maximum 100%
Sum 512919%
Count 1435300%
Bin Frequency Cumulative %
0.1 1611 11.22%
0.2 1438 21.24%
0.3 2258 36.97%
0.4 3004 57.90%
0.5 2795 77.38%
0.6 1862 90.35%
0.7 864 96.37%
0.8 324 98.63%
0.9 109 99.39%
1 88 100.00%
More 0 100.00%

PERCENT OF DELAY TIME DUE TO LATE
AIRCRAFTS
0.00%
10.00%
20.00%
30.00%
40.00%
50.00%
60.00%
70.00%
80.00%
90.00%
100.00%
0
500
1000
1500
2000
2500
3000
3500
0.1 0.2 0.3 0.4 0.5 0.6 0.7 0.8 0.9 1 More
Fre
qu
en
cy
Bin
Percent of Minutes Delayed by Late Aircraft
Frequency
Cumulative %

ADDITIONAL DATA
Mean 397.9292222
76.4478819
6 21.19381493 2.168992385
23.4371369
3 0.139990481 29.50291814 5.525224368 0.884144683 4351.645703 1274.532499 175.7867147 1069.657125
Median 125 24 8.71 0.48 6 0 7.47 1 0 1277 455.5 22 222
Mode 31 6 0 0 0 0 0 0 0 0 0 0 0
Q1 60 10 3.31 0 2.07 0 2.32 0 0 472 159 0 70
Q3 294 61 20.76 1.88 15.99 0 20.55 4 1 3303 1168 139 657.25
Skewed? 7.588277263
7.79899262
8 6.889807062 11.59905053
9.47074873
4 7.479995736 7.657446284 11.5532291 15.67436129 9.45042789 11.07371632 12.39887612 11.42397302
Min 1 0 0 0 0 0 0 0 0 0 0 0 0
Max 18777 5268 1117.2 210.73 2401.79 11.23 1699.38 640 151 369537 106746 16771 137443
Range 18776 5268 1117.2 210.73 2401.79 11.23 1699.38 640 151 369537 106746 16771 137443
Standard
Dev 1037.641367
197.373909
1 43.16455251 6.519207796
71.8381201
1 0.56625481 86.53425217 20.28170351 3.670032147 12509.63943 3303.774666 610.1636866 3879.280322
CV 2.607602834
2.58181003
9 2.03665799 3.005638858
3.06514060
7 4.044952228 2.933074341 3.670747495 4.150940696 2.874691618 2.592146271 3.471045509 3.626657767
Max z 7048.263079
2010.81878
2 538.1395358 69.38990925
775.935974
4 2.741691099 569.3265454 172.8462054 36.16429776 127034.6189 40688.85644 4781.04169 37603.03608
Min z -0.38253026
-
0.38732516
5
-
0.491000455 -0.332707969
-
0.32624930
7 -0.247221708 -0.340939193 -0.272424077 -0.240909248 -0.3478634 -0.385780699 -0.288097634
-
0.275735971
Minus 2s -1677.353513
-
318.299936
3
-
65.13529009 -10.86942321
-
120.239103
3 -0.992519138 -143.5655862 -35.03818265 -6.45591961 -20667.63315 -5333.016832 -1044.540659
-
6688.903518
Plus 2s 2473.211957
471.195700
2 107.52292 15.20740798
167.113377
2 1.2725001 202.5714225 46.08863139 8.224208977 29370.92456 7882.081831 1396.114088 8828.217769
Minus 3s -2714.99488
-
515.673845
4
-
108.2998426 -17.388631
-
192.077223
4 -1.558773947 -230.0998384 -55.31988616 -10.12595176 -33177.27258 -8636.791498 -1654.704345
-
10568.18384
Plus 3s 3510.853325
668.569609
3 150.6874725 21.72661577
238.951497
3 1.83875491 289.1056747 66.37033489 11.89424112 41880.56399 11185.8565 2006.277775 12707.49809
Arrival
flights
Arrival
del15
Carrier
ct
Weather
ct
NAS
ct
Security
ct
Late
aircraft ct
Arrivals
cancelled
Arrivals
diverted
Arrival
delay
carrier
delay
Weather
delay
NAS
delay
Security
delay
Late aircraft
delay
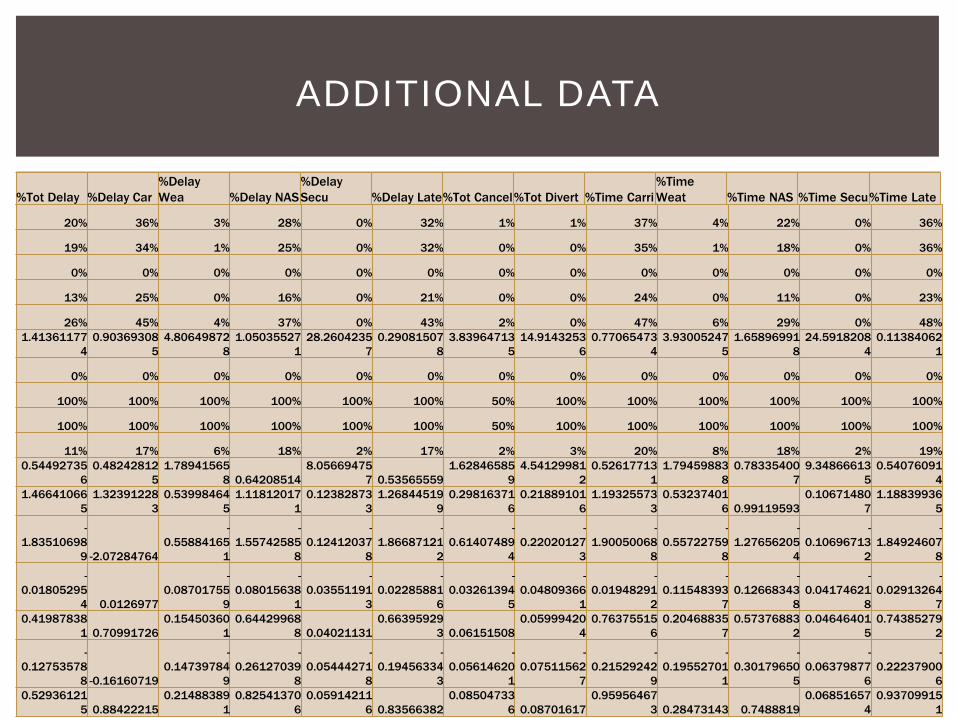
ADDITIONAL DATA
%Tot Delay %Delay Car
%Delay
Wea %Delay NAS
%Delay
Secu %Delay Late%Tot Cancel%Tot Divert %Time Carri
%Time
Weat %Time NAS %Time Secu%Time Late
20% 36% 3% 28% 0% 32% 1% 1% 37% 4% 22% 0% 36%
19% 34% 1% 25% 0% 32% 0% 0% 35% 1% 18% 0% 36%
0% 0% 0% 0% 0% 0% 0% 0% 0% 0% 0% 0% 0%
13% 25% 0% 16% 0% 21% 0% 0% 24% 0% 11% 0% 23%
26% 45% 4% 37% 0% 43% 2% 0% 47% 6% 29% 0% 48%
1.41361177
4
0.90369308
5
4.80649872
8
1.05035527
1
28.2604235
7
0.29081507
8
3.83964713
5
14.9143253
6
0.77065473
4
3.93005247
5
1.65896991
8
24.5918208
4
0.11384062
1
0% 0% 0% 0% 0% 0% 0% 0% 0% 0% 0% 0% 0%
100% 100% 100% 100% 100% 100% 50% 100% 100% 100% 100% 100% 100%
100% 100% 100% 100% 100% 100% 50% 100% 100% 100% 100% 100% 100%
11% 17% 6% 18% 2% 17% 2% 3% 20% 8% 18% 2% 19%
0.54492735
6
0.48242812
5
1.78941565
8 0.64208514
8.05669475
7 0.53565559
1.62846585
9
4.54129981
2
0.52617713
1
1.79459883
8
0.78335400
7
9.34866613
5
0.54076091
4
1.46641066
5
1.32391228
3
0.53998464
5
1.11812017
1
0.12382873
3
1.26844519
9
0.29816371
6
0.21889101
6
1.19325573
3
0.53237401
6 0.99119593
0.10671480
7
1.18839936
5
-
1.83510698
9 -2.07284764
-
0.55884165
1
-
1.55742585
8
-
0.12412037
8
-
1.86687121
2
-
0.61407489
4
-
0.22020127
3
-
1.90050068
8
-
0.55722759
8
-
1.27656205
4
-
0.10696713
2
-
1.84924607
8
-
0.01805295
4 0.0126977
-
0.08701755
9
-
0.08015638
1
-
0.03551191
3
-
0.02285881
6
-
0.03261394
5
-
0.04809366
1
-
0.01948291
2
-
0.11548393
7
-
0.12668343
8
-
0.04174621
8
-
0.02913264
7
0.41987838
1 0.70991726
0.15450360
1
0.64429968
8 0.04021131
0.66395929
3 0.06151508
0.05999420
4
0.76375515
6
0.20468835
7
0.57376883
2
0.04646401
5
0.74385279
2
-
0.12753578
8 -0.16160719
-
0.14739784
9
-
0.26127039
8
-
0.05444271
8
-
0.19456334
3
-
0.05614620
1
-
0.07511562
7
-
0.21529242
9
-
0.19552701
1
-
0.30179650
5
-
0.06379877
6
-
0.22237900
6
0.52936121
5 0.88422215
0.21488389
1
0.82541370
6
0.05914211
6 0.83566382
0.08504733
6 0.08701617
0.95956467
3 0.28473143 0.7488819
0.06851657
4
0.93709915
1