GAO-06-630 Airline Deregulation: Reregulating the Airline Industry

The US Airline Industry & Herbert Stein’s Law William S. Swelbar MIT International Center for Air Transportation 36th Annual FAA Aviation Forecast Conference February 16, 2011 www.swelblog.com
HERBERT STEIN’S LAW
Herbert Stein (1916-1999) was chairman of the Council of Economic Advisers under Presidents Nixon and Ford
If something
cannot go on forever,
it will stop

US Airline Industry: The Last Three Decades
Barriers to entry for new and existing carriers were removed
– If one had a dollar, an airplane and a certificate: an airline was born
– Entry and growth of Low Cost Carriers a major driver of change
Barriers to exit for inefficient carriers were erected
– Bankruptcy, government, labor as an internal source of capital
– Inefficient providers remained in the market
Finally in the 2000’s, cost reductions and efficiency improvements that were expected during the previous two decades began to happen
A market share mentality created an industry grew too big to be sustainable
The market share mentality giving way to a profit mentality?


LOOKING BACK

With Rare Exception, Capacity Growth Exceeded the Growth in Real GDP
-8%
-6%
-4%
-2%
0%
2%
4%
6%
8%
10%
12%
Real GDP Percent Change ASM Percent Change
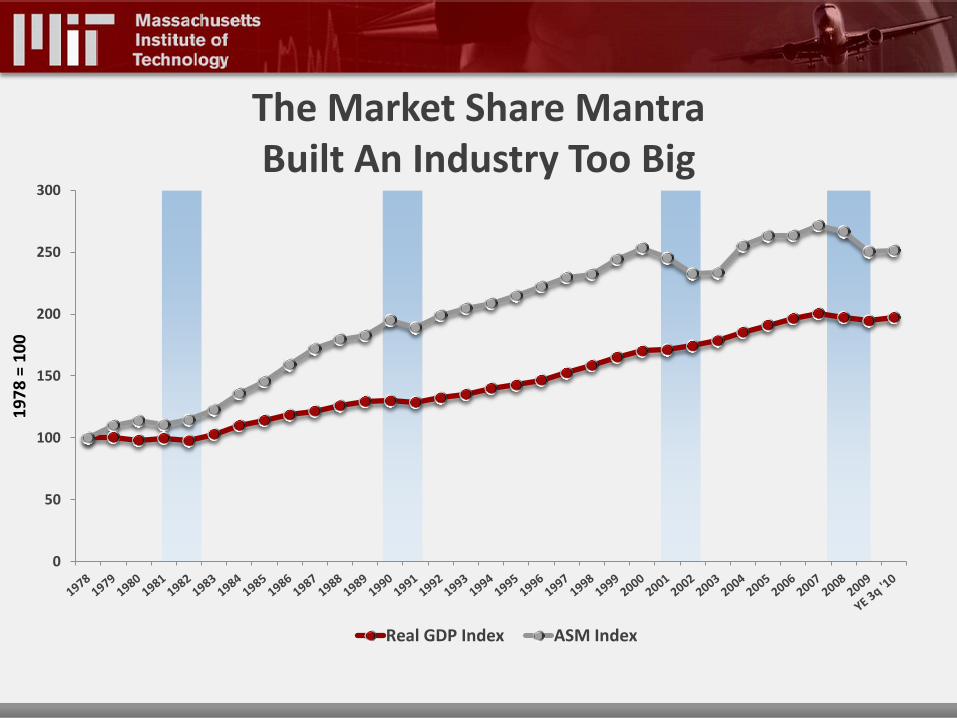
The Market Share Mantra Built An Industry Too Big
0
50
100
150
200
250
300
Real GDP Index ASM Index
19
78
= 1
00
40%
45%
50%
55%
60%
65%
70%
75%
80%
85%
0
200,000
400,000
600,000
800,000
1,000,000
1,200,000
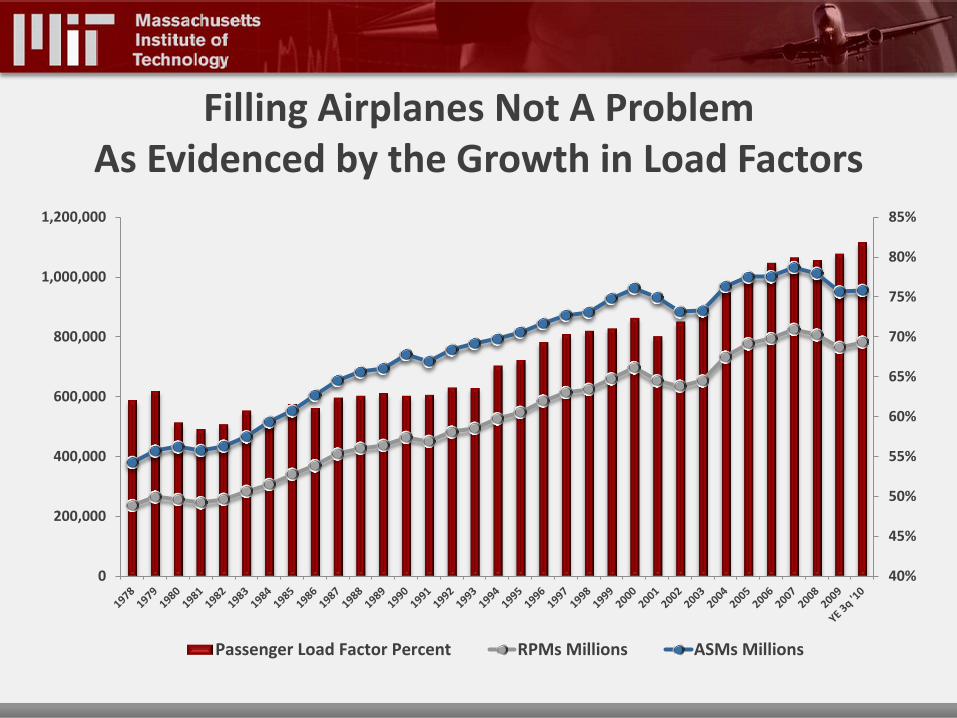
Passenger Load Factor Percent RPMs Millions ASMs Millions
Filling Airplanes Not A Problem As Evidenced by the Growth in Load Factors

Enabled by Decreasing Real Fares
Infl
ati
on
Ad
juste
d C
en
ts p
er
Reve
nu
e P
as
sen
ger
Mil
e
(19
82
= 1
00
)
0
1
2
3
4
5
6
7
8
9
10
Domestic International System
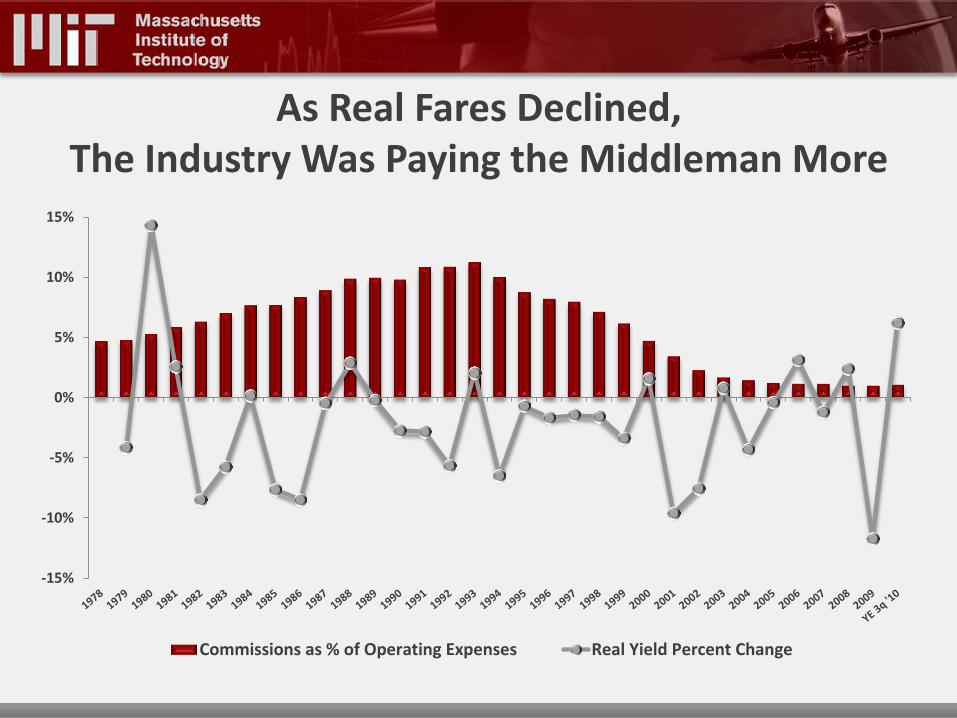
As Real Fares Declined, The Industry Was Paying the Middleman More
-15%
-10%
-5%
0%
5%
10%
15%
Commissions as % of Operating Expenses Real Yield Percent Change

A Classic Example of “Competing Away” the Efficiencies Got Rid of the Middleman, Gave $6B in Savings to the Consumer
To
tal
Co
mm
iss
ion
Co
st
(mil
lio
ns
)
Pe
rce
nt
of
Pa
ss
en
ger
Reve
nu
es
0.0%
2.0%
4.0%
6.0%
8.0%
10.0%
12.0%
14.0%
0
1,000
2,000
3,000
4,000
5,000
6,000
7,000
8,000
9,000
Total Commission Cost (millions) Percent of Passenger Revenues

Unit Revenues Began to Drop Dramatically During the Second Half of 2000
5
6
7
8
9
10
11
12
13
14
15
Passenger Revenue per ASM Total Operating Expenses per ASM
Pre-9/11 Average Difference: $0.73
Post-9/11 Average Difference: $2.61
Cen
ts
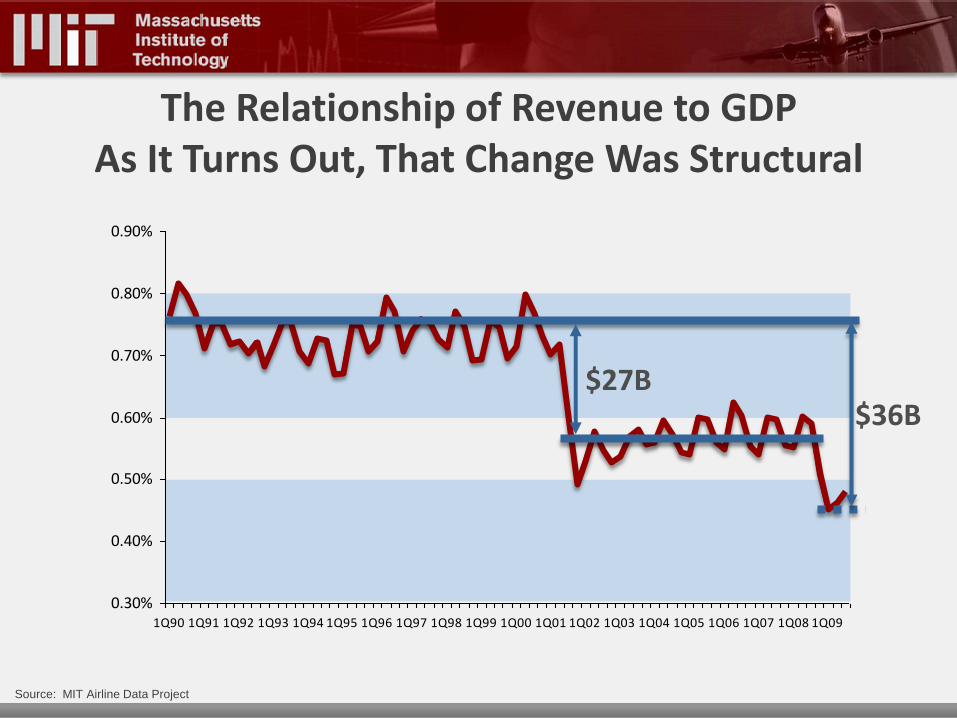
The Relationship of Revenue to GDP As It Turns Out, That Change Was Structural
Source: MIT Airline Data Project
0.30%
0.40%
0.50%
0.60%
0.70%
0.80%
0.90%
1Q90 1Q91 1Q92 1Q93 1Q94 1Q95 1Q96 1Q97 1Q98 1Q99 1Q00 1Q01 1Q02 1Q03 1Q04 1Q05 1Q06 1Q07 1Q08 1Q09
$27B $36B

Through 2000, Unit Labor Costs on the Rise As Productivity Remained Relatively Unchanged
0.00
0.50
1.00
1.50
2.00
2.50
3.00
3.50
4.00
4.50
0
500
1,000
1,500
2,000
2,500
3,000
ASMs per Employee Total Labor per ASM
AS
Ms
(00
0)
per
FT
E
Cen
ts p
er
AS
M
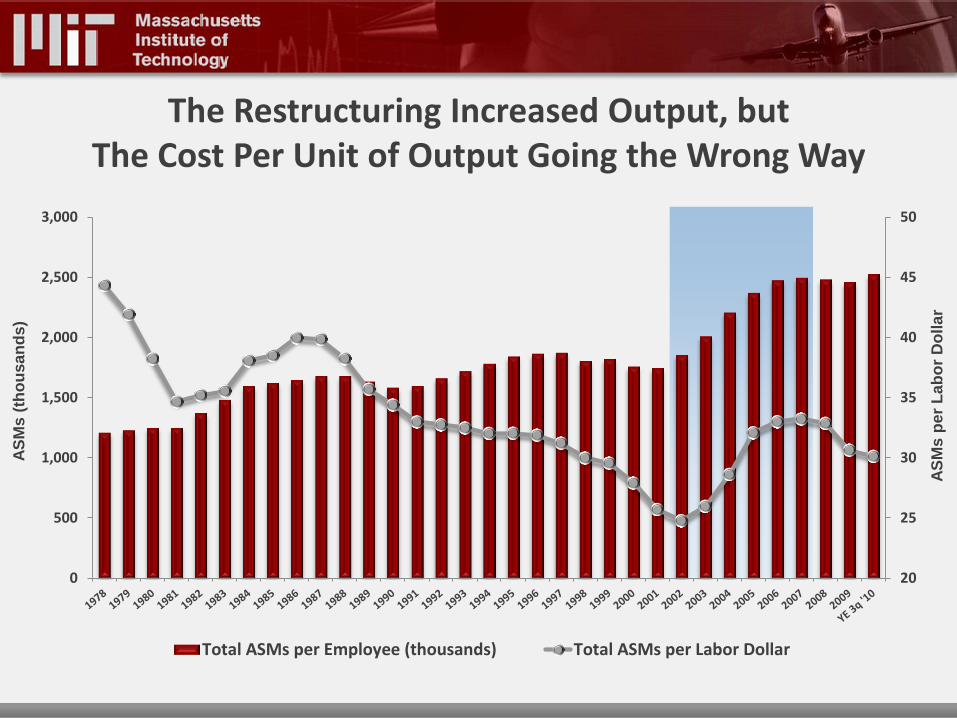
The Restructuring Increased Output, but The Cost Per Unit of Output Going the Wrong Way
20
25
30
35
40
45
50
0
500
1,000
1,500
2,000
2,500
3,000
Total ASMs per Employee (thousands) Total ASMs per Labor Dollar
AS
Ms
(th
ou
sa
nd
s)
AS
Ms
per
La
bo
r D
olla
r
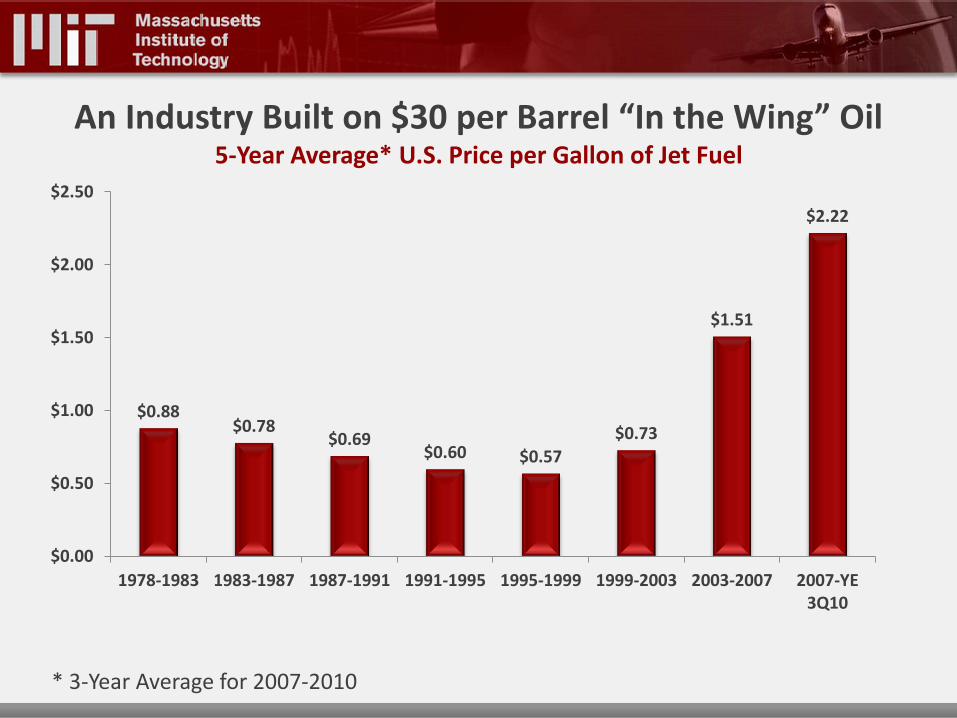
An Industry Built on $30 per Barrel “In the Wing” Oil 5-Year Average* U.S. Price per Gallon of Jet Fuel
* 3-Year Average for 2007-2010
$0.88 $0.78
$0.69 $0.60 $0.57
$0.73
$1.51
$2.22
$0.00
$0.50
$1.00
$1.50
$2.00
$2.50
1978-1983 1983-1987 1987-1991 1991-1995 1995-1999 1999-2003 2003-2007 2007-YE3Q10

Fuel Surpasses Labor As Largest Cost Category
0
100
200
300
400
500
600
700
19
78
= 1
00
Fuel Index
Passenger Yield
Consumer Price Index

200 of the roughly 450 mainland U.S. markets comprise 97% of domestic demand
Yet the 250 airport markets comprising 3% of domestic demand compete for the same pool of dollars
– Spending money in all of the wrong places?
The market share mentality created a system that competed with itself. Airlines the culprit of fragmenting their own marketplace at home
What About the U.S. Airport System?
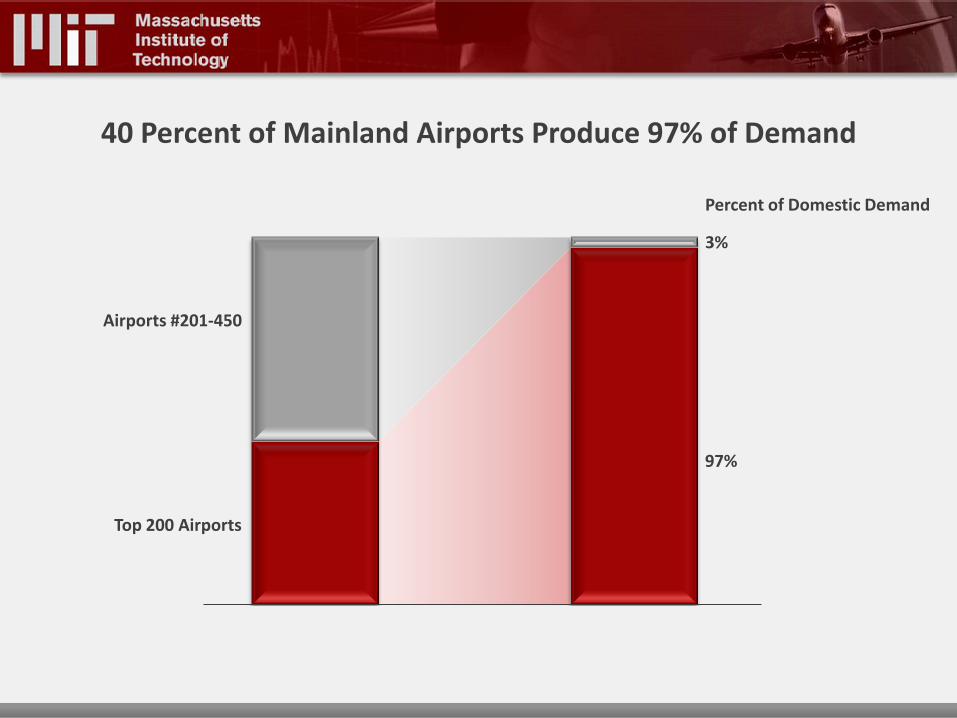
40 Percent of Mainland Airports Produce 97% of Demand
Top 200 Airports
Airports #201-450
3%
97%
Percent of Domestic Demand

Per Enplanement Profit and Loss Passenger Revenue Only
1980 - 1989 1990 - 1999 2000 - 2009 2010E Passenger Revenue $105.16 $129.44 $135.91 $144.81
Labor $39.66 $47.33 $49.04 $45.56
Fuel $24.94 $17.64 $34.21 $44.30
Commissions $8.99 $12.91 $3.16 $1.99
Landing Fees $2.03 $2.90 $3.46 $4.05
Aircraft Ownership $7.36 $12.87 $14.19 $12.82
All Other $30.98 $44.12 $48.26 $49.45
Total Op Expenses ex TR $113.96 $137.77 $152.33 $158.17
Passenger Revenue Less Expense ($8.80) ($8.32) ($16.42) ($13.35)
Interest $3.99 $3.16 $4.87 $6.11
Passenger Revenue Less Expense + Interest ($12.80) ($11.49) ($21.28) ($19.47)
Ancillary Fees $0.14 $8.70
Restated With Ancillary Fees ($12.80) ($11.49) ($21.14) ($10.76)
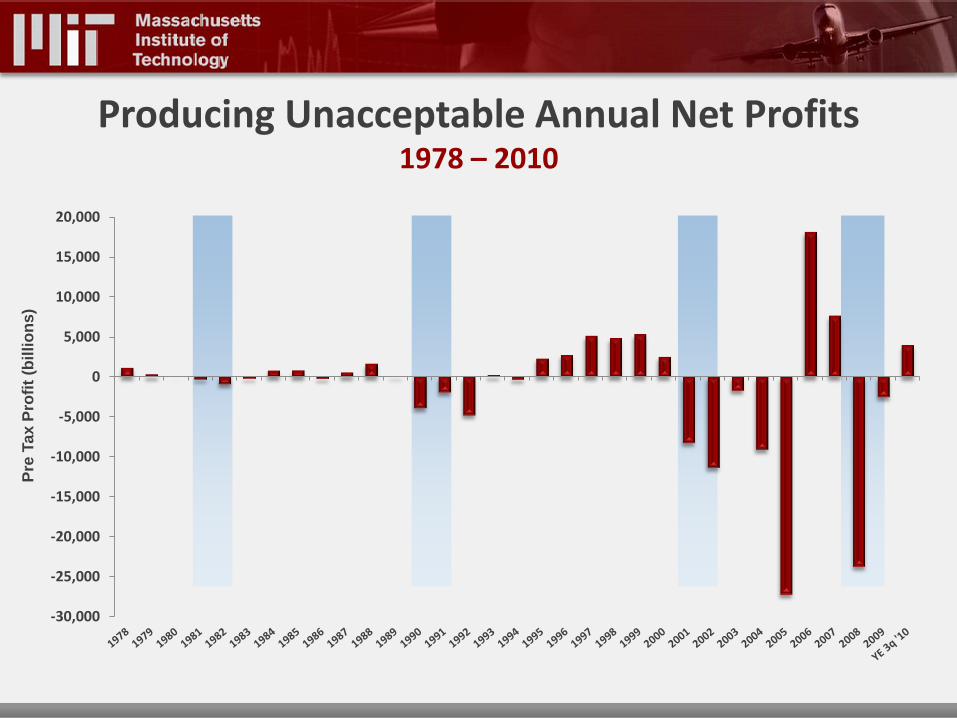
Producing Unacceptable Annual Net Profits 1978 – 2010
-30,000
-25,000
-20,000
-15,000
-10,000
-5,000
0
5,000
10,000
15,000
20,000
Pre
Ta
x P
rofi
t (b
illi
on
s)

Or…. A Cumulative Loss of Over $40 Billion Since 1978 1978 – 2010
-50,000
-40,000
-30,000
-20,000
-10,000
0
10,000
20,000
Cu
mu
lati
ve
Pre
-Ta
x P
rofi
t (b
illi
on
s)

And Not a Chance in Hell that the Industry Could Earn at Least Its Cost of Capital
Source: IATA
Return on Invested Capital in the Airline Industry v. the Cost of Capital
Pe
rce
nt
of
Inve
ste
d C
ap
ita
l
Cost of Capital (WACC)
‘93
14.0
12.0
0.0
Return on Capital (ROIC)
‘94 ‘95 ‘96 ‘97 ‘98 ‘99 ‘00 ‘01 ‘02 ‘03 ‘04 ‘05 ‘06 ‘07 ‘08 ‘09 ’11F
2.0
4.0
6.0
8.0
10.0
’10F
Forecast

If something
cannot go on forever,
it will stop
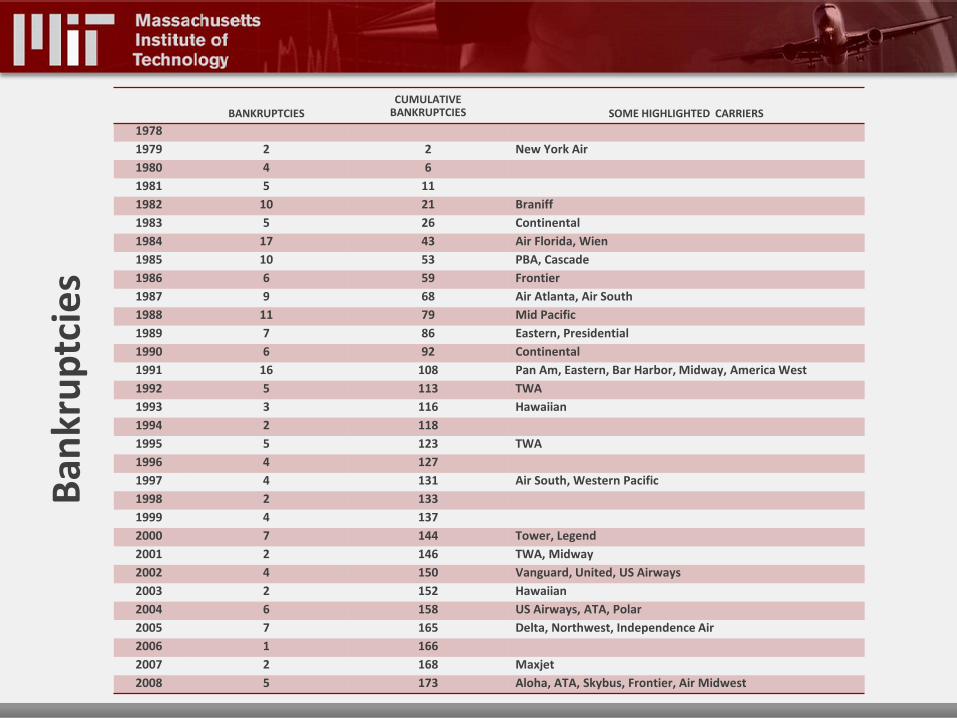
Ban
kru
ptc
ies
BANKRUPTCIES
CUMULATIVE BANKRUPTCIES
SOME HIGHLIGHTED CARRIERS
1978
1979 2 2 New York Air
1980 4 6
1981 5 11
1982 10 21 Braniff
1983 5 26 Continental
1984 17 43 Air Florida, Wien
1985 10 53 PBA, Cascade
1986 6 59 Frontier
1987 9 68 Air Atlanta, Air South
1988 11 79 Mid Pacific
1989 7 86 Eastern, Presidential
1990 6 92 Continental
1991 16 108 Pan Am, Eastern, Bar Harbor, Midway, America West
1992 5 113 TWA
1993 3 116 Hawaiian
1994 2 118
1995 5 123 TWA
1996 4 127
1997 4 131 Air South, Western Pacific
1998 2 133
1999 4 137
2000 7 144 Tower, Legend
2001 2 146 TWA, Midway
2002 4 150 Vanguard, United, US Airways
2003 2 152 Hawaiian
2004 6 158 US Airways, ATA, Polar
2005 7 165 Delta, Northwest, Independence Air
2006 1 166
2007 2 168 Maxjet
2008 5 173 Aloha, ATA, Skybus, Frontier, Air Midwest
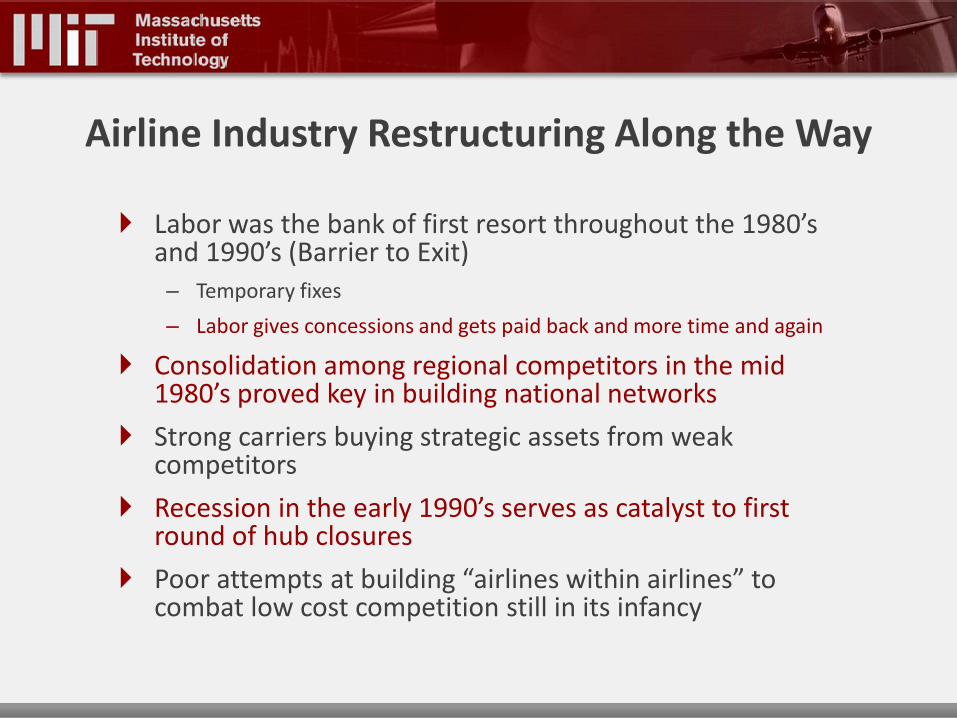
Airline Industry Restructuring Along the Way
Labor was the bank of first resort throughout the 1980’s and 1990’s (Barrier to Exit)
– Temporary fixes
– Labor gives concessions and gets paid back and more time and again
Consolidation among regional competitors in the mid 1980’s proved key in building national networks
Strong carriers buying strategic assets from weak competitors
Recession in the early 1990’s serves as catalyst to first round of hub closures
Poor attempts at building “airlines within airlines” to combat low cost competition still in its infancy
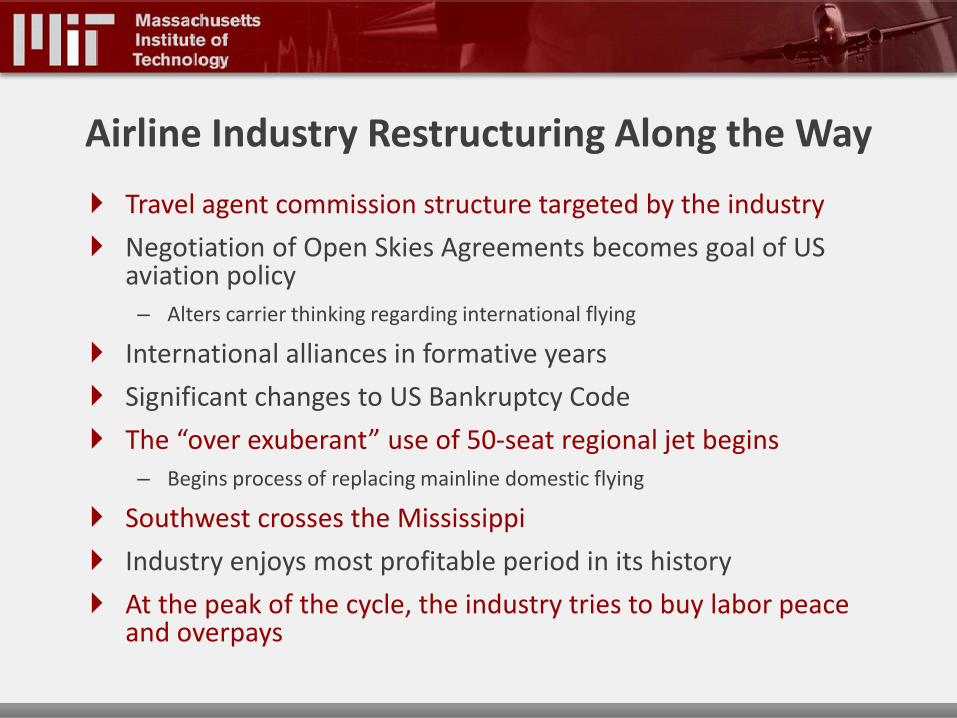
Airline Industry Restructuring Along the Way
Travel agent commission structure targeted by the industry
Negotiation of Open Skies Agreements becomes goal of US aviation policy
– Alters carrier thinking regarding international flying
International alliances in formative years
Significant changes to US Bankruptcy Code
The “over exuberant” use of 50-seat regional jet begins
– Begins process of replacing mainline domestic flying
Southwest crosses the Mississippi
Industry enjoys most profitable period in its history
At the peak of the cycle, the industry tries to buy labor peace and overpays

Airline Industry Restructuring Along the Way
First transatlantic alliances immunized
Network carrier cost structures exploited by the vigorous incursion of low cost carrier capacity
Insurance costs skyrocket after 9/11
Five of the seven network carriers file for bankruptcy
Nearly $12 billion in labor savings won
150,000 jobs shed
Maintenance outsourcing becomes a more widespread practice
First round of meaningful capacity reductions
Significant shift of domestic flying from network carriers to their respective regional partners takes place
Network carriers shift capacity away from US domestic market and redeploy aircraft to international markets

As fuel prices increase, various hedging strategies employed with mixed success
As fuel prices peak, industry employs a number of strategies to generate ancillary revenue
As fuel prices peak, industry announces significant capacity reduction and puts a capacity discipline mantra to work
New round of consolidation not limited to network carriers
Industry seems intent on not implementing their pattern bargaining sins of the past with labor
Pushing the envelope to find new ways to take cost out of the operation
– Few magic bullets remain
Airline Industry Restructuring Along the Way

A LOOK AT CERTAIN AIRLINE COSTS
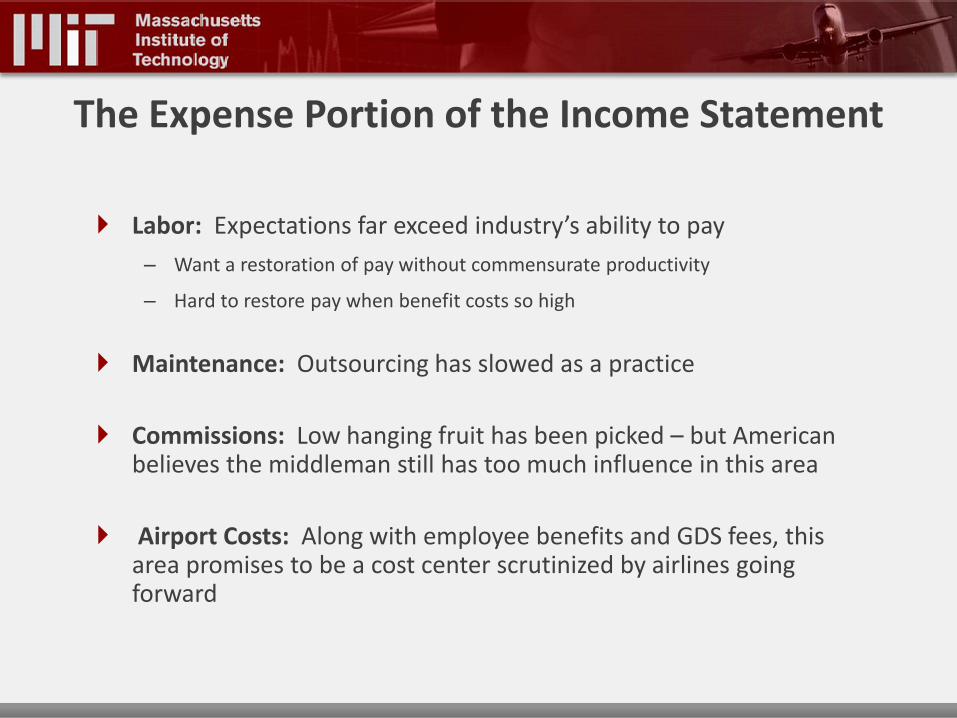
The Expense Portion of the Income Statement
Labor: Expectations far exceed industry’s ability to pay
– Want a restoration of pay without commensurate productivity
– Hard to restore pay when benefit costs so high
Maintenance: Outsourcing has slowed as a practice
Commissions: Low hanging fruit has been picked – but American believes the middleman still has too much influence in this area
Airport Costs: Along with employee benefits and GDS fees, this area promises to be a cost center scrutinized by airlines going forward

Landing Fees The “Age Old” Airline v. Airport Conflict
$-
$2
$4
$6
$8
$10
$12
$14
$16
$18
0
50
100
150
200
250
Capacity Tons Landed (millions) Cost per Capacity Ton Landed
Cap
ac
ity T
on
s L
an
de
d (
mil
lio
ns)
Co
st
pe
r C
ap
ac
ity T
on
Lan
de
d
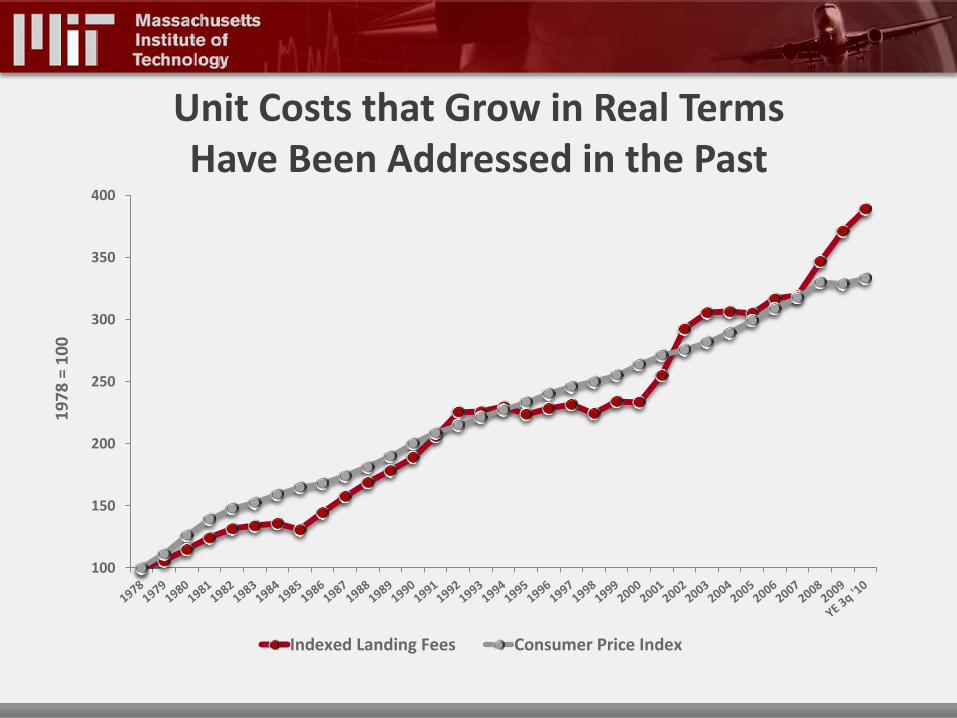
Unit Costs that Grow in Real Terms Have Been Addressed in the Past
100
150
200
250
300
350
400
19
78
= 1
00
Indexed Landing Fees Consumer Price Index
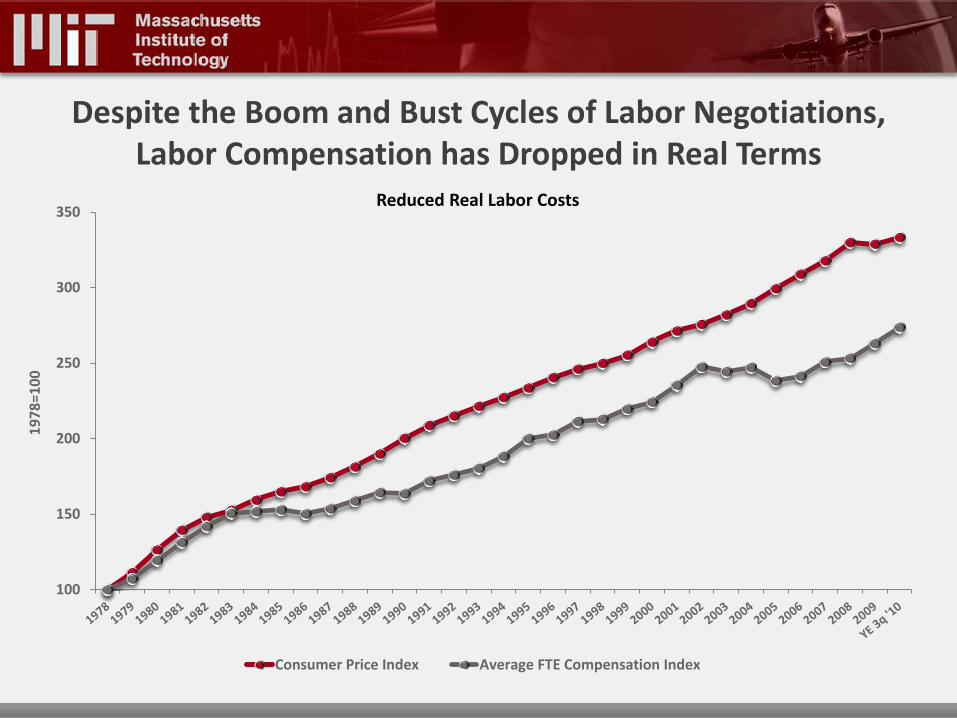
Despite the Boom and Bust Cycles of Labor Negotiations, Labor Compensation has Dropped in Real Terms
100
150
200
250
300
350
19
78
=10
0
Reduced Real Labor Costs
Consumer Price Index Average FTE Compensation Index

But the Cost of Benefits Are a Concern
0
100
200
300
400
500
600
0
100,000
200,000
300,000
400,000
500,000
600,000
Total Employee FTEs Benefits per FTE Index CPI 1978=100
To
tal
Em
plo
ye
e F
TE
s
Ben
efi
ts/C
PI


WHAT TO MAKE OF THE LAST 30 YEARS OF THE US COMMERCIAL AIRLINE BUSINESS

What to Make of the Last 30 Years?
Then: Barriers to entry for new and existing carriers were removed
Now:
– Interestingly, fuel costs/volatility proving to be a barrier to entry
– Fuel costs have limited the growth of the Low Cost sector in a significant way
Then: Barriers to exit for inefficient carriers were erected
Now:
– Unlikely that labor is a source of capital this time around
– Traditional external sources of capital not likely to fund inefficient operators
Then: Finally in the 2000’s, cost reductions and efficiency improvements that were expected during the previous two decades began to happen
Now:
– Will the industry stand and not give in to destructive pattern bargaining?
– Will the industry stand and not give in to the urge to add capacity?
– Along those lines, will the industry stop competing with itself?
– Will the industry finish the work of removing the middleman where possible?

If something
cannot go on forever,
it will stop