F1–What Are We Hedging Anyway? GAAP, Stat, or Economics? - Member | SOA · – A basket comprised...
20
Investment Symposium March 2010 F1: What Are We Hedging Anyway? GAAP, Stat, or Economics? Ross Bowen James Lloyd Moderator Jay Musselman
Transcript of F1–What Are We Hedging Anyway? GAAP, Stat, or Economics? - Member | SOA · – A basket comprised...

Investment Symposium March 2010
F1: What Are We Hedging Anyway? GAAP, Stat, or Economics?
Ross Bowen James Lloyd
Moderator Jay Musselman
1
F1–What Are We Hedging Anyway? GAAP, Stat, or Economic?, ,
Ross Bowen, Allianz LifeMarch 22, 2010
Hedging VA Risk
Most hedging programs started out hedging GAAP risk
Implementation of C3P2 and AG43 have created a disconnect with GAAP or pure economics
FAS 157 disconnected GAAP and Economic
Multiple constraints and objectives create the need for an interdisciplinary team to approach the problem
2
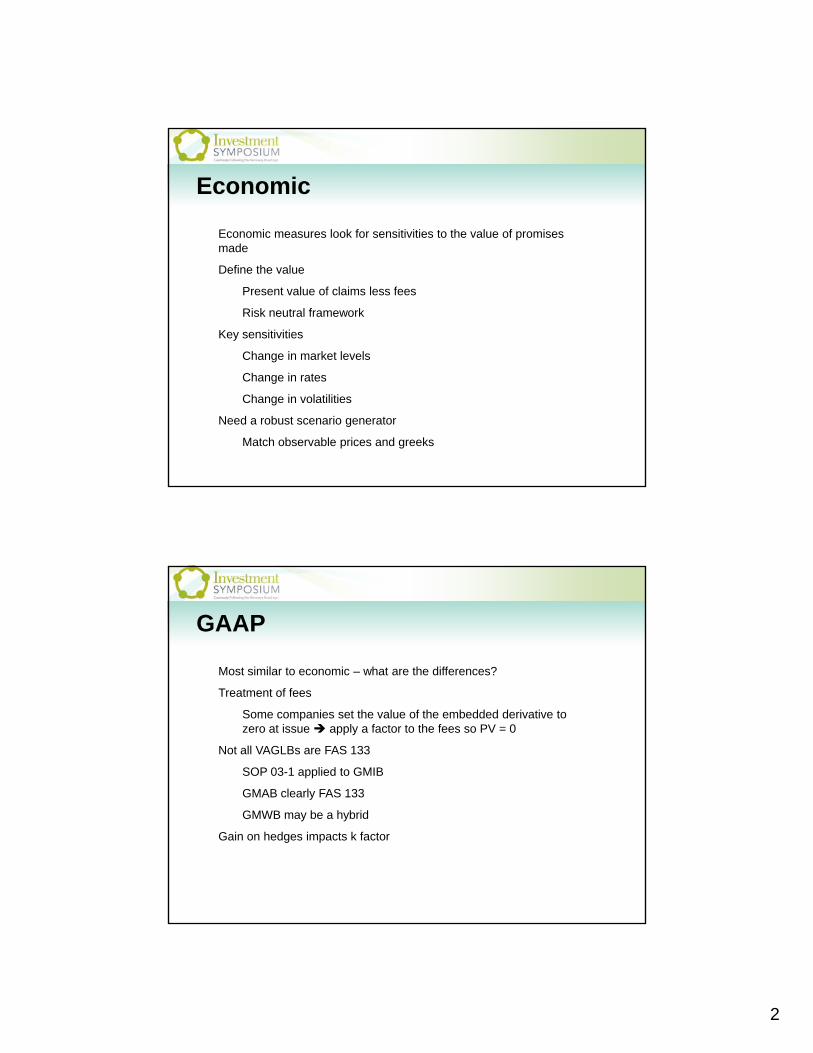
Economic
Economic measures look for sensitivities to the value of promises mademade
Define the value
Present value of claims less fees
Risk neutral framework
Key sensitivities
Change in market levels
Change in rates
Change in volatilities
Need a robust scenario generator
Match observable prices and greeks
GAAP
Most similar to economic – what are the differences?
Treatment of fees
Some companies set the value of the embedded derivative to zero at issue apply a factor to the fees so PV = 0
Not all VAGLBs are FAS 133
SOP 03-1 applied to GMIB
GMAB clearly FAS 133
GMWB may be a hybrid
Gain on hedges impacts k factor

3
GAAP – FAS 157
FAS 157 Own Credit Risk
Objections – value of promise declines as probability of paying declines
Release reserves when downgraded?
How to determine own credit risk spread?
CDS market offers view into credit risk
Large writers may have active CDS market
To hedge or not to hedge?
Sell CDS on self? Sell CDS on similar writers?
What is the goal of hedging?
Statutory
Moving from a factor based world to a Principles Based world
AG33 – Base Contract
AG34 - DB
AG39 – Living Benefits, accumulation of fees
There was a need to modernize AG39
C3P2 came first, then AG43 / VACARVM
Real world stochastic
Model hedges in a stochastic on stochastic framework
Standard scenario – comparable values between companies
4
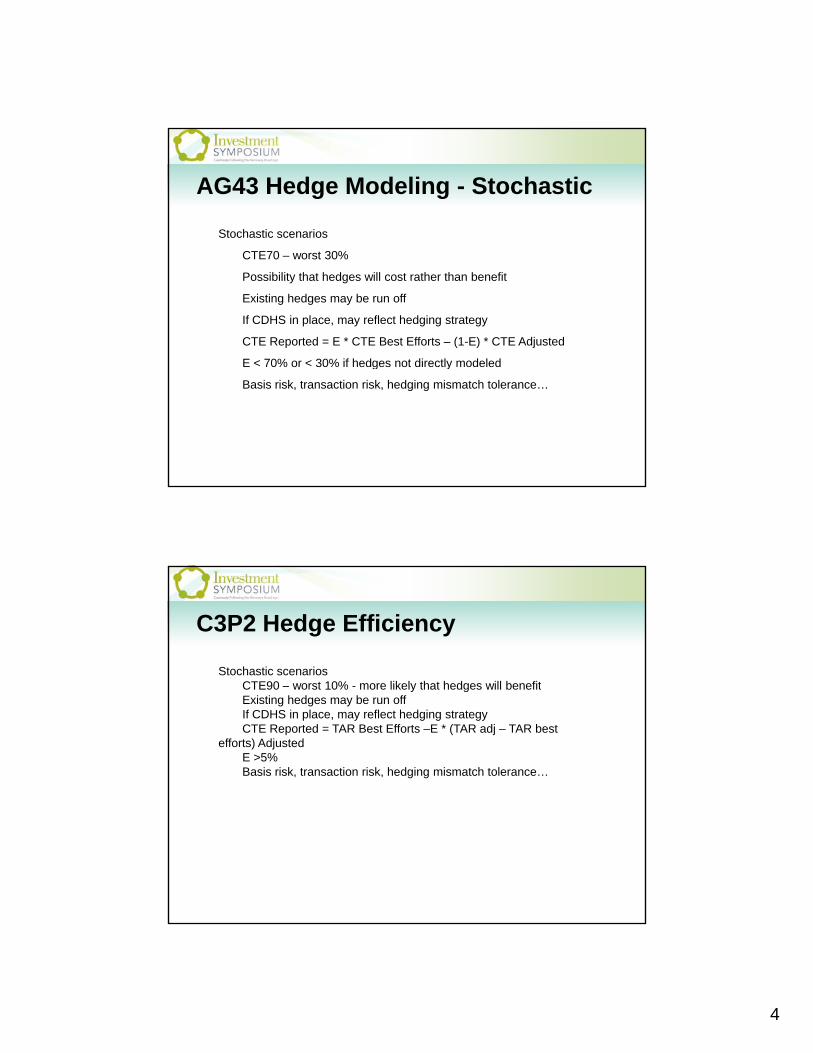
AG43 Hedge Modeling - Stochastic
Stochastic scenarios
CTE70 – worst 30%
Possibility that hedges will cost rather than benefit
Existing hedges may be run off
If CDHS in place, may reflect hedging strategy
CTE Reported = E * CTE Best Efforts – (1-E) * CTE Adjusted
E < 70% or < 30% if hedges not directly modeledg y
Basis risk, transaction risk, hedging mismatch tolerance…
C3P2 Hedge Efficiency
Stochastic scenariosCTE90 worst 10% more likely that hedges will benefitCTE90 – worst 10% - more likely that hedges will benefitExisting hedges may be run offIf CDHS in place, may reflect hedging strategyCTE Reported = TAR Best Efforts –E * (TAR adj – TAR best
efforts) AdjustedE >5%Basis risk, transaction risk, hedging mismatch tolerance…
5
Value of Hedges – AG43 SS
PV of pre-tax cashflows at the one-year CMT rate less statement valuevalue
Must be held to hedge these contracts in compliance with state laws
Assume hedges are liquidated in one year or exercised if mature prior
Assume returns underlying SS, Black Scholes pricing, rate of five-year CMT, and solved-for implied volatility
Evaluation of Hedge Instruments
Review the differences between stat, GAAP, and economic
Evaluate hedge performance in the various regimes
Choices
Futures
Puts
Swaps
Swaptionsp
Calls

6
Evaluation of Hedge Instruments Futures
Linear in the market
Can be written on different indices
Very effective on standard scenario
13.5% / 20% of notional
Unlimited losses possible in up market
Evaluation of Hedge Instruments Futures
Futures Performance in AG43
(30 000 000)(20,000,000)(10,000,000)
-10,000,00020,000,00030,000,00040,000,00050,000,000
700 800 900 1000 1100 1200 1300Gai
n / L
oss
mkt gainHedge CreditCapital Impact
(40,000,000)(30,000,000)
S&P Level

7
Evaluation of Hedge Instruments Puts
Provide delta protection in Statutory world
Vega and rho protection in Economic world
Can be very expensive
Out of the money attractive (crash protection)
Sell a deeper OTM to offset cost
Can also fund by selling upside
OTM call
Sell deeper OTM call to limit losses
Puts – “Zero Cost” CollarEconomic payoff
Payoff profile
100
200
300
-300
-200
-100
0400 500 600 700 800 900 1000 1100 1200 1300 1400

8
“Zero Cost” Collar - Impact
Change in value of options as time passes and market levels changechange
Hedge Value
3 04.05.06.07.08.09.010.0
$mill
ions
Hedge Value
0.01.02.03.0
1300120011001000900800700600
S&P Level
“Zero Cost” Collar - Impact
Additional value of hedge credit under AG43 standard scenario
Hedge Value plus Hedge Credit
2 0
4.0
6.0
8.0
10.0
12.0
14.0
$mill
ions Hedge Value
Value After Credit
0.0
2.0
1300120011001000900800700600
S&P Level

9
Principle 5
“The use of …risk management strategies (e.g. hedging)… that serve solely to reduce the calculated TAR are inconsistent withserve solely to reduce the calculated TAR… are inconsistent with these principles.
The use of assumptions and risk management strategies should be appropriate to the business and not merely constructed to exploit ‘foreknowledge’ of the components of the required methodology.”
Summary
Economic, stat, GAAP
All behavior differently under market shocks
Interdisciplinary project
Need input from many financial areas

1
What are we HedgingGAAPSTATEconomics?
Société GénéraleGlobal Markets Cross-Asset Solutions
sg structuredproducts comJ 2009
James Lloyd
FOR QUALIFIED INSTITUTIONAL BUYER ONLY sg-structuredproducts.com
Equity Derivatives House of the Year
June 2009FOR QUALIFIED INSTITUTIONAL BUYER ONLY
This material is confidential and is provided for information purposes only. There is no assurance that a transaction will be entered into on anyindicative terms. SG Americas Securities, LLC (“SGAS”) believes the information in this document is reliable but makes no representation orwarranty as to whether the information is current, accurate or complete. SGAS is under no obligation to update, modify or amend thiscommunication or to otherwise notify you that any matter contained herein has changed or subsequently become inaccurate. SGAS and itsaffiliates expressly disclaim all responsibility for any use of or reliance upon this document. This document is provided solely for informationalpurposes and may not be construed as an offer to buy or sell or a solicitation of an offer to buy or sell any financial instrument or to engage in
Important Information
purposes and may not be construed as an offer to buy or sell, or a solicitation of an offer to buy or sell, any financial instrument or to engage inany particular trading strategy or as an official confirmation of terms. Investors must make their own investment decisions using their ownindependent advisors while considering their own financial situation and investment objectives. SGAS and its affiliates do not act as a financialadviser or as a fiduciary in respect of any transaction unless such entity expressly agrees so in writing. This document may not be relied uponas investment, accounting, legal, regulatory or tax advice or an investment recommendation.
You should refer to the offering document relating to the relevant financial instrument which includes important information, including related riskfactors. Financial instruments of the type described herein may involve a high degree of risk and their value may be highly volatile. Such risksinclude, without limitation, risk of adverse or unanticipated market developments, risk of counterparty or issuer default, risk of adverse eventsinvolving any underlying reference obligation or entity and risk of illiquidity. In some financial instruments, counterparties may lose their entireinvestment or incur an unlimited loss. This brief statement does not disclose all the risks and other significant aspects in connection withtransactions of the type described in the materials. You are urged to consider carefully whether any products discussed herein are appropriatefor you or any of your clients given your or their objectives, experience, financial and operational resources and other relevant circumstances.This document may not be reproduced, distributed or published by any person for any person without the prior written consent of SGAS.
[Thi d i i d d f l i h “Q lifi d P h ” h i d fi d i h I C A f 1940[This document is intended for use only with “Qualified Purchasers”, as such term is defined in the Investment Company Act of 1940, asamended. Use of this document by any other party is prohibited.]
© 2009 Société Générale (“SG”), SGAS and their affiliates. SG CIB is the Corporate and Investment Banking arm of SG. Certain servicesdescribed herein are provided by SGAS, a US registered broker-dealer, member of the NYSE, FINRA and SIPC, and a wholly owned subsidiaryof SG. Services provided outside the US may be provided by affiliates of SGAS.
2

2
Delta Hedging
VA Traditional Hedging Methodologies
Short futures or TRS, adjusted periodically No purchase of implied volatility
More economic in medium/low volatility environment
Significant risks retained
Hedge Volatility has large P&L Impact
Path Dependent P&L3 Greek Dynamic Hedging
Description Benefits
Limitations
Limitations
3- Greek Dynamic HedgingHedge interest rate exposure with futures, rate swaps and swaptions
Purchase 3-15 year put options, Variance Swaps on major indices to hedge vega exposure
Allows to mirror MtM movements of liabilities
Hedge portfolio of vanilla derivatives can be efficiently rebalanced
If listed option used, no counterparty risks
Infrastructure requirements to compute risk, trade and rebalance
Requires a very good communication to investor, analyst and ratings community
Model RiskAdvanced Dynamic Hedging
Use of additional derivatives instruments such as lookback, options on basket, hybrid options, Dividend Swap
Cross Greeks Sensitivity, convexity is hedged
Better hedge extreme event
Requires advanced modeling techniques
Smaller liquidity, transactions costs
Model RiskStructured/Static Hedge
Customized OTC derivative that fully hedges capital Tailored to include guarantee specificities and actuarial assumptions
Calibration of initial modeling requiredmarkets exposure
Possibility to fully incorporate Insurer actuarial assumption
actuarial assumptions
Possibility to do very long term hedge
Hedge of all the liabilities under 1 transaction. No infrastructure needed
Might allow for better Accounting, Capital, .. treatment
Big Counterparty Risk
Actuarial mismatch.
Liquidity, Transactions costs
ReinsuranceFull traditional reinsurance Fully hedge Cost and availability
3
Delta Hedging Case Study
• Objective: attempt to replicate a portfolio of Mutual Funds (equity, bonds and balanced) with two replication baskets:
– A basket comprised by 5 indices (EAFA, SPX, NDX, RTY, LBUSTRRU)– A basket comprised by 11 liquid indices (9 equity and 2 bond indices) plus a basket of CDS
• Academic Research: Semi-Static hedging with options in jumpy markets and stochastic volatility is > 2.5 X more effective than dynamic with underlying (Appendix 1)y y g ( pp )
60%
80%
100%
120%
Back-test Methodology
Quarterly adjustments
Results
a) R2 = 74% C t 40 b
Graph 1.1. Illustration of tracking error reduction with different replication vehicles
0%
20%
40%
Jan-08 Apr-08 Jul-08 Oct-08 Jan-09 Apr-09
Basket of Mutual FundsBasket comprised by 11 indices + Basket of CDSBasket comprised by 5 indices
Cost = 40 bps p.a.
b) R2 = 87%Cost = 90 bps p.a.
*See appendix
Source: SG Analytics. See Appendix for details on the basket components. 4
3
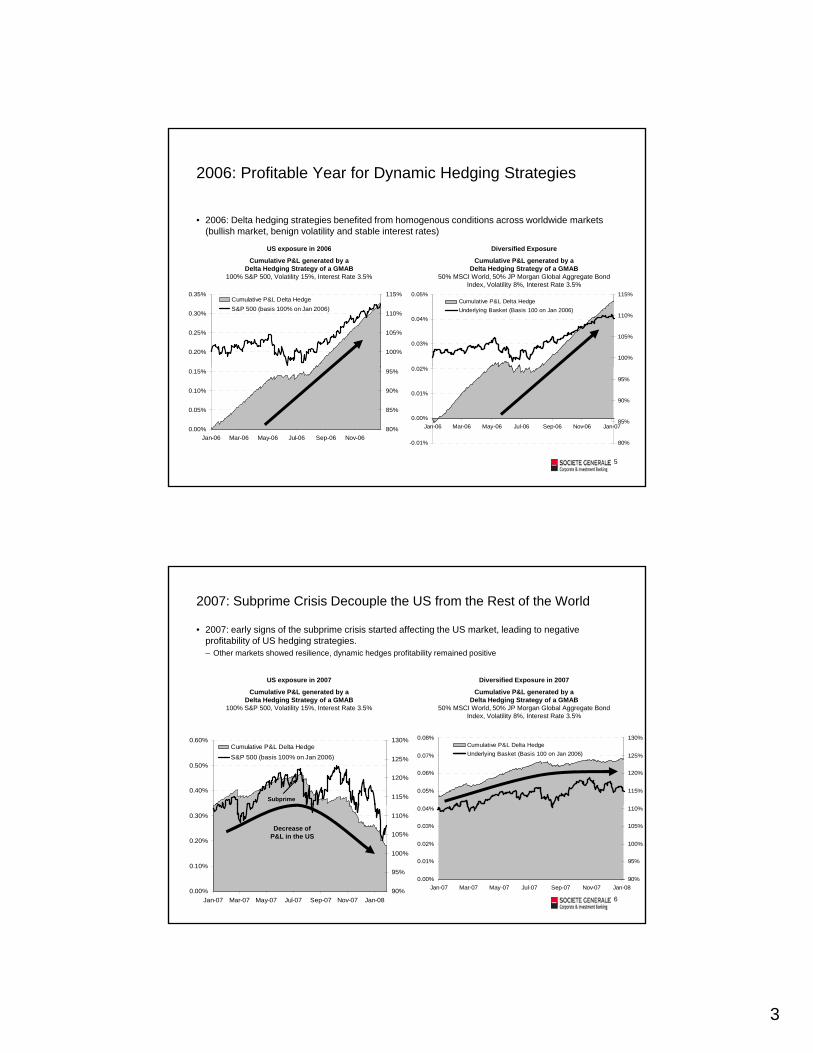
2006: Profitable Year for Dynamic Hedging Strategies
• 2006: Delta hedging strategies benefited from homogenous conditions across worldwide markets (bullish market, benign volatility and stable interest rates)
US exposure in 2006 Diversified Exposure
0 02%
0.03%
0.04%
0.05%
100%
105%
110%
115%Cumulative P&L Delta HedgeUnderlying Basket (Basis 100 on Jan 2006)
US exposure in 2006
Cumulative P&L generated by a Delta Hedging Strategy of a GMAB
100% S&P 500, Volatility 15%, Interest Rate 3.5%
Diversified Exposure
Cumulative P&L generated by a Delta Hedging Strategy of a GMAB
50% MSCI World, 50% JP Morgan Global Aggregate Bond Index, Volatility 8%, Interest Rate 3.5%
0.20%
0.25%
0.30%
0.35%
100%
105%
110%
115%Cumulative P&L Delta HedgeS&P 500 (basis 100% on Jan 2006)
-0.01%
0.00%
0.01%
0.02%
Jan-06 Mar-06 May-06 Jul-06 Sep-06 Nov-06 Jan-07
80%
85%
90%
95%
0.00%
0.05%
0.10%
0.15%
Jan-06 Mar-06 May-06 Jul-06 Sep-06 Nov-0680%
85%
90%
95%
5
2007: Subprime Crisis Decouple the US from the Rest of the World
• 2007: early signs of the subprime crisis started affecting the US market, leading to negative profitability of US hedging strategies. – Other markets showed resilience, dynamic hedges profitability remained positive
US exposure in 2007 Diversified Exposure in 2007
0.05%
0.06%
0.07%
0.08%
115%
120%
125%
130%Cumulative P&L Delta HedgeUnderlying Basket (Basis 100 on Jan 2006)
Cumulative P&L generated by a Delta Hedging Strategy of a GMAB
100% S&P 500, Volatility 15%, Interest Rate 3.5%
Cumulative P&L generated by a Delta Hedging Strategy of a GMAB
50% MSCI World, 50% JP Morgan Global Aggregate Bond Index, Volatility 8%, Interest Rate 3.5%
0.40%
0.50%
0.60%
115%
120%
125%
130%Cumulative P&L Delta HedgeS&P 500 (basis 100% on Jan 2006)
Subprime
0.00%
0.01%
0.02%
0.03%
0.04%
Jan-07 Mar-07 May-07 Jul-07 Sep-07 Nov-07 Jan-0890%
95%
100%
105%
110%
0.00%
0.10%
0.20%
0.30%
Jan-07 Mar-07 May-07 Jul-07 Sep-07 Nov-07 Jan-0890%
95%
100%
105%
110%
Decrease of P&L in the US
6
4
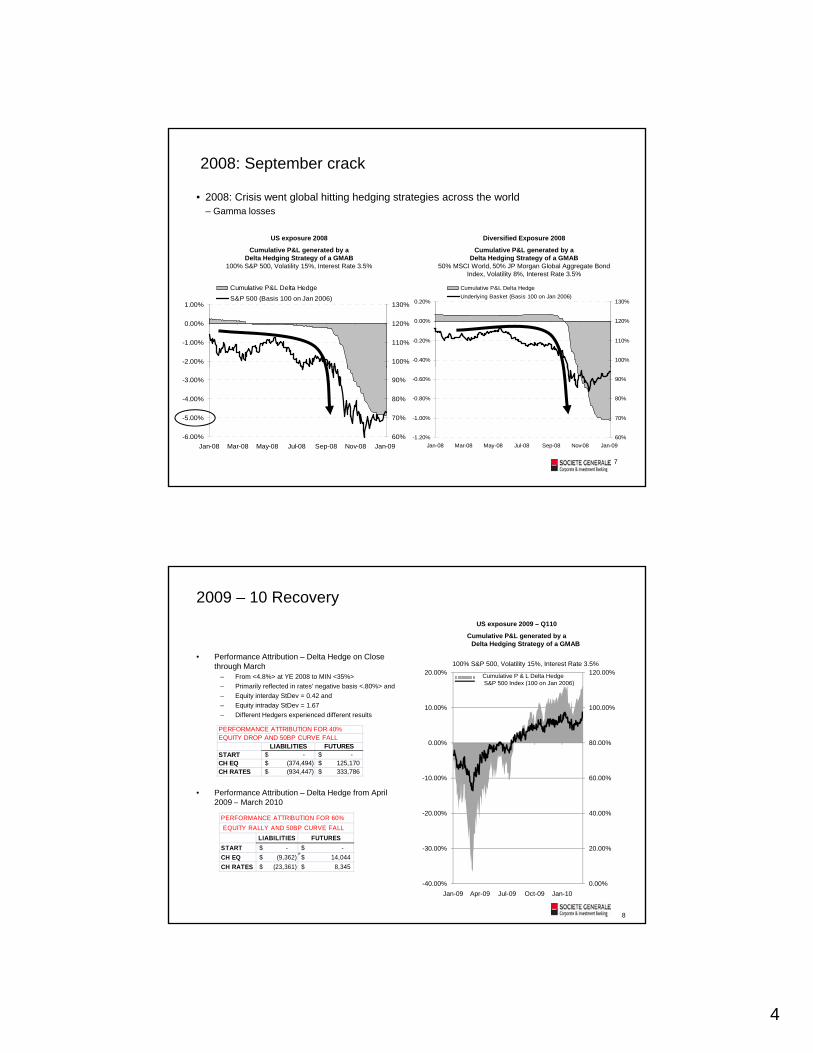
2008: September crack
• 2008: Crisis went global hitting hedging strategies across the world – Gamma losses
US exposure 2008
C l ti P&L t d b
Diversified Exposure 2008
C l ti P&L t d b
-2.00%
-1.00%
0.00%
1.00%
100%
110%
120%
130%
Cumulative P&L Delta HedgeS&P 500 (Basis 100 on Jan 2006)
Cumulative P&L generated by a Delta Hedging Strategy of a GMAB
100% S&P 500, Volatility 15%, Interest Rate 3.5%
Cumulative P&L generated by a Delta Hedging Strategy of a GMAB
50% MSCI World, 50% JP Morgan Global Aggregate Bond Index, Volatility 8%, Interest Rate 3.5%
-0.40%
-0.20%
0.00%
0.20%
100%
110%
120%
130%
Cumulative P&L Delta HedgeUnderlying Basket (Basis 100 on Jan 2006)
-6.00%
-5.00%
-4.00%
-3.00%
Jan-08 Mar-08 May-08 Jul-08 Sep-08 Nov-08 Jan-0960%
70%
80%
90%
-1.20%
-1.00%
-0.80%
-0.60%
Jan-08 Mar-08 May-08 Jul-08 Sep-08 Nov-08 Jan-0960%
70%
80%
90%
7
2009 – 10 Recovery
• Performance Attribution – Delta Hedge on Close through March
– From <4.8%> at YE 2008 to MIN <35%>Primarily reflected in rates’ negative basis < 80%> and
US exposure 2009 – Q110
Cumulative P&L generated by a Delta Hedging Strategy of a GMAB
100% S&P 500, Volatility 15%, Interest Rate 3.5%120.00%20.00% Cumulative P & L Delta Hedge
S&P 500 Index (100 on Jan 2006)– Primarily reflected in rates’ negative basis <.80%> and – Equity interday StDev = 0.42 and – Equity intraday StDev = 1.67– Different Hedgers experienced different results
• Performance Attribution – Delta Hedge from April 2009 – March 2010
60.00%
80.00%
100.00%
-10.00%
0.00%
10.00%
S& 500 de ( 00 o Ja 006)
PERFORMANCE ATTRIBUTION FOR 40% EQUITY DROP AND 50BP CURVE FALL
LIABILITIES FUTURESSTART -$ -$ CH EQ (374,494)$ 125,170$ CH RATES (934,447)$ 333,786$
2009 March 2010
0.00%
20.00%
40.00%
-40.00%
-30.00%
-20.00%
Jan-09 Apr-09 Jul-09 Oct-09 Jan-10
PERFORMANCE ATTRIBUTION FOR 60% EQUITY RALLY AND 50BP CURVE FALL
LIABILITIES FUTURESSTART -$ -$ CH EQ (9,362)$ 14,044$ CH RATES (23,361)$ 8,345$
8

5
Strategies seen in the Market with & without Rho hedges
• That Don’t Destroy Capital for Inforce Business– Variance Swap or option on VS– Timer Puts – Volatility “budget”– Capital Puts – variance based premia
Hybrids selling Vega buying delta buying floors– Hybrids – selling Vega, buying delta, buying floors
• Where Rates were unhedged for accounting or under-hedged (STAT vs. economic)
– Hybrids– Inverse Floaters – non-CDHS– RSAT – non-CDHS
• That address the problem of Cross-Greeks effects– Leveraged Puts– HybridsHybrids
• That address Tracking Error problems for Inforce Blocks– Factor models– CDS’s included in tracking basket for balanced funds
9
3-Greek Dynamic Hedging Long Term Vega Risk
Hedging Instruments
Long Term ATM Puts
Gamma: At the Strike
Variance Swaps
Gamma: Constant along VsBehaviors such as withdrawal and reset impact the strikes and create a complex Vega exposure relative to the spot price
Still bought by most insurers
gthe strikes (Non Fixed Strike)
Hedge strip for variance swap weights downside strikes to maintain constant Vega (1/k2)
Constant Vega profile offers different risk profile to fixed strike options
Off tt ti d t
Vs.
10
Offer attractive case due to their constant Vega profile relative to spot and in many cases better liquidity.
6
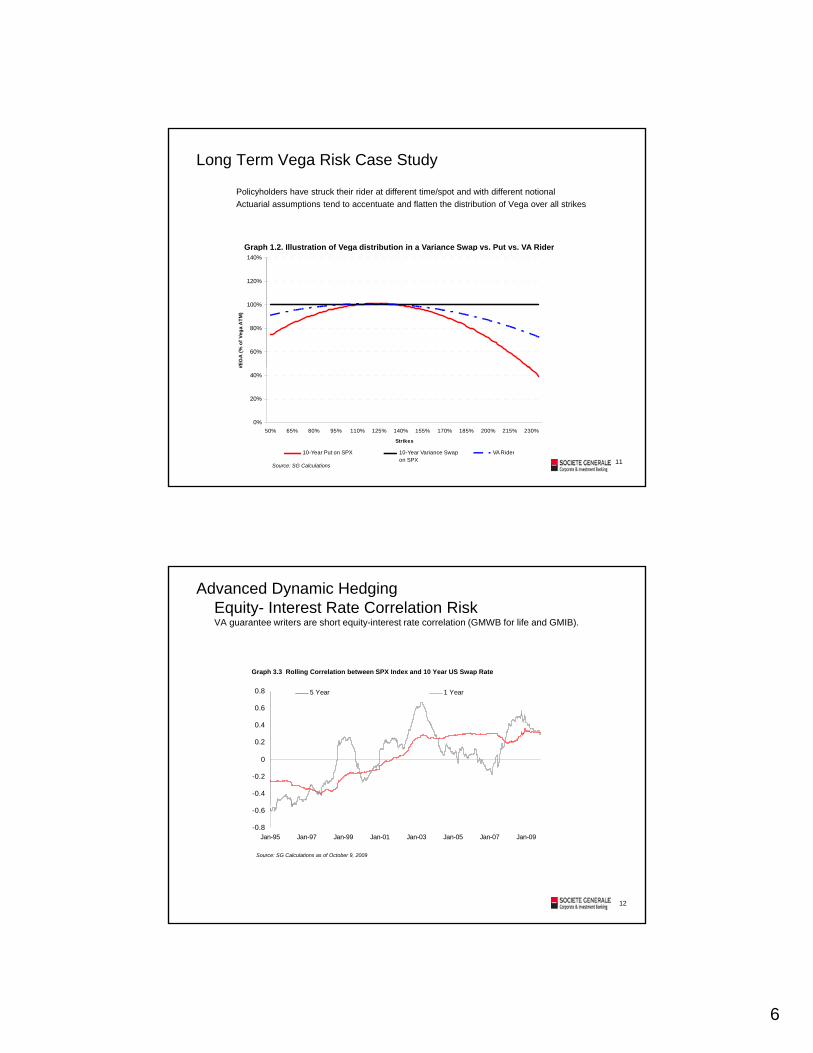
Long Term Vega Risk Case Study
Policyholders have struck their rider at different time/spot and with different notional Actuarial assumptions tend to accentuate and flatten the distribution of Vega over all strikes
Graph 1 2 Illustration of Vega distribution in a Variance Swap vs Put vs VA RiderGraph 1.2. Illustration of Vega distribution in a Variance Swap vs. Put vs. VA Rider
60%
80%
100%
120%
140%
VEG
A (%
of V
ega
ATM
)
11
0%
20%
40%
50% 65% 80% 95% 110% 125% 140% 155% 170% 185% 200% 215% 230%
Strikes
V
Poly. (Put on SPX) Poly. (Var SWAP) Poly. (VA Rider)10-Year Put on SPX 10-Year Variance Swap on SPX
VA Rider
Source: SG Calculations
Advanced Dynamic HedgingEquity- Interest Rate Correlation Risk VA guarantee writers are short equity-interest rate correlation (GMWB for life and GMIB).
Graph 3.3 Rolling Correlation between SPX Index and 10 Year US Swap Rate
-0.4
-0.2
0
0.2
0.4
0.6
0.8 5 Year 1 Year
12
Source: SG Calculations as of October 9, 2009
-0.8
-0.6
Jan-95 Jan-97 Jan-99 Jan-01 Jan-03 Jan-05 Jan-07 Jan-09
7
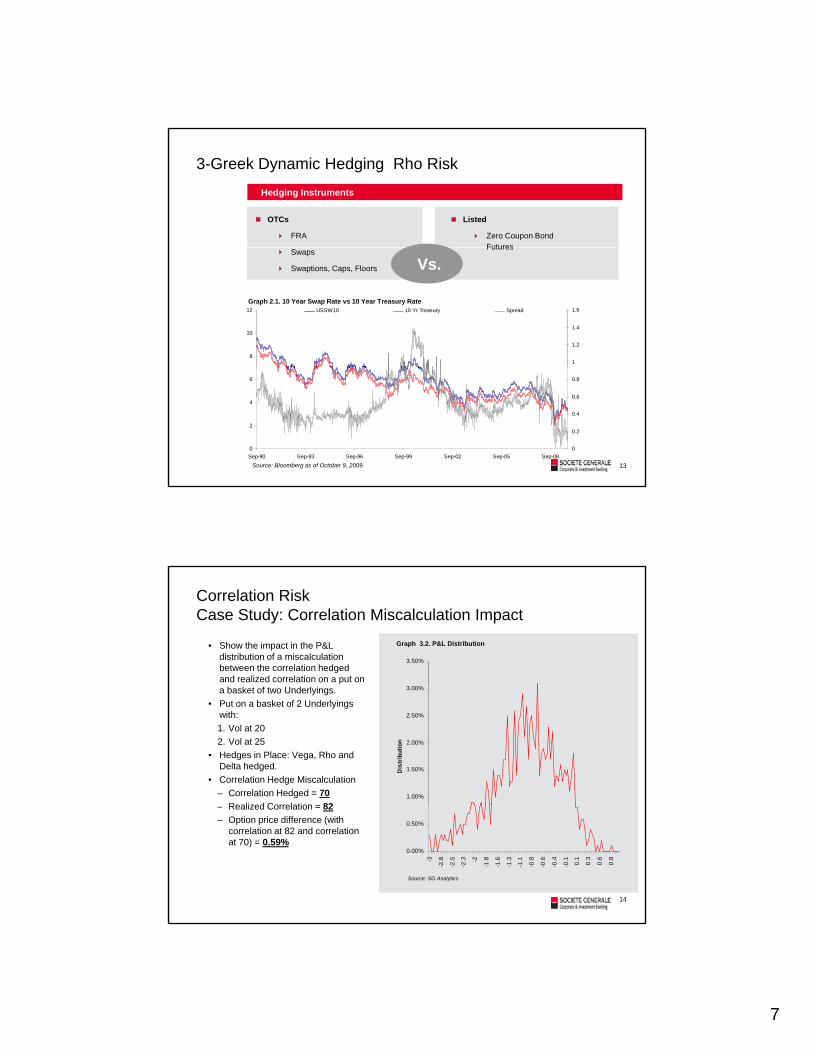
3-Greek Dynamic Hedging Rho Risk
Hedging Instruments
OTCs
FRA
Listed
Zero Coupon Bond Futures
8
10
12
1
1.2
1.4
1.6USSW10 10 Yr Treasury Spread
Swaps
Swaptions, Caps, Floors
Futures
Vs.
Graph 2.1. 10 Year Swap Rate vs 10 Year Treasury Rate
13
0
2
4
6
Sep-90 Sep-93 Sep-96 Sep-99 Sep-02 Sep-05 Sep-080
0.2
0.4
0.6
0.8
Source: Bloomberg as of October 9, 2009.
Correlation RiskCase Study: Correlation Miscalculation Impact
• Show the impact in the P&L distribution of a miscalculation between the correlation hedged and realized correlation on a put on
3.50%
Graph 3.2. P&L Distribution
a basket of two Underlyings. • Put on a basket of 2 Underlyings
with:1. Vol at 202. Vol at 25
• Hedges in Place: Vega, Rho and Delta hedged.
• Correlation Hedge Miscalculation – Correlation Hedged = 70
Realized Correlation 821.00%
1.50%
2.00%
2.50%
3.00%
Dis
trib
utio
n
14
– Realized Correlation = 82– Option price difference (with
correlation at 82 and correlation at 70) = 0.59%
0.00%
0.50%
-3
-2.8
-2.5
-2.3 -2
-1.8
-1.6
-1.3
-1.1
-0.8
-0.6
-0.4
-0.1 0.1
0.3
0.6
0.8
Source: SG Analytics
8
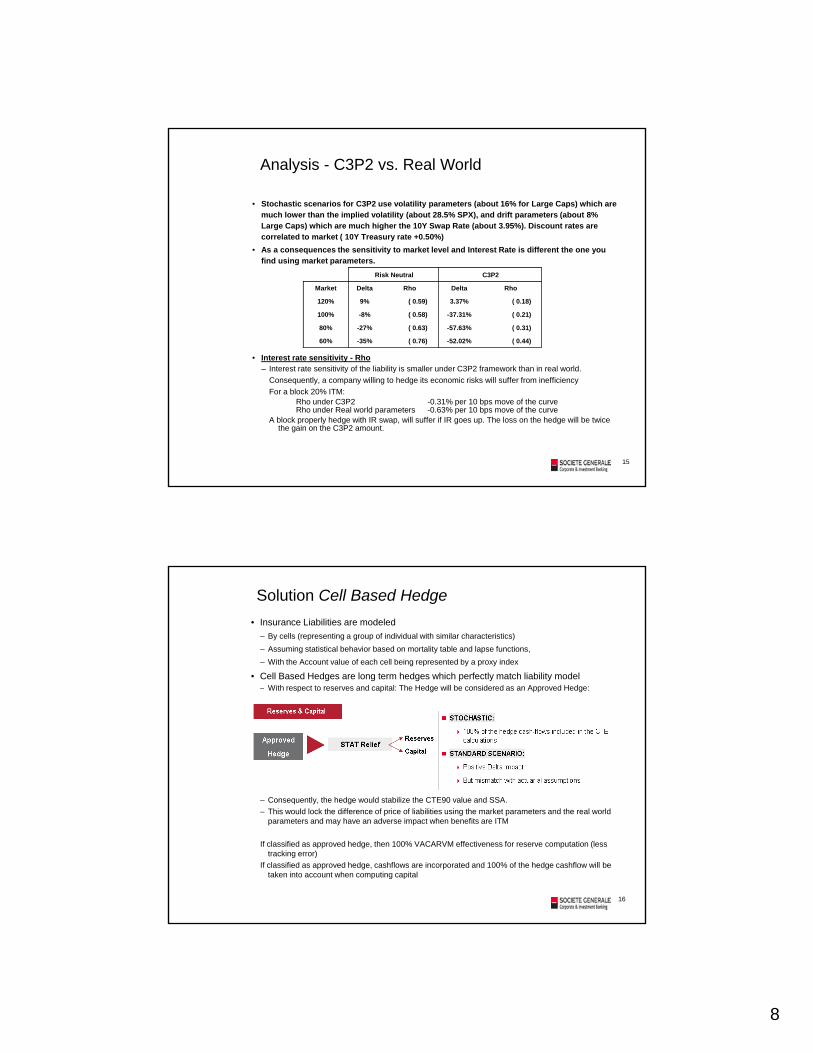
• Stochastic scenarios for C3P2 use volatility parameters (about 16% for Large Caps) which are much lower than the implied volatility (about 28.5% SPX), and drift parameters (about 8% Large Caps) which are much higher the 10Y Swap Rate (about 3.95%). Discount rates are correlated to market ( 10Y Treasury rate +0.50%)A th iti it t k t l l d I t t R t i diff t th
Analysis - C3P2 vs. Real World
• As a consequences the sensitivity to market level and Interest Rate is different the one you find using market parameters.
• Interest rate sensitivity - RhoInterest rate sensitivity of the liability is smaller under C3P2 framework than in real world
Risk Neutral C3P2
Market Delta Rho Delta Rho
120% 9% ( 0.59) 3.37% ( 0.18)
100% -8% ( 0.58) -37.31% ( 0.21)
80% -27% ( 0.63) -57.63% ( 0.31)
60% -35% ( 0.76) -52.02% ( 0.44)
– Interest rate sensitivity of the liability is smaller under C3P2 framework than in real world. Consequently, a company willing to hedge its economic risks will suffer from inefficiency For a block 20% ITM:
Rho under C3P2 -0.31% per 10 bps move of the curveRho under Real world parameters -0.63% per 10 bps move of the curve
A block properly hedge with IR swap, will suffer if IR goes up. The loss on the hedge will be twice the gain on the C3P2 amount.
15
• Insurance Liabilities are modeled – By cells (representing a group of individual with similar characteristics)– Assuming statistical behavior based on mortality table and lapse functions,– With the Account value of each cell being represented by a proxy index
• Cell Based Hedges are long term hedges which perfectly match liability model With t t d it l Th H d ill b id d A d H d
Solution Cell Based Hedge
– With respect to reserves and capital: The Hedge will be considered as an Approved Hedge:
– Consequently, the hedge would stabilize the CTE90 value and SSA.– This would lock the difference of price of liabilities using the market parameters and the real world
parameters and may have an adverse impact when benefits are ITM
If classified as approved hedge, then 100% VACARVM effectiveness for reserve computation (less tracking error)
If classified as approved hedge, cashflows are incorporated and 100% of the hedge cashflow will be taken into account when computing capital
16
9
New Hybrids
Hybrid option appropriate for GMIB hedging
PAYOFF 1: MAX (Strike - Leverage * USSW10 spot - SPX Yield, 0.0) where leverage is a fixed value which determines your rate sensitivity
PAYOFF 2: Hybrid swaption with a swaption strike which depends on Equity.
Both of them have the same background. The put allows the hedger to choose the notional of the cashflows to pay and the rate part, as multiplier, takes part of the rate sensitivity - due to the discount of all the cashflows. The two structures are made for two different purposes with different convexities for each.
Hybrid option appropriate for GMWB hedging
PAYOFF 3: leverage on rate * put. [Payoff is: MAX( Strike - SPX Yield,0.0) * Leverage] where leverage is for example: – 0 if USSW10 is above 5%– 1 if USSW10 is below 3%a linear interpolation,– Otherwise, formula is: [1 - (USSW10 - 3%)/2%]
This is a medium term product - created to buy correlation. It allows a hedger to buy a significant amount of sensitivity to correlation plus get access to some cross Greeks However it does not match maturity of the liabilities It does not provide a good Equity hedge or Interestaccess to some cross Greeks. However, it does not match maturity of the liabilities. It does not provide a good Equity hedge or Interest rate hedge. It allows the hedger to mainly realize P&L when correlation increases.
PAYOFF4: Put * Discount factor. Payoff is: [MAX(Strike - SPX Yield,0.0) * 1/(1+USSW10)^5]
This last product should be viewed more from a cash flow perspective. It's intended to hedge the cashflows - not the Greeks sensitivities (IR equity correlation sensitivity is small). Maturity is a good feature because the hedger buys some equity & interest rate volatility and avoids buying correlation, which, today, is may be viewed as expensive. It may represent a significant portion of any hedging strategy.
17
Conclusion
• Hedge Economic Liabilities– Uncertainty and Recovery combine to tilt the tables in favor of 100% hedge
• With Capital and Letters of Credit at a premium Variance-based fees minimize the increase ofWith Capital and Letters of Credit at a premium Variance based fees minimize the increase of reserves customarily caused by vega hedging
– RBC ratios have dropped from an average of 380 in 2007 to 285 today (even after $1.2TR)– Cost of capital in recent equity and debt offers have risen from 8% to as much as 16% today
• AG43 has pitched some insurers into SSA sensitivity– Hedges or reinsurance now has to cover both tails
• Rates Down : Equity Down – Greatest Reserve Hit• Rates up (lapse up) : Equity UP – Greatest Lapse Hit
– Over-hedging/Gamma hedging• AG43 opens up the opportunity to treat Reinsurance as “Approved Hedge”
– To be included in liability simulationsy– To be included in SSA as an asset that is liquidated down 13.5%
• Dynamic Hedging is punished under AG43
18

10
Appendix 1
Coleman, Kim, Patron, Robustly Hedging Variable Annuities with Guarantees Under Jump and Volatility Risks, 2004
19