F ROM M ULTIPLE M ODES FOR S URVEYS TO M ULTIPLE D ATA S OURCES FOR ESTIMATES Constance Citro,...
34
FROM MULTIPLE MODES FOR SURVEYS TO MULTIPLE DATA SOURCES FOR ESTIMATES Constance Citro, Director, CNSTAT Keynote Address • April 29, 2015 UNECE Workshops on Data Collection & Communication Washington, DC
-
Upload
anis-blake -
Category
Documents
-
view
218 -
download
1
Transcript of F ROM M ULTIPLE M ODES FOR S URVEYS TO M ULTIPLE D ATA S OURCES FOR ESTIMATES Constance Citro,...
FROM MULTIPLE MODES FOR SURVEYS TO
MULTIPLE DATA SOURCES FOR ESTIMATES
Constance Citro, Director, CNSTATKeynote Address • April 29, 2015
UNECE Workshops on Data Collection & CommunicationWashington, DC
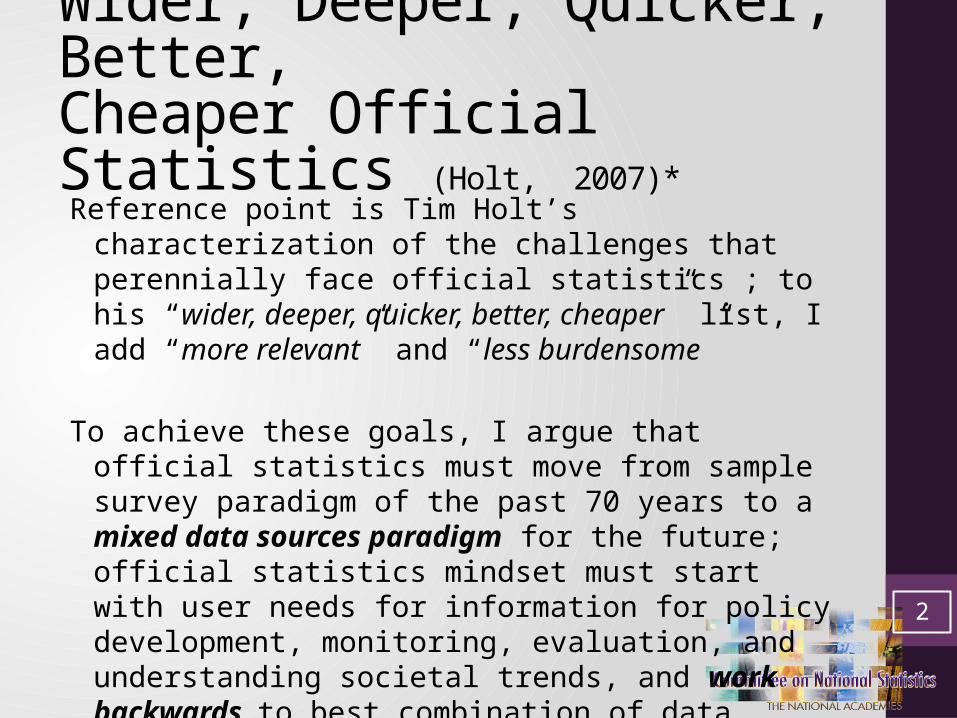
Wider, Deeper, Quicker, Better,Cheaper Official Statistics (Holt, 2007)*Reference point is Tim Holt’s characterization of
the challenges that perennially face official statistics ; to his “wider, deeper, quicker, better, cheaper” list, I add “more relevant” and “less burdensome”
To achieve these goals, I argue that official statistics must move from sample survey paradigm of the past 70 years to a mixed data sources paradigm for the future; official statistics mindset must start with user needs for information for policy development, monitoring, evaluation, and understanding societal trends, and work backwards to best combination of data sources
*References available in full paper
2
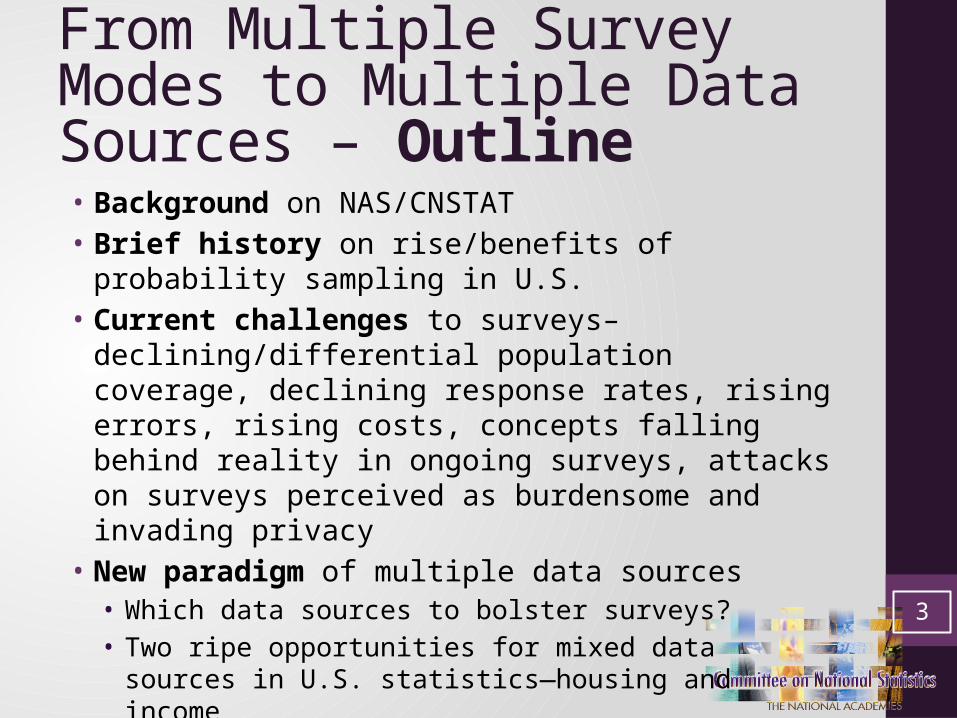
From Multiple Survey Modes to Multiple Data Sources – Outline• Background on NAS/CNSTAT• Brief history on rise/benefits of probability
sampling in U.S.• Current challenges to surveys–
declining/differential population coverage, declining response rates, rising errors, rising costs, concepts falling behind reality in ongoing surveys, attacks on surveys perceived as burdensome and invading privacy
• New paradigm of multiple data sources• Which data sources to bolster surveys?• Two ripe opportunities for mixed data sources in
U.S. statistics—housing and income
• Barriers to innovation, particularly to changing paradigms, and suggestions for knocking them down
3
First, Disclaimers!My remarks informed by 30 years at CNSTAT, but are my own
My focus is official U.S. statistics and household survey programs, particularly U.S. Census Bureau surveys on supposedly “hard” topics (e.g., income, wealth, expenditures), where I see greatest need for a new paradigmWhy?—for concreteness, I must address what I know best
Hopefully, listeners from other sectors, countries, statistical programs, and agencies will find analogies in their own work
My critique of survey paradigm is intended to help improve official statistics; I deeply appreciate the value of probability surveys and deeply admire the work of statistical agencies, which serve a vitally important public good
4

What Are the National Academies?National Academy of Sciences—independent, nonprofit honorific society; 1863 congressional charter to advise government on science and “art”
National Academy of Engineering—est. 1964
Institute of Medicine – est. 1970National Research Council – est. 1916 as operating arm of NAS
About 50 standing units like CNSTAT 5
What is CNSTAT?Established in 1972 at NAS/NRC, recommended by
President’s Commission on Federal Statistics to provide independent, objective resource to evaluate and improve federal statistical methods/operations
Mission is to improve statistical methods and information on which public policy decisions are based; also serves as coordinating force in decentralized U.S. statistical system
[Pro bono] members include statisticians, economists, survey researchers, demographers, computer scientists, former statistical agency heads
Over 43-year history, CNSTAT has produced over 240 consensus, interim, and workshop reports
6
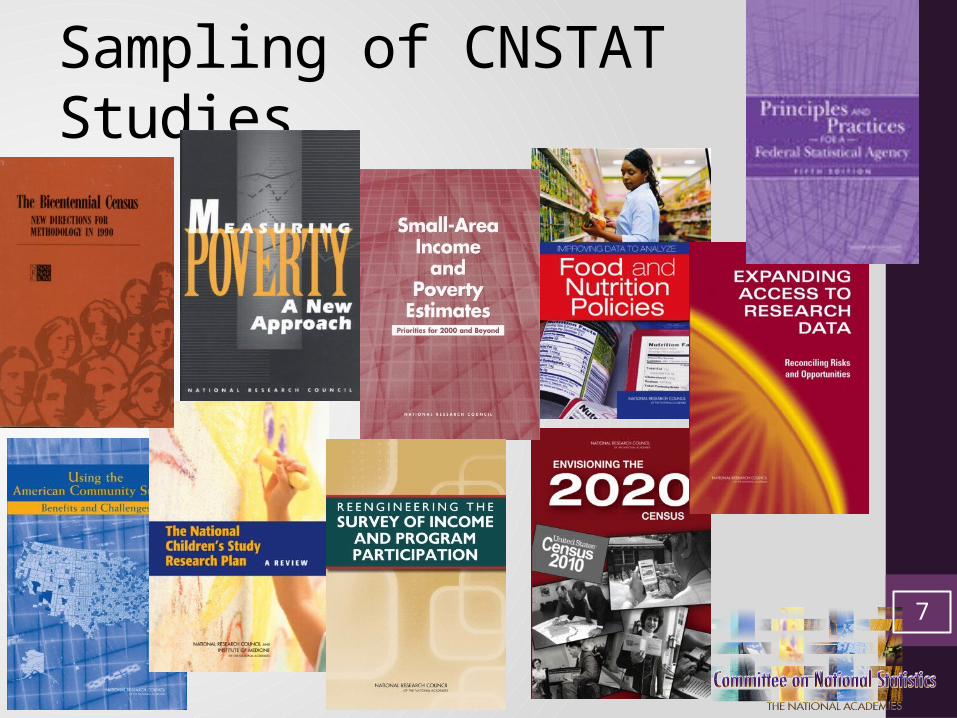
Sampling of CNSTAT Studies
7
Probability Sample Surveys the 20th Century Answer to Quicker, et al. Large-scale surveys in U.S. date to late 1930s
(Harris-Kojetin, 2012)
• 1937 – 2% sample of households on non-business postal routes estimated much higher number of unemployed than a “complete” (voluntary) census of all residential addresses
• 1940 – Census asked six questions on 5% sample basis
• 1940 – Monthly Report on the Labor Force (became the CPS)
• 1950 – Census asked two-fifths of questions on sample basis
Gave much more reliable information (could estimate sampling error) than non-probability samples and at greatly reduced cost and increased timeliness compared with censuses
Sample results readily accepted by the public
8
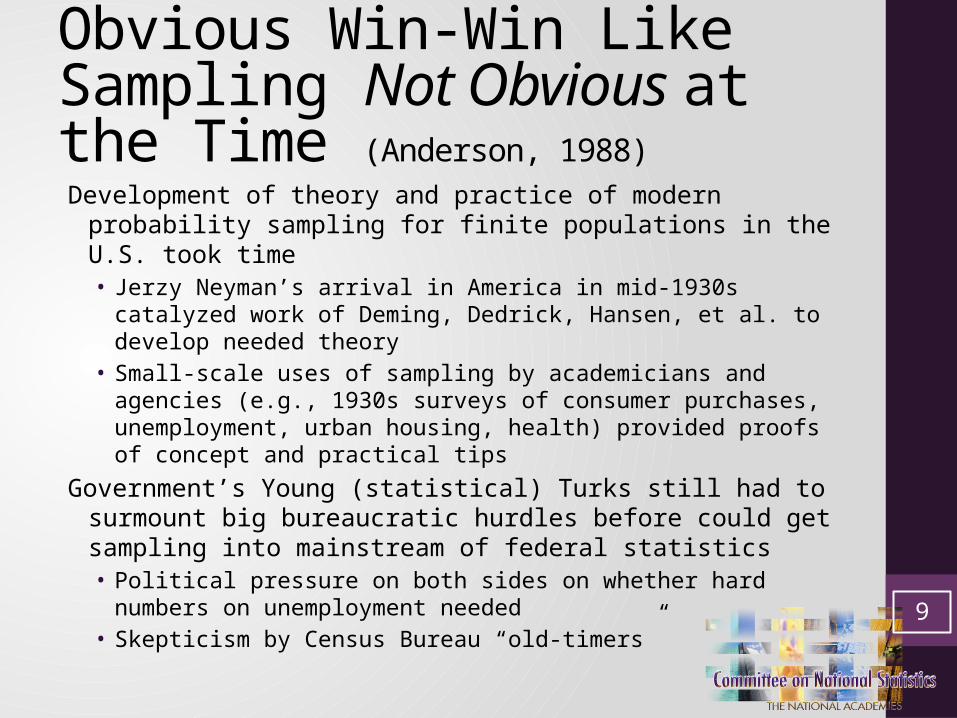
Obvious Win-Win Like Sampling Not Obvious at the Time (Anderson, 1988)Development of theory and practice of modern
probability sampling for finite populations in the U.S. took time• Jerzy Neyman’s arrival in America in mid-1930s
catalyzed work of Deming, Dedrick, Hansen, et al. to develop needed theory
• Small-scale uses of sampling by academicians and agencies (e.g., 1930s surveys of consumer purchases, unemployment, urban housing, health) provided proofs of concept and practical tips
Government’s Young (statistical) Turks still had to surmount big bureaucratic hurdles before could get sampling into mainstream of federal statistics• Political pressure on both sides on whether hard
numbers on unemployment needed• Skepticism by Census Bureau “old-timers”
9
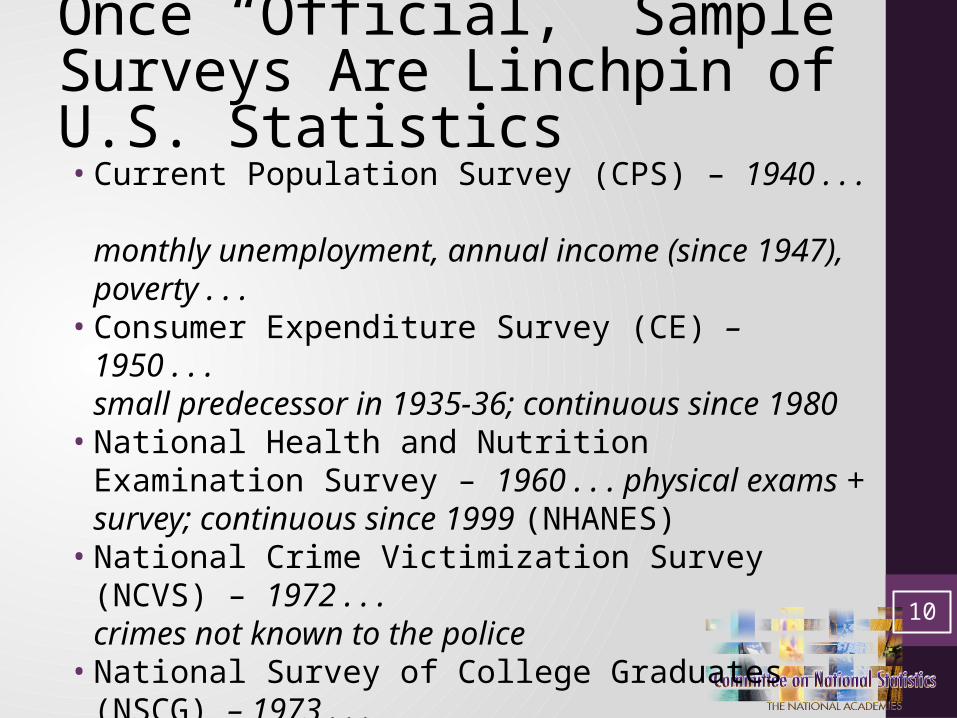
Once “Official,” Sample Surveys Are Linchpin of U.S. Statistics• Current Population Survey (CPS) – 1940 . . .
monthly unemployment, annual income (since 1947), poverty . . . • Consumer Expenditure Survey (CE) – 1950 . . .
small predecessor in 1935-36; continuous since 1980• National Health and Nutrition Examination
Survey – 1960 . . . physical exams + survey; continuous since 1999 (NHANES) • National Crime Victimization Survey (NCVS) –
1972 . . .crimes not known to the police• National Survey of College Graduates (NSCG) –
1973 . . .Sample drawn from census (then ACS) followed every 2 years• American Community Survey (ACS) – 2005 . . .
Continuous measurement for small areas; sampling for nonresponse follow-up (replacement for census long-form sample)
10
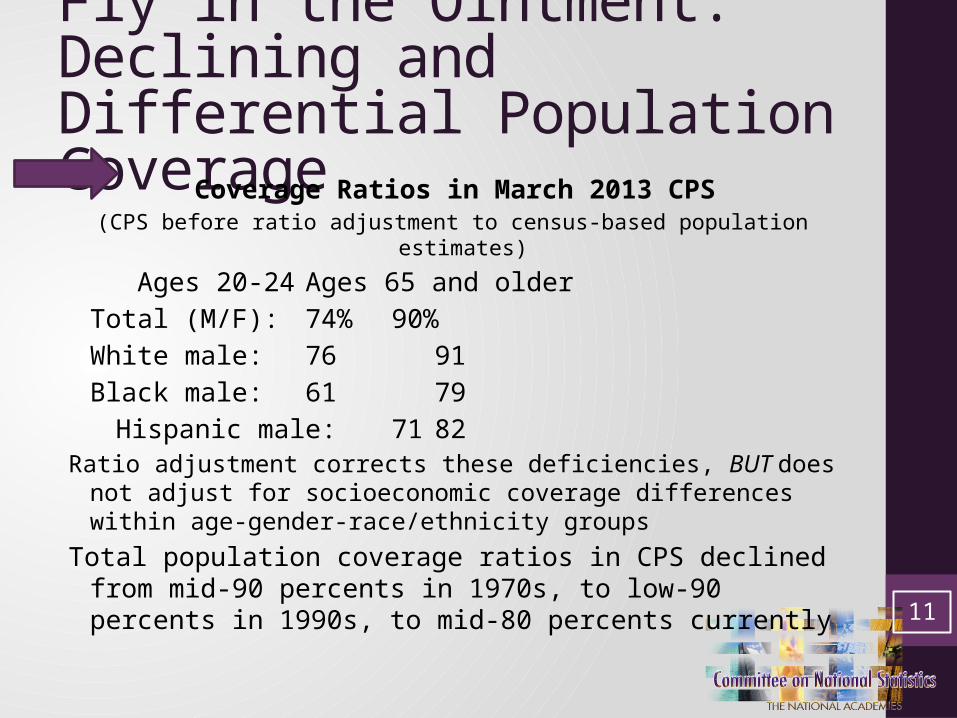
Fly in the Ointment: Declining and Differential Population Coverage
Coverage Ratios in March 2013 CPS (CPS before ratio adjustment to census-based population
estimates)
Ages 20-24 Ages 65 and olderTotal (M/F): 74% 90%White male: 76 91Black male: 61 79
Hispanic male: 71 82Ratio adjustment corrects these deficiencies, BUT does not
adjust for socioeconomic coverage differences within age-gender-race/ethnicity groups
Total population coverage ratios in CPS declined from mid-90 percents in 1970s, to low-90 percents in 1990s, to mid-80 percents currently
11
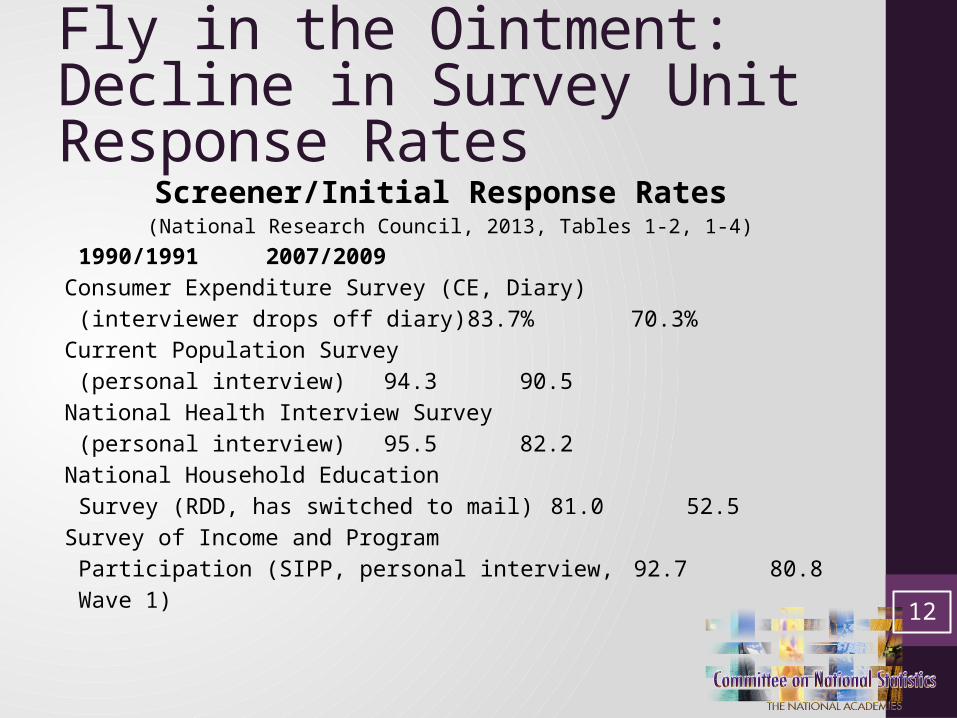
Fly in the Ointment: Decline in Survey Unit Response Rates
Screener/Initial Response Rates (National Research Council, 2013, Tables 1-2, 1-4)
1990/1991 2007/2009Consumer Expenditure Survey (CE, Diary)
(interviewer drops off diary) 83.7% 70.3%Current Population Survey
(personal interview) 94.3 90.5National Health Interview Survey (personal interview) 95.5 82.2National Household Education
Survey (RDD, has switched to mail) 81.0 52.5Survey of Income and Program
Participation (SIPP, personal interview,92.7 80.8Wave 1)
12

Fly in the Ointment: Decline in Survey Item Response Rates Proportion of Income Imputed, CPS/ASEC
and SIPP(Czajka, 2009, Table A-8)
1993 1997 2002Total Income – CPS 23.8%27.8%34.2%
SIPP 20.8 24.0 28.6Wages/Salaries – CPS 21.5 24.8 32.0
SIPP 17.7 20.5 24.9Property Income – CPS 42.4 52.8 62.6
SIPP 42.4 42.9 49.7Welfare Income – CPS 19.8 18.1 29.2
SIPP 13.8 31.2 32.8*ASEC: Annual Social and Economic Supplement to CPS
13
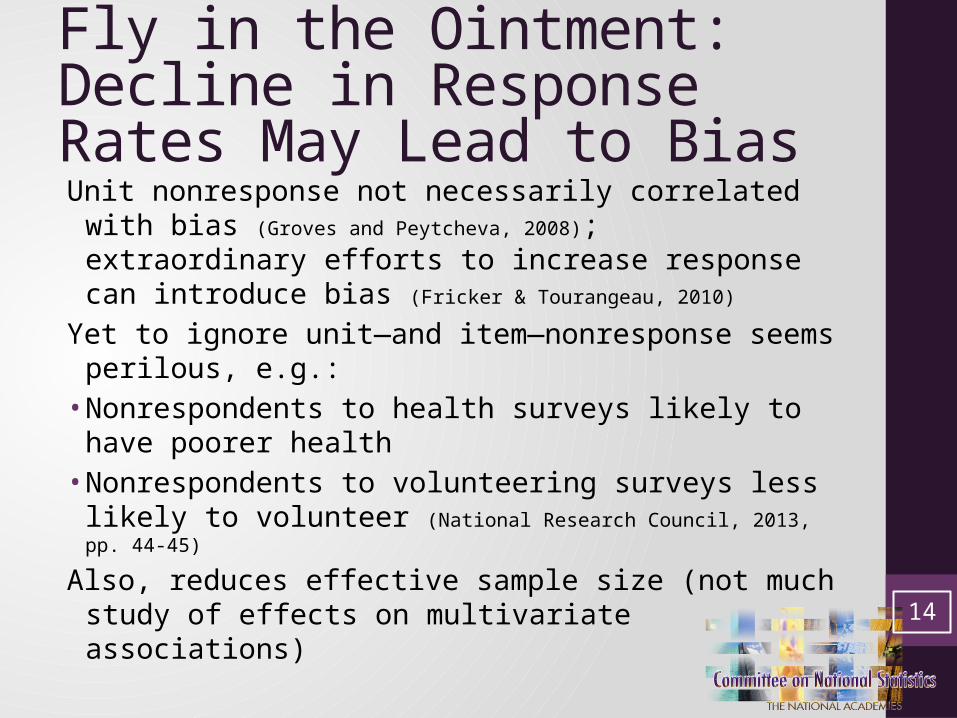
Fly in the Ointment: Decline in Response Rates May Lead to Bias Unit nonresponse not necessarily correlated
with bias (Groves and Peytcheva, 2008); extraordinary efforts to increase response can introduce bias (Fricker & Tourangeau, 2010)
Yet to ignore unit—and item—nonresponse seems perilous, e.g.:• Nonrespondents to health surveys likely to
have poorer health• Nonrespondents to volunteering surveys less
likely to volunteer (National Research Council, 2013, pp. 44-45)
Also, reduces effective sample size (not much study of effects on multivariate associations)
14

Measurement Error Problematic, and Not Well StudiedEven with imputation for item nonresponse, may be
misreporting: e.g., income/wealth often badly underreported with considerable variation by source; same for consumer expenditures . . . and getting worse
Percent of Administrative Benchmark, CPS/SIPPAggregate Benefits 1987 2005
SNAP – CPS 74.2%54.6%(food stamps) SIPP 85.9 76.4AFDC/TANF – CPS 74.4 48.7 (“welfare”) SIPP 73.0 62.2OASI – CPS 89.0 89.7(Social Security) SIPP 95.0 97.4
Aggregate Wealth (SIPP, 1998-99) – 55% of SCFAggregate Liabilities – 90% of SCF
(Czajka, 2009:Table A-5; p. 144) SCF: Survey of Consumer Finances
15
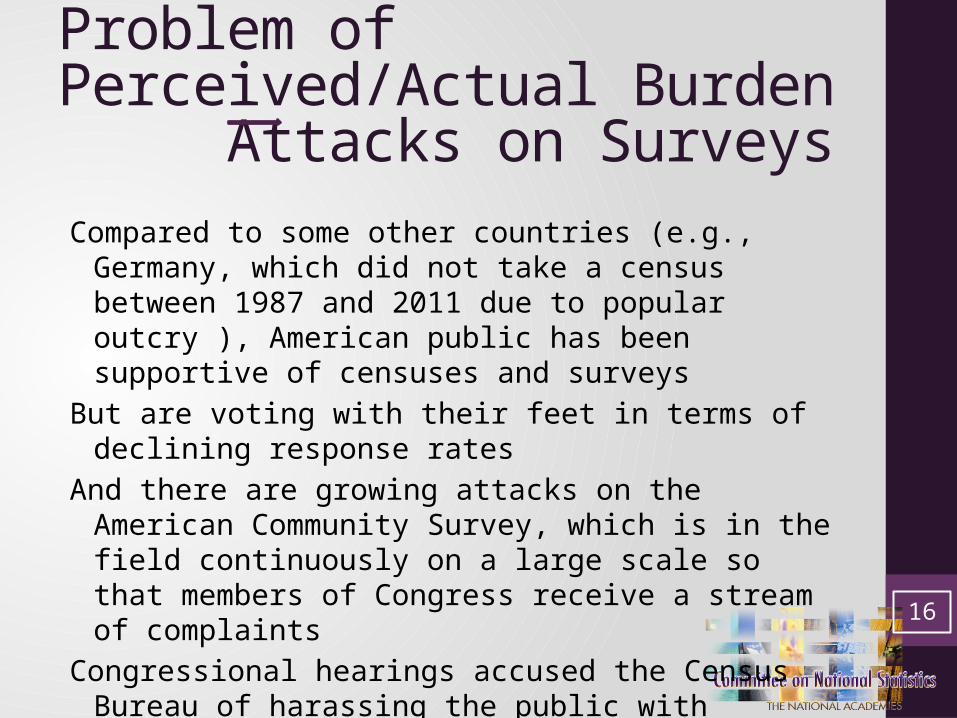
Problem of Perceived/Actual Burden Attacks on SurveysCompared to some other countries (e.g., Germany,
which did not take a census between 1987 and 2011 due to popular outcry ), American public has been supportive of censuses and surveys
But are voting with their feet in terms of declining response rates
And there are growing attacks on the American Community Survey, which is in the field continuously on a large scale so that members of Congress receive a stream of complaints
Congressional hearings accused the Census Bureau of harassing the public with repeated calls/visits to get a response, and there are repeated threats to make responses voluntary
16
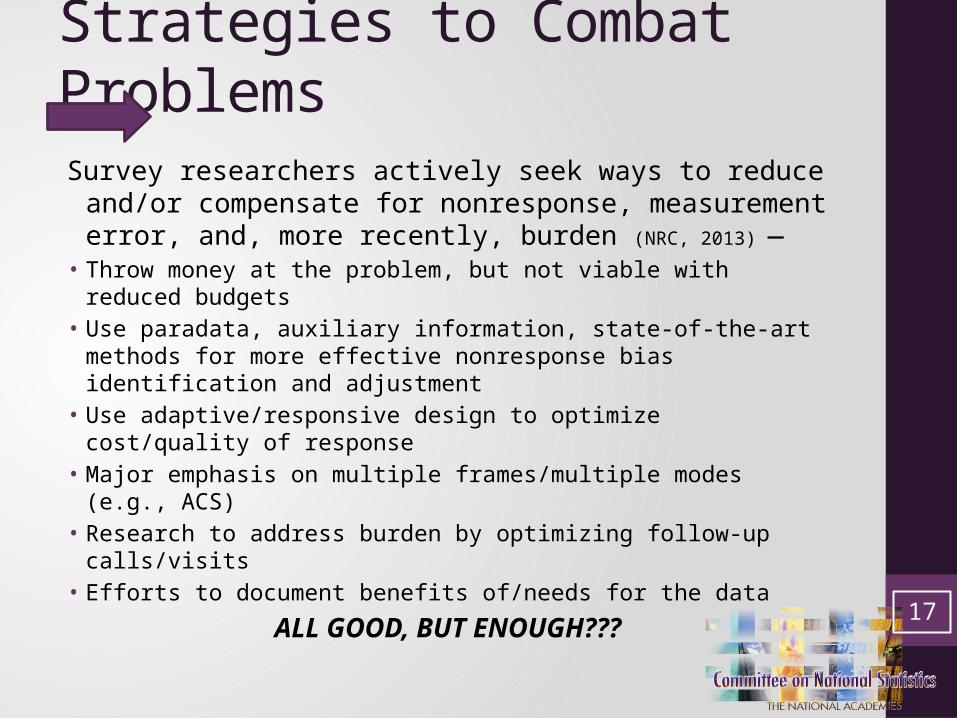
Strategies to Combat Problems Survey researchers actively seek ways to reduce
and/or compensate for nonresponse, measurement error, and, more recently, burden (NRC, 2013) —
• Throw money at the problem, but not viable with reduced budgets
• Use paradata, auxiliary information, state-of-the-art methods for more effective nonresponse bias identification and adjustment
• Use adaptive/responsive design to optimize cost/quality of response
• Major emphasis on multiple frames/multiple modes (e.g., ACS)
• Research to address burden by optimizing follow-up calls/visits
• Efforts to document benefits of/needs for the data
ALL GOOD, BUT ENOUGH??? 17

New Paradigm—Multiple Data Sources from the
Get-GoSurvey problems—costs, coverage error, unit/item
nonresponse, measurement error, conceptual mismatches, burden concerns—cannot be fully addressed by holding fast to survey paradigm as single best source for official statistics
Indeed, no single source can stand alone—2011 German census revealed significant overestimation by registers (used since last census in 1987), due to failure to identify foreign-born emigrants
The operative paradigm should be to work backwards from policy and public information needs to combination of sources that optimizes relevance, accuracy, costs, timeliness, and burden
18
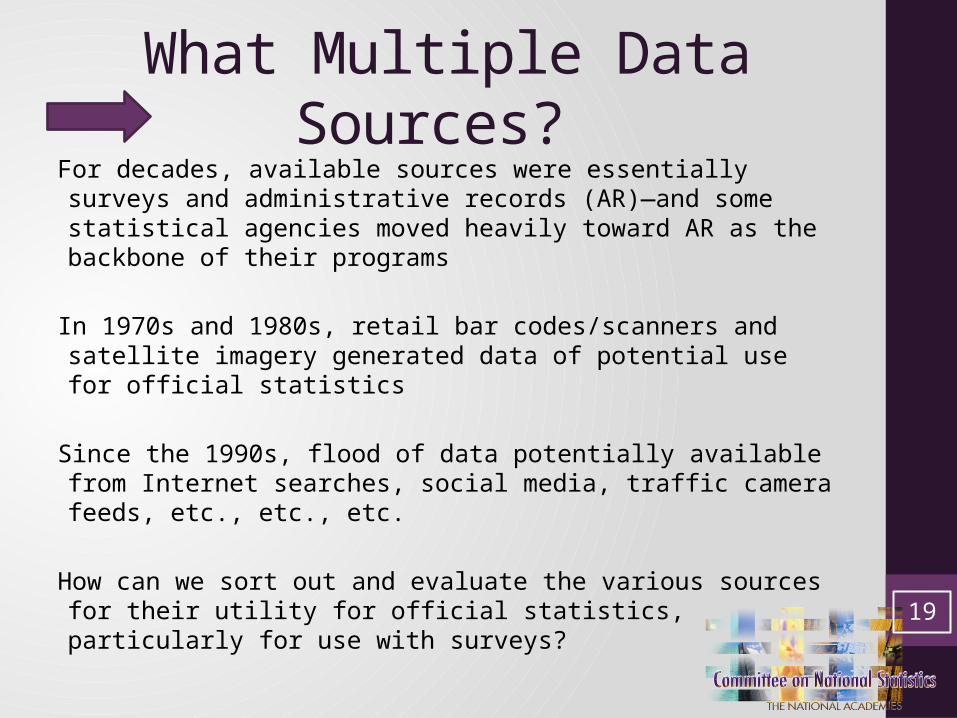
What Multiple Data Sources?
For decades, available sources were essentially surveys and administrative records (AR)—and some statistical agencies moved heavily toward AR as the backbone of their programs
In 1970s and 1980s, retail bar codes/scanners and satellite imagery generated data of potential use for official statistics
Since the 1990s, flood of data potentially available from Internet searches, social media, traffic camera feeds, etc., etc., etc.
How can we sort out and evaluate the various sources for their utility for official statistics, particularly for use with surveys?
19
Need—and Still Searching for— Useful
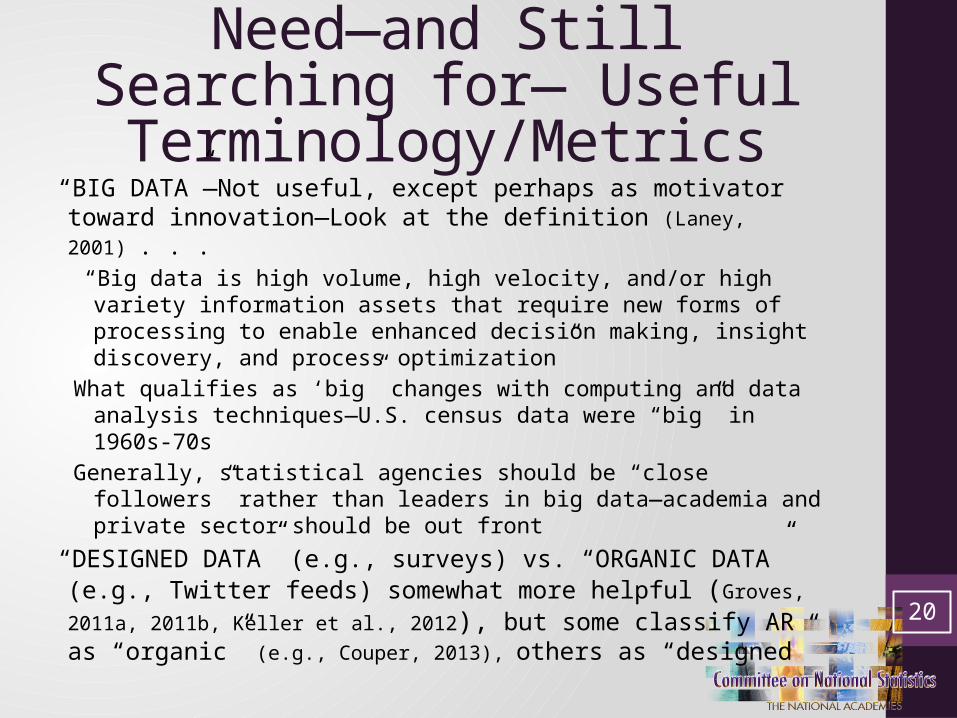
Terminology/Metrics“BIG DATA”—Not useful, except perhaps as motivator toward innovation—Look at the definition (Laney, 2001) . . . “Big data is high volume, high velocity, and/or high variety
information assets that require new forms of processing to enable enhanced decision making, insight discovery, and process optimization”
What qualifies as ‘big” changes with computing and data analysis techniques—U.S. census data were “big” in 1960s-70s
Generally, statistical agencies should be “close followers” rather than leaders in big data—academia and private sector should be out front
“DESIGNED DATA” (e.g., surveys) vs. “ORGANIC DATA” (e.g., Twitter feeds) somewhat more helpful (Groves, 2011a,
2011b, Keller et al., 2012), but some classify AR as “organic” (e.g., Couper, 2013), others as “designed”
20
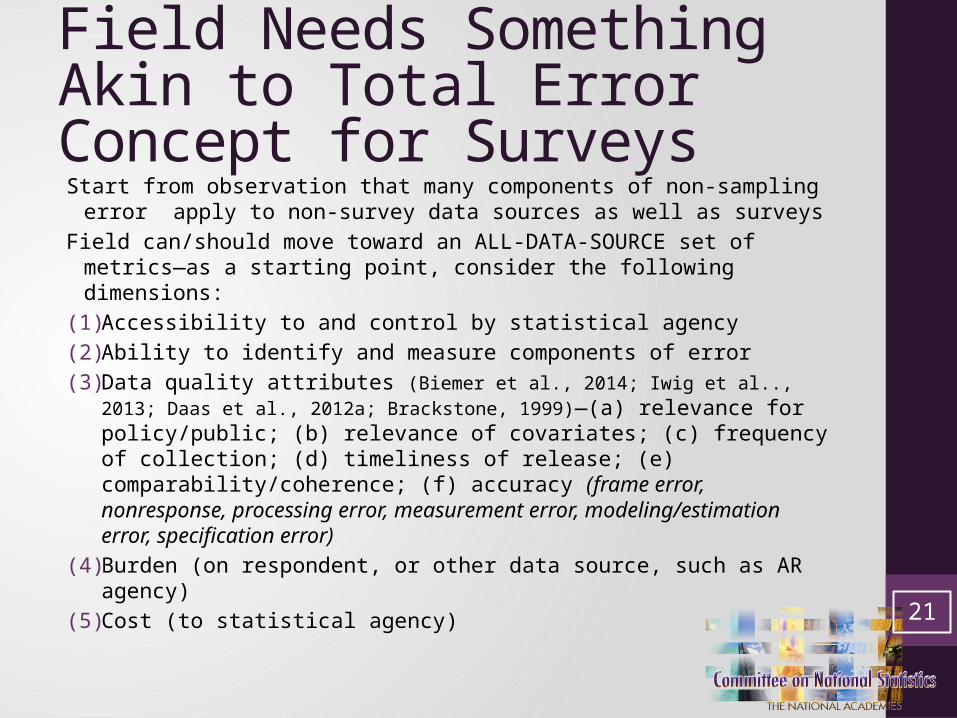
Field Needs Something Akin to Total Error Concept for SurveysStart from observation that many components of non-sampling
error apply to non-survey data sources as well as surveysField can/should move toward an ALL-DATA-SOURCE set of
metrics—as a starting point, consider the following dimensions:(1) Accessibility to and control by statistical agency(2) Ability to identify and measure components of error(3) Data quality attributes (Biemer et al., 2014; Iwig et al.., 2013; Daas
et al., 2012a; Brackstone, 1999)—(a) relevance for policy/public; (b) relevance of covariates; (c) frequency of collection; (d) timeliness of release; (e) comparability/coherence; (f) accuracy (frame error, nonresponse, processing error, measurement error, modeling/estimation error, specification error)
(4) Burden (on respondent, or other data source, such as AR agency)
(5) Cost (to statistical agency)21
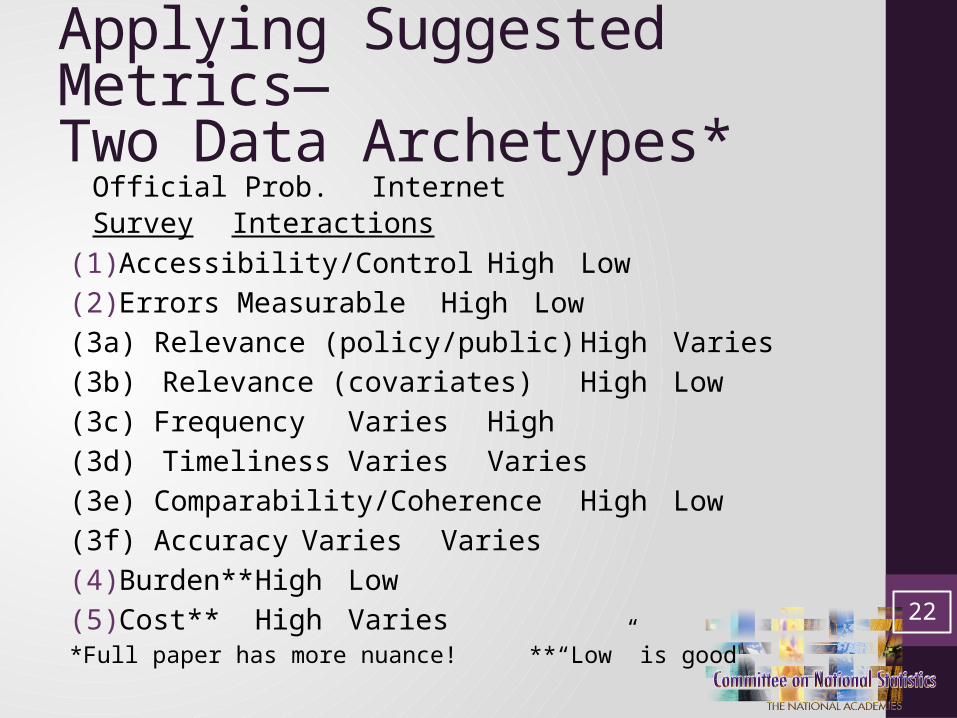
Applying Suggested Metrics—Two Data Archetypes*
Official Prob. Internet
SurveyInteractions
(1) Accessibility/Control High Low(2) Errors Measurable High Low(3a) Relevance (policy/public) High Varies(3b) Relevance (covariates) High Low(3c) Frequency Varies High(3d) Timeliness Varies Varies(3e) Comparability/Coherence High Low(3f) Accuracy Varies Varies(4) Burden** High Low(5) Cost** High Varies*Full paper has more nuance! **“Low” is good
22
Surveys Look Good on [Crude] Metrics–So Why Change Paradigm?Surveys look good, comparatively;
autonomously-generated Internet interactions (e.g., social media) look bad, with AR and commercial transactions (not shown) in between
But many official surveys don’t look nearly as good as they would have 30, 40, or 50 years ago, particularly on components of accuracy, and they are increasingly high on burden and costs
New paradigm of multiple data sources could use AR and other sources to compensate for growing weaknesses of surveys
23
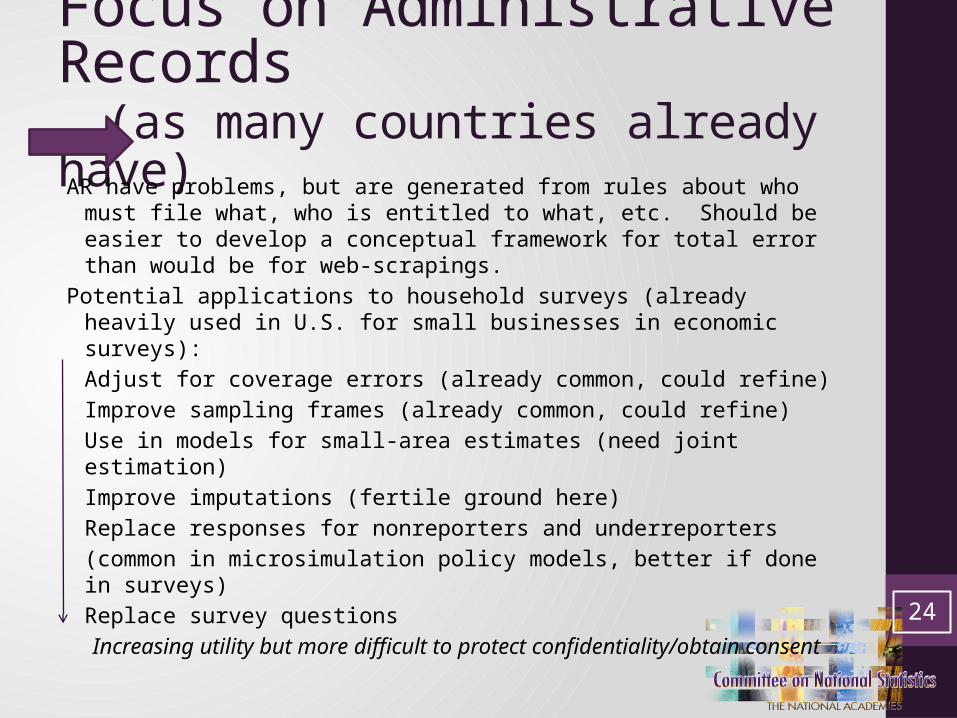
Focus on Administrative Records
(as many countries already have)AR have problems, but are generated from rules about who
must file what, who is entitled to what, etc. Should be easier to develop a conceptual framework for total error than would be for web-scrapings.
Potential applications to household surveys (already heavily used in U.S. for small businesses in economic surveys): Adjust for coverage errors (already common, could refine)Improve sampling frames (already common, could refine)Use in models for small-area estimates (need joint estimation)Improve imputations (fertile ground here)Replace responses for nonreporters and underreporters (common in microsimulation policy models, better if done in surveys)Replace survey questions
Increasing utility but more difficult to protect confidentiality/obtain consent
24
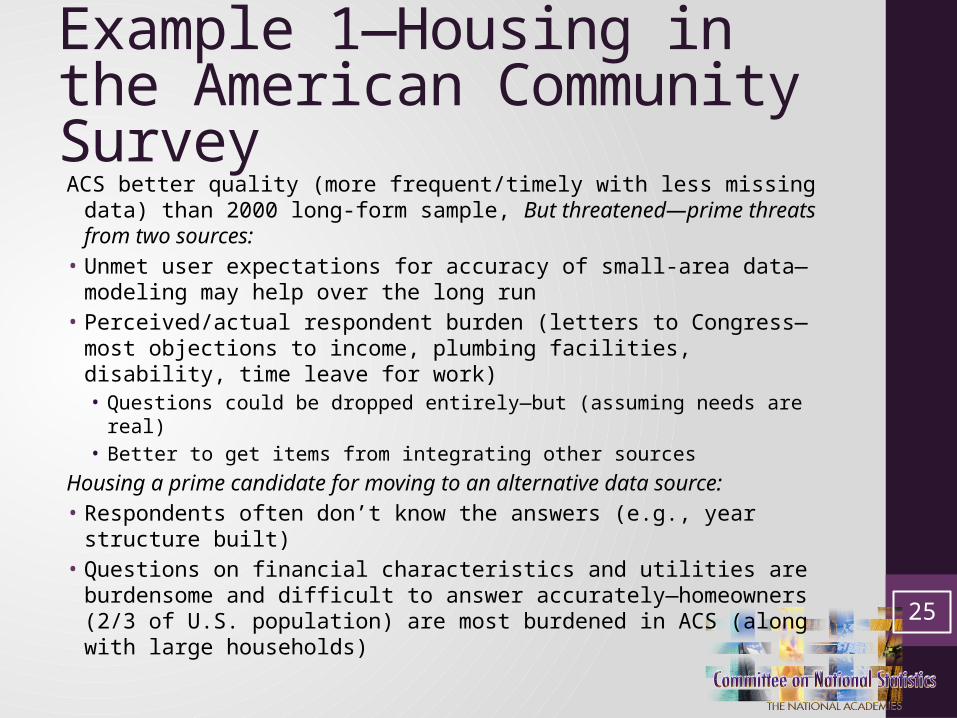
Example 1—Housing in the American Community Survey ACS better quality (more frequent/timely with less missing data)
than 2000 long-form sample, But threatened—prime threats from two sources:
• Unmet user expectations for accuracy of small-area data—modeling may help over the long run
• Perceived/actual respondent burden (letters to Congress—most objections to income, plumbing facilities, disability, time leave for work)• Questions could be dropped entirely—but (assuming needs are real)• Better to get items from integrating other sources
Housing a prime candidate for moving to an alternative data source:
• Respondents often don’t know the answers (e.g., year structure built)
• Questions on financial characteristics and utilities are burdensome and difficult to answer accurately—homeowners (2/3 of U.S. population) are most burdened in ACS (along with large households)
25
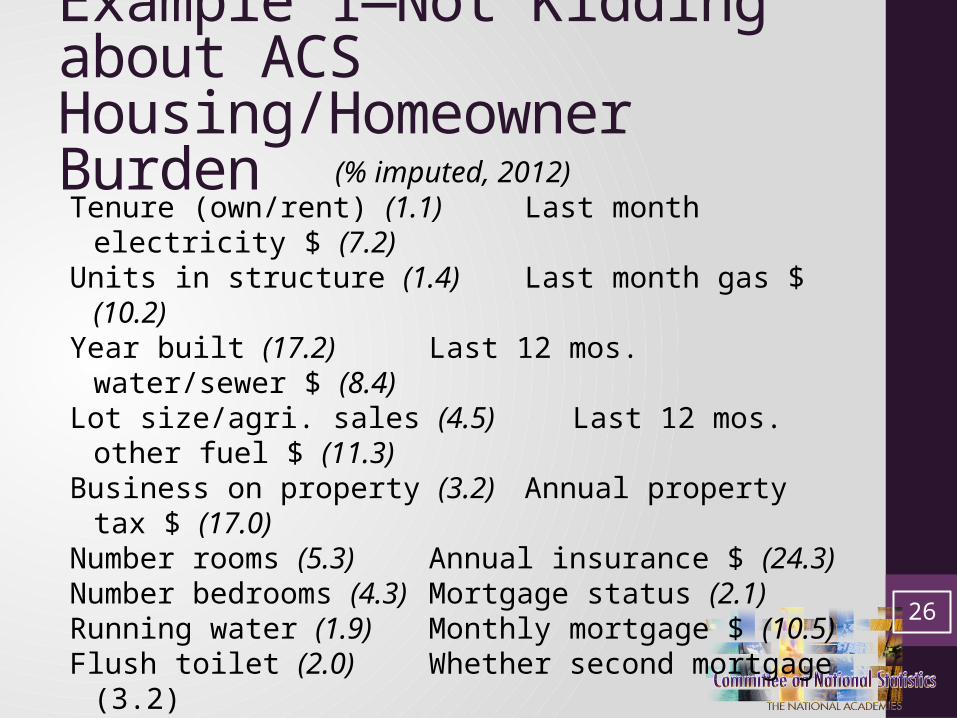
Example 1—Not Kidding about ACS Housing/Homeowner Burden (% imputed, 2012)Tenure (own/rent) (1.1) Last month
electricity $ (7.2)Units in structure (1.4) Last month gas $
(10.2)Year built (17.2) Last 12 mos.
water/sewer $ (8.4)Lot size/agri. sales (4.5) Last 12 mos.
other fuel $ (11.3) Business on property (3.2) Annual property tax $
(17.0)Number rooms (5.3) Annual insurance $
(24.3)Number bedrooms (4.3) Mortgage status (2.1)Running water (1.9) Monthly mortgage $
(10.5)Flush toilet (2.0) Whether second
mortgage (3.2)Bathtub/shower (2.0) Whether home
equity loan (3.9)Sink with a faucet (2.0) Other mortgage
$ (18.4)Stove or range (2.5) Annual mobile home $
(21.2)Refrigerator (2.7) Property value (13.2)Heating fuel (3.4) Monthly rent (9.2)
26
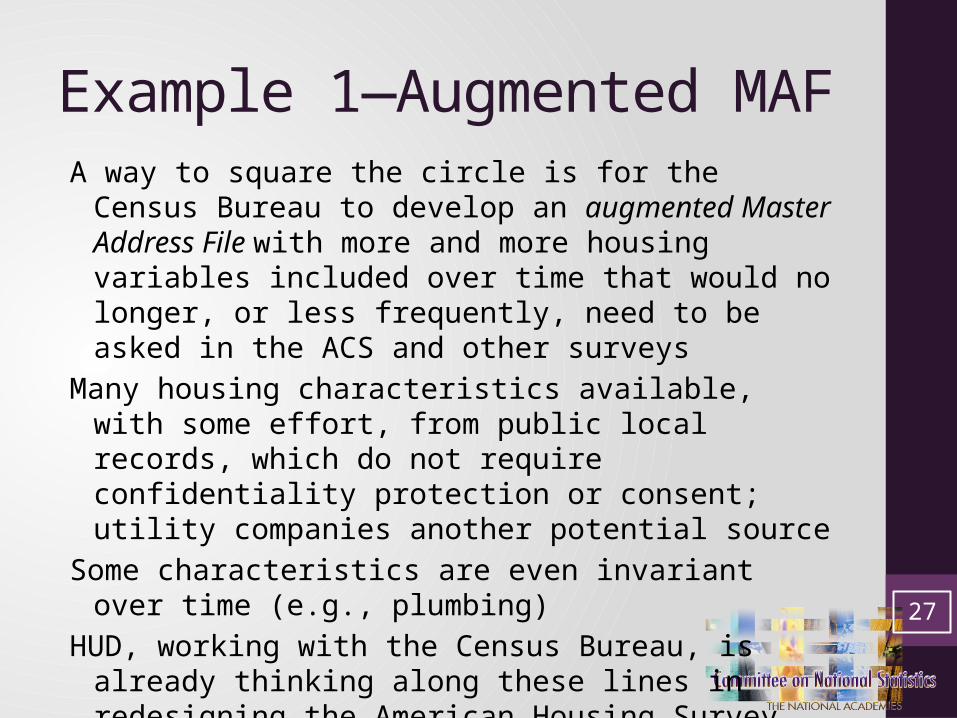
Example 1—Augmented MAF A way to square the circle is for the Census Bureau
to develop an augmented Master Address File with more and more housing variables included over time that would no longer, or less frequently, need to be asked in the ACS and other surveys
Many housing characteristics available, with some effort, from public local records, which do not require confidentiality protection or consent; utility companies another potential source
Some characteristics are even invariant over time (e.g., plumbing)
HUD, working with the Census Bureau, is already thinking along these lines in redesigning the American Housing Survey
Which is better—to work out the myriad kinks in moving toward an augmented MAF, or risk the loss of the ACS?
27

Example 2—Income in Surveys CPS/ASEC is flagship for U.S. household income and
poverty statistics, which influence policies and programsACS income estimates important for small areas and
groupsSIPP income estimates key for more nuanced
understanding of economic well-being and changes over periods of time
Other surveys need good income measures without adding burden
BUT high, increasing, and variable levels of imputation and underreporting for income
Flagship survey, CPS, captures less and less of comparable income as measured in the National Accounts: 90 percent in 1999 vs. 82 percent in 2010 (Fixler and Johnson, 2012:Table 2)
28
Example 2—Better Income Estimates through Multiple Sources Suggested steps forward:• Improve population coverage adjustments in CPS
et al., by, e.g., post-stratifying race/ethnicity categories by total income (from IRS? ACS?), so that coverage adjustments (partly) capture SES
• Move strategically, source by source, to improve imputations of income amounts—and receipt—in major income surveys by use of administrative records; Census already has access to many records—although not all in one place—and is working to get more (e.g., SNAP) as part of 2020 census planning
• Move—carefully—toward Canadian model, whereby respondents can skip entire blocks of income questions by permitting access to their administrative records
29
Example 2—Pipedream?? Not with Vision and Long-term Planning Daunting to seek improvements in income estimates by linking
administrative records to surveys:• Legal/bureaucratic/“big brother” difficulties of obtaining
access• Consent issues if actual records are substituted for questions• Could risk timeliness due to lags in records receipt
(modeling)• Error structures of records not (yet) well known• Strain on headquarters staff (not like hiring/laying off field
staff)• Need for multiple, linked data processing systems
BUT, IMPROVEMENT IS IMPERATIVE—AND well-articulated, staged, strategic plan, starting from policy & public data needs, could empower statistical system to work toward quality gains coupled with reduced burden and costs
30

The Challenge of Effecting Paradigm Change
Statistical systems have admirable record of innovation, but changing paradigms is always difficult [recall earlier slide about obstacles to sampling]; particularly hard to rethink long-lived, ongoing, “comfortable” programs
Rare for companies to hit one home run after another; est. Fortune 500 company average life is 40-50 years (Business Week); most innovation from newcomers
Even harder for government because Schumpeter’s “creative destruction” not quite what one wants for government agencies serving public good– Trick is to make the harder work of government innovation a feature and not a bug
31
Barriers to Paradigm Change
Inertia—from coasting on earlier successes; enabled by data users, who want “their” series walled off from change
Monopoly (often associated with inadequate channels of communication and feedback)—private sector quasi-monopolies can disdain innovation until a newcomer outflanks them; govt. agencies, too, run risk of losing touch with users’ changing needs
Fear of undercutting existing business linesOveremphasis on “this is how we do things here”Unclear/faulty concept of primary goal—the
business of statistical agencies is serving user needs, not continuing long-standing data collection programs for their own sakes
Plus [for U.S.], decentralized statistical system32
Ways to Move ForwardLeadership buy-in at all levels of stat agency
essential to:• Think strategically about threats to current
ways of data collection (e.g., burden, underreporting) and prioritize remedies
• Bolster role and heft of subject-matter analysts to interface with outside users and inside data producers
• Staff operational programs with expertise in all relevant data sources, such as surveys and AR, on equal footing
• Rotate assignments within and without agency to foster innovative thinking and diverse perspectives—give survey researchers some user experience/vice versa
• Instill laser focus on policy uses and from there to appropriate data sources, and not on marginal changes to long-time survey x (or long-time AR system y)
33
BOTTOM LINEOfficial statistics agencies have shown ability to
make far-reaching changes in response to threats to established ways of doing business—2nd half of 20th
century gave us the probability survey paradigm; let’s move with alacrity in 21st century to paradigm
of using the best source(s) for policy and public needs
Constance CitroDirector • Committee on National Statistics
Full paper with references available from:[email protected] • (202) 334-3009
34