F o o t p r i n t E c o l o g y : E a s t D e v o n , E x e t e … and Liley... · F o o t p r i n...
119
F o o t p r i n t E c o l o g y : E a s t D e v o n , E x e t e r a n d T e i g n b r i d g e H o u s e h o l d S u r v e y
-
Upload
hoangkhuong -
Category
Documents
-
view
217 -
download
0
Transcript of F o o t p r i n t E c o l o g y : E a s t D e v o n , E x e t e … and Liley... · F o o t p r i n...

F o o t p r i n t E c o l o g y : E a s t D e v o n , E x e t e r a n d T e i g n b r i d g e H o u s e h o l d S u r v e y

F o o t p r i n t E c o l o g y : E a s t D e v o n , E x e t e r a n d T e i g n b r i d g e H o u s e h o l d S u r v e y

2
Date: 15th June 2012 Version: Phase 2 Recommended Citation: Cruickshanks, K. and Liley, D. (2012). East Devon, Exeter and Teignbridge Household Survey and Predictions of Visitor Use of Greenspaces. Footprint Ecology. Report commissioned by Teignbridge District Council/ East Devon District Council/Exeter City Council.

F o o t p r i n t E c o l o g y : E a s t D e v o n , E x e t e r a n d T e i g n b r i d g e H o u s e h o l d S u r v e y
1
Summary
The study area spans three local authority areas (Teignbridge, Exeter and East Devon). Extensive house building is planned here over the next 20 years: potentially around 40,000 homes. A critical issue facing strategic planners is how to accommodate this level of new housing without an adverse affect on the integrity of the local European protected wildlife sites. For some European sites, ‘diffuse’ impacts from public access and recreation have been identified as likely to cause significant effects. A series of studies are being undertaken to investigate these effects and devise a suite of mitigation measures to ensure no additional adverse effects from the proposed development on the special interest of the sites. Of several European protected wildlife sites in the area, public access/recreational use is of potential concern for three groups of sites: The Exe Estuary SPA, at the heart of the study area, is designated primarily for over-wintering and migrating waterfowl. It attracts high number of visitors for different activities including a variety of watersports. At the mouth of the Estuary is Dawlish Warren SAC, a sand spit with designated dune habitats, popular for walking and beach recreation. Current visitor pressure on the Estuary and Warren is already a cause of concern, without the additional increases likely to result from new house building. Dartmoor National Park lies to the west of the study area and is popular with residents as well as tourists for hiking and outdoor pursuits. South Dartmoor Woods SAC and Dartmoor SAC interest features include heathland, blanket bog, sessile oak woodland and the southern damselfly. Impacts from access and recreation are mostly very localised and may not constitute a ‘significant effect’ within these large SACs. In the east of the study area lie the Pebblebed Heaths SPA and SAC. These are a collection of commons designated for their heathland habitats, birdlife and southern damselfly. They have a relatively local pull due to their size, lack of visitor infrastructure and rural location, but current levels of access may be causing disturbance and localised damage. Detailed information was needed on the current visitor patterns of residents to these European sites and to put access patterns into context with other green spaces in the area. Some data existed on visitors to the Exe Estuary and Warren, but less information was available for Dartmoor and the Pebblebeds. A postal survey was therefore conducted to help fill these gaps and provide baseline information to inform strategic planning and possibly allow predictive impact models to be developed. The survey was sent to 5100 addresses in south Devon equally divided (1700 recipients each) between the Teignbridge District Council (TDC) area, the Exeter City Council (ECC) area and the East Devon District Council (EDDC) area. The questions addressed the choice of sites visited by each household, the frequency and reason for visiting, the activities undertaken and the mode of transport used to access the sites. The questionnaire was divided into sections focussing on ‘Coast and Estuaries’, ‘Dartmoor’ and ‘Other Countryside’. Within each section respondents were asked to comment on specific locations of interest to the study including specific subsections of the European sites. In addition respondents were given the opportunity to comment on further locations of their own choice and to provide free text responses. A total of 1296 households responded to the survey, a return rate of just over a quarter of households. The survey has generated a wide range of results regarding visitor patterns and activities in the study area. In particular:
F o o t p r i n t E c o l o g y : E a s t D e v o n , E x e t e r a n d T e i g n b r i d g e H o u s e h o l d S u r v e y
2
General
Virtually all (94%) of respondents stated that they had visited the seaside, woods, moors, country parks or other similar places for recreation in the previous year.
The Coast and Estuaries was the most popular location for recent visits compared to Dartmoor and Other Countryside sites. (The survey was sent out in early autumn).
The Coast and Estuaries and Other Countryside sites were visited with the same frequency all year round whereas Dartmoor was visited slightly more frequently in the winter.
Excluding Exeter, the settlements generating the most visits to European sites are Exmouth followed by Dawlish, Newton Abbot, Sidmouth and Teignmouth.
The Exe was the busiest of the three European site groups, with 67,662 annual visits from the responding households.
Visits to Dartmoor amount to less than half the number of visits made to the Exe (26,840 per year) and the Pebblebeds receives a third of the level of visitors to the Exe (at 20,724 per year).
Dawlish Warren and beach received 10,436 visits per year.
The majority of respondents either ’mainly visited’ the Exe (53%), or ‘mainly visited’ Dartmoor (33%).
Activities
For all sites, the activity undertaken by the most respondents was walking, within a few miles of home.
However, the activity undertaken most frequently was dog walking.
These findings are borne out at the 3 European sites: walking is the activity undertaken by the most respondents at all three sites. On the Exe and Dartmoor, walking also generates the most visits.
But on the Pebblebeds, a higher frequency of visits by a smaller number of respondents makes dog walking the activity generating the highest number of visits. Dog walking generates the second highest number of visits on the Exe and Dartmoor.
The third most popular activity on the Exe and the Pebblebeds is wildlife watching, while on Dartmoor it is visiting pubs/cafes, with wildlife watching in fourth place.
The local terrain does, of course influence what ‘outdoor’ activities occur: on Dartmoor hiking comes in fifth, with remote camping as the seventh most popular activity. On the Pebblebeds, horse riding is in fourth place with mounting biking sixth. On the Exe/Warren, beach activities come fifth (pub/café is fourth), but the ‘high profile’ seaside activities of watersports and bait/shellfish collecting have far fewer practitioners.
While dog walking and walking tend to be undertaken nearer to home, watersports and wildlife watching are popular activities undertaken further from home.
60% of respondents state that they undertake wildlife watching most months.
Half of all mountain bike users and 42% of all watersports users undertake their favoured activities (locally) at least once a month.
Dog walking occurred with the highest frequency (65% taking part most days) followed by walking in the countryside or coast (40% taking part most weeks).
60% of people who wildlife watch and 50% of mountain bike users and 42% of all watersports users take part locally at least once a month.
Demographics
Only about 6% of respondents never visited the coast/countryside. The proportion was slightly lower for Exeter (5.2%) than for Teignbridge and East Devon (both with about 6.7%).
The highest number of responses was from ‘retired households’ in Teignbridge and East Devon (32% and 36% of responses respectively). The highest number of Exeter responses was from ‘full-time employed households (29% with only 26% from ‘retired households’).

F o o t p r i n t E c o l o g y : E a s t D e v o n , E x e t e r a n d T e i g n b r i d g e H o u s e h o l d S u r v e y
3
The most common house type of respondents was either detached or semi-detached housing, as would be expected from the housing stock.
There was a significant association between those households that never visited the countryside and presence of retired or reduced-mobility household members.
On average, 21% of households that visit the countryside had a dog. But there was much variation, with dog ownership in East Devon households significantly higher than in Exeter.
Dog ownership was lower for the 77 households that stated that they never visit the countryside, at 6.5%.
Exe and Dawlish Warren
Responding households reported 67,662 visits per year to the Exe and Warren.
For the Exe and Warren as a whole, 53% of visits were made by East Devon residents, 28% by Exeter residents and 19% by Teignbridge residents.
As would be expected, there is local variation, with East Devon residents predominating at Exmouth sites, Teignbridge residents at the Warren and Exeter residents in ‘second place’ for most locations.
Over 60% of visits to Dawlish Warren Nature Reserve and beach made by Teignbridge residents, about 25% by Exeter residents and only about 13 % by East Devon residents.
The most popular sub-areas are Exmouth beach (31% of visits), ‘unspecified location’ (30%); the Warren (18%) and The Maer (14%).
The majority of visits to most locations on the Exe were made by car, with Dawlish Warren being the site with the highest proportion of car-borne visits, although 22,000 Exe visits were made by foot (32% of the total).
Residents living within 5km of the Exe estuary tend to visit disproportionately more than those living greater distances away. This trend was particularly notable for watersports visits.
For all activities and all modes of transport combined, visitor rates to the Exe tend to ‘flatten off’ at around 12km, although this distance is reduced to 5km for foot visitors.
41,470 visits a year are for walking, 13,867 for dog walking and 13,017 for wildlife watching. Pub/café generated 9,421 visits a year, followed by beach activities (7,478), cycling (5,087), amusements/kid’s activities (4,567), ‘other’ (3,065), watersports (1964) and fishing/bait collecting (1,234).
The proportion of visits which are really dependant on the ‘seaside’ landscape is rather small: 25% of visits for wildlife watching, beach activities, water sports or fishing; compared to 76% for walking, dog walking, pub, cycling or amusements.
Dartmoor
Respondents reported that they made 26,840 visits per year to Dartmoor.
Most visits to the Moor were made by Teignbridge residents: 58% compared to 22% from Exeter and 19% from East Devon).
The most popular locations on Dartmoor overall were Dartmeet, Postbridge and Steps Bridge, although for Teignbridge residents these sites ranked third, fourth and fifth, after Widecombe-in-the-Moor and Yarner Wood.
A suite of sites on the south east edge of the Moor where significantly more popular with Teignbridge residents than with others: Widecombe, Yarner, Haytor, Lustleigh Cleave/Bovey Valley, Newbridge and Holne Moor.
88% of visits to Dartmoor were made by car.
Respondents living within 2-3km of Dartmoor visit the site around 150 times per year.
Visit rates ‘flatten off’ at around 8-10km from the National Park boundary.
19,213 visits were for walking, 5742 for dog walking, 4,851 for pub/café, 3,496 for wildlife watching, 18,46 for hiking, 568 for cycling, 490 for remote camping, 410 for mountain biking, 134 for rock climbing, 108 for off-roading and 79 for horse-riding.

F o o t p r i n t E c o l o g y : E a s t D e v o n , E x e t e r a n d T e i g n b r i d g e H o u s e h o l d S u r v e y
4
Pebblebeds
20,724 annual visits were reported for the Pebblebed Heaths
Most visits (83%) came from East Devon residents, with only 12% by Exeter residents and 5% by Teignbridge residents.
For residents of all three districts, the most visited sub-site was Woodbury (35% of visits), followed by Lympstone Common (16%) and Colaton Raleigh (15%).
80% of visits to the Pebblebeds were made by car and 10% were made on foot.
Visit rates ‘flatten off’ at around 10km from the Pebblebeds.
Most visits were for dog walking (53%) and 90% of the dog walkers were East Devon residents.
10,942 visits were for dog walking, 10,343 for walking, 4,032 for wildlife watching, 1,474 for horse-riding,1,106 for kid’s activities, 1,075 for mountain biking, 635 for pub/café, 548 for cycling and 264 for other activities.
The implications of these results are discussed within the report in relation to strategic planning and impacts upon the target European Protected sites (Exe, Warren, Dartmoor and Pebblebeds). Settlements adjacent to the sites tend to use them more, although Dartmoor attracted visitors more equally from the three local authority districts. The final chapter outlines the steps followed to generate a spreadsheet which uses the visit rate curves, settlement distances and visit rates by distance from sites to enable prediction of the number of additional visits made to each site as a result of new housing.

F o o t p r i n t E c o l o g y : E a s t D e v o n , E x e t e r a n d T e i g n b r i d g e H o u s e h o l d S u r v e y
5
Contents
Summary ................................................................................................................................. 1
Contents .................................................................................................................................. 5
Acknowledgements ................................................................................................................. 6
1. Introduction .................................................................................................................. 7
Overview .............................................................................................................................................. 7
The need to make the link between recreational access and housing ................................................. 7
Key sites and existing work .................................................................................................................. 8
Other sites.......................................................................................................................................... 10
Off-site visitor surveys ....................................................................................................................... 10
Aims of this report ............................................................................................................................. 11
2. Methods ..................................................................................................................... 12
Questionnaire design ......................................................................................................................... 12
Questionnaire design issues ............................................................................................................... 13
Selection of Addresses ....................................................................................................................... 13
Mailing Dates ..................................................................................................................................... 14
Data collation and error rates ............................................................................................................ 14
Categorising sites ............................................................................................................................... 14
Analysis .............................................................................................................................................. 15
Total visitor numbers to particular sites and for different activities .................................................. 15
3. Results overview......................................................................................................... 16
Response rate, distribution and demographics of respondents ......................................................... 16
Respondents that did not visit the countryside.................................................................................. 18
General Patterns of Access ................................................................................................................. 20
Types of outdoor activities ................................................................................................................. 22
4. Visits to the Exe Estuary ............................................................................................. 25
Summary ............................................................................................................................................ 25
Visitor rates to the Exe ....................................................................................................................... 34
Visit rates to Dawlish Warren Nature Reserve and Beach .................................................................. 35
5. Visits to Dartmoor ...................................................................................................... 38
Additional locations on Dartmoor ...................................................................................................... 46
Visit rates to Dartmoor ...................................................................................................................... 47
6. Visits to the Pebblebed Heaths ................................................................................... 50
Visit rates to the Pebblebeds ............................................................................................................. 57
7. Visits to other coastal locations .................................................................................. 60
Visits to specific locations .................................................................................................................. 60
Visits to free choice locations ............................................................................................................. 62
8. Visits to other countryside locations .......................................................................... 64

F o o t p r i n t E c o l o g y : E a s t D e v o n , E x e t e r a n d T e i g n b r i d g e H o u s e h o l d S u r v e y
6
Visits to free choice locations ............................................................................................................. 66
9. Relative use of the Exe, Dartmoor and the Pebblebed Heaths ................................... 69
10. Predicting visits to European Sites .............................................................................. 79
Distances between settlements and European sites .......................................................................... 79
Visit rates by distance from European sites ....................................................................................... 83
Distance to the coast and visit rates .................................................................................................. 95
11. Discussion ................................................................................................................... 97
Recreational access ............................................................................................................................ 97
Factors of concern with respect to data quality ................................................................................. 97
Implications for Strategic Planning and Management of Visitor Flows .............................................. 98
Similar work on the impacts of development around European Sites ................................................ 98
Efficacy of SANGs ............................................................................................................................. 102
Future changes in visitor behaviour ................................................................................................. 103
Economic assessment ...................................................................................................................... 104
Predicting visitor rates: data considerations .................................................................................... 105
References ........................................................................................................................... 106
Appendices .......................................................................................................................... 108
Appendix 1 the survey questionnaire sent to 5100 properties ......................................................... 108
Appendix 2 additional free text coastal locations ............................................................................ 113
Appendix 3 additional free text countryside locations ..................................................................... 115
Acknowledgements
This survey and report was commissioned by a consortium of three local authorities: East Devon District Council (EDDC), Exeter City Council (ECC) and Teignbridge District Council (TDC). This version of the report builds on the original version and the additions were commissioned (on behalf of the consortium) by Matt Dickens (East Devon District Council). Natural England and Dartmoor National Park Authority were partners in the project development process. We are grateful to Amanda Newsome (NE) for her input into the work. The development of the questionnaire design was led by Mary Rush (TDC) and co-ordination of the questionnaire postage and data entry was undertaken by April Waterman (EDDC) and Martin Davies (ECC).
F o o t p r i n t E c o l o g y : E a s t D e v o n , E x e t e r a n d T e i g n b r i d g e H o u s e h o l d S u r v e y
7
1. Introduction
Overview
1.1 This report presents the results of a household survey of residents of Exeter City, East
Devon and Teignbridge council administrative areas. The survey was commissioned to
provide a strategic overview of the recreational use of countryside sites, and in particular
to consider a selection of sites that are important for nature conservation. Understanding
the links between where people live and where they go in the countryside is necessary to
inform strategic planning. New housing changes the spatial distribution of people, and can
result in an increase in the number of people living near key sites. Levels of recreational
use may also increase, and for some sites such use can have deleterious effects.
Understanding the links between where people live and recreational use of the
countryside is therefore necessary in order to determine how patterns of access will
change, the consequences of these changes and measures which may be necessary to
resolve any issues.
The need to make the link between recreational access and housing
1.2 Recreational use of the UK countryside is increasing, with a growing population enjoying a
wider range of recreational pursuits in the outdoors (CCW & FC 2009; TNS Research
International Travel & Tourism 2010). It is increasingly recognised that access to the
countryside has wide benefits such as increasing people’s awareness of the natural world
and health benefits (English Nature 2002; Alessa, Bennett, & Kliskey 2003; Morris 2003;
Bird 2004; Pretty et al. 2005).
1.3 There are however, circumstances where visitors can have a detrimental effect on the
sites they visit, for example through disturbance or from trampling. There is a large body
of scientific literature and unpublished reports addressing the impacts of access (for
reviews see Hockin et al. 1992; Liddle 1997; Nisbet 2000; Saunders et al. 2000; Buckley
2004; Kirby et al. 2004; Woodfield & Langston 2004; Lowen et al. 2008). Such impacts are
of most concern on sites of high nature conservation interest, in particular where the
recreational use results in damage to European Protected sites, which have strict legal
protection.
1.4 European sites are protected through the provisions of the Conservation of Habitats and
Species Regulations 2010 (SI no. 490), usually referred to as ‘the Habitat Regulations’.
These Regulations transpose the requirements of both the Habitats Directive (Council
Directive 92/43/EEC) and the Wild Birds Directive (Council Directive 79/409/EEC) into UK
law. Article 6(2) of the Habitats Directive requires Member States to take appropriate
steps to avoid the deterioration of natural habitats and the habitats of species and avoid
the disturbance of species. Article 6(2) states that “Member States shall take appropriate
steps to avoid..... deterioration of natural habitats.... as well as disturbance of the
species...”; thereby putting a responsibility on the Member State to address such issues
where they arise. The wording of the Directive is such that it is clear that there is an

F o o t p r i n t E c o l o g y : E a s t D e v o n , E x e t e r a n d T e i g n b r i d g e H o u s e h o l d S u r v e y
8
ongoing responsibility to ensure that European sites remain in, or are managed to enable
them to return to, a healthy and viable ecological state.
1.5 Regulation 61 implements the provisions of Article 6(3) of the Habitats Directive such that
competent authorities can only agree to a plan or project which is likely to have a
significant effect on a European site (either alone or in-combination) after having
ascertained that it will not adversely affect the integrity of any European site (subject to
exceptional cases where there are no alternative solutions and where there are imperative
reasons of over-riding public interest for the plan or project). Impacts from recreation
arising as a direct or indirect result of one particular or a number of plans or projects
should therefore be prevented through the correct application of Regulation 61 by
competent authorities.
1.6 The separation of the ongoing duty of care set out within Article 6(2) and the specific
requirement for the assessment of plans and projects under Article 6(3) therefore leads to
a separation in the consideration of disturbance issues, with Habitats Regulations
Assessments generally making a clear distinction between disturbance associated with or
occurring as a result of a plan or project, and other disturbance issues, normally those
already in place and to which a link to specific plan(s) or project(s) cannot reasonably be
established.
1.7 Strategic plans for future development must be subject to assessment under Article 6(3),
and in order to conduct such an assessment it is necessary to have some understanding of:
The current and potential impacts of recreation on relevant sites
The likely levels of change in access and use as a result of proposed development
The consequences of the increased recreation
What options are possible to resolve the impacts identified
1.8 This report is a step towards the second bullet, providing a strategic overview of access to
selected sites, establishing the links between where people live and how frequently they
visit key sites. It will also help inform the fourth bullet, by identifying where mitigation
measures might be effective.
Key sites and existing work
1.9 The key European Protected sites that are particularly relevant to the three local
authorities and where access impacts are relevant are:
The Exe Estuary SPA/Ramsar
Dawlish Warren SAC
East Devon Pebblebed Heaths SAC/East Devon Heaths SPA
Dartmoor SAC/South Dartmoor Woods SAC
1.10 These are considered in more detail below.

F o o t p r i n t E c o l o g y : E a s t D e v o n , E x e t e r a n d T e i g n b r i d g e H o u s e h o l d S u r v e y
9
The Exe Estuary SPA/Ramsar
1.11 The Exe Estuary extends 10km south from Exeter to the open sea at Dawlish Warren. It
forms a partially enclosed tidal area of water, foreshore, low-lying land, saltmarsh and an
unusual double spit across the mouth of the estuary. There is an area of sand dunes at
Dawlish Warren. Dawlish Warren and Pole Sands (a sand bank) form natural breakwaters
between the approach channel and open water of Lyme Bay to the south west.
1.12 The Exe Estuary, including Dawlish Warren, is designated for its wintering waterfowl
assemblage and for wintering avocet and slavonian grebe. Recreation impacts to the
SPA/Ramsar interest features relate to the potential impacts of disturbance. On-going
work on the Exe Estuary is determining the current impacts of disturbance. This work
(‘The Exe Disturbance Study’) involved detailed ornithological work and visitor work to
assess the scale of any impacts and to identify which activities, in which areas, potentially
cause disturbance.
Dawlish Warren SAC
1.13 The classification of the site includes humid dune slacks, which is an Annex I habitat that
forms the primary reason for selection of this site. Additionally, there are further Annex 1
habitats that are present as a qualifying feature, but that do not form a primary reason for
site selection, which are the shifting dunes along the shoreline with marram grass
Ammorphila arenaria (i.e. white dunes) and fixed dunes with herbaceous vegetation (i.e.
grey dunes). The latter is also a Priority Feature. Additionally, Dawlish Warren SAC
supports a large population of petalwort, an Annex 2 species that is the primary reason for
the selection of the site.
1.14 Detailed consideration of the impacts of recreation are provided by Lake (2010), who
identifies the following potential issues:
Trampling, which in some places is leading to significant erosion problems, with embryonic shifting dunes and mobile dunes particularly impacted. By contrast, in the more stable areas of the site, over-stabilisation of the mobile dunes is a problem and in these areas trampling may be beneficially increasing the mobility of sand in the system.
Dog fouling, with nutrient enrichment, presumably from dog faeces, evident near access points in the fixed dune grassland. The enrichment results in the characteristic dune grassland flora being replaced by coarser vegetation.
Increased fire risk (for example through the use of bar-b-ques), which can result in damage to dune vegetation.
Management of the golf course, which is within the SAC and where management such as fertilizer application is damaging to the flora.
East Devon Pebblebed Heaths SAC/East Devon Heaths SPA
1.15 The Pebblebed Heaths lie on the Triassic pebblebeds south east of Exeter, and cover an
area of approximately 1400 ha. They have been designated as of European and national
importance for their dry and wet heath and mire habitats, for the populations of breeding
nightjars and Dartford warblers, and for their colonies of rare Southern damselfly. They
are also regionally important for rare and scarce plants and invertebrates. The Pebblebed

F o o t p r i n t E c o l o g y : E a s t D e v o n , E x e t e r a n d T e i g n b r i d g e H o u s e h o l d S u r v e y
10
Heaths lie in the East Devon AONB and are recognised as a significant landscape feature in
east Devon.
1.16 The heaths have been open to the public for many years and are highly valued by local
communities and visitors to the area. They are also a major asset to the Royal Marine
Commandoes who have used the heaths for training exercises for many years. The heaths
have been registered as common land, although no commons rights have been exercised
for many years and there is only one commoner. Under the Countryside and Rights of Way
Act, 2000, there are full rights of public access on foot over the whole area of the common
land (effectively the whole of the Pebblebed Heaths).
1.17 Most of the Commons are in a single ownership, the Clinton Devon Estates, who manage
them through a charitable trust, The Pebblebeds Conservation Trust, with parts of the
northern pebblebeds leased to and managed by the RSPB. The RSPB also lease part from
East Devon District Council and own a further area in the north.
Dartmoor SAC/South Dartmoor Woods SAC
1.18 Dartmoor is protected by National Park Status and located in central Devon and covers
95,300 hectares. It offers in excess of 47,000 ha of open access land available to
recreational users. The National Park offers leisure opportunities to walkers, joggers,
cyclists, and horse riders. A substantial part of the National Park is designated as an SAC
with 23,165 hectares covered by the Dartmoor SAC and 2,157 hectares by the South
Dartmoor Woods SAC. The two SACs contain areas of Northern Atlantic Wet Heath with
Erica tetralix, Dry Heath, Blanket Bogs and old sessile oak woods at Yarner Wood, Teign
Valley Woods, Wistman’s Wood etc. The rivers of Dartmoor support populations of the
otter Lutra lutra, southern damselfly Coenagrion mercuriale and Atlantic salmon Salmo
salar.
Other sites
1.19 In addition to the sites listed above, it is useful to gain information on a wider suite of
sites. There are some other European Protected sites such as Sidmouth-West Bay SAC
where access is perhaps less of an issue, but where it is still useful to have information on
visitor use. In addition, general information on recreational use of a wide range of sites
will provide added benefit, for example in relation to green infrastructure studies and
helping to target resources. We have therefore included a wide range of sites in the
survey. (There are other European wildlife sites in the area where access is not thought to
be an issue, e.g. South Hams SAC. These have not been addressed in this study.)
Off-site visitor surveys
1.20 Detailed on-site monitoring data relating to visitors is available for the Exe Estuary and
Dawlish Warren (Liley & Cruickshanks 2010). Dartmoor National Park also holds some
visitor data for Dartmoor. Such on-site data is very useful at identifying local and site
specific access patterns, for example where people walk on site and accurate information
on the numbers of people at specific locations. To get a more strategic overview for
multiple sites and crucially to identify people that do not visit sites (and therefore would
never be encountered during an on-site survey), off-site visitor surveys are necessary.

F o o t p r i n t E c o l o g y : E a s t D e v o n , E x e t e r a n d T e i g n b r i d g e H o u s e h o l d S u r v e y
11
Such surveys are particularly effective if combined with on-site monitoring, and where
conducted together there is evidence that the two complement each other well (e.g. Liley
et al. 2009).
1.21 Off-site sample surveys are therefore useful in providing an overview of patterns and
motivations, and there have been a variety of such surveys in England involving postal
questionnaires, telephone interviews or similar methods which ask about access to the
outdoors (e.g. anon 2004; Natural England 2006; Liley et al. 2009; TNS Research
International Travel & Tourism 2010).
Aims of this report
1.22 This report therefore aims to provide a strategic overview of recreational use of the
countryside in this part of Devon, and in particular will:
Derive comparative visitor rates to different countryside sites
Determine which residents in the three districts visit key European Protected sites and determine why they visit and how they travel to those sites
Determine where additional development may result in additional impacts to key sites

F o o t p r i n t E c o l o g y : E a s t D e v o n , E x e t e r a n d T e i g n b r i d g e H o u s e h o l d S u r v e y
12
2. Methods
Questionnaire design
2.1 A postal questionnaire was sent out to 5100 addresses, selected at random, in south
Devon (1700 to each of three local authority areas). This approach was chosen, as
opposed to telephone or face-to-face interviews, as it provides a relatively cost effective
means of contacting a random sample of people across a broad area. In addition, people
are able to consider their responses and respond in their own time.
2.2 A critical problem associated with postal surveys is that there is little control over who fills
in the questionnaire so results may not be representative. Those people with busy lives
(parents, those in full time employment etc) may be less likely to complete the form.
There also tends to always be a low response rate. The questionnaire was therefore
carefully designed to ensure that it appeared simple to fill in and did not take too long to
complete. It was made clear that the questionnaire was commissioned by local authorities
(i.e. it was not related to any marketing) and a prize (£100 of shopping vouchers, given to
one respondent selected at random) was allocated as an incentive for completing the
questionnaire. A copy of the questionnaire is provided in Appendix 1.
2.3 The questionnaire was structured into the following sections:
A: When and why you visit the coast and countryside: general questions about how often and how recently people visit different kinds of sites, at what time of year and the activities that people undertake.
B: Visits to the coast and estuaries: specifically asking the respondent how often they visit the coast, to provide information about 10 specific coastal locations marked on a map and to name up to five additional sites (15 labelled on the map but free text optional) and describe why they visit the site, how frequently etc.
C: Visits to Dartmoor: specifically asking the respondent how often they visit Dartmoor, to provide information about 8 particular locations marked on a map and to name up to five additional sites (19 labelled on the map but free text optional) and describe why they visit the site, how frequently etc.
D: Visits to other countryside places: specifically asking the respondent how often they visit other countryside places, to provide information about 11 particular locations marked on a map and to name up to five additional sites (28 labelled on the map but free text optional) and describe why they visit the site, how frequently etc.
E: About you and your household: general questions about the respondent and his / her household.
2.4 This structure was chosen to ensure that respondents were prompted to consider a wide
range of different types of site that they might have visited. An alternative approach, such
as simply asking respondents to list 20 sites that they visit, without categorising them at
all, may have led people to miss sites they visit regularly. By specifically asking about the
coast, Dartmoor and other countryside places we have attempted to ensure that as wide a
range of sites – from formal parks to large tracts of countryside – would be listed.
2.5 We used a combined approach whereby target locations under each category (Coast and
Estuaries; Dartmoor; and Countryside) were highlighted on the map and respondents were
asked how frequently they visit these sites, the mode of transport used and the reason for

F o o t p r i n t E c o l o g y : E a s t D e v o n , E x e t e r a n d T e i g n b r i d g e H o u s e h o l d S u r v e y
13
their visit. In addition visitors were given space to list up to five free text locations the
frequency of their visit, transport and reason. This combined approach enabled a
proportion of the target sites to be categorised without the need for interpreting entirely
free text location responses.
2.6 Each questionnaire was given a unique identification number, allowing cross reference
back to the address data, allowing the postcode of each respondent to then be linked to
the questionnaire data. Questions were phrased so as to ask about the households visiting
patterns rather than the individual.
2.7 Response errors cannot readily be quantified, but for this survey they will depend mainly
on the ability and willingness of respondents to recall sites they and their household visit
and to record accurately the activities they had undertaken.
2.8 Accompanying covering letters gave a telephone number for support or for people to
request the questionnaire in a different format, such as large font size. The logos of the
relevant local authorities were displayed both on the envelope and the covering letter.
Questionnaire design issues
2.9 After the questionnaire had been sent out to recipients it became apparent that earlier
versions of the maps had been used in the final questionnaire by mistake. This mistake
has implications for the assumptions made of the data collected in sections C and D only.
2.10 In section C ‘visits to Dartmoor’ only location A in the table matches the location on the
map as the labelling order was changed for locations B-H in the most recent version.
However, irrespective of the map locations, we feel that visitors will have answered
question C2 with respect to the names in the table rather than the markers on the map for
the eight well known target locations. However, for the free text section (question C3) the
markers on the map match the labels in the map legend and can therefore be accurately
analysed.
2.11 In section D ‘visits to other countryside places’ the first four specified sites in the table
match the locations on the map whereas the remaining seven sites within the Pebblebed
Heaths are incorrectly labelled on the map. Similarly the labels were re-ordered in the
later version of the maps. However, like section C (above) we have assumed that
respondents have described their visits to sites in question D2 with respect to the names
in the table rather than the names on the map as it seems more likely that respondents
would describe visits against a named site rather than the correct code on the map. For
the free text section (question D3) the markers on the map match the labels in the map
legend and can therefore be accurately analysed.
Selection of Addresses
2.12 A total of 1700 addresses were sent from each authority. Teignbridge District Council used
their Local Land and Property Gazetteer to select all residential properties outside
Dartmoor National Park (apart from one Teignbridge recipient within the boundary), and
then from this selection 1700 addresses were selected at random. Exeter City Council
used the Royal Mail Address List for the whole of Exeter, from which the 1700 addresses

F o o t p r i n t E c o l o g y : E a s t D e v o n , E x e t e r a n d T e i g n b r i d g e H o u s e h o l d S u r v e y
14
were extracted. East Devon District Council addresses were randomly selected within a
GIS.
2.13 The coding of recipients was managed differently between local authorities with
Teignbridge labelling the questionnaire before they were sent and East Devon labelling
them upon return. In total 33 responses could not be assigned to a recipient address and
postcode as a problem arose with labelling the questionnaires. Of the 33 recipients
without matched addresses and postcodes, 27 were from East Devon, 5 were from Exeter
City and one was from Teignbridge.
Mailing Dates
2.14 Questionnaires were posted by each local authority on different dates in the autumn of
2010 (Table 1). A follow up reminder letter was sent by Teignbridge District Council and
Exeter City Council only. Exeter City residents were given the longest time to respond with
50 days whereas East Devon residents were only given 21 days to respond
Table 1: Mailing and reminder dates 2010 for each local authority.
Milestone Teignbridge Exeter City East Devon
Postal date Wednesday 29th September Thursday 23rd September Friday 5th November
Reminder Friday 22nd October Wednesday 27th October Not sent
Deadline Friday 12th November Friday 12th November Friday 26th November
Data collation and error rates
2.15 Each local authority was responsible for collating data from respondents within their area.
Questionnaires were returned to each local authority separately using a freepost address
and data were entered by hand. All paper questionnaires were archived by the respective
local authorities.
2.16 A check for data-entry errors was undertaken by checking a small sample of the
questionnaires returned to Teignbridge District Council. Twenty-two questionnaires were
checked after data entry and a total of 14 errors were found within 11 of the
questionnaires (see paragraph 10.4).
Categorising sites
2.17 Where respondents gave free text answers to locations they visit (questions C3, D3 and
E3) these have been categorised as far as possible where they are the same places as the
numbered or lettered mapped locations in each section. Therefore visits to these
locations are included in analyses regarding Dartmoor, other countryside sites and other
coastal sites. Additional visits to the Exe were not combined from the free text comments
as only 84 visits were identified for seven respondents and it was felt that it would be
more straightforward in the analyses of the Exe data to retain the seven categories. For
Dartmoor visits, additional information gathered in question C3 doubled the number of
visits to Dartmoor and therefore all data was included. In all cases, additional visits to
Dartmoor were only added to the totals per postcode for categorised locations where the

F o o t p r i n t E c o l o g y : E a s t D e v o n , E x e t e r a n d T e i g n b r i d g e H o u s e h o l d S u r v e y
15
visit characteristics differed. Therefore visits would not be added if, despite having the
same site name or code, the visit frequency, activity or mode of transport was the same
(i.e. respondents may have described the same visits and activities and they would
therefore not be added).
Analysis
2.18 The analysis is structured to provide a summary and basic statistical analysis of responses
to each question (where possible) and to illustrate how site usage varies with distance
from sites (with a focus on European Protected sites) and in relation to demographic
details about the respondents including house type, dog ownership, transport availability
and activities undertaken. Specifically the analyses will identify the following:
the broad activities undertaken by visitors
the frequency of visits to sites
which households visit the designated sites
how far people travel to different sites and types of sites
why people visit designated sites and other types of sites (activities undertaken)
the importance of geographical location and the distances people travel to different types of sites
the frequency of visits with respect to house type and household demographics
2.19 All statistical tests and graphs were performed using Minitab (version 14) or Excel. All
spatial queries and maps were generated using MapInfo (version 10.5).
Total visitor numbers to particular sites and for different activities
2.20 In order to calculate an estimate of the total number of visits to each site per year, the
frequency of visit to each site was coded to give an actual rate. The number of days
assigned to each frequency is given in Table 2.
2.21 Only one visit frequency could be provided for each location whereas multiple activities
could be described at each location. Therefore we assigned the number of visits to each
activity by assessing whether they could occur simultaneously. If they could occur
simultaneously then each activity was assigned the total number of visits (e.g. 4 visits per
year for walking and 4 for dog walking) whereas for non simultaneous activities (e.g.
walking and sailing or walking and bicycling) the total number of visits was divided by the
number of activities undertaken.
Table 2: Number of visits assumed for each frequency category
Frequency (categorical) Number of visits assumed per year
Most days 250
Most weeks 40
Most months 12
A few times per year or less 4

F o o t p r i n t E c o l o g y : E a s t D e v o n , E x e t e r a n d T e i g n b r i d g e H o u s e h o l d S u r v e y
16
3. Results overview
Response rate, distribution and demographics of respondents
3.1 A total of 1296 completed questionnaires were received (25.4% of the 5100 originally sent
out). The highest response rate was from residents within the Teignbridge district with
30%, followed by East Devon with 26%, and Exeter with 20%. The proportion of responses
submitted for each council’s area are significantly different (χ22 = 40.916, p<0.001). The
postcodes of the recipients and respondents within each local authority area are shown
with the European Protected sites in (Map 1). Across the whole survey, 20% of
respondents were dog owners although this proportion differed significantly between
local authorities (χ22 = 19.31, p<0.001) with twice as many East Devon respondents owning
dogs compared to Exeter City respondents.
Table 3: Household demographics for respondents from each local authority.
Household demographics Teignbridge Exeter City East Devon Whole survey
Number of responses 504 344 448 1296
Mean household size 2.18 2.14 2.2 2.18
Mean number of children 0.25 0.3 0.35 0.3
Mean number of dogs 0.28 0.15 0.33 0.27
% households with access to transport 87.9 79.7 92 87
% households with someone with reduced mobility 25.4 21.5 24.8 24.2
% households with a dog 21 12.5 25 20.1
3.2 Higher proportions of family members of respondents from Teignbridge and East Devon
were permanently retired (32% and 36% respectively) compared to only 26% of those
family members living in Exeter. Across all three local authorities the majority of family
members were in full- or part-time employment.
Table 4: Number of family members (% of total) and the employment status of respondents from each local authority. The most common status per local authority is shown in bold.
Employment status Teignbridge Exeter City East Devon Total
Employed full-time 213 (28) 152 (29) 166 (24) 531 (27)
Employed part-time 117 (15) 83 (16) 95 (14) 295 (15)
Unemployed and seeking work 16 (2) 13 (2) 14 (2) 43 (2)
Looking after the home or family 39 (5) 30 (6) 32 (5) 101 (5)
Permanently retired from paid work
243 (32) 137 (26) 250 (36) 630 (32)
In full-time further/higher education
30 (4) 26 (5) 17 (2) 73 (4)
In school 61 (8) 50 (10) 73 (11) 184 (9)
Under school age 26 (3) 16 (3) 28 (4) 70 (4)
Other 22 (3) 15 (3) 17 (2) 54 (3)
Total 768 524 695 1981

F o o t p r i n t E c o l o g y : E a s t D e v o n , E x e t e r a n d T e i g n b r i d g e H o u s e h o l d S u r v e y
17
Map 1: Postcodes of recipients of the questionnaire and respondents within each local authority area. Note that not all postcodes could be geocoded. Contains Ordnance Survey © data Crown copyright and database right 2011.

F o o t p r i n t E c o l o g y : E a s t D e v o n , E x e t e r a n d T e i g n b r i d g e H o u s e h o l d S u r v e y
18
3.3 Across all local authorities the most common house type was either a detached or semi-
detached house (Table 5). The lowest proportion of responses received from people living
in bungalows was from Exeter City residents (6% compared to 21% for Teignbridge and
20% for East Devon). The majority of the respondents had access to a private garden with
the highest proportion with private gardens amongst respondents from the East Devon
District Council area (Table 6).
Table 5: Number (%) of respondents living in different types of houses in each local authority area. The most common household type of the respondents per local authority is shown in bold.
Household type Teignbridge Exeter City East Devon Total
Flat (ground floor) 23 (5) 24 (7) 21 (5) 68 (5)
Flat (non-ground floor) 39 (8) 40 (12) 10 (2) 89 (7)
Bungalow 101 (20) 21 (6) 94 (21) 216 (17)
Terraced house 62 (12) 86 (25) 72 (16) 220 (17)
Semi-detached 104 (21) 109 (32) 131 (29) 344 (27)
Detached 150 (30) 52 (15) 109 (24) 311 (24)
Static caravan 6 (1) 1 (0.3) 3 (1) 10 (1)
Other 13 (3) 2 (1) 2 (0.4) 17 (1)
Blank 6 (1) 9 (3) 6 (1) 21 (2)
Table 6: Number (%) of respondents with access to a private garden, communal garden or neither from each local authority.
Household access to a garden
Teignbridge Exeter City East Devon Total
Private garden 433 (86) 278 (81) 418 (93) 1129 (87)
Communal garden 26 (5) 34 (10) 20 (4) 80 (6)
Neither 38 (8) 26 (8) 8 (2) 72 (6)
Blank 7 (1) 6 (2) 2 (0.4) 15 (1)
Respondents that did not visit the countryside
3.4 Responses from 77 households stated that no one in the household made visits to the
countryside i.e. 5.9% of the total respondents. There was no significant difference
between each authority in terms of the proportion of people who stated that they did not
visit the countryside, indicating that people living in Exeter city, for example, are not less
likely to visit the countryside than those living in either Teignbridge or East Devon District
(χ22 = 0.41, p = 0.657). Across all districts there was a significant association between
those households that contained someone with reduced mobility and those households
that didn’t ever visit the countryside (χ21=44.086, p<0.001). Respondents that stated they
didn’t visit the countryside also tended to live in smaller households, containing fewer
children than those that did visit the countryside. Although a smaller proportion of these
households owned dogs (only 6.5% compared to 21%), they were more likely to own more
than one dog than those households that did visit the countryside.

F o o t p r i n t E c o l o g y : E a s t D e v o n , E x e t e r a n d T e i g n b r i d g e H o u s e h o l d S u r v e y
19
Table 7: Household demographics for respondents from each local authority who did not visit the countryside compared to those that did visit. Table gives median values. Asterisks indicate significant differences (Mann-Whitney test) for the whole survey data (i.e. all districts combined).
Household demographics
Teignbridge Exeter City East Devon Whole survey
No visits
Did Visit
No visits
Did Visit
No visits
Did Visit
No visits
Did Visit
Significance
Number of responses 32 472 17 327 28 420 77 1219
Household size (number of people)
1 2 2 2 1 2 1 2 **
Number of beds 2 3 2 3 2 3 2 3 **
Number of children under 16 in household
1 2 1 2 1 2 1 2 **
Number of dogs 2 1 1.5 1 2 1 2 1 *
3.5 From the 77 households which stated that they do not visit the countryside, 74% of all
family members were permanently retired from paid work. This figure was highest for
Teignbridge at 89% and lowest in Exeter at 45%.
Table 8: Number of family members (% of total) and the employment status of respondents that did not visit the countryside from each local authority. The most common status per local authority is shown in bold.
Employment status Teignbridge Exeter City East Devon Total
Employed full-time 1 (2) 8 (28) 6 (15) 15 (13)
Employed part-time 1 (2) 3 (10) 2 (5) 6 (5)
Unemployed and seeking work 1 (3) 1 (1) Looking after the home or family 1 (2) 2 (7) 3 (3)
Permanently retired from paid work 40 (89) 13 (45) 31 (78) 84 (74)
In full-time further/higher education
In school 1 (3) 1 (1)
Under school age 1 (3) 1 (1)
Other 2 (4) 1 (3) 3 (3)
3.6 The most popular house type of respondents not utilising the countryside for recreation in
the Teignbridge and East Devon districts lived in bungalows (Table 9). Most respondents
in this category also had access to a private garden although nearly a quarter of non-
recreating Exeter City residents did not have access to a garden or shared a communal
garden (Table 10).
Table 9: Number (%) of respondents living in different types of houses that did not visit the countryside in each local authority area. The most common household type per local authority is shown in bold.
Household type Teignbridge Exeter City East Devon Total
Flat (ground floor) 2 (6) 1 (6) 4 (14) 7 (9)
Flat (non-ground floor) 1 (3) 4 (24) 5 (6)
Bungalow 11 (34) 2 (12) 10 (36) 23 (30)
Terraced house 4 (13) 2 (12) 3 (11) 9 (12)
Semi-detached 8 (25) 5 (29) 9 (32) 22 (29)
Detached 4 (13) 3 (18) 7 (9)
Static caravan 1 (4) 1 (1)
Other 2 (6) 2 (3)
Blank 1 (4) 1 (1)
F o o t p r i n t E c o l o g y : E a s t D e v o n , E x e t e r a n d T e i g n b r i d g e H o u s e h o l d S u r v e y
20
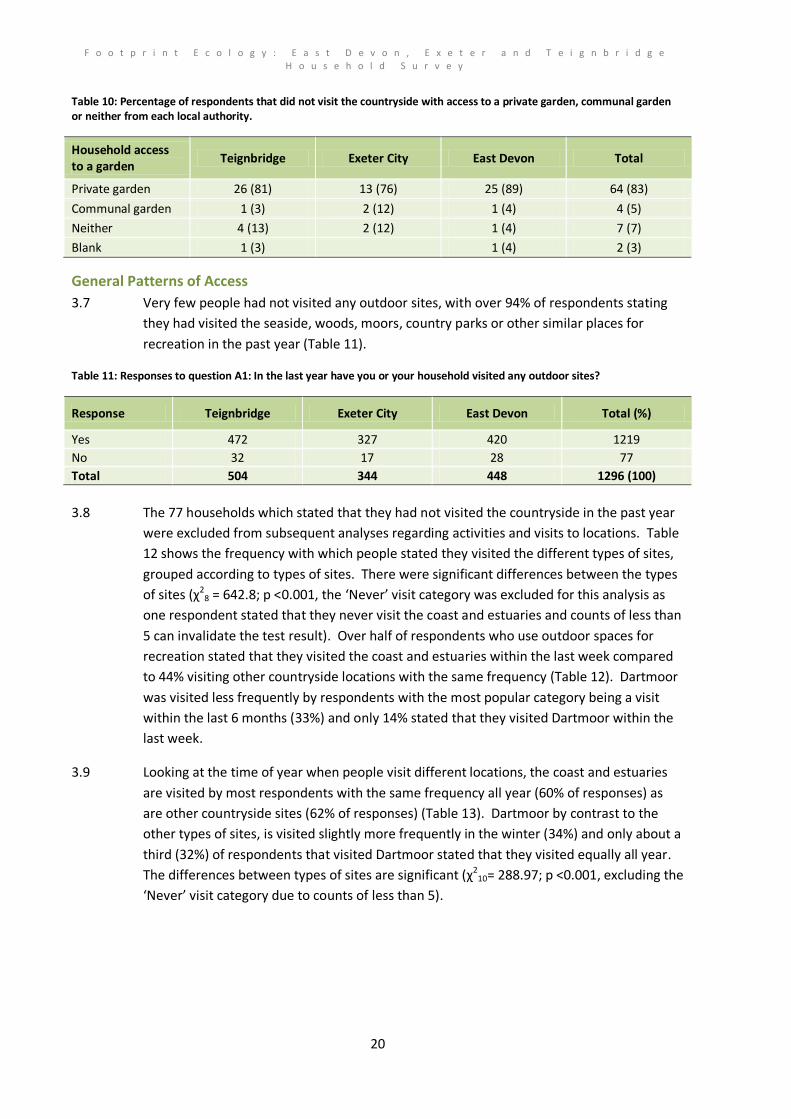
Table 10: Percentage of respondents that did not visit the countryside with access to a private garden, communal garden or neither from each local authority.
Household access to a garden
Teignbridge Exeter City East Devon Total
Private garden 26 (81) 13 (76) 25 (89) 64 (83)
Communal garden 1 (3) 2 (12) 1 (4) 4 (5)
Neither 4 (13) 2 (12) 1 (4) 7 (7)
Blank 1 (3) 1 (4) 2 (3)
General Patterns of Access
3.7 Very few people had not visited any outdoor sites, with over 94% of respondents stating
they had visited the seaside, woods, moors, country parks or other similar places for
recreation in the past year (Table 11).
Table 11: Responses to question A1: In the last year have you or your household visited any outdoor sites?
Response Teignbridge Exeter City East Devon Total (%)
Yes 472 327 420 1219
No 32 17 28 77
Total 504 344 448 1296 (100)
3.8 The 77 households which stated that they had not visited the countryside in the past year
were excluded from subsequent analyses regarding activities and visits to locations. Table
12 shows the frequency with which people stated they visited the different types of sites,
grouped according to types of sites. There were significant differences between the types
of sites (χ28 = 642.8; p <0.001, the ‘Never’ visit category was excluded for this analysis as
one respondent stated that they never visit the coast and estuaries and counts of less than
5 can invalidate the test result). Over half of respondents who use outdoor spaces for
recreation stated that they visited the coast and estuaries within the last week compared
to 44% visiting other countryside locations with the same frequency (Table 12). Dartmoor
was visited less frequently by respondents with the most popular category being a visit
within the last 6 months (33%) and only 14% stated that they visited Dartmoor within the
last week.
3.9 Looking at the time of year when people visit different locations, the coast and estuaries
are visited by most respondents with the same frequency all year (60% of responses) as
are other countryside sites (62% of responses) (Table 13). Dartmoor by contrast to the
other types of sites, is visited slightly more frequently in the winter (34%) and only about a
third (32%) of respondents that visited Dartmoor stated that they visited equally all year.
The differences between types of sites are significant (χ210= 288.97; p <0.001, excluding the
‘Never’ visit category due to counts of less than 5).
F o o t p r i n t E c o l o g y : E a s t D e v o n , E x e t e r a n d T e i g n b r i d g e H o u s e h o l d S u r v e y
21
Table 12: Summary of responses to question A2 When was the last time your household visited a particular type of location? The most common frequency with which people visit is shown in bold for each location.
Location
Number (%) visiting
Total Within the last week
Within the last month
Within the last 6
months
Within the last year
More than a year ago
Never
Coast and estuaries 632 (54) 344 (29) 164 (14) 28 (2) 10 (1) 1 (0.1) 1179
Dartmoor 151 (14) 270 (26) 351 (33) 124 (12) 143 (14) 17 (2) 1056
Other countryside 471 (44) 341 (32) 165 (15) 48 (5) 30 (3) 10 (1) 1065
Table 13: The number (%) of respondents that stated they visited the different types of location at different times of year. Respondents were able to give multiple responses (for example by stating that they visit more in the spring and the autumn). The most popular time of year for each location is shown in bold.
Location Number of respondents (%) visiting more at a particular time of year
Total no. respondents equally
all year more in summer
more in winter
more in spring
more in autumn
never visit
Coast and estuaries 806 (60) 107 (8) 288 (22) 83 (6) 49 (4) 1 (0.1) 1334
Dartmoor 392 (32) 179 (14) 424 (34) 152 (12) 47 (4) 43 (3) 1237
Other countryside 738 (62) 108 (9) 223 (19) 92 (8) 12 (1) 13 (1) 1186
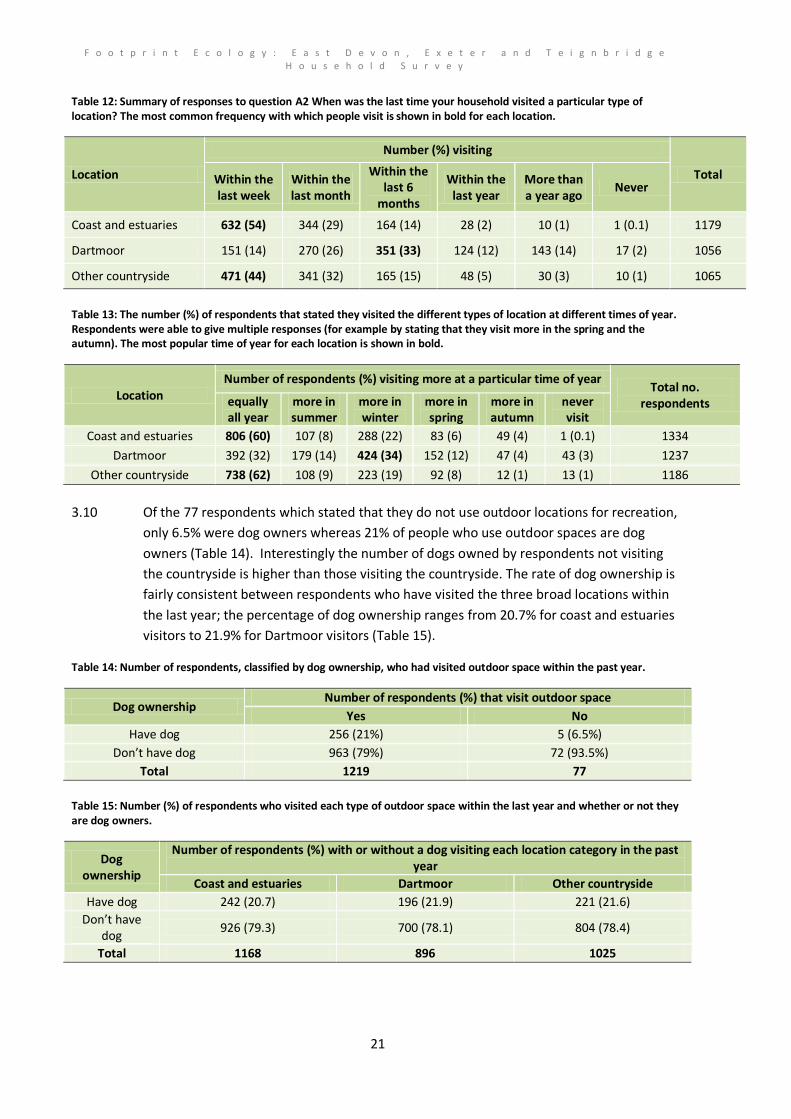
3.10 Of the 77 respondents which stated that they do not use outdoor locations for recreation,
only 6.5% were dog owners whereas 21% of people who use outdoor spaces are dog
owners (Table 14). Interestingly the number of dogs owned by respondents not visiting
the countryside is higher than those visiting the countryside. The rate of dog ownership is
fairly consistent between respondents who have visited the three broad locations within
the last year; the percentage of dog ownership ranges from 20.7% for coast and estuaries
visitors to 21.9% for Dartmoor visitors (Table 15).
Table 14: Number of respondents, classified by dog ownership, who had visited outdoor space within the past year.
Dog ownership Number of respondents (%) that visit outdoor space
Yes No
Have dog 256 (21%) 5 (6.5%)
Don’t have dog 963 (79%) 72 (93.5%)
Total 1219 77
Table 15: Number (%) of respondents who visited each type of outdoor space within the last year and whether or not they are dog owners.
Dog ownership
Number of respondents (%) with or without a dog visiting each location category in the past year
Coast and estuaries Dartmoor Other countryside
Have dog 242 (20.7) 196 (21.9) 221 (21.6)
Don’t have dog
926 (79.3) 700 (78.1) 804 (78.4)
Total 1168 896 1025

F o o t p r i n t E c o l o g y : E a s t D e v o n , E x e t e r a n d T e i g n b r i d g e H o u s e h o l d S u r v e y
22
Table 16: Demographics of households which have never visited the three broad locations or had not visited them within the past 12 months and households which had made a visit within the past year. Mean figures excluded where the sample size is less than 10.
Household demographics Coast and estuaries visit
in the past year? Dartmoor visit in the
past year? Other countryside visit
in the past year?
yes no yes no yes no
Number of households 1168 11 896 160 1025 40
Mean size 2.23 1.9 2.3 2.2 2.3 1.8
Mean number of children 1.7 1.7 1.6 1.7
Mean number of dogs 1.3 1.3 1.3 1.3 1.4
Access to transport (%) 1046 (90) 9 (75) 822 (93) 137 (86) 937 (92) 28 (70)
No access to transport (%) 112 (10) 3 (25) 65 (7) 22 (14) 77 (8) 12 (30)
Types of outdoor activities
3.11 Visitors were asked which activities they undertake within three broad distance
categories: elsewhere in the country, elsewhere in Devon and within a few miles of home.
The most popular activity was walking in the countryside/at the coast and the two
activities which stand out as taking visitors further afield were watersports and wildlife
watching (8% of respondents for both activities travel further than a few miles from
home). Countryside and coastal walking was the most popular activity with the highest
rate observed in East Devon District at 85% of respondents (Table 18). Wildlife watching
was the second most popular activity undertaken by 36% of all respondents with the
highest percentage from East Devon area (40%). Dog walking was the third most popular
activity undertaken locally. Higher proportions of respondents from East Devon and
Teignbridge areas undertook dog walking in the local area (30% and 25% respectively)
than within the Exeter area (17%).
Table 17: Number (%) of total respondents (N=1219) that undertake certain activities in the countryside and the broad locations where they take place.
Activity
Location
No answer given
Within a few miles of Home
Elsewhere in Devon
Elsewhere in the
country
Walking in countryside / at coast 753 (62) 205 (17) 18 (1) 243 (20)
Dog walking 285 (23) 14 (1) 5 (0.4) 915 (75)
Watersports 122 (10) 68 (6) 23 (2) 1006 (83)
Mountain biking / off-roading 150 (12) 40 (3) 5 (0.4) 1024 (84)
Horse riding (bridle paths / wider countryside) 64 (5) 17 (1) 5 (0.4) 1133 (93)
Fishing / bait digging /crabbing / crab tiling 127 (10) 37 (3) 13 (1) 1042 (85)
Wildlife watching 348 (29) 91 (7) 14 (1) 766 (63)
Wild camping (away from formal camp site) 30 (2) 43 (4) 20 (2) 1126 (92)
Climbing or Caving 21 (2) 25 (2) 5 (0.5) 1167 (96)

F o o t p r i n t E c o l o g y : E a s t D e v o n , E x e t e r a n d T e i g n b r i d g e H o u s e h o l d S u r v e y
23
Table 18: Number (%) of respondents who use the general countryside for recreation and undertake different activities within a couple of miles of their home or elsewhere in Devon. (Percentages are calculated from the total respondents).
Activity Number of responses (% of households)
Total (%) Teignbridge Exeter City East Devon
Walking in countryside / at coast 355 (75) 248 (76) 355 (85) 958 (79)
Dog walking 119 (25) 55 (17) 125 (30) 299 (25)
Watersports 80 (17) 53 (16) 57 (14) 190 (16)
Mountain biking / off-roading 82 (17) 44 (13) 64 (15) 190 (16)
Horse riding (bridle paths / wider countryside) 32 (7) 13 (4) 36 (9) 81 (7)
Fishing / bait digging /crabbing / crab tiling 67 (14) 33 (10) 64 (15) 164 (13)
Wildlife watching 157 (33) 116 (35) 166 (40) 439 (36)
Wild camping (away from formal camp site) 29 (6) 28 (9) 16 (4) 73 (6)
Climbing or Caving 22 (5) 12 (4) 12 (3) 46 (4)
Total respondents 472 372 420 1219
3.12 Considering all respondents together, the activity that was undertaken with the highest
frequency was dog walking (65% taking part most days) followed by walking in the
countryside or coast (40% taking part most weeks) (Table 19). Wildlife watching stands
out as an activity which takes place relatively regularly with 60% of participants stating
that they take part at least once per month. Furthermore half of all mountain bike users
(190 households in total) and 42% of all watersports users (189 households in total) take
part locally at least once a month. For all other activities, the majority of respondents who
undertook them stated that they did so just a few times a year or less.
Table 19: Number (%) of respondents and the frequency with which they undertake different activities within a few miles of home or elsewhere in Devon. The percentage is expressed as the proportion of total responses for each activity and the most common frequency for each activity is shown in bold.
Activity
Frequency of visits Total
responses for each activity
Most weeks Most
months Most days
Few times a year or
less
Walking in countryside / at coast 382 (40) 256 (27) 162 (17) 149 (16) 949
Dog walking 31 (10) 32 (11) 191 (65) 42 (14) 296
Watersports 28 (15) 48 (25) 3 (2) 110 (58) 189
Mountain biking / off-roading 29 (15) 57 (30) 9 (5) 95 (50) 190
Horse riding (bridle paths / wider countryside) 19 (23) 10 (12) 5 (6) 47 (58) 81
Fishing / bait digging /crabbing / crab tiling 13 (8) 26 (16) 3 (2) 121 (74) 163
Wildlife watching 89 (21) 104 (24) 66 (15) 174 (40) 433
Wild camping (away from formal camp site) 0 (0) 7 (10) 1 (1) 65 (89) 73
Climbing or Caving 1 (2) 5 (11) 0 (0) 40 (87) 46

F o o t p r i n t E c o l o g y : E a s t D e v o n , E x e t e r a n d T e i g n b r i d g e H o u s e h o l d S u r v e y
24
Conclusions The higher responses rate from Teignbridge district may be due to the higher proportions of retired residents compared to Exeter City. Whilst a fifth of all respondents owned a dog, the higher rate of ownership in East Devon is due to access to green spaces for walking the dog. It is interesting to note that the 6% who did not access the countryside are linked to low mobility, are mainly retired, are often living in bungalows but are also more likely to own a dog which is perhaps for companionship and would be exercised locally in parks and along the road. Given the proximity of the coast to residents of all three districts, it is unsurprising that it is the most popular type of location to visit all year round. Dartmoor features as a less frequently visited location but it is slightly more popular in the winter and is popular with dog owners. The most popular activity was walking in the countryside/at the coast and the two activities which stand out as taking visitors furthest afield were watersports and wildlife watching. Dog walking was the most frequent activity with 65% taking part most days whilst activities such as wildlife watching, watersports and mountain biking take place less frequently.
F o o t p r i n t E c o l o g y : E a s t D e v o n , E x e t e r a n d T e i g n b r i d g e H o u s e h o l d S u r v e y
25
4. Visits to the Exe Estuary
Summary
4.1 Households were asked specific questions about their visits to the coast and estuaries and
within this they were asked about their visits to seven locations on the Exe Estuary:
Dawlish Warren Beach, Dawlish Warren Nature Reserve, Exmouth LNR/ Duckpond,
Imperial Recreation Ground, Exmouth Seafront, The Maer and ‘Unspecified Exe
Estuary’(the remainder of the estuary outside the other locations). Respondents were
asked to state how often they visited the seven locations on the Exe, which mode of
transport they used to get there and the activity that they undertook.
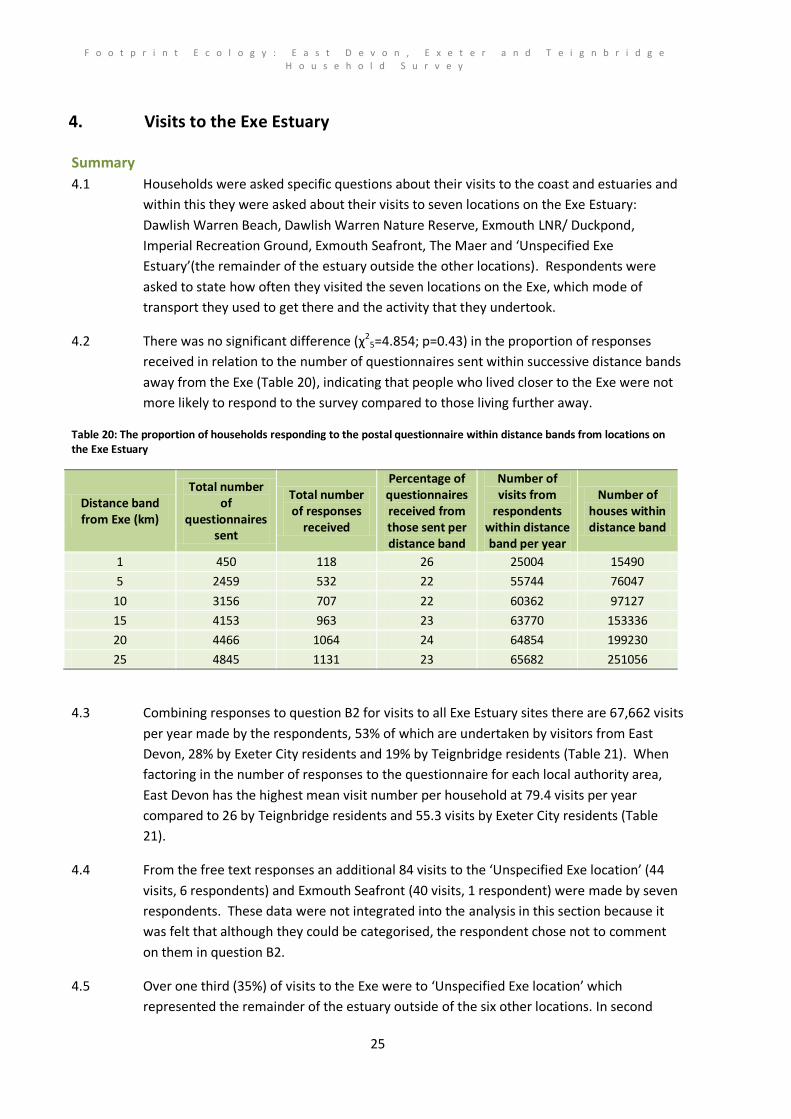
4.2 There was no significant difference (χ25=4.854; p=0.43) in the proportion of responses
received in relation to the number of questionnaires sent within successive distance bands
away from the Exe (Table 20), indicating that people who lived closer to the Exe were not
more likely to respond to the survey compared to those living further away.
Table 20: The proportion of households responding to the postal questionnaire within distance bands from locations on the Exe Estuary
Distance band from Exe (km)
Total number of
questionnaires sent
Total number of responses
received
Percentage of questionnaires received from those sent per distance band
Number of visits from
respondents within distance band per year
Number of houses within distance band
1 450 118 26 25004 15490
5 2459 532 22 55744 76047
10 3156 707 22 60362 97127
15 4153 963 23 63770 153336
20 4466 1064 24 64854 199230
25 4845 1131 23 65682 251056
4.3 Combining responses to question B2 for visits to all Exe Estuary sites there are 67,662 visits
per year made by the respondents, 53% of which are undertaken by visitors from East
Devon, 28% by Exeter City residents and 19% by Teignbridge residents (Table 21). When
factoring in the number of responses to the questionnaire for each local authority area,
East Devon has the highest mean visit number per household at 79.4 visits per year
compared to 26 by Teignbridge residents and 55.3 visits by Exeter City residents (Table
21).
4.4 From the free text responses an additional 84 visits to the ‘Unspecified Exe location’ (44
visits, 6 respondents) and Exmouth Seafront (40 visits, 1 respondent) were made by seven
respondents. These data were not integrated into the analysis in this section because it
was felt that although they could be categorised, the respondent chose not to comment
on them in question B2.
4.5 Over one third (35%) of visits to the Exe were to ‘Unspecified Exe location’ which
represented the remainder of the estuary outside of the six other locations. In second

F o o t p r i n t E c o l o g y : E a s t D e v o n , E x e t e r a n d T e i g n b r i d g e H o u s e h o l d S u r v e y
26
place receiving 28% of all the annual visits from respondents was Exmouth Seafront. The
majority of visits to Dawlish Warren Nature Reserve and beach were undertaken by
residents in the nearby Teignbridge area (contributing 64% of visits to the nature reserve)
(Table 21, Figure 1). Similarly due to proximity, most visits to locations around Exmouth
(LNR/duckpond, seafront, the Maer and Imperial Recreation Ground) were undertaken by
East Devon residents. Most visits from Exeter residents were to ‘Unspecified Exe location’
constituting 44% of all visits to this site from Exeter residents.
Table 21: Number of annual visits to locations on the Exe estuary with the percentage of visits from residents of each local authority to each site shown in brackets.
Location Teignbridge Exeter City East Devon Total
Visits Response
s Visits
Responses
Visits Response
s Visits
Responses
Dawlish Warren Beach 3720 (64) 376 1376 (24) 247 704 (12) 294 5800 (9) 917
Dawlish Warren Nature Reserve
2792 (60) 345 1138 (25) 214 706 (15) 283 4636 (7) 842
Exmouth LNR/ Duckpond 368 (9) 314 894 (23) 180 2648 (68) 296 3910 (6) 790
Exmouth Seafront 1630 (9) 352 3912 (21) 276 13502 (71) 367 19044 (28) 995
Imperial Recreation Ground 140 (4) 299 348 (11) 157 2764 (85) 286 3252 (5) 742
The Maer 582 (8) 304 1046 (14) 164 5838 (78) 297 7466 (11) 765
Unspecified Exe location 3852 (16) 359 10300 (44) 251 9402 (40) 324 23554 (35) 934
Total 13084 (19) 2350 19014 (28) 1491 35564 (53) 2150 67662 5985
Total respondents 504 344 448 1219
Mean per respondent 26 55.3 79.4 55.5
Figure 1: Number of visits to each location on the Exe by respondents from each local authority area.
0
5000
10000
15000
20000
25000
Dawlish Warren Beach
Dawlish Warren Nature Reserve
Exmouth LNR/ Duckpond
Exmouth Seafront
Imperial Recreation
Ground
The Maer Unspecified Exe location
Tota
l vis
its
EDDC
ECC
TDC

F o o t p r i n t E c o l o g y : E a s t D e v o n , E x e t e r a n d T e i g n b r i d g e H o u s e h o l d S u r v e y
27
Map 2: Postcodes of regular visitors (weekly or more) and non regular visitors to the Exe Estuary within each local authority area. Contains Ordnance Survey © data Crown copyright and database right 2011

F o o t p r i n t E c o l o g y : E a s t D e v o n , E x e t e r a n d T e i g n b r i d g e H o u s e h o l d S u r v e y
28
.The majority of visits to most locations on the Exe were made by car, with Dawlish Warren being the site with the highest proportion of car-borne visits. By contrast at the Exmouth sites a comparatively large proportion of visits are made on foot (Figure 2).
Figure 2: The number of visits made to each location on the Exe by transport type
4.6 Using the distance between respondents’ home postcodes and the locations they visited it
is possible to determine the distances at which people lived from the site (all distances
determined as the straight line distance – i.e. ‘as the crow flies’ – rather than travel
distance). These distances are summarised by mode of transport and by two particular
types of activity (dog walking and watersports) in Table 22. As some respondents
indicated that they used multiple different modes of transport (i.e. they perhaps visited a
site by bicycle, by car and on foot) all combinations given are included in the table. It can
be seen that over 30,000 visits per year are made by car/van, compared to nearly 22,000
on foot, with a further 13,000 visits made by other means of transport or by combinations
(i.e. the respondent tended to vary which mode of transport they used). Car drivers
typically travel the furthest: half of all respondents who stated that they visited the Exe
and travelled there by car lived within 13.6km.
0
5000
10000
15000
20000
25000
Dawlish Warren Beach
Dawlish Warren Nature Reserve
Exmouth LNR/
Duckpond
Exmouth Seafront
Imperial Recreation
Ground
The Maer Unspecified Exe location
Tota
l vis
its
Bike - public transport Bike - foot Car/van - public transport
Car/van - foot Car/van - bike Other
Foot Public transport Bike
Car/van

F o o t p r i n t E c o l o g y : E a s t D e v o n , E x e t e r a n d T e i g n b r i d g e H o u s e h o l d S u r v e y
29
Table 22: Number of visits made to the Exe by each transport combination, the minimum, maximum and median distances from the home postcode to the site (for each respondent) and median distances for watersports and dog walking visits.
Transport
All visits Watersports visits Dog walking visits
Number of visits
Number of
responses
Min distance
(km)
Median distance
(km)
Max distance
(km)
Median distance
(km)
Number of
responses
Median distance
(km)
Number of
responses
Car/van 30248 2347 0.74 13.61 39.19 13.27 31 13.16 100
Foot 21794 289 0.21 3.11 18.57 1.23 2 3.89 9
Public transport
3300 327 1.65 13.21 34.47 16.83 1
Bike - foot 2558 22 0.88 3.17 9.05 2.7 1
Car/van - foot 2304 32 1.14 7.63 20.28 3.54 4
Car/van – bike 1914 54 1.42 8.73 22.75
Bike 1668 87 0.88 7.87 25.51 17.86 1
Car/van - public transport
980 95 2.54 13.9 23.37 14.5 6
Other 800 42 1.18 6.2 26.29
Bike - public transport
56 6 2.38 7.67 9.29
4.7 In cases where multiple activities were described, the number of annual visits for each
individual activity at each location were calculated in the following way:
if the multiple activities could happen simultaneously then the total number of visits (scaled up from the frequency see Table 2) was assigned to each activity
where the activities could not occur together (e.g. walking and watersports or walking and cycling) the total visits (as derived from Table 2) were divided by the number of activities
4.8 Therefore the total number of visits per activity per site is greater than the total visits to
the Exe (67,662 per year compared to 101,170 considering visits per activity per site).
4.9 At each location on the Exe the most popular activity is walking which took place on 41%
of all visits (Table 23). The locations which received the highest number of visits for
walking were the ‘Unspecified Exe location’ and along Exmouth Seafront which also
received the most dog walking visits.
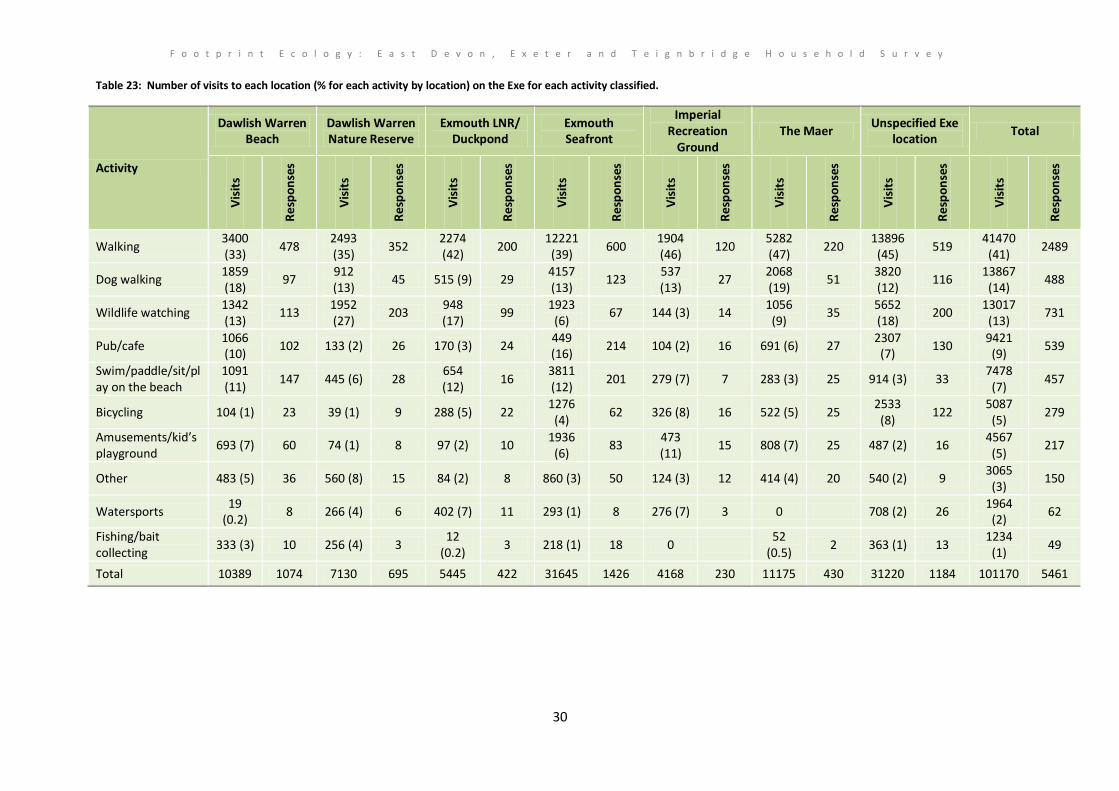
F o o t p r i n t E c o l o g y : E a s t D e v o n , E x e t e r a n d T e i g n b r i d g e H o u s e h o l d S u r v e y
30
Table 23: Number of visits to each location (% for each activity by location) on the Exe for each activity classified.
Activity
Dawlish Warren Beach
Dawlish Warren Nature Reserve
Exmouth LNR/ Duckpond
Exmouth Seafront
Imperial Recreation
Ground The Maer
Unspecified Exe location
Total
Vis
its
Re
spo
nse
s
Vis
its
Re
spo
nse
s
Vis
its
Re
spo
nse
s
Vis
its
Re
spo
nse
s
Vis
its
Re
spo
nse
s
Vis
its
Re
spo
nse
s
Vis
its
Re
spo
nse
s
Vis
its
Re
spo
nse
s
Walking 3400 (33)
478 2493 (35)
352 2274 (42)
200 12221
(39) 600
1904 (46)
120 5282 (47)
220 13896
(45) 519
41470 (41)
2489
Dog walking 1859 (18)
97 912 (13)
45 515 (9) 29 4157 (13)
123 537 (13)
27 2068 (19)
51 3820 (12)
116 13867
(14) 488
Wildlife watching 1342 (13)
113 1952 (27)
203 948 (17)
99 1923
(6) 67 144 (3) 14
1056 (9)
35 5652 (18)
200 13017
(13) 731
Pub/cafe 1066 (10)
102 133 (2) 26 170 (3) 24 449 (16)
214 104 (2) 16 691 (6) 27 2307
(7) 130
9421 (9)
539
Swim/paddle/sit/play on the beach
1091 (11)
147 445 (6) 28 654 (12)
16 3811 (12)
201 279 (7) 7 283 (3) 25 914 (3) 33 7478
(7) 457
Bicycling 104 (1) 23 39 (1) 9 288 (5) 22 1276
(4) 62 326 (8) 16 522 (5) 25
2533 (8)
122 5087
(5) 279
Amusements/kid’s playground
693 (7) 60 74 (1) 8 97 (2) 10 1936
(6) 83
473 (11)
15 808 (7) 25 487 (2) 16 4567
(5) 217
Other 483 (5) 36 560 (8) 15 84 (2) 8 860 (3) 50 124 (3) 12 414 (4) 20 540 (2) 9 3065
(3) 150
Watersports 19
(0.2) 8 266 (4) 6 402 (7) 11 293 (1) 8 276 (7) 3 0 708 (2) 26
1964 (2)
62
Fishing/bait collecting
333 (3) 10 256 (4) 3 12
(0.2) 3 218 (1) 18 0
52 (0.5)
2 363 (1) 13 1234
(1) 49
Total 10389 1074 7130 695 5445 422 31645 1426 4168 230 11175 430 31220 1184 101170 5461

F o o t p r i n t E c o l o g y : E a s t D e v o n , E x e t e r a n d T e i g n b r i d g e H o u s e h o l d S u r v e y
31
4.10 Most of the regular visitors to Dawlish Warren Nature Reserve lived in Teignbridge District,
and in the settlements relatively close to the site, for example in Teignmouth, Dawlish,
Exminster and Kenton (Map 3). There were four regular visitors who lived in Exeter and
just one from East Devon (Exmouth). The site does however clearly also draw non-regular
visitors from a wide area, including East Devon.
0
5000
10000
15000
20000
25000
30000
35000
Dawlish Warren Beach
Dawlish Warren Nature
Reserve
Exmouth LNR/ Duckpond
Exmouth Seafront
Imperial Recreation
Ground
The Maer Unspecified Exe location
Tota
l vis
its
Fishing/bait collecting Watersports
Other Amusements/kids playground
Bicycling Swim/paddle/sit/play on the beach
Pub/cafe Wildlife watching
Dog walking Walking
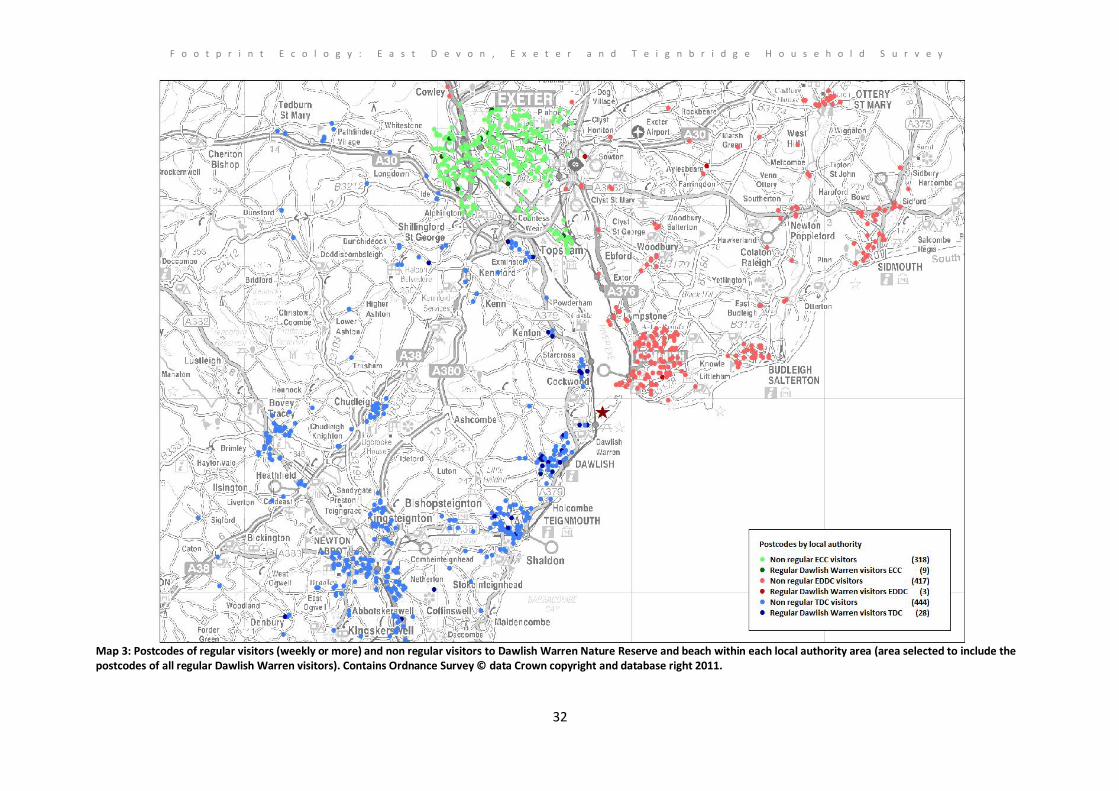
F o o t p r i n t E c o l o g y : E a s t D e v o n , E x e t e r a n d T e i g n b r i d g e H o u s e h o l d S u r v e y
32
Map 3: Postcodes of regular visitors (weekly or more) and non regular visitors to Dawlish Warren Nature Reserve and beach within each local authority area (area selected to include the postcodes of all regular Dawlish Warren visitors). Contains Ordnance Survey © data Crown copyright and database right 2011.

F o o t p r i n t E c o l o g y : E a s t D e v o n , E x e t e r a n d T e i g n b r i d g e H o u s e h o l d S u r v e y
33
4.11 Looking at visits for dog walking alone, the most popular locations for Teignbridge
residents are Dawlish Warren Beach (42% of all Teignbridge dog walking visits to the
Exe/Warren), Dawlish Warren Nature Reserve (19%) and ‘Unspecified Exe location’ (19%)
(Table 24). The highest proportion of dog walking visits to the Exmouth LNR/duckpond
came from residents of Exeter area whilst East Devon residents undertook most dog
walking visits to the remaining locations near Exmouth. East Devon residents are
responsible for more than half of all visits to the Exe for dog walking with each dog walker
from the East Devon area visiting the Exe 105 times per year (roughly twice a week).
Table 24: Number (%) of visits to locations on the exe made for dog walking by residents from each local authority area. The local authority contributing the highest proportion of the dog walking visits to each location is shown in bold.
Location Teignbridge Exeter City East Devon Total
Dawlish Warren Beach 1758 (86) 208 (10) 72 (4) 2038 (12)
Dawlish Warren Nature Reserve 796 (86) 80 (9) 48 (5) 924 (6)
Exmouth LNR/ Duckpond 32 (6) 290 (50) 256 (44) 578 (4)
Exmouth Seafront 446 (9) 642 (13) 3992 (79) 5080 (31)
Imperial Recreation Ground 24 (4) 56 (10) 506 (86) 586 (4)
The Maer 346 (15) 390 (37) 1576 (47) 2312 (14)
Unspecified Exe location 788 (16) 1796 (21) 2260 (53) 4844 (30)
Total 4190 (26) 3462 (21) 8710 (53) 16362
Total dog walking households 72 41 83 196
Mean visits per dog walker 58 84 105 83
4.12 Visits to the Exe according to house type are summarised in Figure 3. The majority of visits
were made by people living in large houses (more than 2 bedrooms). The true influence of
house type is difficult to determine given the spatial variation in character of houses (i.e.
particular types of house are likely to dominate in particular places). Differences were
significant between house types (comparing bungalows, flats and the two sizes of house,
χ227=7223; p<0.001). As can be seen from Figure 3 key differences were that a high
proportion of people who lived in bungalows tended to go walking compared to the other
house types; a comparatively high proportion of dog walkers at the Exe lived in bungalows,
flats or houses with less than two bedrooms and a comparatively high proportion of those
who lived in either type of house visited to undertake watersports. The most marked
association was between fishing/bait collecting and people living in houses, particularly
small houses (1 or 2 bedrooms).

F o o t p r i n t E c o l o g y : E a s t D e v o n , E x e t e r a n d T e i g n b r i d g e H o u s e h o l d S u r v e y
34
Figure 3: The number of visits to the Exe and activities undertaken with respect to house type.
Visitor rates to the Exe
4.13 Visitor rates (the number of visits per household per year) to the Exe Estuary (combining
all individual locations) were plotted in relation to distance. These plots were derived by
calculating the number of visits made by all respondents living within successive distance
bands around the Exe, and then dividing this number of visits by the number of
respondents. Lines were fitted through the points to provide easy visual summaries of the
data. These plots, shown for different modes of transport and for dog walking and
watersports (Figure 4 and Figure 5), highlight the distances at which relatively few visits
are made, on average, by each household. The plots indicate the approximate distances
from the estuary at which new development might be expected to result in relatively little
additional access at the Exe. It can be seen that, for all activities and all modes of
transport combined, visitor rates tend to ‘flatten off’ at around 12km. The settlements
which fall at these distances of 5km and 12km are shown in Map 4. The sample size for
watersports was relatively small, and so we have not plotted a line for these points (Figure
5), but it would appear that people living within 5km of the estuary tend to visit
disproportionately more (to undertake watersports) than those living greater distances
away.
0
10000
20000
30000
40000
50000
60000
70000
Flat Bungalow House (1 or 2 bedrooms)
House (more than 2
bedrooms)
Other
Nu
mb
er o
f vi
sits
Other
Amusements/kids playground
Swim/paddle/sit/play on the beach
Fishing/bait collecting
Watersports
Pub/cafe
Bicycling
Wildlife watching
Dog walking
Walking
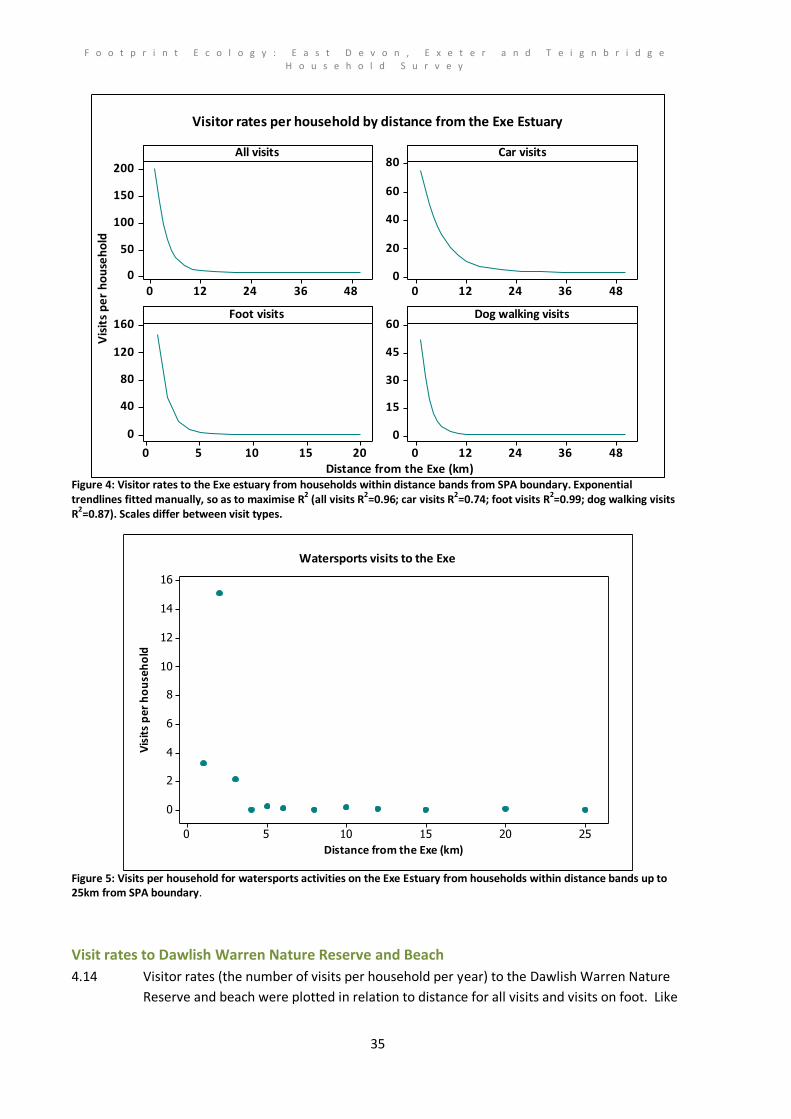
F o o t p r i n t E c o l o g y : E a s t D e v o n , E x e t e r a n d T e i g n b r i d g e H o u s e h o l d S u r v e y
35
483624120
200
150
100
50
0483624120
80
60
40
20
0
20151050
160
120
80
40
0
483624120
60
45
30
15
0
All visits Car visits
Foot visits Dog walking visits
Visitor rates per household by distance from the Exe Estuary
Distance from the Exe (km)
Vis
its
pe
r h
ou
seh
old
Figure 4: Visitor rates to the Exe estuary from households within distance bands from SPA boundary. Exponential trendlines fitted manually, so as to maximise R
2 (all visits R
2=0.96; car visits R
2=0.74; foot visits R
2=0.99; dog walking visits
R2=0.87). Scales differ between visit types.
Distance from the Exe (km)
Vis
its
per
ho
use
ho
ld
2520151050
16
14
12
10
8
6
4
2
0
Watersports visits to the Exe
Figure 5: Visits per household for watersports activities on the Exe Estuary from households within distance bands up to 25km from SPA boundary.
Visit rates to Dawlish Warren Nature Reserve and Beach
4.14 Visitor rates (the number of visits per household per year) to the Dawlish Warren Nature
Reserve and beach were plotted in relation to distance for all visits and visits on foot. Like

F o o t p r i n t E c o l o g y : E a s t D e v o n , E x e t e r a n d T e i g n b r i d g e H o u s e h o l d S u r v e y
36
the Exe, these plots were derived by calculating the number of visits made by all
respondents living within successive distance bands around the site (using a central point
of the nature reserve as the location), and then dividing this number of visits by the
number of respondents. Only data supplied by respondents on the west of the Exe
Estuary (using a cut off line north from Countess Wear Bridge to Tiverton) were included
as when looking at visit rates by distance bands the households to the east of the site will
be included despite the fact that they would have to drive all the way around the Exe to
reach Dawlish or use the water taxi (summer only). These plots show that for all visits
(activities and transport combined), the visitor rates flatten off around 11km indicating the
relatively local pull of the site. There are fewer foot visits to Dawlish Warren and foot
visits are seldom seen from households further than 5km. The settlements which fall at
these distances of 5km and 11km are shown in Map 4.
3020100
120
100
80
60
40
20
0
20151050
20
15
10
5
0
All visits Foot visits
Visit rates per household by distance from Dawlish Warren
Distance from Dawlish Warren (km)
Vis
its
pe
r h
ou
seh
old
Figure 6: Visitor rates to Dawlish Warren Nature Reserve and beach from households within distance bands from the reserve boundary to the west of the Exe SPA. Exponential trendlines fitted manually, so as to maximise R2 (all visits R2=0.38; foot visits R2=0.92). Scales differ between visit types.

F o o t p r i n t E c o l o g y : E a s t D e v o n , E x e t e r a n d T e i g n b r i d g e H o u s e h o l d S u r v e y
37
Map 4: Settlements and buffers around the Dawlish Warren and the Exe estuary. Contains Ordnance Survey data Crown © copyright and database right 2011.
Conclusion The Exe was the busiest location with 67,662 visits per year and the majority were made by visitors from East Devon District due to the high density of housing along the eastern edge of the estuary. From the categorised locations, Exmouth seafront was the most popular whilst the majority of visits to Dawlish Warren Nature Reserve were made by Teignbridge residents. Car was the most popular mode of transport to the Exe although many residents of Exmouth walk to their local seafront. Overall the most popular activity is walking. Differences were observed between the preferred locations of dog walkers from the different districts with Teignbridge dog walkers preferring Dawlish Warren Beach, East Devon dog walkers preferring Exmouth Seafront and Exeter City dog walkers most likely to use Exmouth LNR. Considering all activities and modes of transport, visitor rates to the Exe flatten off at 12km whilst the majority of foot visitors and dog walkers travel from within 5km. Considering all visits by car alone, 18km appears to be the distance at which visitor rates per household flatten off. The attractiveness of the estuary to watersports users is apparent with people living within 5km of the estuary tending to visit disproportionately more to go out on the water. 1.2
1.3

F o o t p r i n t E c o l o g y : E a s t D e v o n , E x e t e r a n d T e i g n b r i d g e H o u s e h o l d S u r v e y
38
5. Visits to Dartmoor
5.1 Households were asked about their visits to the Dartmoor National Park (DNP).
Respondents were asked to comment on visits to eight specific locations (A-H), the option
to comment on an additional 19 locations (1-19) plus the option to describe other
locations. The data on visit frequency, activities and transport for all types of responses
have been combined and are summarised below. With respect to the eight specific
locations in question C2, we have assumed that responses received refer to the site names
given in the table in question C2 rather than the labelled locations on the map (which are
incorrectly labelled).
5.2 The eight target locations were Steps Bridge/ Dunsford Wood/ Bridford Wood,
Newbridge/Spitchwick area, Dartmeet, Wistman’s Wood, Grimspound, Warren house Inn,
Yarner wood/Trendlebere Down and Postbridge. Of these locations the most popular,
each with more than 2500 visits (around 10%) from respondents, were Dartmeet,
Postbridge and Steps Bridge (Table 25). Residents from the Teignbridge area undertook
the most visits to Dartmoor with an average of 30.9 visits per year per household
undertaking 58% of the visits compared to only 17.5 visits by Exeter City residents
contributing 22% of the visits and 11.7 visits by East Devon residents (19% of the total
visits). Widecombe-in-the-Moor and Yarner Wood were the most visited locations by
residents from the Teignbridge area whereas Steps Bridge, Postbridge and Dartmeet stood
out for Exeter City and East Devon residents (Table 25, Figure 7).
Table 25: Number of annual visits and number of households that visit locations on Dartmoor. Mapped locations from question C2 in bold, locations omitted from question C2 in bold italic and mapped locations 1-19 in plain text. The percentage of visits from residents of each local authority to each site is shown in brackets and the local authority contributing the most visits shown in bold.
Location Teignbridge Exeter City East Devon Total
Visits Responses Visits Responses Visits Responses Visits Responses
Dartmeet 1340 (52) 231 596 (23) 133 632 (25) 152 2568 516
Postbridge 1164 (46) 203 704 (28) 147 656 (26) 150 2524 500
Steps Bridge 1186 (47) 161 816 (32) 171 520 (21) 119 2522 451
Yarner Wood 1552 (79) 150 212 (11) 51 200 (10) 50 1964 251
Warren house Inn 740 (48) 131 452 (30) 86 340 (22) 77 1532 294
Wistman’s Wood 824 (57) 151 272 (19) 66 344 (24) 69 1440 286
Grimspound 560 (53) 110 288 (27) 61 204 (19) 49 1052 220
Newbridge 336 (81) 78 80 (19) 9 0 416 87
Haytor 926 (78) 74 136 (11) 28 128 (11) 32 1190 134
Holne Moor 96 (96) 14
4 (4) 1 100 15
Lustleigh Cleave/Bovey Valley
740 (92) 35 12 (1) 3 56 (7) 14 808 52
Widecombe in the Moor 1632 (70) 170 280 (12) 66 408 (18) 92 2320 328
Teign Valley Woods/ Castle Drogo/Fingle Bridge/Clifford Bridge
804 (50) 115 452 (28) 93 360 (22) 82 1616 290
Princetown/Whiteworks 432 (49) 87 204 (23) 41 248 (28) 56 884 184

F o o t p r i n t E c o l o g y : E a s t D e v o n , E x e t e r a n d T e i g n b r i d g e H o u s e h o l d S u r v e y
39
Location Teignbridge Exeter City East Devon Total
Visits Responses Visits Responses Visits Responses Visits Responses
River Dart Country Park 530 (70) 50 88 (12) 22 144 (19) 34 762 106
Kennick/Trenchford/ Tottiford Reservoirs
492 (72) 74 148 (22) 26 44 (6) 11 684 111
Fernworthy Wood and Reservoir
252 (48) 43 176 (34) 36 96 (18) 22 524 101
Belstone/River Taw 176 (36) 27 228 (46) 49 88 (18) 22 492 98
Hembury Woods 386 (86) 29 28 (6) 7 36 (8) 9 450 45
Lydford 104 (24) 24 200 (46) 39 132 (30) 33 436 96
Ivybridge/South Brent/South Moor
212 (60) 27 72 (20) 16 72 (20) 18 356 61
Burrator Reservoir/Sheepstor
140 (41) 33 84 (24) 21 120 (35) 28 344 82
Meldon Reservoir 120 (36) 21 140 (42) 33 72 (22) 18 332 72
Okehampton Camp/military loop road
72 (30) 9 104 (43) 24 64 (27) 16 240 49
Merrivale 128 (62) 21 32 (15) 6 48 (23) 10 208 37
Shipley Bridge/Avon Down
156 (78) 24 32 (16) 6 12 (6) 3 200 33
Cadover Bridge 48 (60) 8 12 (15) 3 20 (25) 5 80 16
Harford Moor 52 (81) 4 4 (6) 1 8 (13) 2 64 7
Sourton/Prewley 4 (8) 1 32 (67) 6 12 (25) 3 48 10
Shaugh Bridge 16 (44) 4
20 (56) 5 36 9
Free text locations 376 (58) 33 132 (20) 23 140 (22) 25 648 81
Total 15596
(58) 2143 6016 (22) 1275 5228 (19) 1210 26840 4622
Total respondents 504 344 448 1219
Mean per respondent 30.9 17.5 11.7 22
Figure 7: Number of visits to each location on Dartmoor by respondents from each local authority area.
0
2000
4000
6000
8000
10000
12000
Tota
l vis
its
EDDC
ECC
TDC

F o o t p r i n t E c o l o g y : E a s t D e v o n , E x e t e r a n d T e i g n b r i d g e H o u s e h o l d S u r v e y
40
5.3 There were significant differences in the proportion of questionnaire responses received
according to distance from the Dartmoor National Park boundary (χ25 = 18.301; p=0.003).
In particular there was a high proportion (33%) of responses received from the relatively
small number of households that were within 1km of the national park boundary (Table
26).
Table 26: The proportion of households responding to the postal questionnaire within different fixed distance bands from Dartmoor National Park Boundary
Distance band from
Dartmoor (km)
Total number of questionnaires
sent
Total number of responses received
Percentage of questionnaires received from those sent per distance band
Number of visits from respondents
within distance band per year
Number of houses within distance
band
1 90 35 39 4208 28445
5 418 123 29 7874 70396
10 1720 415 24 14468 217601
15 3472 820 24 22012 350731
20 4027 951 24 23836 405164
25 4206 1005 24 24588 434442

F o o t p r i n t E c o l o g y : E a s t D e v o n , E x e t e r a n d T e i g n b r i d g e H o u s e h o l d S u r v e y
41
Map 5: Postcodes of respondents within each local authority area that either visit or do not visit Dartmoor (combined data on locations A-H, 1-19 and free text from section C). Contains Ordnance Survey data Crown © copyright and database right 2011.

F o o t p r i n t E c o l o g y : E a s t D e v o n , E x e t e r a n d T e i g n b r i d g e H o u s e h o l d S u r v e y
42
5.4 As would be expected the most visits to Dartmoor were made by car (88%), and people
tended to travel quite some distance to reach the sites visited (Table 27), particularly when
compared to the Exe. Half of all people travelling by car lived at least 26km from the site
they stated they visited.
Table 27: Number of visits made to Dartmoor (eight specific locations A-H plus Holne Moor, Haytor and Lustleigh/Bovey) by each transport combination, the minimum, maximum and median distances from the home postcode to the site.
Transport Number (%)
of visits Number of responses
Min distance (km)
Median distance (km) Max distance
(km)
Car/van 13772 (88) 2590 2.094 25.508 73.638
Car/van-foot-bike 682 (4) 39 4.08 20.44 33.17
Foot 560 (4) 13 2.05 11.49 34.43
Other 382 (2) 20 2.05 18.08 68.36
Public transport 184 (1) 33 4.02 24.72 35.85
Bicycling 116 (1) 10 4.26 12.39 31.95
Total 15696 2705
Figure 8: The number of visits made to each location on Dartmoor by transport type.
5.5 Dartmoor also appears to draw people for different reasons than the Exe and other sites.
Figure 9 and Table 28 show the number of visits made by respondents to the key sites.
Walking and dog walking are the main activities, but other activities such as mountain
biking, remote camping, horse riding and rock climbing feature. While walking was the
activity undertaken on by far the majority of visits, ‘Pub/cafe’ was the third most popular
0
500
1000
1500
2000
2500
3000
Nu
mb
er o
f vi
sits
Bicycling Public transport Other Foot Car/van-foot-bike Car/van

F o o t p r i n t E c o l o g y : E a s t D e v o n , E x e t e r a n d T e i g n b r i d g e H o u s e h o l d S u r v e y
43
cited activity. Wildlife watching was particularly popular at Steps Bridge, Yarner,
Grimspond, Dartmeet and Wistman’s Wood, with it being the second most popular activity
after walking at Yarner, Wistman’s and Grimspound
Figure 9: The number of visits for each activity category to each location on Dartmoor.
0
2000
4000
6000
8000
10000
12000
14000
Nu
mb
er
of
visi
ts
Wildlife watching Rock climbing Horse riding Mountain biking
Remote camping Pub/cafe Canoeing Off roading
Bicycling Hiking Dog walking Walking
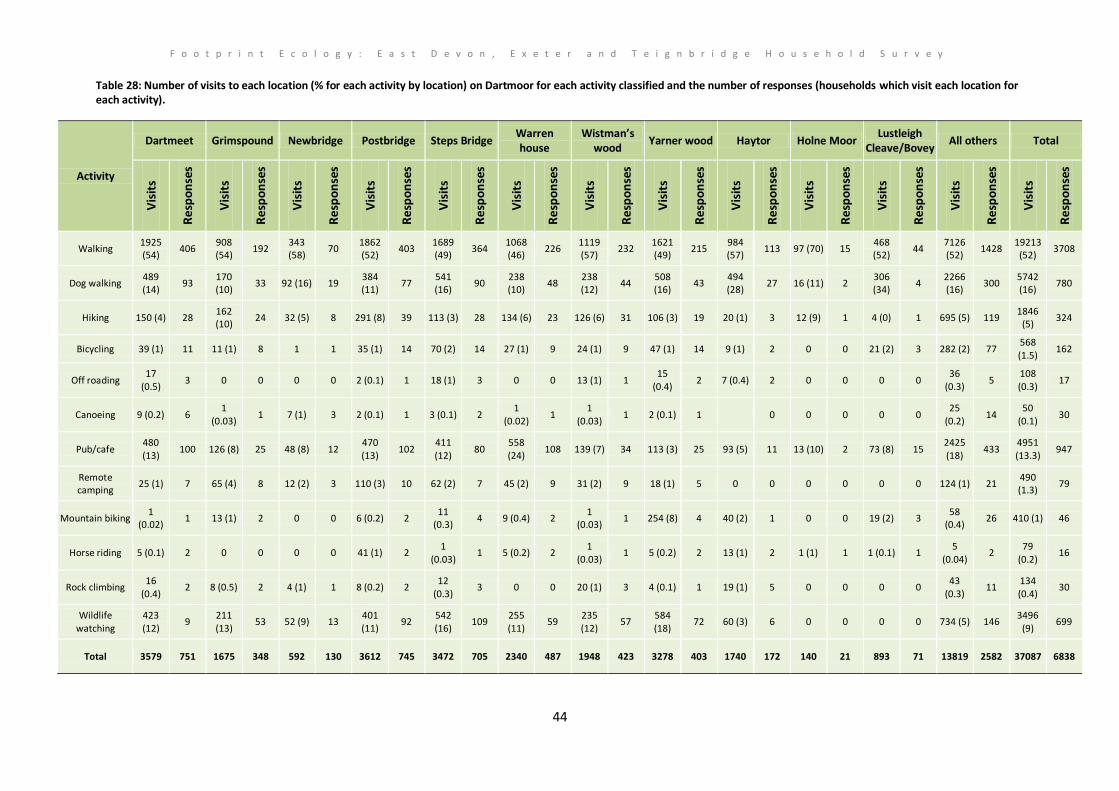
F o o t p r i n t E c o l o g y : E a s t D e v o n , E x e t e r a n d T e i g n b r i d g e H o u s e h o l d S u r v e y
44
Table 28: Number of visits to each location (% for each activity by location) on Dartmoor for each activity classified and the number of responses (households which visit each location for each activity).
Activity
Dartmeet Grimspound Newbridge Postbridge Steps Bridge Warren house
Wistman’s wood
Yarner wood Haytor Holne Moor Lustleigh
Cleave/Bovey All others Total
Vis
its
Re
spo
nse
s
Vis
its
Re
spo
nse
s
Vis
its
Re
spo
nse
s
Vis
its
Re
spo
nse
s
Vis
its
Re
spo
nse
s
Vis
its
Re
spo
nse
s
Vis
its
Re
spo
nse
s
Vis
its
Re
spo
nse
s
Vis
its
Re
spo
nse
s
Vis
its
Re
spo
nse
s
Vis
its
Re
spo
nse
s
Vis
its
Re
spo
nse
s
Vis
its
Re
spo
nse
s
Walking 1925 (54)
406 908 (54)
192 343 (58)
70 1862 (52)
403 1689 (49)
364 1068 (46)
226 1119 (57)
232 1621 (49)
215 984 (57)
113 97 (70) 15 468 (52)
44 7126 (52)
1428 19213
(52) 3708
Dog walking 489 (14)
93 170 (10)
33 92 (16) 19 384 (11)
77 541 (16)
90 238 (10)
48 238 (12)
44 508 (16)
43 494 (28)
27 16 (11) 2 306 (34)
4 2266 (16)
300 5742 (16)
780
Hiking 150 (4) 28 162 (10)
24 32 (5) 8 291 (8) 39 113 (3) 28 134 (6) 23 126 (6) 31 106 (3) 19 20 (1) 3 12 (9) 1 4 (0) 1 695 (5) 119 1846
(5) 324
Bicycling 39 (1) 11 11 (1) 8 1 1 35 (1) 14 70 (2) 14 27 (1) 9 24 (1) 9 47 (1) 14 9 (1) 2 0 0 21 (2) 3 282 (2) 77 568 (1.5)
162
Off roading 17
(0.5) 3 0 0 0 0 2 (0.1) 1 18 (1) 3 0 0 13 (1) 1
15 (0.4)
2 7 (0.4) 2 0 0 0 0 36
(0.3) 5
108 (0.3)
17
Canoeing 9 (0.2) 6 1
(0.03) 1 7 (1) 3 2 (0.1) 1 3 (0.1) 2
1 (0.02)
1 1
(0.03) 1 2 (0.1) 1 0 0 0 0 0
25 (0.2)
14 50
(0.1) 30
Pub/cafe 480 (13)
100 126 (8) 25 48 (8) 12 470 (13)
102 411 (12)
80 558 (24)
108 139 (7) 34 113 (3) 25 93 (5) 11 13 (10) 2 73 (8) 15 2425 (18)
433 4951 (13.3)
947
Remote camping
25 (1) 7 65 (4) 8 12 (2) 3 110 (3) 10 62 (2) 7 45 (2) 9 31 (2) 9 18 (1) 5 0 0 0 0 0 0 124 (1) 21 490 (1.3)
79
Mountain biking 1
(0.02) 1 13 (1) 2 0 0 6 (0.2) 2
11 (0.3)
4 9 (0.4) 2 1
(0.03) 1 254 (8) 4 40 (2) 1 0 0 19 (2) 3
58 (0.4)
26 410 (1) 46
Horse riding 5 (0.1) 2 0 0 0 0 41 (1) 2 1
(0.03) 1 5 (0.2) 2
1 (0.03)
1 5 (0.2) 2 13 (1) 2 1 (1) 1 1 (0.1) 1 5
(0.04) 2
79 (0.2)
16
Rock climbing 16
(0.4) 2 8 (0.5) 2 4 (1) 1 8 (0.2) 2
12 (0.3)
3 0 0 20 (1) 3 4 (0.1) 1 19 (1) 5 0 0 0 0 43
(0.3) 11
134 (0.4)
30
Wildlife watching
423 (12)
9 211 (13)
53 52 (9) 13 401 (11)
92 542 (16)
109 255 (11)
59 235 (12)
57 584 (18)
72 60 (3) 6 0 0 0 0 734 (5) 146 3496
(9) 699
Total 3579 751 1675 348 592 130 3612 745 3472 705 2340 487 1948 423 3278 403 1740 172 140 21 893 71 13819 2582 37087 6838

F o o t p r i n t E c o l o g y : E a s t D e v o n , E x e t e r a n d T e i g n b r i d g e H o u s e h o l d S u r v e y
45
5.6 Most dog walking visits to Dartmoor are made by residents of Teignbridge District. While
most dog walkers at most sites are from Teignbridge District, Steps Bridge appears to be
used as much by dog walkers from Exeter whereas Postbridge is used mainly by dog
walkers from East Devon (Table 29).
Table 29: Number (%) of visits to locations on Dartmoor made for dog walking by residents from each local authority area.
Location
Teignbridge Exeter City East Devon Total
Number of visits
Number of
responses
Number of visits
Number of
responses
Number of visits
Number of
responses
Total visits
Responses
Dartmeet 225 (46) 37 108 (22) 21 156 (32) 35 489 93
Steps bridge 208 (38) 29 208 (38) 31 125 (23) 30 541 90
Postbridge 164 (43) 28 80 (21) 18 140 (36) 31 384 77
Warren house 102 (43) 20 60 (25) 11 76 (32) 17 238 48
Yarner wood 448 (88) 28 24 (5) 6 36 (7) 9 508 43
Wistmans 138 (58) 23 36 (15) 9 64 (27) 12 238 44
Grimspound 98 (58) 15 40 (24) 10 32 (19) 8 170 33
Newbridge 64 (70) 14 28 (30) 5 0 (0) 0 92 19
Haytor 438 (89) 15 20 (4) 3 36 (7) 9 494 27
Holne Moor 12 (75) 1 0 (0) 4 (25) 1 16 2
Lustleigh / Bovey 306
(100) 4 0 (0) 0 0 (0) 0 306 4
All others 1330 (59)
109 440 (19) 81 496 (22) 110 2266 300
Total 3533 (62)
323 1044 (18)
195 1165 (20)
262 5742 780
Mean visits per dog walker
11 5.4 4.4 7.4
Total respondents 504 344 448 1296
Mean dog walking visits per respondent
7 3 3 4.4
5.7 To analyse the difference between house types and the number of visits made to
Dartmoor for different activities we excluded the category ‘other’ house type and also
activities with no visits made for any particular house type category (rock climbing,
mountain biking, horse riding, off roading) i.e. if there were no visits by horse riders living
in flats then this combination was excluded. Therefore considering the eight remaining
activities for flats, bungalows and the two types of house categories, differences were
significant between house types (χ221=897.9; p<0.001). As can be seen from Figure 10, key
differences were that a high proportion of people who lived in bungalows tended to go
walking and dog walking compared to the remaining house types. Cycling was more
popular with respondents that lived in houses compared to flats.

F o o t p r i n t E c o l o g y : E a s t D e v o n , E x e t e r a n d T e i g n b r i d g e H o u s e h o l d S u r v e y
46
Figure 10: The number of visits to Dartmoor and activities undertake with respect to household type.
Additional locations on Dartmoor
5.8 Free text responses were also given by 63 respondents detailing 648 visits to 36 locations.
The location names were standardised as far as possible and the responses are shown in
Table 30. The most popular location receiving 192 visits from 20 respondents was Hound
Tor.
Table 30: Free text locations visited on Dartmoor with at least 10 annual visits. Locations were combined where they were the same or similar.
Location Number of
households visiting Number of visits
Hound Tor 20 192
Manaton 4 124
‘All’/ ‘Various Tors’/ ‘reservoirs’ 7 44
Tavistock 5 44
Chagford 4 32
Buckfastleigh 4 24
Saddle Tor 2 16
Bonehill 1 12
north moors 1 12
Rippon Tor 1 12
Sharp Tor 1 12
Venford Reservoir 3 12
Becky Falls 2 8
Bellever 2 8
Canonteign 2 8
0
5000
10000
15000
20000
25000
Flat Bungalow House (1 or 2 bedrooms)
House (more than 2 bedrooms)
Other
Nu
mb
er
of
visi
ts
Wildlife watching Rock climbing Horse riding Mountain biking
Remote camping Pub/cafe Canoeing Off roading
Bicycling Hiking Dog walking Walking

F o o t p r i n t E c o l o g y : E a s t D e v o n , E x e t e r a n d T e i g n b r i d g e H o u s e h o l d S u r v e y
47
Location Number of
households visiting Number of visits
Yelverton 2 8
Bel Tor 1 4
Brentor 1 4
Bridestone 1 4
Castle Keys 1 4
Drewsteignton 1 4
Fingle Bridge 1 4
Hangingstone 1 4 Heathercombe 1 4
Hexworthy 1 4
Higher Wilhays 1 4
Honey Bags 1 4
Huccaby 1 4
Mardon Down 1 4
Mavy Tavy 1 4
Min Pony Centre 1 4
Morwellan 1 4
Okehampton 1 4
Peter Tavey 1 4
Scophill 1 4
Winter Tor 1 4
Visit rates to Dartmoor
5.9 Visitor rates to Dartmoor (combining all individual locations and free text locations) were
plotted in relation to distance. These plots were derived by calculating the number of
visits made by all respondents living within successive distance bands around Dartmoor,
and then dividing this number of visits by the number of respondents. These plots, shown
for different modes of transport and activities (dog walking and outdoor pursuits which
includes hiking, off roading, canoeing, remote camping, mountain biking, horse riding and
rock climbing) (Table 11), highlight the distances at which relatively few visits are made, on
average, by each household. Relatively few visits for all categories are made beyond 10km
with foot visits tailing off around 4-5km. Given the westerly position of Dartmoor within
the study area, the distance 10km from the boundary includes the western side of Exeter,
Newton Abbot and Kingskerswell (Map 6). Beyond this distance relatively few additional
visits would be made to Dartmoor from increased housing levels if patterns of recreation
behaviour remain the same into the future.
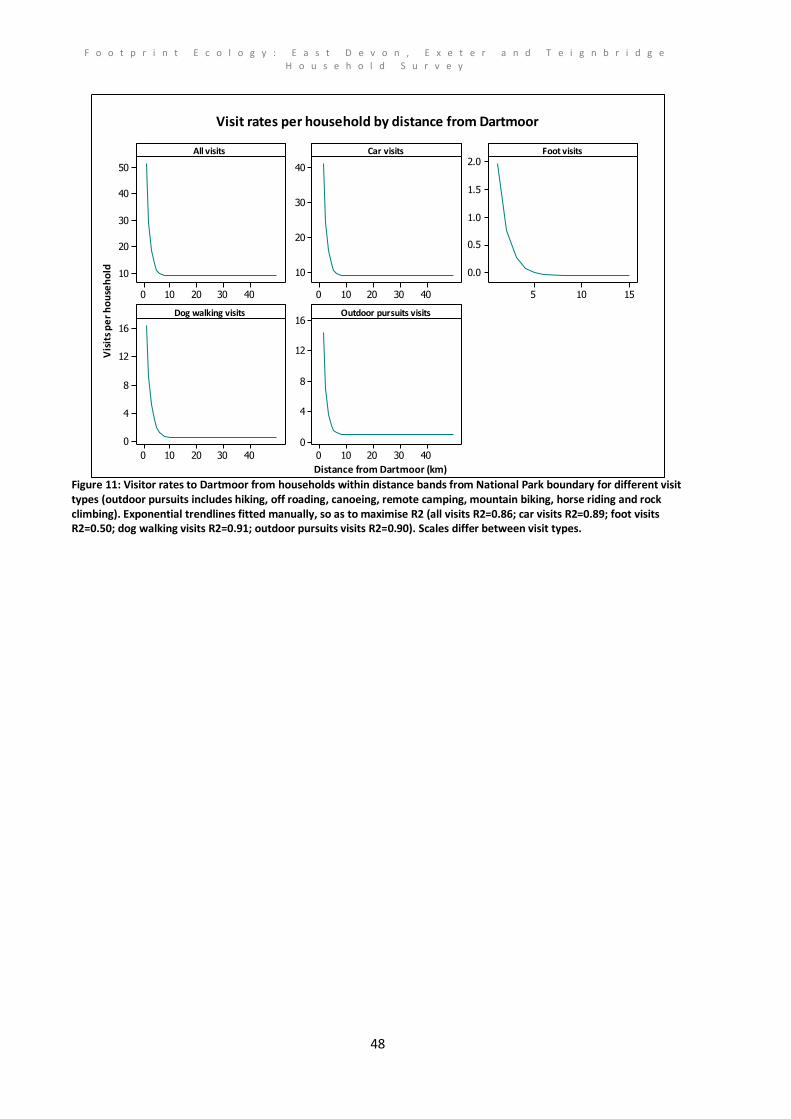
F o o t p r i n t E c o l o g y : E a s t D e v o n , E x e t e r a n d T e i g n b r i d g e H o u s e h o l d S u r v e y
48
403020100
50
40
30
20
10
403020100
40
30
20
10
15105
2.0
1.5
1.0
0.5
0.0
403020100
16
12
8
4
0
403020100
16
12
8
4
0
All visits Car visits Foot visits
Dog walking visits Outdoor pursuits visits
Visit rates per household by distance from Dartmoor
Distance from Dartmoor (km)
Vis
its
pe
r h
ou
seh
old
Figure 11: Visitor rates to Dartmoor from households within distance bands from National Park boundary for different visit types (outdoor pursuits includes hiking, off roading, canoeing, remote camping, mountain biking, horse riding and rock climbing). Exponential trendlines fitted manually, so as to maximise R2 (all visits R2=0.86; car visits R2=0.89; foot visits R2=0.50; dog walking visits R2=0.91; outdoor pursuits visits R2=0.90). Scales differ between visit types.

F o o t p r i n t E c o l o g y : E a s t D e v o n , E x e t e r a n d T e i g n b r i d g e H o u s e h o l d S u r v e y
49
Map 6: Settlements and 4km and 10km buffers around the Dartmoor National Park Boundary. Contains Ordnance Survey data Crown © copyright and database right 2011.
Conclusion A third of responses were from houses within 1km of the National Park boundary and Teignbridge District residents undertook the most visits to Dartmoor with an average of 30.9 visits per year per household. Dartmeet, Postbridge and Steps Bridge were the most popular target locations. Widecombe-in-the-Moor and Yarner Wood were the most visited locations by residents from the Teignbridge area whereas Steps Bridge, Postbridge and Dartmeet stood out for Exeter City and East Devon residents. Due to the nature of the National Park a very high proportion of visits were made by car and travel distances are typically higher than for other sites due to the attractiveness of the site for day trips and days out. Therefore whilst people may travel further to reach Dartmoor, they visit the site less frequently. Walking and dog walking are the main activities, but due to the terrain, other activities such as mountain biking, remote camping, horse riding and rock climbing feature. Most dog walking visits to Dartmoor are made by residents of Teignbridge District. A link was seen between outdoor pursuits (horse riding, mountain biking etc) which require specialist equipment and space to store the equipment and people living in houses compared to smaller dwellings.

F o o t p r i n t E c o l o g y : E a s t D e v o n , E x e t e r a n d T e i g n b r i d g e H o u s e h o l d S u r v e y
50
6. Visits to the Pebblebed Heaths
6.1 Households were asked about their visits to the Pebblebed Heaths. Respondents were
asked to comment on visits to seven specific locations on the Heaths within the ‘Visits to
other countryside places’ section. The information regarding these seven locations is
summarised below. We have assumed that responses received refer to the site names
given in the table on the questionnaire.
Map 7: Seven locations on the Pebblebeds which respondents were asked to provide information about. Contains Ordnance Survey data Crown © copyright and database right 2011.
6.2 East Devon residents make 82.9% of the 20,724 annual visits to the Pebblebeds by
respondents followed by 12.4% by Exeter City residents and only 4.7% by Teignbridge
residents (Table 31). There were significant differences between local authorities in the
proportions of visits made to the different sites in Table 31 (χ212 = 258.96, p < 0.001).
Particular differences were that it seems Exeter residents favour Lympstone Common,
Colaton Raleigh and Woodbury. A higher than expected number of Teignbridge residents
stated they visited Venn Ottery.

F o o t p r i n t E c o l o g y : E a s t D e v o n , E x e t e r a n d T e i g n b r i d g e H o u s e h o l d S u r v e y
51
Table 31: Number of annual visits and number of households that visit Pebblebed locations. The percentage of visits from residents of each local authority to each site is shown in brackets.
Location Teignbridge Exeter City East Devon Total
Number of visits
Number of responses
Number of visits
Number of responses
Number of visits
Number of responses
Number of visits
Number of responses
Woodbury 412 (42) 85 1118 (44) 140 5658 (33) 256 7188 (35) 481
East Budleigh 140 (14) 27 396 (15) 52 2878 (17) 126 3414 (16) 205
Lympstone 104 (11) 20 300 (12) 38 2780 (16) 85 3184 (15) 143
Colaton Raleigh 96 (10) 20 236 (9) 31 2276 (13) 82 2608 (13) 133
Aylesbeare 92 (9) 19 224 (9) 37 2018 (12) 95 233 (11) 151
Hawkerland 48 (5) 10 148 (6) 20 918 (5) 65 1114 (5) 95
Venn Ottery 84 (9) 19 144 (6) 28 654 (4) 55 882 (4) 102
Total 976 (4.7) 200 2566 (12.4)
346 17182 (82.9)
764 20724 1310
Total respondents
504 344 448 1219
Mean per respondent
1.9 7.5 38.4 17
6.3 There was no significant difference (χ25 = 0.899, p =0.970) in the proportion of people
responding and distance from the named sites in Table 31, indicating that people living
near these sites were not more likely to complete and return the questionnaire (Table 32).
Visit rates to the named sites declined with distance, with residents within 1km making on
average 141 visits per year to the Pebblebed Heaths and residents living within 1-5km
making around half that number of visits per year.
Table 32: The proportion of households responding to the postal questionnaire within different fixed distance bands from the Pebblebeds Commons
Distance band from Pebblebeds
(km)
Total number of
questionnaires sent
Total number if responses
received
Percentage of questionnaires received from those sent per distance band
Number of visits from
respondents within distance band per year
Number of houses within distance band
Number of visits per household
per year
1 31 7 23 984 1514 140.6
5 830 213 26 15452 29562 72.5
10 1744 428 25 17982 60182 42.0
15 3610 808 22 19524 120099 24.2
20 4253 960 23 20000 147426 20.8
25 4985 1148 23 20272 218793 17.7
6.4 Map 6 shows the home postcodes of those respondents who stated that they visited the
specified Pebblebed sites. Regular visitors live in surrounding settlements such as Ottery
St. Mary, Sidmouth, Budleigh Salterton and Exmouth. The map shows six regular visitors
from Exeter and no regular visitors from Teignbridge District.
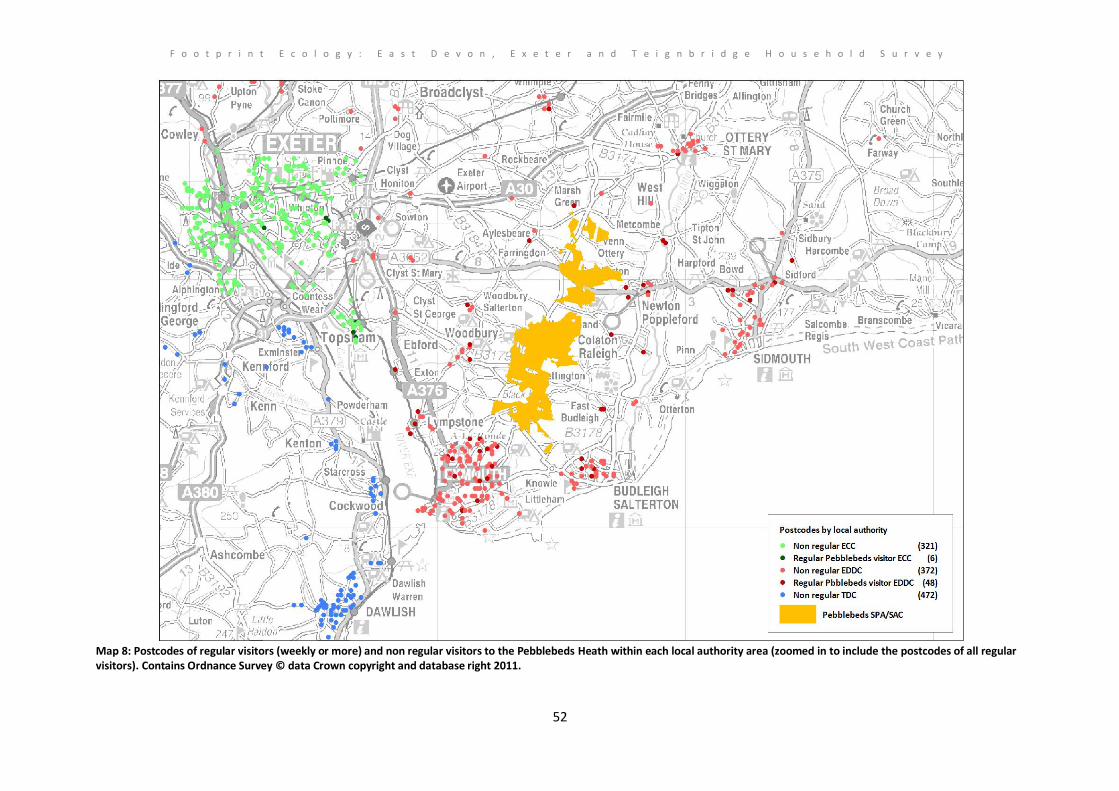
F o o t p r i n t E c o l o g y : E a s t D e v o n , E x e t e r a n d T e i g n b r i d g e H o u s e h o l d S u r v e y
52
Map 8: Postcodes of regular visitors (weekly or more) and non regular visitors to the Pebblebeds Heath within each local authority area (zoomed in to include the postcodes of all regular visitors). Contains Ordnance Survey © data Crown copyright and database right 2011.

F o o t p r i n t E c o l o g y : E a s t D e v o n , E x e t e r a n d T e i g n b r i d g e H o u s e h o l d S u r v e y
53
6.5 The majority (80%) of visits to the specified Pebblebed Heath sites were made by car, with
car drivers typically living within a distance of 10.6km – half of all drivers lived within this
distance. Visitors arriving on foot accounted for around 10% of visits to the Pebblebed
sites (Table 33). Venn Ottery and Hawkerland were notable in attracting a very small
proportion of people arriving on foot (Figure 12).
Table 33: Number of visits made to the Pebblebeds by each transport combination, the minimum, maximum and median distances travelled from the home postcode to the site and median distances for outdoor pursuits and dog walking visits.
Transport Number (%)
of visits Min distance travelled
(km) Median distance
travelled (km) Max distance travelled
(km)
Car/van 15352 (80) 1.37 10.6 38.66
Foot 2020 (10) 1.32 4.04 27.47
Bike 872 (5) 1.61 6.34 27.06
Car/van - foot 592 (3) 1.78 4.86 15.7
Car/ bike 284 (1) 3.38 8.75 25.9
Other 92 (0) 6.71 21.33 25.99
Public transport 80 (0) 4.23 10.92 24.7
Total 19292
Figure 12: The number of visits made to each Pebblebeds location by transport type
6.6 The activities undertaken by each respondent at the specified Pebblebed sites are given in
Table 34. The difference in the total number of visits between Table 31and Table 34 is due
to the way that visit numbers were assigned to activities dependent on whether or not
they could occur simultaneously (see paragraph 4.7). Dog walking accounts for the most
visits. A total of 399 respondents stated that they visited the Pebblebeds to walk,
compared to 115 who listed dog walking, but the dog walkers clearly visit very regularly as
0
1000
2000
3000
4000
5000
6000
7000
8000
Aylesbeare East Budleigh
Colaton Raleigh
Hawkerland Lympstone Venn Ottery
Woodbury
Nu
mb
er
of
visi
ts
Public transport Other
Car/ bike
Car/van - foot
Bike

F o o t p r i n t E c o l o g y : E a s t D e v o n , E x e t e r a n d T e i g n b r i d g e H o u s e h o l d S u r v e y
54
the total number of visits for dog walkers was 10,942 per year compared to 10,343 for
walkers. Besides dog walking and walking, other activities included wildlife watching,
horse riding, mountain biking and kid’s activities.
6.7 Comparing between local authorities and focusing on dog walking it is clearly mainly East
Devon residents who visit the Pebblebed Heaths to walk their dog, which is perhaps to be
expected given their location. Across all the specified Pebbledbed Heath locations, 90% of
dog walkers were from East Devon, with nine percent from Exeter city and two percent
from Teignbridge District (Table 35).
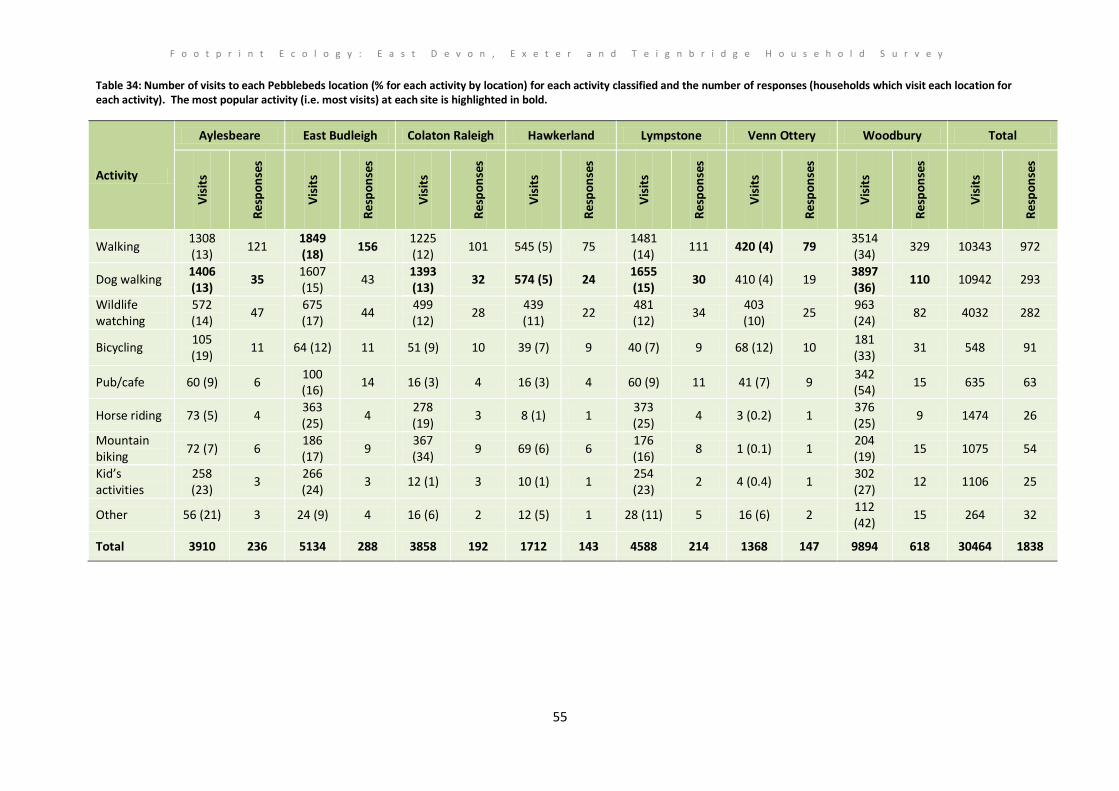
F o o t p r i n t E c o l o g y : E a s t D e v o n , E x e t e r a n d T e i g n b r i d g e H o u s e h o l d S u r v e y
55
Table 34: Number of visits to each Pebblebeds location (% for each activity by location) for each activity classified and the number of responses (households which visit each location for each activity). The most popular activity (i.e. most visits) at each site is highlighted in bold.
Activity
Aylesbeare East Budleigh Colaton Raleigh Hawkerland Lympstone Venn Ottery Woodbury Total
Vis
its
Re
spo
nse
s
Vis
its
Re
spo
nse
s
Vis
its
Re
spo
nse
s
Vis
its
Re
spo
nse
s
Vis
its
Re
spo
nse
s
Vis
its
Re
spo
nse
s
Vis
its
Re
spo
nse
s
Vis
its
Re
spo
nse
s
Walking 1308 (13)
121 1849 (18)
156 1225 (12)
101 545 (5) 75 1481 (14)
111 420 (4) 79 3514 (34)
329 10343 972
Dog walking 1406 (13)
35 1607 (15)
43 1393 (13)
32 574 (5) 24 1655 (15)
30 410 (4) 19 3897 (36)
110 10942 293
Wildlife watching
572 (14)
47 675 (17)
44 499 (12)
28 439 (11)
22 481 (12)
34 403 (10)
25 963 (24)
82 4032 282
Bicycling 105 (19)
11 64 (12) 11 51 (9) 10 39 (7) 9 40 (7) 9 68 (12) 10 181 (33)
31 548 91
Pub/cafe 60 (9) 6 100 (16)
14 16 (3) 4 16 (3) 4 60 (9) 11 41 (7) 9 342 (54)
15 635 63
Horse riding 73 (5) 4 363 (25)
4 278 (19)
3 8 (1) 1 373 (25)
4 3 (0.2) 1 376 (25)
9 1474 26
Mountain biking
72 (7) 6 186 (17)
9 367 (34)
9 69 (6) 6 176 (16)
8 1 (0.1) 1 204 (19)
15 1075 54
Kid’s activities
258 (23)
3 266 (24)
3 12 (1) 3 10 (1) 1 254 (23)
2 4 (0.4) 1 302 (27)
12 1106 25
Other 56 (21) 3 24 (9) 4 16 (6) 2 12 (5) 1 28 (11) 5 16 (6) 2 112 (42)
15 264 32
Total 3910 236 5134 288 3858 192 1712 143 4588 214 1368 147 9894 618 30464 1838
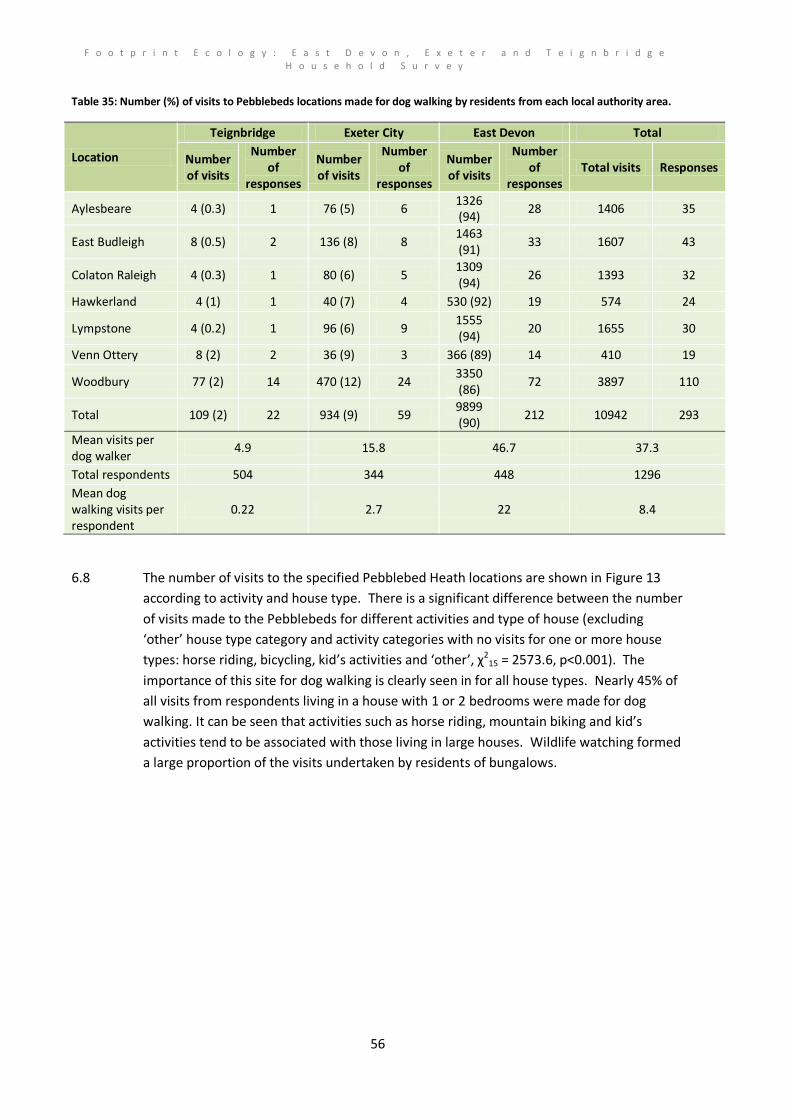
F o o t p r i n t E c o l o g y : E a s t D e v o n , E x e t e r a n d T e i g n b r i d g e H o u s e h o l d S u r v e y
56
Table 35: Number (%) of visits to Pebblebeds locations made for dog walking by residents from each local authority area.
Location
Teignbridge Exeter City East Devon Total
Number of visits
Number of
responses
Number of visits
Number of
responses
Number of visits
Number of
responses Total visits Responses
Aylesbeare 4 (0.3) 1 76 (5) 6 1326 (94)
28 1406 35
East Budleigh 8 (0.5) 2 136 (8) 8 1463 (91)
33 1607 43
Colaton Raleigh 4 (0.3) 1 80 (6) 5 1309 (94)
26 1393 32
Hawkerland 4 (1) 1 40 (7) 4 530 (92) 19 574 24
Lympstone 4 (0.2) 1 96 (6) 9 1555 (94)
20 1655 30
Venn Ottery 8 (2) 2 36 (9) 3 366 (89) 14 410 19
Woodbury 77 (2) 14 470 (12) 24 3350 (86)
72 3897 110
Total 109 (2) 22 934 (9) 59 9899 (90)
212 10942 293
Mean visits per dog walker
4.9 15.8 46.7 37.3
Total respondents 504 344 448 1296
Mean dog walking visits per respondent
0.22 2.7 22 8.4
6.8 The number of visits to the specified Pebblebed Heath locations are shown in Figure 13
according to activity and house type. There is a significant difference between the number
of visits made to the Pebblebeds for different activities and type of house (excluding
‘other’ house type category and activity categories with no visits for one or more house
types: horse riding, bicycling, kid’s activities and ‘other’, χ215 = 2573.6, p<0.001). The
importance of this site for dog walking is clearly seen in for all house types. Nearly 45% of
all visits from respondents living in a house with 1 or 2 bedrooms were made for dog
walking. It can be seen that activities such as horse riding, mountain biking and kid’s
activities tend to be associated with those living in large houses. Wildlife watching formed
a large proportion of the visits undertaken by residents of bungalows.

F o o t p r i n t E c o l o g y : E a s t D e v o n , E x e t e r a n d T e i g n b r i d g e H o u s e h o l d S u r v e y
57
Figure 13: The number of visits to the Pebblebeds and activities undertaken with respect to household type.
Visit rates to the Pebblebeds
6.9 In Figure 14 we summarise visit rates to the Pebblebed Heaths in relation to distance
considering all respondents. There are plots for all visits, car visits, foot visits and dog
walking visits. It can be seen that for all visits it is at distances of 10km and above that
households tend to make few visits (Figure 14, Map 9). Within 10km households tend to
visit frequently, particularly the closer they live to the site. Foot visitors to the Pebblebeds
drop off rapidly at 3km meaning that residents of settlements up to 3km away from the
site could contribute up to 50 foot visits per settlement (Woodbury, Exmouth, Newton
Poppleford, West Hill, East Budleigh and Budleigh Salterton) (Map 9).
6.10 To improve the accuracy of the visit rate curves we have presented them in Figure 15 using
data derived from respondents within an area to the east and north of the Exe SPA only
(excluding all respondents to the southwest of a line drawn from Countess Wear Bridge to
Crediton) (Figure 15). Given the highly localised use of the Pebblebed Heaths it appears
that visitors from the west of the Exe Estuary were not contributing a huge number of
visits and the visit rates remain the same. Therefore the main effect of reducing the area
to be included was to increase the number of visits per household since households which
did not visit or visited infrequently were excluded.
0
2000
4000
6000
8000
10000
12000
14000
16000
18000
20000
Flat Bungalow House (1 or 2 bedrooms)
House (more than 2
bedrooms)
Other
Nu
mb
er o
f vi
sits
Other
Kids activities
Mountain biking
Horse riding
Pub/cafe
Bicycling
Wildlife watching
Dog walking
Walking

F o o t p r i n t E c o l o g y : E a s t D e v o n , E x e t e r a n d T e i g n b r i d g e H o u s e h o l d S u r v e y
58
3020100
120
90
60
30
0
3020100
80
60
40
20
0
10.07.55.02.50.0
40
30
20
10
0
3020100
1.6
1.2
0.8
0.4
0.0
All visits Car visits
Foot visits Dog walking visits
Visitor rates per household by distance from the Pebblebeds Commons
Distance from the Pebblebeds (km)
Vis
its
pe
r h
ou
seh
old
Figure 14: Visitor rates to the Pebblebeds from households within distance bands from SPA/SAC boundary. Exponential trendlines fitted manually, so as to maximise R2 (all visits R2=0.79; car visits R2=0.68; foot visits R2=0.84; dog walking visits R2=0.66). Scales differ between visit types.
3020100
160
120
80
40
0
3020100
100
75
50
25
0
10.07.55.02.50.0
60
45
30
15
0
3020100
2.0
1.5
1.0
0.5
0.0
All visits Car visits
Foot visits Dog walking visits
Visitor rates per household by distance to the east of the Exe SPA from the Pebblebeds
Distance from the Pebblebeds (km)
Vis
its
per
hou
seh
old
Figure 15: Visitor rates to the Pebblebeds from households within distance bands from SPA/SAC boundary within an area to the east and north of the Exe SPA only (excluding all respondents to the southwest of a line drawn from Countess Wear Bridge to Crediton). Exponential trendlines fitted manually, so as to maximise R
2 (all visits R
2=0.94; car visits R
2=0.86; foot
visits R2=0.97; dog walking visits R2=0.87). Scales differ between visit types.

F o o t p r i n t E c o l o g y : E a s t D e v o n , E x e t e r a n d T e i g n b r i d g e H o u s e h o l d S u r v e y
59
Map 9: Settlements and 3km and 10km buffers around the Pebblebeds SPA/SAC. Contains Ordnance Survey data Crown © copyright and database right 2011.
Conclusion The Pebblebed Heaths have a far more local catchment than wither the Exe or Dartmoor with East Devon residents making the vast majority of the 20,724 annual visits. Only 4.7% of visits to the seven listed locations were made by Teignbridge district residents with Venn Ottery being the most visited location. The localised use of the site may be due to the type of habitat and also the location on the eastern side of the Exe with relatively poor transport links. Indeed 80% of visits to the Pebblebeds are made by car. Residents within 1km of the Pebblebed Heaths make twice the number of annual visits compared to residents living between 1 and 5km of the site. Dog walking is the most popular activity and accounts for 40% of visits followed by 34% for walking. Dog walkers visit more frequently with fewer people visiting more often compared to walking. Activities such as horse riding, mountain biking and kid’s activities tend to be associated with those living in large houses. Wildlife watching formed a large proportion of the visits undertaken by residents of bungalows.

F o o t p r i n t E c o l o g y : E a s t D e v o n , E x e t e r a n d T e i g n b r i d g e H o u s e h o l d S u r v e y
60
7. Visits to other coastal locations
Visits to specific locations
7.1 Visitors were asked specifically about visits to Beer Head/ Branscombe Underhooken, Axe
Estuary Wetlands and also Axmouth to Lyme Regis Undercliffs in question B2 alongside the
seven locations on the Exe Estuary. Beer Head/ Branscombe Underhooken and Axmouth
to Lyme Regis Undercliffs were selected as they are within the Sidmouth to West Bay SAC.
Axe Estuary Wetlands was selected as it represents a flagship project led by East Devon
District Council to create habitat and access and may provide relevant information on the
potential for estuarine SANGs. From 1219 respondents who visit the coast 43% visit state
that they visit Beer Head, 27% visit Axmouth to Lyme Regis Undercliffs and 18% visit Axe
Estuary. Most respondents visit the three locations infrequently with 84% visiting Beer
Head a few times a year or less, 79% to the Axe Estuary and 84% to the Undercliffs with
the same frequency.
7.2 There was a significant difference between the number of visits to the three locations
from residents of the different districts (χ24 = 398.3, p<0.001). Specifically the majority of
visits to these locations were made by residents of East Devon District (Table 36).
Table 36: The number of visits (% contribution from each local authority) to three additional coastal sites and responses (% of total recreating respondents) from respondents within each local authority area. In all cases the highest number of visits to each site are from East Devon residents.
Location Teignbridge Exeter City East Devon Total
Visits Responses Visits Responses Visits Responses Visits Responses
Beer head / Branscombe Underhooken
802 (19) 120 688 (16) 143 2718 (65) 259 4208 522 (43)
Axmouth to Lyme Regis Undercliffs
392 (11) 90 428 (2) 86 2692 (77) 157 3512 333 (27)
Axe Estuary Wetlands 204 (7) 47 208 (7) 44 2374 (85) 130 2786 221 (18)
Total 1398 257 1324 273 7784 546 10506 1076
7.3 There is a significant difference between the number of visits made to each location and
the mode of transport used (χ212 = 755.15, p<0.001). The most popular mode of transport
to each location was by car/van although the number of foot visits made to the Axe
Estuary Wetlands is double the percentage made on foot to the other two locations
indicating its proximity to housing in Colyford and Seaton.

F o o t p r i n t E c o l o g y : E a s t D e v o n , E x e t e r a n d T e i g n b r i d g e H o u s e h o l d S u r v e y
61
Table 37: Number of visits (%) made to the three additional coastal locations by each transport combination and the median straight line distance of visits between home postcodes and the three locations.
Transport
Beer head / Branscombe Underhooken
Axmouth to Lyme Regis Undercliffs
Axe Estuary Wetlands
Visits Median distance
(km) Visits
Median distance
(km) Visits
Median distance
(km)
Car/van 2544 (61) 24.96 2366 (67) 35.316 1430 (51) 26.129
Foot 824 (20) 3.56 688 (20) 6.63 1136 (40) 1.121
Other 20 (1) 28.28 266 (8) 37.94 56 (2) 10.8
Public transport 124 (3) 29.08 76 (2) 38.63 40 (1) 32.74
Car/van - foot - bike 104 (3) 10.85 40 (1) 34.42 20 (0.7) 8.86
Car/van - public transport
16 (0.4) 17.71 16 (0.5) 30.07 12 (0.4) 34.24
Bike 8 (0.2) 25.57 4 (0.1) 43.534 8 (0.3) 20.3
Total 3640 3456 2702
7.4 The most popular activity with the most number of visits at each location was walking
(Table 38, Figure 16). At Beer Head the second most popular activity was visiting a
pub/cafe although the most frequent in terms of visits the second most popular was dog
walking. At the Axe Estuary the second most popular and most frequent activity was
wildlife watching whilst along the Undercliffs the second most popular and frequent
activity was visits to a pub/cafe (Figure 16).
Table 38: Number of visits to three additional coastal locations (% for each activity by location) for each activity classified and the number of responses (households which visit each location for each activity).
Activity
Beer head / Branscombe Underhooken
Axmouth to Lyme Regis Undercliffs
Axe Estuary Wetlands
Visits Responses Visits Responses Visits Responses
Walking 2717 (42) 406 2104 (47) 265 2144 (51) 147
Wildlife watching 488 (8) 76 418 (9) 63 1205 (29) 90
Dog walking 1160 (18) 67 487 (11) 38 319 (8) 17
Pub/cafe 918 (14) 139 511 (11) 67 356 (9) 17
Swim/sit etc 487 (8) 68 193 (4) 30 32 (1) 6
Other 213 (3) 32 394 (9) 23 64 (2) 10
Fishing 355 (5) 12 279 (6) 7 12 (0.3) 3
Bicycling 41 (1) 12 56 (1) 8 30 (0.7) 7
Watersports 55 (1) 7 8 (0.2) 3 4 (0.1) 1
Amusements 25 (0.4) 7 32 (0.7) 4 8 (0.2) 2
Total 6458 826 4482 508 4174 300

F o o t p r i n t E c o l o g y : E a s t D e v o n , E x e t e r a n d T e i g n b r i d g e H o u s e h o l d S u r v e y
62
Figure 16: Number of visits made to three additional coastal locations by activity undertaken.
Visits to free choice locations
7.5 Respondents were given the opportunity to list up to 5 additional locations from a list of
15 mapped locations. The most visits to each site were made by residents from the
closest local authority districts (Table 39). For example, the most popular (most
households visiting) locations were Teignmouth Beach and Sidmouth Beach, although the
most frequently visited location was Teignmouth Beach followed by Budleigh Salterton
Beach (Table 39). Residents from Exeter City area made the fewest visits to the additional
coastal locations although the most popular location for these visitors was also Budleigh
Salterton Beach.
Table 39: Number of visits to each additional labelled coastal location with percentage of visits from each local authority to each location shown in brackets and the local authority contributing the most visits at each location shown in bold.
Location Teignbridge Exeter City East Devon Total
Visits Responses Visits Responses Visits Responses Visits Responses
Teignmouth Beach 8684 (92) 204 484 (5) 71 284 (3) 50 9452 325
Budleigh Salterton Beach 312 (4) 42 952 (13) 98 6076 (83) 169 7340 309
Sidmouth Beach 280 (4) 46 688 (10) 86 5638 (85) 195 6606 327
Otter Estuary 136 (4) 23 484 (13) 64 3154 (84) 110 3774 197
Seaton Beach 116 (3) 11 72 (2) 14 3450 (95) 72 3638 97
Torbay Beaches 2834 (79) 157 496 (14) 74 244 (7) 49 3574 280
Shaldon Beach 2424 (83) 125 168 (6) 30 330 (11) 12 2922 167
Dawlish Beach 2178 (76) 64 566 (20) 49 120 (4) 22 2864 135
Teign Estuary 2212 (95) 85 92 (4) 15 28 (1) 5 2332 105
Beer Beach 148 (7) 15 120 (6) 29 1792 (87) 87 2060 131
0
1000
2000
3000
4000
5000
6000
7000
Axe Estaury Wetlands
Axmouth to Lyme Regis Undercliffs
Beer Head/ Branscombe
Underhooken
Nu
mb
er o
f vi
sits
Amusements
Watersports
Bicycling
Fishing
Other
Swim/sit etc
Pub/cafe
Dog walking
Wildlife watching
Walking

F o o t p r i n t E c o l o g y : E a s t D e v o n , E x e t e r a n d T e i g n b r i d g e H o u s e h o l d S u r v e y
63
Lady’s Mile Beach 1162 (91) 28 72 (6) 8 48 (4) 10 1282 46
Branscombe Beach 104 (9) 18 116 (10) 28 932 (81) 67 1152 113
Sandy Bay 32 (3) 6 104 (11) 13 782 (85) 46 918 65
Maidencombe/Labrador Bay
424 (84) 48 48 (10) 10 32 (6) 6 504 64
Ladram Bay 20 (4) 3 84 (19) 13 344 (77) 31 448 47
7.6 Additional free text responses were received from 104 respondents detailing 1052 visits to
80 locations. Any locations that could be linked to the categorised locations 1-15
(Appendix 2) were transferred to the categorised data set. Two of the locations (Exmouth
and Topsham) are within the Exe Estuary SPA but these visits were not added to the totals
for the Exe as they only amounted to 84 visits. The number of visits and responses for each
additional free text location are given in Appendix 2.
Conclusion Visitors were asked specifically about visits to Beer Head/ Branscombe Underhooken, Axe Estuary Wetlands and also Axmouth to Lyme Regis Undercliffs. The most popular location was Beer Head, followed by Axmouth to Lyme Regis Undercliffs and then the Axe Estuary although none of these locations are visited frequently. Like Dartmoor, these locations are visited less frequently for days out. We observed links between specific activities and the different sites with a high level of wildlife watching taking place on the Axe. Other locations were listed for comment and the most popular locations were Teignmouth Beach and Sidmouth Beach, although the most frequently visited location was Teignmouth Beach followed by Budleigh Salterton Beach.

F o o t p r i n t E c o l o g y : E a s t D e v o n , E x e t e r a n d T e i g n b r i d g e H o u s e h o l d S u r v e y
64
8. Visits to other countryside locations
8.1 In section D respondents were asked to comment on four additional countryside locations
alongside the sites on the Pebblebeds. Visitors were asked specifically about visits to Berry
Head, Exe Riverside Valley Park, Exminster Marshes and Haldon Forest. From 1219
respondents who visit the countryside 48% state that they visit Haldon Forest, 23% visit
Exe Riverside Valley Park, 19% visit Exminster Marshes and only 2% visit Berry Head. The
most visits were made to the Exe Riverside Valley Park and Haldon Forest.
8.2 Most respondents visit the four locations infrequently with 92% visiting Berry Head a few
times a year or less and 80% to the Exminster Marshes with the same frequency. Haldon
Forest and Exe Riverside Valley Park were visited more frequently with 27% of visitors to
Exe Riverside and 40% of visitors to Haldon Forest visiting at least once per month.
Table 40: The number of visits (% contribution from each local authority) to four additional coastal sites and responses (% of total recreating respondents) from respondents within each local authority area. The local authority contributing the most visits to each site is shown in bold.
Location
Teignbridge Exeter City East Devon Total
Number of visits
Number of
responses
Number of visits
Number of
responses
Number of visits
Number of
responses
Number of visits
Number of
responses
Berry Head 896 (68) 165 248 (19) 56 180 (14) 45 1324 266 (2)
Exe Riverside Valley Park 662 (10) 62 5608 (83) 150 492 (7) 72 6762 284 (23)
Exminster Marshes 1398 (64) 93 508 (23) 79 268 (12) 54 2174 226 (19)
Haldon Forest 3950 (61) 280 1894 (29) 177 668 (10) 126 6512 583 (48)
Total 6906 600 8258 462 1608 297 16772 1359
8.3 The most popular mode of transport to Berry Head and Haldon Forest was by car/van each
with more than 80% of visits made in a car/van (Table 41). The local nature of Exminster
Marshes and Exe Riverside Valley Park means that a higher proportion of visitors to these
locations arrive on foot or bicycle.

F o o t p r i n t E c o l o g y : E a s t D e v o n , E x e t e r a n d T e i g n b r i d g e H o u s e h o l d S u r v e y
65
Table 41: Number of responses and number of visits (%) made to the four additional locations by each transport combination and the median straight line distance between home postcodes and the four locations.
Transport
Berry Head Haldon Forest Exminster Marshes Exe Riverside Valley
Park V
isit
s
Re
spo
nse
s Median distance
(km) Vis
its
Re
spo
nse
s
Median distance
(km) Vis
its
Re
spo
nse
s
Median distance
(km) Vis
its
Re
spo
nse
s
Median distance
(km)
Car/van 1204 (93)
240 21.79 5064 (80)
534 11.23 872 (42)
157 9.709 1594 (24)
161 11.1
Foot 4
(0.3) 1 27.49 588 (9) 6 9.23
386 (18)
13 2.506 2370 (36)
42 2.29
Bike 4
(0.3) 1 27.82
16 (0.3)
4 9.28 136 (6)
15 5.963 1248 (19)
20 2.79
Car/van – foot/bike
20 (2)
5 25.12 410 (6) 16 8.89 302 (14)
10 7.57 656 (10)
10 2.98
Other 20 (2)
3 31.43 270 (4.2)
4 9.99 32 (2)
4 5.38 20
(0.3) 3 12.35
Public transport
40 (3)
8 19.57 8 (0.1) 2 7.59 80 (4)
14 10.85 216 (3)
22 6.1
Bike - foot
290 (14)
5 2.49 470 (7)
10 2.15
Total 1292 258 6356 566 2098 218 6558 268
8.4 Walking comes out as the most frequently undertaken at all four locations in terms of the
number of visits (Table 42, Figure 17). Comparing dog walking at the four locations, Haldon
Forest and Exe Riverside are the most popular locations. Similarly cycling is most popular
at Exe Riverside and Haldon Forest is visited more for children’s activities and Exminster
Marshes is a key location for wildlife watching.
Table 42: Number of visits to the four additional other countryside locations (% for each activity by location) for each activity classified and the number of responses (households which visit each location for each activity).
Activity
Berry Head Haldon Forest Exminster Marshes Exe Riverside Valley
Park
Vis
its
Re
spo
nse
s
Vis
its
Re
spo
nse
s
Vis
its
Re
spo
nse
s
Vis
its
Re
spo
nse
s
Walking 961 (51) 209 3337 (37)
440 1346 (48)
157 3258 (34)
218
Dog walking 193 (10) 34 2703 (30)
126 237 (9) 25 1763 (19)
44
Wildlife watching 313 (17) 64 841 (9) 114 785 (28) 85 910 (10) 50
Bicycling 20 (1) 6 579 (7) 105 216 (8) 30 1727 (18)
60
Pub/cafe 238 (13) 40 392 (4) 55 126 (5) 22 888 (9) 39
Horse riding 0 0 11 (0.1) 4 0 0 0 0
Fishing 36 (2) 5 0 0 5 (0.2) 2 8 (0.1) 1
Mountain biking 3 (0.2) 3 323 (4) 31 3 (0.1) 2 19 (0.2) 4
Kid’s activities 9 (0.5) 3 547 (6) 71 0 0 290 (3) 8
Other 102 (5) 266 199 (2) 585 60 (2.2) 226 638 (7) 287

F o o t p r i n t E c o l o g y : E a s t D e v o n , E x e t e r a n d T e i g n b r i d g e H o u s e h o l d S u r v e y
66
Figure 17: Number of visits made to four additional countryside locations by activity undertaken.
Visits to free choice locations
8.5 Respondents were given the opportunity to list up to 5 additional locations from a list of
28 mapped locations in the countryside. Across all three local authorities, the highest
number of additional countryside visits were made to Decoy Country Park to the south of
Newton Abbot. However 97% of the visits to Decoy Country Park were made by
Teignbridge residents and more Teignbridge residents provided information on Stover
Country Park. Exeter City residents made the most visits to Ludwell Valley Park which
received over a quarter of the additional countryside visits although the site with the
highest number of Exeter residents visiting was Killerton Estate. In the East of the area,
Bicton Park received the most visits from East Devon residents (22%) (Table 43).
0
1000
2000
3000
4000
5000
6000
7000
8000
9000
10000
Berry Head Exe Riverside Valley Park
Exminster Marshes
Haldon Forest
Nu
mb
er o
f vi
sits
Other
Kids activities
Mountain biking
Fishing
Horse riding
Pub/cafe
Bicycling
Wildlife watching
Dog walking
Walking
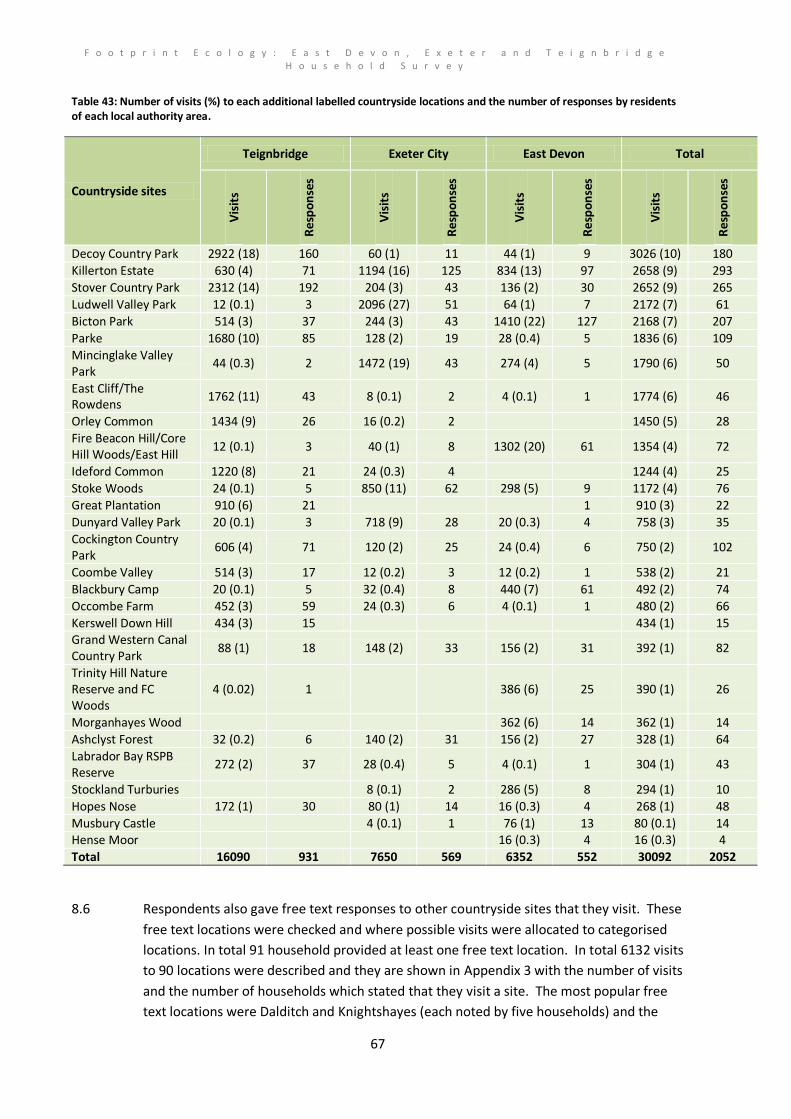
F o o t p r i n t E c o l o g y : E a s t D e v o n , E x e t e r a n d T e i g n b r i d g e H o u s e h o l d S u r v e y
67
Table 43: Number of visits (%) to each additional labelled countryside locations and the number of responses by residents of each local authority area.
Countryside sites
Teignbridge Exeter City East Devon Total
Vis
its
Re
spo
nse
s
Vis
its
Re
spo
nse
s
Vis
its
Re
spo
nse
s
Vis
its
Re
spo
nse
s
Decoy Country Park 2922 (18) 160 60 (1) 11 44 (1) 9 3026 (10) 180
Killerton Estate 630 (4) 71 1194 (16) 125 834 (13) 97 2658 (9) 293
Stover Country Park 2312 (14) 192 204 (3) 43 136 (2) 30 2652 (9) 265
Ludwell Valley Park 12 (0.1) 3 2096 (27) 51 64 (1) 7 2172 (7) 61
Bicton Park 514 (3) 37 244 (3) 43 1410 (22) 127 2168 (7) 207
Parke 1680 (10) 85 128 (2) 19 28 (0.4) 5 1836 (6) 109
Mincinglake Valley Park
44 (0.3) 2 1472 (19) 43 274 (4) 5 1790 (6) 50
East Cliff/The Rowdens
1762 (11) 43 8 (0.1) 2 4 (0.1) 1 1774 (6) 46
Orley Common 1434 (9) 26 16 (0.2) 2
1450 (5) 28
Fire Beacon Hill/Core Hill Woods/East Hill
12 (0.1) 3 40 (1) 8 1302 (20) 61 1354 (4) 72
Ideford Common 1220 (8) 21 24 (0.3) 4
1244 (4) 25
Stoke Woods 24 (0.1) 5 850 (11) 62 298 (5) 9 1172 (4) 76
Great Plantation 910 (6) 21
1 910 (3) 22
Dunyard Valley Park 20 (0.1) 3 718 (9) 28 20 (0.3) 4 758 (3) 35
Cockington Country Park
606 (4) 71 120 (2) 25 24 (0.4) 6 750 (2) 102
Coombe Valley 514 (3) 17 12 (0.2) 3 12 (0.2) 1 538 (2) 21
Blackbury Camp 20 (0.1) 5 32 (0.4) 8 440 (7) 61 492 (2) 74
Occombe Farm 452 (3) 59 24 (0.3) 6 4 (0.1) 1 480 (2) 66
Kerswell Down Hill 434 (3) 15
434 (1) 15 Grand Western Canal Country Park
88 (1) 18 148 (2) 33 156 (2) 31 392 (1) 82
Trinity Hill Nature Reserve and FC Woods
4 (0.02) 1
386 (6) 25 390 (1) 26
Morganhayes Wood
362 (6) 14 362 (1) 14
Ashclyst Forest 32 (0.2) 6 140 (2) 31 156 (2) 27 328 (1) 64
Labrador Bay RSPB Reserve
272 (2) 37 28 (0.4) 5 4 (0.1) 1 304 (1) 43
Stockland Turburies
8 (0.1) 2 286 (5) 8 294 (1) 10
Hopes Nose 172 (1) 30 80 (1) 14 16 (0.3) 4 268 (1) 48
Musbury Castle
4 (0.1) 1 76 (1) 13 80 (0.1) 14 Hense Moor
16 (0.3) 4 16 (0.3) 4
Total 16090 931 7650 569 6352 552 30092 2052
8.6 Respondents also gave free text responses to other countryside sites that they visit. These
free text locations were checked and where possible visits were allocated to categorised
locations. In total 91 household provided at least one free text location. In total 6132 visits
to 90 locations were described and they are shown in Appendix 3 with the number of visits
and the number of households which stated that they visit a site. The most popular free
text locations were Dalditch and Knightshayes (each noted by five households) and the

F o o t p r i n t E c o l o g y : E a s t D e v o n , E x e t e r a n d T e i g n b r i d g e H o u s e h o l d S u r v e y
68
locations receiving the most visits were Chudleigh and Shute Woods, each with 500 visits
per year.
8.7 Only 64 visits to Dalditch were recorded by five respondents and therefore the data were
not analysed alongside the Pebblebeds data. Although Dalditch was mapped alongside the
11 other key countryside sites, it was accidentally not included in the table in question D2.
Therefore we felt that the accidental omission of Dalditch from question D2 would mean
that it may not receive the same level of detail as the other Pebblebeds sites and should
therefore be included under other countryside sites visits.
Conclusion Visitors were asked specifically about visits to Berry Head, Exe Riverside Valley Park, Exminster Marshes and Haldon Forest. Haldon Forest is a well used site with 48% of respondents visiting and Exe Riverside Valley Park is also popular with nearly a quarter of respondents visiting. Most respondents visit the four locations infrequently and for example 92% visiting Berry Head a few times a year or less. Berry Head and Haldon Forest visited mainly by car whereas the proximity of residential areas mean that Exe Riverside Valley Park and Exminster Marshes receive a higher proportion on foot. Walking is the most popular activity across the four main sites although Haldon Forest and Exe Riverside are popular for dog walking. Similarly cycling is most popular at Exe Riverside and Haldon Forest is visited more for children’s activities and Exminster Marshes is a key location for wildlife watching. The highest number of additional countryside visits were made to Decoy Country Park and this site is used mainly by Teignbridge residents. Exeter City residents made the most visits to Ludwell Valley Park which received over 25% of additional countryside visits.

F o o t p r i n t E c o l o g y : E a s t D e v o n , E x e t e r a n d T e i g n b r i d g e H o u s e h o l d S u r v e y
69
9. Relative use of the Exe, Dartmoor and the Pebblebed Heaths
9.1 Looking across the three target European Protected sites the busiest location is the Exe
Estuary with 67,662 annual visits which is nearly three times the number made to
Dartmoor (26,840) and more than three times the number made to the Pebblebeds
(20,724). Whilst these figures could be indicative of the central location of the Exe within
the study area it is also due to the diverse range of recreational opportunities from
walking to kite surfing within a short travel distance for local residents.
9.2 The visit rate curves derived individually for each site of interest for all visits combined are
displayed in Figure 18. When viewed together, the low visit rate to Dawlish Warren Nature
Reserve and beach can be seen as well as the fact that visitors to Dawlish Warren travel
relatively short distances to reach the site.
9.3 For all four locations, the curves begin to flatten out around 10km although the Exe has
more widespread appeal and is the last to level out at around 12km.The highest numbers
of local visits are made by visitors adjacent to the Exe Estuary with around 203 annual
visits per household at 1km from the SPA boundary. Sharper declines in visit rates are
seen for Dartmoor with 66 visits per year at 3km and the Pebblebeds with 75 visits per
year at 3km. At distances of 15km and above Dartmoor draws the highest number of visits
– just higher than the Exe and certainly higher than the Pebblebeds. In other words the
number of visits a household makes to Dartmoor if the house was 15km away would be
expected to be more than the number of visits made to the Exe by a household living
15km from the Exe. The Pebblebeds clearly have a very local draw in comparison with the
other two sites.
Table 44: Visitor rates to European Protected sites for all visits as derived from the fitted trendlines (*Pebblebeds rate derived from responses from the east of the Exe only and Dawlish Warren rate derived from the west of the Exe only).
Distance (km)
Total visits per household per year
Dawlish Warren Nature Reserve and Beach*
Exe Estuary Dartmoor Pebblebeds*
1 116.8 203.3 161.6 163.5
2 83.45 139.9 102 111.0
3 59.99 97 65.8 75.5
4 43.46 67.9 43.8 51.4
5 31.8 48.3 30.5 35.1
6 23.59 34.9 22.4 24.1
8 13.73 19.8 14.6 11.6
10 8.83 12.9 11.7 5.9
12 6.4 9.7 10.6 3.2
15 4.84 7.8 10.1 1.7
20 4.15 7.1 10 1.1
25 4.03 7 10 1.0
30 4 7 10 1.0
35 7 10
50 7 10

F o o t p r i n t E c o l o g y : E a s t D e v o n , E x e t e r a n d T e i g n b r i d g e H o u s e h o l d S u r v e y
70
Figure 18: Visitor rates to European Protected sites for all visits. Exponential trendlines fitted manually, so as to maximise R2 (Exe R2=0.96; Dartmoor R2=0.85; Pebblebeds R2=0.94; Dawlish R2=0.38).
9.4 The total number of visits to each named location from residents of each local authority
area is shown in Map 10, demonstrating the tendency of residents to use sites local to
their district more often and showing the popularity of the sites around Exeter including
the Exe. Given the nature of Dartmoor, visits to certain popular sites are spread equally
between residents of the three local authorities whereas the Pebblebeds receive far more
visits from local residents compared to those from Teignbridge District or Exeter City
(Table 45: Map 10).
9.5 The total number of visits made by each respondent to each broad European Protected
Site location was calculated and each postcode was assigned to a group according to the
site that they visited most (Map 12). Some respondents visited two sites equally and
hence six groups are displayed in Map 12. The majority of respondents were ‘mainly Exe’
visitors (53% of the 1219 respondents that visit the countryside) followed by ‘mainly
Dartmoor’ (33%), ‘mainly Pebblebeds’ (6.3%), ‘mainly Exe and Dartmoor’ (6.2%) and
‘mainly Exe and Pebblebeds’ (0.8%). People that visit the Pebblebeds and Dartmoor to the
same extent formed the smallest group with only five respondents (0.4%) (Map 12).
9.6 Looking at the total visits to each European Site from the three local authority areas, there
is a significant difference between locations visited and districts where respondents live
(χ24 = 26751.9, p<0.001).
Table 45: The total number of visits (%) to each target location made by respondents of each local authority area.
Local authority
Number of visits
Exe Dartmoor Pebblebeds
Teignbridge District Council 13084 (19) 15596 (58) 976 (5)
Exeter City Council 19014 (28) 6016 (22) 2566 (12)
East Devon District Council 35564 (53) 5228 (19) 17182 (83)
Total 67662 26840 20724
0
35
70
105
140
175
210
0 10 20 30 40 50 60
Vis
it r
ate
per
ho
use
ho
ld
Distance (km)
Exe
Dartmoor
Pebblebeds

F o o t p r i n t E c o l o g y : E a s t D e v o n , E x e t e r a n d T e i g n b r i d g e H o u s e h o l d S u r v e y
71
Map 10: The proportion of visits made to each named location by residents from each local authority. Pie charts scaled thematically to show the relative number of visits to each location. Contains Ordnance Survey © data Crown copyright and database right 2011.

F o o t p r i n t E c o l o g y : E a s t D e v o n , E x e t e r a n d T e i g n b r i d g e H o u s e h o l d S u r v e y
72
Map 11: The proportion of visits made to named locations within and around the Exe Estuary SPA (blue) and the Pebblebed Heaths SPA/SAC (yellow) by residents from each local authority. Pie charts scaled thematically to show the relative number of visits to each location. Contains Ordnance Survey © data Crown copyright and database right 2011.

F o o t p r i n t E c o l o g y : E a s t D e v o n , E x e t e r a n d T e i g n b r i d g e H o u s e h o l d S u r v e y
73
Map 12: Postcodes of respondents coloured according to the site (Exe, Dartmoor, Pebblebeds) or combination of sites that they visit the most. Contains Ordnance Survey © data Crown copyright and database right 2011.
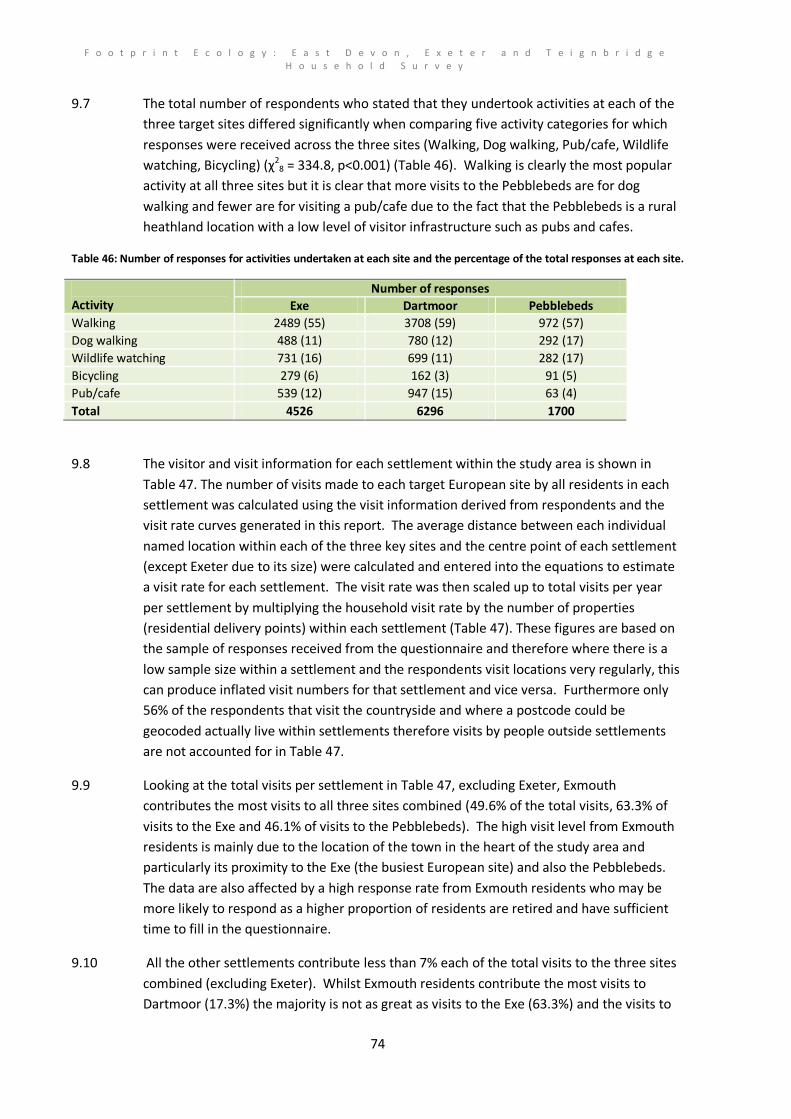
F o o t p r i n t E c o l o g y : E a s t D e v o n , E x e t e r a n d T e i g n b r i d g e H o u s e h o l d S u r v e y
74
9.7 The total number of respondents who stated that they undertook activities at each of the
three target sites differed significantly when comparing five activity categories for which
responses were received across the three sites (Walking, Dog walking, Pub/cafe, Wildlife
watching, Bicycling) (χ28 = 334.8, p<0.001) (Table 46). Walking is clearly the most popular
activity at all three sites but it is clear that more visits to the Pebblebeds are for dog
walking and fewer are for visiting a pub/cafe due to the fact that the Pebblebeds is a rural
heathland location with a low level of visitor infrastructure such as pubs and cafes.
Table 46: Number of responses for activities undertaken at each site and the percentage of the total responses at each site.
Activity
Number of responses
Exe Dartmoor Pebblebeds
Walking 2489 (55) 3708 (59) 972 (57)
Dog walking 488 (11) 780 (12) 292 (17)
Wildlife watching 731 (16) 699 (11) 282 (17)
Bicycling 279 (6) 162 (3) 91 (5)
Pub/cafe 539 (12) 947 (15) 63 (4)
Total 4526 6296 1700
9.8 The visitor and visit information for each settlement within the study area is shown in
Table 47. The number of visits made to each target European site by all residents in each
settlement was calculated using the visit information derived from respondents and the
visit rate curves generated in this report. The average distance between each individual
named location within each of the three key sites and the centre point of each settlement
(except Exeter due to its size) were calculated and entered into the equations to estimate
a visit rate for each settlement. The visit rate was then scaled up to total visits per year
per settlement by multiplying the household visit rate by the number of properties
(residential delivery points) within each settlement (Table 47). These figures are based on
the sample of responses received from the questionnaire and therefore where there is a
low sample size within a settlement and the respondents visit locations very regularly, this
can produce inflated visit numbers for that settlement and vice versa. Furthermore only
56% of the respondents that visit the countryside and where a postcode could be
geocoded actually live within settlements therefore visits by people outside settlements
are not accounted for in Table 47.
9.9 Looking at the total visits per settlement in Table 47, excluding Exeter, Exmouth
contributes the most visits to all three sites combined (49.6% of the total visits, 63.3% of
visits to the Exe and 46.1% of visits to the Pebblebeds). The high visit level from Exmouth
residents is mainly due to the location of the town in the heart of the study area and
particularly its proximity to the Exe (the busiest European site) and also the Pebblebeds.
The data are also affected by a high response rate from Exmouth residents who may be
more likely to respond as a higher proportion of residents are retired and have sufficient
time to fill in the questionnaire.
9.10 All the other settlements contribute less than 7% each of the total visits to the three sites
combined (excluding Exeter). Whilst Exmouth residents contribute the most visits to
Dartmoor (17.3%) the majority is not as great as visits to the Exe (63.3%) and the visits to

F o o t p r i n t E c o l o g y : E a s t D e v o n , E x e t e r a n d T e i g n b r i d g e H o u s e h o l d S u r v e y
75
Dartmoor are spread amongst a number of settlements such as Newton Abbot, Sidmouth,
Teignmouth, Honiton and Seaton. Likewise Exmouth residents contribute the most visits to
the Pebblebeds although around 20% of visits come from residents in Sidmouth (10.3%)
and Budleigh Salterton (10%).
9.11 To achieve a similar estimate for Exeter, it may be useful to split the city into distinct sub-
areas or districts where possible. Subdividing the city would produce better estimates of
the distances from the city to the locations and hence generate more accurate estimates
of the visit rates of residents, and hence total visits per year, in different parts of the city.

F o o t p r i n t E c o l o g y : E a s t D e v o n , E x e t e r a n d T e i g n b r i d g e H o u s e h o l d S u r v e y
76
Table 47: The number of respondents from each settlement within the study area (667 or 56% of respondents out of 1191 geocoded postcodes of countryside visitors live within settlements), the total number of delivery points within each settlement (an estimate of residential properties) and the number of visits made to each target European site by respondents. The visit rate for residents of each settlement was derived by calculating the average distance from the centroid of each settlement to the each location within a site or the centroid of the site where a specific location is not provided. These distances were then inputted into the visit rate equations to estimate a visit rate which is multiplied by the number of delivery points to determine the total number of visits per settlement. Exeter is excluded as a measurement from the centre to each site would be inaccurate due to the size of the city.
Settlement name
Re
spo
nd
en
ts
Delivery points
Visits by respondents Visit rate per household Total visits per year (% of total)
Exe
Dar
tmo
or
Pe
bb
leb
ed
s
Exe
Dar
tmo
or
Pe
bb
leb
ed
s
Tota
l
Exe
Dar
tmo
or
Pe
bb
leb
ed
s
Tota
l
Exmouth 107 15503 23780 1392 6134 107 10 19 136 1658442 (63.3) 155030 (17.3) 301081 (46.1) 2114553
(49.6)
Dawlish 37 4701 4206 660 60 47 10 2 59 220449 (8.4) 47010 (5.2) 10165 (1.6) 277624 (6.5)
Newton Abbot 87 10454 824 2210 80 7 10 1 18 78076 (3) 104565 (11.7) 10602 (1.6) 193243 (4.5)
Sidmouth 30 6400 420 456 748 8 10 11 28 49210 (1.9) 64000 (7.1) 67332 (10.3) 180542 (4.2)
Teignmouth 62 6613 1358 1068 104 16 10 1 27 10495 (0.4) 66131 (7.4) 8247 (1.3) 177873 (4.2)
Budleigh Salterton 24 2370 1438 304 1346 26 10 28 64 62560 (2.4) 23700 (2.6) 65437 (10) 151697 (3.6)
Honiton 25 5150 340 316 108 7 10 1 18 36120 (1.4) 51500 (5.7) 6850 (1) 94470 (2.2)
Kingsteignton 36 4489 420 808 128 8 10 1 19 36656 (1.4) 44899 (5) 4658 (0.7) 86213 (2)
Seaton 18 4146 164 112 52 7 10 1 18 29057 (1.1) 41460 (4.6) 4600 (0.7) 75117 (1.8)
Starcross 4 545 660 132 4 107 10 7 124 58580 (2.2) 5450 (0.6) 3717 (0.6) 67747 (1.6)
Lympstone 8 537 1532 192 1428 76 10 19 105 40677 (1.6) 5370 (0.6) 10294 (1.6) 56341 (1.3)
Topsham 19 1420 4650 440 488 19 10 8 37 26581 (1) 14200 (1.6) 11704 (1.8) 52485 (1.2)
Ottery St.Mary 22 2032 348 280 296 7 10 7 25 14764 (0.6) 20320 (2.3) 14923 (2.3) 50007 (1.2)
Woodbury 7 611 1674 204 1364 28 10 42 81 17258 (0.7) 6110 (0.7) 25881 (4) 49249 (1.2)
Lyme Regis 2 2561 4 16 0 7 10 1 18 17928 (0.7) 25610 (2.9) 2569 (0.4) 46107 (1.1)
Newton Poppleford 7 684 224 52 2438 9 10 43 62 6350 (0.2) 6840 (0.8) 29531 (4.5) 42721 (1)
Axminster 11 2244 64 80 36 7 10 1 18 15709 (0.6) 22440 (2.5) 2256 (0.3) 40405 (0.9)
Exminster 8 1282 658 120 32 17 10 4 31 21638 (0.8) 12820 (1.4) 5579 (0.9) 40037 (0.9)
Feniton 6 559 40 24 20 43 10 17 71 24304 (0.9) 5590 (0.6) 9674 (1.5) 39568 (0.9)
Dawlish Warren 3 340 200 104 4 99 10 4 112 33494 (1.3) 3400 (0.4) 1281 (0.2) 38175 (0.9)
Bovey Tracey 31 1898 284 3418 32 7 10 1 18 13721 (0.5) 19035 (2.1) 1920 (0.3) 34676 (0.8)
Kingskerswell 17 1808 280 552 44 7 10 1 18 13310 (0.5) 18081 (2) 1827 (0.3) 33218 (0.8)
Chudleigh 18 1524 268 684 32 9 10 1 20 13787 (0.5) 15244 (1.7) 1681 (0.3) 30712 (0.7)
West Hill 2 706 40 4 20 8 10 20 38 5566 (0.2) 7060 (0.8) 14179 (2.2) 26805 (0.6)

F o o t p r i n t E c o l o g y : E a s t D e v o n , E x e t e r a n d T e i g n b r i d g e H o u s e h o l d S u r v e y
77
Settlement name
Re
spo
nd
en
ts
Delivery points
Visits by respondents Visit rate per household Total visits per year (% of total)
Exe
Dar
tmo
or
Pe
bb
leb
ed
s
Exe
Dar
tmo
or
Pe
bb
leb
ed
s
Tota
l
Exe
Dar
tmo
or
Pe
bb
leb
ed
s
Tota
l
Buckfastleigh 2 1456 12 92 0 7 10 1 18 10197 (0.4) 14687 (1.6) 1456 (0.2) 26340 (0.6)
Kenton 3 313 172 12 4 62 10 6 78 19317 (0.7) 3130 (0.3) 1900 (0.3) 24347 (0.6)
Bishopsteignton 7 952 96 208 20 10 10 1 22 9958 (0.4) 9520 (1.1) 1049 (0.2) 20527 (0.5)
East Budleigh 2 254 216 64 148 18 10 48 76 4526 (0.2) 2540 (0.3) 12111 (1.9) 19177 (0.4)
Shaldon 6 864 92 148 0 10 10 1 22 9032 (0.3) 8640 (1) 949 (0.1) 18621 (0.4)
Colyton 7 864 116 44 16 7 10 1 18 6052 (0.2) 8640 (1) 926 (0.1) 15618 (0.4)
Ipplepen 11 863 100 204 28 7 10 1 18 6110 (0.2) 8632 (1) 865 (0.1) 15607 (0.4)
Heathfield/Bovey Heath
3 643 36 76 4 7 10 3 20 4546 (0.2) 6430 (0.7) 1653 (0.3) 12629 (0.3)
Broadclyst 2 503 8 4 4 8 10 4 21 3793 (0.1) 5030 (0.6) 1792 (0.3) 10615 (0.2)
Exton 1 180 204 4 80 32 10 15 58 5809 (0.2) 1800 (0.2) 2756 (0.4) 10365 (0.2)
Whimple 5 421 120 56 84 7 10 6 23 3093 (0.1) 4210 (0.5) 2536 (0.4) 9839 (0.2)
Highwood 6 526 108 12 12 7 10 1 18 3882 (0.1) 5267 (0.6) 534 (0.1) 9683 (0.2)
Clyst St Mary 1 296 24 12 0 12 10 10 32 3678 (0.1) 2960 (0.3) 2896 (0.4) 9534 (0.2)
Abbotskerswell 2 488 20 32 0 7 10 1 18 3531 (0.1) 4881 (0.5) 491 (0.1) 8903 (0.2)
Coldeast 1 426 8 44 0 7 10 1 18 3072 (0.1) 4269 (0.5) 430 (0.1) 7771 (0.2)
Holcombe 1 173 24 32 0 26 10 2 37 4489 (0.2) 1730 (0.2) 268 (0) 6487 (0.2)
Sidbury 1 269 8 12 0 7 10 6 23 1948 (0.1) 2690 (0.3) 1516 (0.2) 6154 (0.1)
Colyford 2 273 20 8 0 7 10 1 18 1912 (0.1) 2730 (0.3) 294 (0) 4936 (0.1)
Stoke Canon 2 247 96 48 4 7 10 2 19 1790 (0.1) 2470 (0.3) 385 (0.1) 4645 (0.1)
Kilmington 2 226 12 24 12 7 10 1 18 1582 (0.1) 2260 (0.3) 230 (0.04) 4072 (0.1)
Tedburn St Mary 2 208 80 92 12 7 10 1 18 1466 (0.1) 2080 (0.2) 212 (0.03) 3758 (0.1)
Raymond'sHill 1 197 4 28 0 7 10 1 18 1379 (0.1) 1970 (0.2) 198 (0.03) 3547 (0.1)
Ide 2 172 40 72 4 9 10 2 20 1468 (0.1) 1720 (0.2) 273 (0.04) 3461 (0.1)
Kennford 2 122 32 16 8 14 10 2 26 1673 (0.1) 1220 (0.1) 257 (0.04) 3150 (0.1)
Clyst Honiton 2 107 12 20 4 9 10 10 29 939 (0.04) 1070 (0.1) 1110 (0.2) 3119 (0.1)
Total 667 89620 45536 14992 15442 991 490 369 185
1 2619974 896441 653075 4262490

F o o t p r i n t E c o l o g y : E a s t D e v o n , E x e t e r a n d T e i g n b r i d g e H o u s e h o l d S u r v e y
78
Conclusion The busiest location was the Exe estuary receiving three times more visitors than Dartmoor and the Pebblebeds. The Exe is most centrally located but it also provides opportunities for the widest variety of recreation activities. Visitor rates to the four key sites vary with Dawlish Warren Nature Reserve receiving the lowest visit rate and visitors travelling from relatively short distances. The Exe has the widest catchment with visit rates trailing off around 12km. The highest numbers of local visits are made by visitors adjacent to the Exe Estuary with around 203 annual visits per household at 1km from the SPA boundary. The visitor rates demonstrate the attractiveness of Dartmoor and the local catchment of Pebblebeds. Visitors tend to use sites local to their district except Dartmoor which has a wider appeal. Looking at the type of each visitor by postcode 53% are ‘mainly exe’ visitors, 33% ‘mainly Dartmoor’. Walking is clearly the most popular activity at all three sites but it is clear that more visits to the Pebblebeds are for dog walking and fewer are for visiting a pub/cafe due to the fact that the Pebblebeds is a rural heathland location with a low level of visitor infrastructure such as pubs and cafes. Visit rates per settlement based on the sample of postcodes - excluding Exeter, Exmouth contributes the most visits to all three sites combined (49.6% of the total visits, 63.3% of visits to the Exe and 46.1% of visits to the Pebblebeds).
F o o t p r i n t E c o l o g y : E a s t D e v o n , E x e t e r a n d T e i g n b r i d g e H o u s e h o l d S u r v e y
79
10. Predicting visits to European Sites
10.1 This chapter provides information needed to calculate the number of household visits to
each European site that will be generated by different numbers of houses built in different
locations. The chapter pulls together analyses presented in the preceding chapters and
provides a series of maps showing the visit rates within distance bands or ‘zones’
surrounding each European site.
10.2 Distances between settlements and European site centroids and nearest points are
presented. These nearest point data are used in equations generated for each European
site to determine the visit rates for all visitors from each settlement. Adjustments to visit
rates have been made to account for the fact that the Exe is positioned centrally within
the study area. Therefore straight line distances are not relevant for settlements where
the straight line distance passes through the Exe Estuary. An excel spreadsheet is provided
which allows users to select a settlement and the number of houses to generate a
prediction of the number of visits made to each European site by those additional houses.
10.3 The same equations have been used to generate visit rates by distance from the site and
these have been displayed in tables for different activities and modes of transport (where
data are available) alongside the actual data collected for comparison. The visit rates from
the fitted curve data are also presented as maps with ‘zones’ surrounding each European
site. These figures are used in the predictions spreadsheet to allow a distance from a site
to be entered to predict the number of additional visits per household per year and the
total number of visits (by multiplying by the number of additional houses). The
contribution of total visits by each zone is demonstrated in another series of maps which
uses the visit rate and the number of delivery points to take account of the current
distribution of housing. The visit rates generated for each settlement were used to
determine the effect of closeness to the sea on the level of visits to Dawlish Warren.
Distances between settlements and European sites
10.4 In the previous chapter the average distance between the locations specified in the survey
within each European site and the centroid of each settlement was used to generate
visitor rates. For the purposes of this chapter and to simplify the predictions spreadsheet,
the distances between each settlement within the study area and the centroid (central
point) of the European site were generated within the GIS. We also generated distances
using the nearest point on the European site (Table 48). The greatest distance between a
settlement and a European site is between Raymond’s Hill in East Devon and Dartmoor
(73.5km) whilst Dawlish Warren is only 1.2km from the centroid of the nearest SAC. The
distances used are straight lines rather than travel distances and therefore a number of
the distances between settlements and Dartmoor and Dawlish Warren pass through the
Exe (e.g. a straight line between Dawlish and the Pebblebed Heaths will pass through the
Exe). The only way to account for the additional distance to travel around the Exe would
be to estimate travel distances using the road network. In the absence of data on road
networks and travel times, the straight line distance is used to estimate visitor rates in the
remainder of this chapter and also in the prediction spreadsheet provided with this report.

F o o t p r i n t E c o l o g y : E a s t D e v o n , E x e t e r a n d T e i g n b r i d g e H o u s e h o l d S u r v e y
80
10.5 To account for the fact that the Exe is placed centrally within the study area we have
focussed on areas either side of the estuary when calculating visit rates to Dawlish Warren
and the Pebblebed Heaths. Specifically visit rates to Dawlish Warren are generated from
data provided by respondents living to the west of the Exe and for the Pebblebeds data
are used for the east of the Exe only. In addition, an overall visit rate was estimated for
settlements outside of these reduced areas. In practice this means that for Dawlish
Warren an average visit rate is assigned to settlements to the east of the Exe with the
exception of Exmouth where a separate visit rate to Dawlish Warren was generated to
account for use of the ferries across the estuary. Similarly an average visit rate to the
Pebblebeds is assigned to settlements to the west of the Exe.

F o o t p r i n t E c o l o g y : E a s t D e v o n , E x e t e r a n d T e i g n b r i d g e H o u s e h o l d S u r v e y
81
Table 48: Straight line distances in kilometres between each settlement within the three local authority district boundaries and the centroid of each European site and the nearest point of each European site (* indicates straight line distances for nearest points which pass through the Exe). The closest European site to each settlement is shown in bold.
Local Authority
Settlement Distance to centroid (km) Distance to nearest point (km)
Dartmoor Dawlish Warren
Exe Estuary Pebblebed
Heaths Dartmoor
Dawlish Warren
Exe Estuary Pebblebed
Heaths
East Devon
Axminster 71.8 36.8 35.2 29.9 49.6 35.8* 33.6 24
Broadclyst 40.8 17.4 13.1 11.5 19* 16.6 8.3 7.9
Budleigh Salterton 46.5 7.9 8 5.1 25.4 7.1* 4.6 1.7
Clyst Honiton 41.6 14.4 10.2 8 19.5 13.5 6.1 5.2 Clyst St Mary 38.6 11.4 7 6.9 16.4 10.6 2.5 6.2
Colyford 65.6 29.2 28 22.9 43.5 28.2* 25.9 17.4
Colyton 65.6 29.7 28.3 23.2 43.5 28.8* 26.5 17.5
Dunkeswell 59 32.1 28.7 24.2 37.7 31.1* 25.4 17
East Budleigh 47.1 9.6 8.7 4.3 25.6* 8.7* 6.7 2
Exmouth 41.7 3.8 3.5 4.3 20.7* 2.8* 1.2 2.6
Exton 38.7 7.4 3.1 4.6 16.8* 6.6* 0.3 4.4
Exton Commando Training Centre 39.1 6.5 2.3 4.1 17.4* 5.7* 0.4 3.7
Feniton 52.3 22.8 19.5 14.9 30.3 21.8* 16.4 7.7
Highwood 58.6 31.2 27.8 23.3 13.3 13.8* 3.4 10.5
Honiton 58.4 27 24.2 19.2 36.3 26* 21.8 12.2
Kilmington 68.5 33.8 32.1 26.9 46.4 32.9* 30.7 20.9
Lympstone 39.9 4.9 1.5 3.8 18.5 4* 0.6 2.7
Newton Poppleford 48.7 13.8 11.5 6.3 26.6* 12.8* 10.4 0.7
Otterton 48.4 11.1 10 5.3 26.7* 10.1* 8.1 2.6
Ottery St.Mary 51.3 19.4 16.4 11.5 29.1 18.4* 14 4.4 Raymond'sHill 73.5 37.6 36.4 31.2 51.4 36.7* 34.4 25.5
Seaton 64.9 27.9 27 21.9 42.8* 27* 24.6 16.7
Sidbury 54.7 19.5 17.6 12.4 32.5 18.6 16.5 6.6
Sidmouth 53.2 16.8 15.3 10.2 31.2* 15.8* 13.8 5.3
Stoke Canon 36.7 19.1 14.8 14.8 15.5 18.5* 8.3 12.6
West Hill 48 16.3 13.1 8.4 25.8 15.3* 10.5 1.2
Whimple 46.5 18.7 14.9 11.2 24.6 17.7* 11.2 4.6
Woodbury 41.7 8.1 4.6 1.8 19.9* 7.1* 3.3 1.7
Exeter Exeter 35.4 14.4 10.2 11.2 13.3 13.8* 3.4 10.5

F o o t p r i n t E c o l o g y : E a s t D e v o n , E x e t e r a n d T e i g n b r i d g e H o u s e h o l d S u r v e y
82
Local Authority
Settlement Distance to centroid (km) Distance to nearest point (km)
Dartmoor Dawlish Warren
Exe Estuary Pebblebed
Heaths Dartmoor
Dawlish Warren
Exe Estuary Pebblebed
Heaths Topsham 37 9.2 4.9 6.7 15* 8.6* 0.2 6.6
Teignbridge
Abbotskerswell 30.4 16.8 19.4 24.3 10.9 15.7* 15.3 22.8*
Ashburton 21.5 25 26.4 31.7 1.6 24.1* 23.8 30.4*
Bishopsteignton 33.1 9.8 12.6 17.4 13.0 8.8* 8.4 15.9*
Bovey Tracey 22.8 17.3 17.7 22.9 2.7 16.6* 16.4 21.9*
Buckfastleigh 22.4 27.6 29.3 34.6 0.8 27.7* 27.4 34.4*
Christow 23.6 16.4 14.9 19.5 3.6 15.9* 11.4 18.9*
Chudleigh 27.7 11.8 12.1 17.3 7.9 11.1 10.9 16.2*
Coldeast 24.3 17.3 18.5 23.7 4.3 16.5 16.4 22.5*
Dawlish 37.3 3.4 7 11.3 17.3 2.4* 2.0 9.6*
Dawlish Warren 38.5 1.2 5 9 18.7 0.3 0.3 7.4*
Exminster 34.8 9.3 5.5 8.6 12.9 8.9* 0.7 8.4*
Heathfield/ Bovey Heath 25 15.9 16.8 22.1 4.9 15.1* 15 20.9*
Holcombe (Teignbridge) 37.2 5.4 9.1 13.3 17.1 4.4* 3.7 11.6*
Ide 31 13.9 10.4 13.4 8.8 13.6* 4 13.3*
Ipplepen 30.3 19.5 22.2 27.1 9.4 18.5* 18 25.6*
Kennford 31.9 9.8 7.1 11.3 10.3 9.5* 3.9 10.8*
Kenton 36.6 4.6 2 7.2 15.6 4.2* 1.2 6.1*
Kingskerswell 33 15.6 18.7 23.4 13.4 14.6* 14 21.8*
Kingsteignton 29.6 12.8 14.8 19.9 9.6 11.8* 11.5 18.5*
Moretonhampstead 16 24.1 22.7 27.2 3.5 23.5* 18.7 26.7*
Newton Abbot 29.8 15 17.5 22.5 10 14* 13.7 21*
Shaldon 35.1 9.8 13.1 17.6 15 8.8* 8.2 16*
Starcross 37.9 2.6 2.1 6.9 17.3 2.3* 0.3 5.5*
Tedburn St Mary 23.9 22.4 19.5 22.6 5.3 22.1* 13.3 22.4
Teignmouth 36 7.4 10.9 15.3 15.9 6.4* 5.8 13.6*

F o o t p r i n t E c o l o g y : E a s t D e v o n , E x e t e r a n d T e i g n b r i d g e H o u s e h o l d S u r v e y
83
Visit rates by distance from European sites
10.6 Visit rates based on distance from each site have been compiled for each European site
using the actual data and the fitted curve data for different types of transport used and
activity undertaken where data are available. The visit rates are displayed in tables 49-52
along with the number of respondents from each distance category to demonstrate where
low sample sizes may affect the fit of the curves and the predictions in visit rates. For
example a low response level was received from residents within 1km of Dawlish Warren
(Table 50) and to Dartmoor within 2km (Table 51). In the cases of low response level it is
useful to refer to the rates generated from actual data rather than the fitted curve data.
10.7 The data displayed in tables 49-52 are represented in maps 13-16 using the same distance
bands, shaded according to the number of visits made per household. The maps give a
clear picture of the catchment of the different sites although when comparing the maps it
is important to consider that the ranges vary between sites with the Exe having the highest
maximum visit rate and Dawlish Warren the lowest.
10.8 The Exe has a relatively small catchment given its size and attractiveness to a variety of
visitors. The concentration of people living around the Exe means that within 4km visit
rates are high (Map 13). Similarly Dawlish Warren has a very local catchment and due to
the low number of respondents within 1km the visit rate for 2km has been mapped
instead (Map 14). Dartmoor has a wider catchment as there are fewer houses within the
closest distance bands as these are located within the national park boundary (Map 15).
The Pebblebeds are also very locally used although the results of the survey showed that
fewer people visit the site but they do so with greater frequency (Map 15).
Table 49: The visit rate to the Exe Estuary for different modes of transport and activities (where data are available) at different distances from the site. Visit rates are shown from the actual data and the fitted curves displayed in each chapter.
Distance (km)
Number of respondents that
visit the Exe
Visit rates using the actual data Visit rates using the fitted curve data
All Car/van Foot Dog
walkers All Car/van Foot
Dog walkers
1 111 211.9 44.43 141.31 35.07 203.35 68.85 147.15 52.76
2 82 151.54 78.67 46.91 39.76 139.94 56.56 54.13 32.24
3 108 63.57 46.27 10.69 17.63 97.01 46.61 19.91 19.79
4 92 49.75 17.65 15.54 10.75 67.94 38.54 7.33 12.24
5 98 50.09 35.86 5.94 13.13 48.26 32 2.69 7.66
6 67 29.87 23.54 0.58 5.66 34.94 26.69 0.99 4.88
8 62 26.99 20.27 1.34 0.99 19.81 18.91 0.13 2.18
10 22 14.67 13.19 0.22 3.26 12.87 13.8 0.02 1.18
12 67 15.18 12.51 0.1 1.80 9.69 10.44 0 0.81
15 140 12.42 9.91 0.12 1.84 7.84 7.43 0 0.65
20 74 10.73 9.09 0.12 1.63 7.12 5.2 0 0.6
25 52 12.36 11.7 0 2.23 7.02 4.42
0.6
30 19 8.65 7.23 0 0.52 7 4.15
0.6
35 16 7.54 6.62 0 0 7 4.05
0.6
50 2 2.67 2.67 0 1.33 7 4
0.6

F o o t p r i n t E c o l o g y : E a s t D e v o n , E x e t e r a n d T e i g n b r i d g e H o u s e h o l d S u r v e y
84
Table 50: The visit rate to Dawlish Warren Nature Reserve and Beach for different modes of transport and activities (where data are available) at different distances from the site. Visit rates are shown from the actual data and the fitted curves displayed in each chapter.
Distance (km)
Number of respondents that visit
Dawlish Warren
Visit rates using the actual data Visit rates using the fitted curve data
All Foot All Foot
1 4 38.4 20 7 19.92
2 22 56.27 13.83 83.45 8.79
3 19 34.83 4.54 59.99 3.78
4 12 84.29 1.07 43.46 1.53
5 4 28 0 31.8 0.52
6 8 5 0 23.59 0.07
8 48 14.94 0.77 13.73 -0.23
10 23 11.38 0.31 8.83 -0.28
12 53 7.81 0 6.4 -0.3
15 209 6.95 0.05 4.84 -0.3
20 89 5.69 0.02 4.15 -0.3
25 7 4.86 0 4.03 0
30 1 2 0 4 0
Table 51: The visit rate to Dartmoor for different modes of transport and activities (where data are available) at different distances from the site. Visit rates are shown from the actual data and the fitted curves displayed in each chapter.
Distance (km)
Number of respondents
that visit Dartmoor
Visit rates using the actual data Visit rates using the fitted curve data
All Car/van Foot Dog
walkers Outdoor pursuits
All Car/van Foot Dog
walkers Outdoor pursuits
1 4 120.23 87.41 10.23 41.83 18.1 161.63 103.98 25.74 40.42 18.97
2 3 79.92 52.33 16.89 29.92 12.69 101.97 68.18 9.46 23.08 9.08
3 27 40.71 37.88 2.35 8.47 3.12 65.78 46.47 3.48 13.57 4.63
4 12 19.71 19.57 0 3 0.57 43.83 33.3 1.27 8.35 2.63
5 5 23.64 20.73 0.24 3.52 1.7 30.52 25.31 0.46 5.49 1.73
6 15 20.52 19.22 0.03 1.86 3.17 22.45 20.47 0.16 3.91 1.33
8 29 26.36 24.89 0 6.4 2.24 14.58 15.75 0.01 2.58 1.07
10 120 20.93 19.84 0 3.41 1.75 11.68 14.01 -0.01 2.17 1.01
12 133 17.81 16.66 0.12 2.15 2.36 10.62 13.37 -0.01 2.05 1
15 196 19.35 18.38 0.06 2.92 2.95 10.14 13.08 -0.01 2.01 1
20 193 13.92 13.1 2.69 0.73 10.01 13.01
2 1
25 70 13.93 13.78 4.74 0.96 10 13
2 1
30 54 12.34 12.29 2.93 0.29 10 13
2 1
35 35 12.48 12.16 3.68 0 10 13
2 1
50 58 9.14 8.84 1.23 0.57 10 13
2 1

F o o t p r i n t E c o l o g y : E a s t D e v o n , E x e t e r a n d T e i g n b r i d g e H o u s e h o l d S u r v e y
85
Table 52: The visit rate to the Pebblebed Heaths for different modes of transport and activities (where data are available) at different distances from the site. Visit rates are shown from the actual data and the fitted curves displayed in each chapter.
Distance (km)
Number of respondents that visit the Pebblebed
Heaths
Visit rates using the actual data Visit rates using the fitted curve data
All Car/van Foot Dog
walkers All Car/van Foot
Dog walkers
1 7 140.57 82.57 51.71 1.57 163.49 104.21 55.18 1.96
2 48 131.26 97.56 28.04 1.37 111.02 77.33 20.3 1.34
3 59 61.65 51.71 5.25 0.68 75.49 57.42 7.47 0.92
4 26 61.94 18.37 1.53 0.26 51.43 42.67 2.75 0.65
5 36 18 16.23 0.91 0.59 35.15 31.74 1.01 0.46
6 18 17.24 16.55 0 0.31 24.12 23.64 0.37 0.33
8 29 25.59 22.95 0 0.55 11.6 13.2 0.05 0.19
10 39 8.05 7.73 0 0.12 5.86 7.47 0.01 0.13
12 47 6.54 6.18 0.15 3.23 4.33
0.1
15 30 3.73 3.67 0.16 1.69 2.06
0.09
20 17 3.13 2.96 0.15 1.1 0.85
0.08
25 11 3.38 2.23 0 1.01 0.58
0.08
30 2 3 3 0 1 0.52
0.08

F o o t p r i n t E c o l o g y : E a s t D e v o n , E x e t e r a n d T e i g n b r i d g e H o u s e h o l d S u r v e y
86
Map 13: The number of annual visits per household by distance band up to 50km from the Exe estuary.

F o o t p r i n t E c o l o g y : E a s t D e v o n , E x e t e r a n d T e i g n b r i d g e H o u s e h o l d S u r v e y
87
Map 14: The number of annual visits per household by distance band from Dawlish Warren SAC. Visit rate predictions are shown up to 30km for the area to the west of the Exe and an overall visit rate is given for the rest of the study area except Exmouth where a separate rate was calculated to take account visitor access to Dawlish Warren by ferry. Due to the low number of respondents within 1km the predicted visit rate was inaccurate; therefore the visit rate for 2km has been shown.
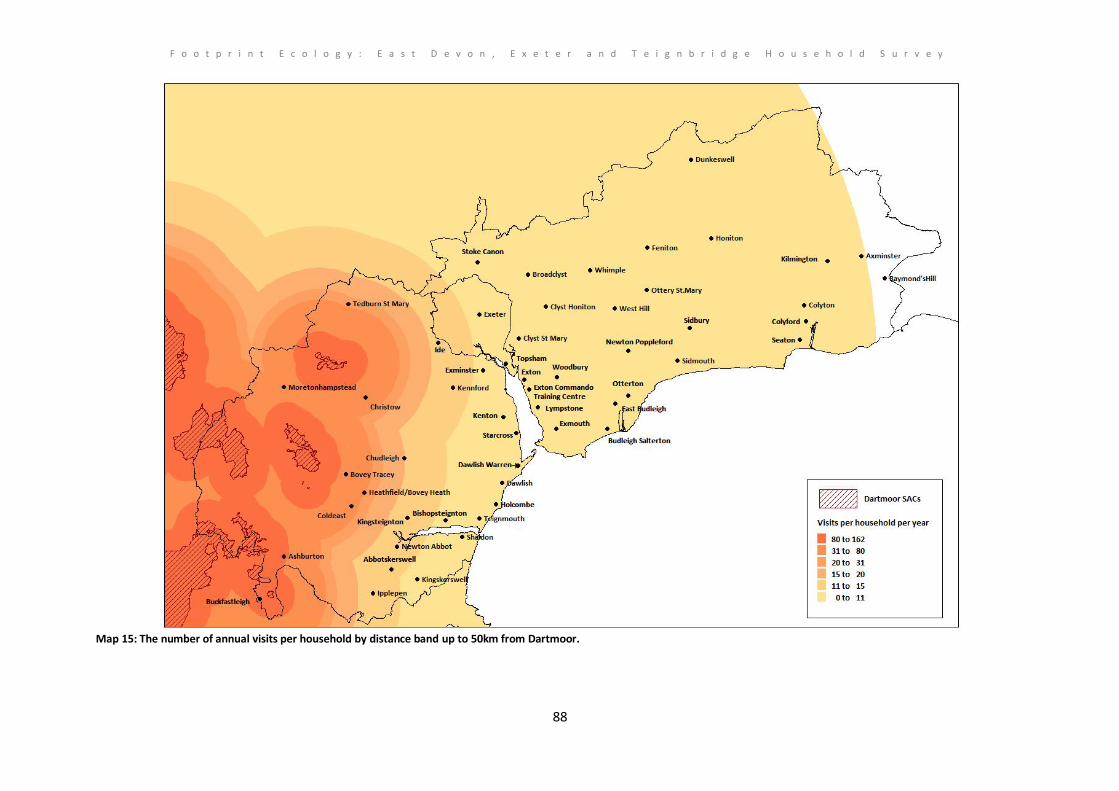
F o o t p r i n t E c o l o g y : E a s t D e v o n , E x e t e r a n d T e i g n b r i d g e H o u s e h o l d S u r v e y
88
Map 15: The number of annual visits per household by distance band up to 50km from Dartmoor.

F o o t p r i n t E c o l o g y : E a s t D e v o n , E x e t e r a n d T e i g n b r i d g e H o u s e h o l d S u r v e y
89
Map 16: The number of annual visits per household by distance band from the Pebblebed Heaths. Visit rate predictions are shown up to 30km for the area to the east of the Exe and an overall visit rate is given for the rest of the study area.

F o o t p r i n t E c o l o g y : E a s t D e v o n , E x e t e r a n d T e i g n b r i d g e H o u s e h o l d S u r v e y
90
10.9 The visit rates were used to estimate the total visits made by residents within each
distance band by multiplying the rate by the number of delivery points (using Royal Mail
PostZon data). The percentage of visits originating within each visit band is shown in maps
17-20 excluding the area to the west of the Exe for Pebblebeds and to the east of the Exe
for Dawlish Warren. These maps take account of the density of housing around each site
and demonstrate the differences in the rate of decline in the number of visits with
increasing distance from each European site. These data are further demonstrated in
Figure 19 where it can be clearly seen that the Pebblebeds is visited by people which live
the closest to the site with 90% of visits coming from people living within 6km of the site
(Map 20). The sharp drop off in visits to the Exe can be seen in Figure 19 and Map 17
where the level tails off from 77% of visits originating within 6km of the site. The stepped
appearance of the visit curve for Dawlish Warren is influenced by low sample sizes and
also low levels of housing at 5km and 6km and also the large number of houses between
12km and 15km which passes through the centre of Exeter which accounting for the
increase of 20% in the number of visits (Map 18). The wider appeal of Dartmoor is very
clear from Figure 19 and Map 19 as the visit curve increases very gradually with 90% of the
visits originating with 38km of the site.
Figure 19: The cumulative percentage of visits to each European site by distance from the site. The number of visits is calculated from the visit rate and the number of households within each distance band.
0
10
20
30
40
50
60
70
80
90
100
0 10 20 30 40 50
Pe
rcen
tage
of
visi
ts
Distance (km)
Dartmoor
Dawlish Warren
Exe Estuary
Pebblebed Heaths

F o o t p r i n t E c o l o g y : E a s t D e v o n , E x e t e r a n d T e i g n b r i d g e H o u s e h o l d S u r v e y
91
Map 17: Percentage of total visits to the Exe estuary by distance from the site. The number of visits is calculated from the visit rate and the number of households within each distance band.

F o o t p r i n t E c o l o g y : E a s t D e v o n , E x e t e r a n d T e i g n b r i d g e H o u s e h o l d S u r v e y
92
Map 18: Percentage of total visits to Dawlish Warren by distance from the site excluding the area to the east of the Exe. The number of visits is calculated from the visit rate and the number of households within each distance band.

F o o t p r i n t E c o l o g y : E a s t D e v o n , E x e t e r a n d T e i g n b r i d g e H o u s e h o l d S u r v e y
93
Map 19: Percentage of total visits to Dartmoor by distance from the site. The number of visits is calculated from the visit rate and the number of households within each distance band.

F o o t p r i n t E c o l o g y : E a s t D e v o n , E x e t e r a n d T e i g n b r i d g e H o u s e h o l d S u r v e y
94
Map 20: Percentage of total visits to the Pebblebed Heaths by distance from the site excluding the area to the west of the Exe. The number of visits is calculated from the visit rate and the number of households within each distance band.

F o o t p r i n t E c o l o g y : E a s t D e v o n , E x e t e r a n d T e i g n b r i d g e H o u s e h o l d S u r v e y
95
Distance to the coast and visit rates
10.10 Using the visit rates we investigated the effect of distance from the coast on visits to
Dawlish Warren to determine whether people who live near the coast are more or less
likely to visit the SAC. Figure 20 shows the visit rate to Dawlish Warren for each
settlement to the west of the Exe with at least 1 respondent and whether the settlement
is less than or more than 5km from the coast. This plot shows that the highest visit rates
are from residents of Dawlish and Dawlish Warren village. A General Linear Model was
used to show that both distance from the coast and distance from Dawlish Warren have
significant effects on the visit rate (p<0.001).Furthermore the interaction of these two
factors was also significant (p<0.001), implying that residents living more than 5km from
the coast visit Dawlish Warren more frequently than other settlements at equivalent
distances from the SAC. A selection of settlements have been labelled in Figure 20
showing that residents of towns such as Kenton and Exminster visit Dawlish Warren SAC
more often than towns which are a similar distance from the SAC but that are within 5km
of another part of the coast (e.g. Teignmouth and Shaldon).
Distance to Dawlish
Vis
it R
ate
302520151050
80
70
60
50
40
30
20
10
0
Less than 5km from the coast
More than 5km from the coast
Tedburn St MaryStoke Canon
Buckfastleigh
IdeKennford
Exminster
Ipplepen
Kenton
Kingskerswell
Starcross
Shaldon
Teignmouth
Dawlish Warren
Dawlish
Holcombe
Figure 20: Visit rate to Dawlish Warren for each settlement to the west of the Exe with at least 1 respondent. The settlements have been separated by distance from the coast (excluding the Exe and Dawlish Warren): less than and more than 5km from the coast.

F o o t p r i n t E c o l o g y : E a s t D e v o n , E x e t e r a n d T e i g n b r i d g e H o u s e h o l d S u r v e y
96
Conclusion
This chapter brings together the results of the household survey to provide a tool to predict the number of visits made to each of four European sites by new housing. This is a very simplified prediction based on all visits rather than visits by car, by foot by dog walkers etc. The predictions are also based on an average household i.e. it doesn’t take account for different household types. The data are used to generate two types of predictions: additional housing within named settlements and additional housing by distance from the nearest point of each European site. Maps are provided based on visit rates in different distance bands from European sites and also the proportion of the total visits made to sites from each distance band which gives an indication of housing density. The maps demonstrate that the Exe has a relatively small catchment given its size and attractiveness to a variety of visitors but visit rates are high within 4km. Dawlish Warren has a very local catchment but due to the low number of respondents within 1km, the rate for 2km was displayed. Dartmoor has a wider catchment whilst the Pebblebeds are very locally used. Distance from the coast seemed to have an effect on the visit rate to Dawlish Warren SAC with people visiting the SAC less often if they live in settlements that are close to other parts of the coast.

F o o t p r i n t E c o l o g y : E a s t D e v o n , E x e t e r a n d T e i g n b r i d g e H o u s e h o l d S u r v e y
97
11. Discussion
Recreational access
11.1 The questionnaire results present a strategic overview of access across a large part of
south Devon. Many of the sites considered within this report are very popular and well
known sites, used by the local populace for a range of different activities. The ability to
directly compare between sites and link where people live to their recreational use of sites
is an important step in informing strategic planning. We are able to make direct
comparisons and the results have implications for the management of visitor flows, green
infrastructure provision and protection of Natura 2000 sites.
Factors of concern with respect to data quality
11.2 The questionnaire design was primarily undertaken by Teignbridge District Council with
guidance from Footprint Ecology. The design was based on the Dorset Household Survey
undertaken by Footprint Ecology to look at visitor use of the Dorset Heaths (Liley, Sharp, &
Clarke 2008). Due to budget restrictions the questionnaire was designed to be entered
manually by staff within each local authority and for coding and labelling of each response
to be dealt with within each local authority. This meant that different data imputers
interpreted the way to enter data differently resulting in the need for extensive
standardisation of entries between three local authorities. Furthermore data from 45
respondents (3.5%) could not be linked to an address and postcode and could therefore
not be included in geographical analyses (i.e. distance between postcodes and sites
visited).
11.3 The fact that the incorrect versions of the maps were used in the final questionnaire had
little effect on the final analysis of the data. This is because we assumed that the
respondents commented on the locations in the table for questions B2, C2 and D2 rather
than the codes and labelled locations on the associated maps. It is correct to assume that
a respondent would describe visits to a location if they are asked to write their answers in
boxes in a questionnaire next to the location name.
11.4 Data checking by Teignbridge District Council after data entry revealed a high proportion
(50%) of questionnaires had been entered with errors. From checks of 22 questionnaires,
mistakes were found in 11, with 14 errors in total, i.e. eight questionnaires had a single
mistake and three more had two mistakes. As each questionnaire contains 242 pieces of
information, then the error rate from data entry is around 0.4%, which is relatively minor.
11.5 We have scaled up each questionnaire to give an annual number of visits to each location.
Respondents filling in each questionnaire were able to indicate that they visited a location
most days, most weeks, most months or a few times a year or less. We used these
responses to indicate 250, 40, 12 or 4 visits per year per household respectively. This
scaling up is by necessity simplistic, and in particular there is a marked difference in scale
between most days and most weeks.

F o o t p r i n t E c o l o g y : E a s t D e v o n , E x e t e r a n d T e i g n b r i d g e H o u s e h o l d S u r v e y
98
11.6 Additional concerns relate to issues concerning recall. Off-site surveys typically ask people
to remember visits and aspects of the visits. It is quite possible that responses will be
different when someone is responding from memory rather than being directly questioned
on site. Such issues may be potentially confounded if the off-site survey is conducted
remotely (for example by telephone or by post) and there is no face-to-face contact.
11.7 Within the report we have considered house type and differences between people living
within different types of house. While informative, such an approach is hindered by the
fact that we do not understand the spatial distribution of house types and would need
further information to interpret the number of visits to specific sites for different house
types and increases in housing by settlements. This is also a key issue to consider when
using the predictions spreadsheet which does not take account for different types of
housing.
Implications for Strategic Planning and Management of Visitor Flows
11.8 Interestingly the number of dogs per dog-owning household was higher for those few
households that stated that they never visited the countryside. In total 77 households
stated they never visited the countryside, and these seventy-seven households were also
more likely to be smaller households with at least one member of the household with
reduced or impaired mobility. These respondents may therefore be those with small dogs
that are walked on the pavement or exercised in the garden.
11.9 The results presented here including the visit rate predictions for additional housing
should be combined with ecological understanding of recreation pressure on the European
Sites and the potential for recreation to result in an adverse effect on the integrity of the
European Sites. In combination this should provide the evidence to inform strategic
planning as to which European Sites are potentially vulnerable to increases in recreation,
which parts of those sites are particularly sensitive and where development would be
expected to result in increased use of the sites of concern. Where development is located
and what mitigation options are available can then be considered.
11.10 In general, the results suggest that the Exe already receives high numbers of visitors, due
to the high population that live nearby and the draw of the site – in terms of the range of
activities and opportunities for recreational use. Dartmoor sites appear to have less of a
local draw than the Exe – i.e. someone living close to Dartmoor visits Dartmoor less
compared to the number of visits to the Exe made by someone living at the same distance
from the Exe. However, at distances of around 15km and more the Dartmoor sites have
the biggest draw, i.e. Dartmoor appears to be the most popular sites for people to travel
some distance to visit, e.g. for day trips etc. Visits to Dartmoor are mostly by car and it
appears to be a destination mostly visited ‘occasionally’. The Pebblebeds clearly have the
most ‘local’ draw of the three European Sites.
Similar work on the impacts of development around European Sites
11.11 On-site visitor surveys and analysis of visitor data in relation to housing have now been
commissioned on a wide range of European sites where there are concerns relating to
access impacts and the implications of new housing development. The concerns revolve

F o o t p r i n t E c o l o g y : E a s t D e v o n , E x e t e r a n d T e i g n b r i d g e H o u s e h o l d S u r v e y
99
around gradual increases in development, occurring property by property, resulting over
time in the area surrounding the sites becoming more urbanised and increasingly used by
the local population for recreation. These studies include a range of heathland sites such
as the Dorset Heaths (Clarke et al. 2006; Liley et al. 2006) the Brecks (Dolman, Lake, &
Bertoncelj 2008), the Wealden Heaths (UE Associates Ltd 2009), the Thames Basin Heaths
(Liley, Jackson, & Underhill-Day 2006; Liley et al. 2006) , Ashdown Forest (UE Associates
2009; Clarke, Sharp, & Liley 2010), and the New Forest (Tourism South East Research
Services & Geoff Broom Associates 2005; Sharp, Lowen, & Liley 2008) and coastal sites
such as the Solent (Fearnley, Clarke, & Liley 2010)..
11.12 These studies highlight the popularity of these sites and, as might be expected, show that
the sites are visited by local people for a range of activities. Differences between
sites/studies are probably a reflection of site attributes (relative attractiveness of sites,
facilities etc.), the relative availability of other places to visit and the spatial distribution of
housing. A notable feature is the distance travelled to different sites, with work in the New
Forest (UE Associates 2009) and Ashdown (Sharp et al. 2008) highlighting people travelling
considerable distances to reach these particular places. While local people often visit sites
regularly for short periods – such as the daily dog walk – some sites also draw people for
longer day-trips and even staying tourists. Such visitors behave differently from regular
visitors and are drawn to the sites for different reasons. Visitors coming for a day-trip may
come from a wide geographic area (essentially meaning that any development in this
wider area may have consequences for access levels). Management issues on such sites,
when there is a range of different types of visitor, become potentially more complex (Liley
et al. 2006; Sharp et al. 2008).
11.13 Issues relating to development and the Thames Basin Heaths SPA have been reasonably
high profile, even reaching the front page of the national press1. The Thames Basin Heaths
SPA is designated for the presence of breeding heathland bird species. The individual
heaths are fragmented, are subject to heavy visitor pressure, are surrounded by an
existing high level of housing and there is considerable pressure for new development. In
response to growing pressure and emerging evidence of disturbance impacts to the
breeding bird interest, the then English Nature started raising concerns and objecting to
new development. A strategic approach to the problem came together in the Thames
Basin Heaths Delivery Plan.
11.14 The Thames Basin Delivery Plan was heavily scrutinised in the Examination in Public for the
South-East Plan, which took place in 2006. The Inspector’s report (Burley 2007), which
was advisory only, raised a number of key points. He concluded that a significant scale of
additional housing within 5km of the SPA would be likely to have a significant adverse
effect on the SPA and therefore a strategic avoidance and mitigation strategy was
necessary. He recommended that the strategy should only cover larger developments of
1 The Independent, 6th May 2006: http://www.independent.co.uk/environment/the-birds-that-blocked-20000-new-homes-476404.html

F o o t p r i n t E c o l o g y : E a s t D e v o n , E x e t e r a n d T e i g n b r i d g e H o u s e h o l d S u r v e y
100
more than 10 houses within 5 kilometres of the SPA or smaller developments of less than
10 houses within 1 kilometre of sensitive areas of the SPA. Developments of over 50
houses within 5-7 kilometres of the SPA should be individually assessed.
11.15 In terms of mitigation, Burley was critical of too much reliance on alternative sites
(Suitable Alternative Natural Greenspace ‘SANGs’) and highlighted that access
management and habitat management were also important. Burley’s report highlighted
the lack of evidence that SANGs would function effectively and the importance of
monitoring the effectiveness of the strategy: “There is as yet little quantifiable evidence
that the provision of SANGs, together with other measures, will be sufficient to mitigate
the impact on the SPA”.
11.16 Subsequent to Burley’s report, various bodies were critical of his recommendations and
there was further refining of the ideas and approach for strategic mitigation. In particular
there was criticism of the attempt to create a breakpoint between developments of
differing sizes. Natural England received a formal legal opinion (Drabble QC and Machin,
21st March 2007) that allowing less than 10 dwellings to go ahead in the Thames Basin
Heaths Delivery Strategy would not be compliant with the Habitats Regulations, would be
unworkable and inherently unfair. The opinion raised the problem of larger developments
being divided and broken down into many small ones in order “to get under the radar”.
11.17 The Thames Basin Delivery Framework (Joint Strategic Partnership Board 2008) was
published in 2008 and sets out the recommendations on measures to enable development
to take place without a significant effect on the SPA as a whole. There are a larger number
of local authorities (some 13) and each of these will refer to the Delivery Framework in the
preparation of local or joint mini-plans, DPDs and/or SPDs. Key elements within the
Framework are:
There are two zones: 0-400m (no development) and 400m – 5km (mitigation
required through developer contributions), measured ‘as the crow flies’. Large
developments beyond the 5km boundary will require individual appropriate
assessment.
The Framework addresses residential (use Class C3) and staff residential (Use
Class C1 and C2A) development.
Avoidance measures and mitigation involve a three pronged approach: SANGs
provision, access management and habitat management.
SANGs should be provided by individual local authorities or by groups of local
authorities. SANGs can be created through the enhancement of existing sites
or the provision of new sites, with 8ha per 1000 residents (calculated using 2.4
residents per household) the required area. SANGs are recommended to be of
at least 2ha in size, and located within a wider open space or network of
spaces (although smaller spaces may form part of a wider SANG network). A
range of types and sizes of SANG should be provided, offering a range of
experiences, including large sites. Guidelines for catchments for different sizes

F o o t p r i n t E c o l o g y : E a s t D e v o n , E x e t e r a n d T e i g n b r i d g e H o u s e h o l d S u r v e y
101
of site are given, for example a SANG of 2-12ha will have a catchment of 2km.
Developments of less than 10 dwellings do not need to be within a specified
distance of SANG provided that a sufficient quantity and quality of SANG land
to cater for the consequent increase in population is identified and available in
that district or agreed in an adjoining district, and functional in advance of
completion.
Access management should be provided by existing landowners and managers
with the funding (for perpetuity) provided through developer contributions.
The access management should be coordinated strategically, by Natural
England working with local authority and land managers, in line with an
overarching strategy for access management on the SPA and SANGs. The
management should focus on soft measures (as opposed to closures and
restrictions) and should include a consistent SPA/SANG message.
Monitoring should take place strategically and address: i) Habitat condition
and birds ii) The provision of SANGs and delivery of dwellings iii) Access
Management iv) Visitor Surveys.
11.18 In the Dorset Heaths there are similar issues to the Thames Basin Heaths, and the solution
has been slightly different. There are a smaller number of local authorities, and these, in
partnership with the then English Nature and others set up the ‘Interim Planning
Framework’, which enabled development to proceed while the information was gathered
to allow a joint DPD to be produced. This Heathland DPD is currently being written.
11.19 The Interim Planning Framework has used the same zones as the Thames Basin Heaths,
namely 400m and 5km, and collected developer contributions for all residential
development between 400m and 5km. These contributions have been used to fund a
range of measures such as a team of wardens, improvements to green space sites outside
the heaths and improved facilities for fire fighting (such as improved access and fire
hydrants).
11.20 South-east Dorset and the Thames Basin Heaths are not the only areas where
development control zones have been put in place to avoid impacts of development on
heathland sites or zones within which developers provide funding for mitigation works.
Breckland District has established a zone of 1500m around those parts of the Breckland
SPA that support stone curlews (an interest feature of the SPA), based on research that
has shown that stone curlews occur at lower densities within 1500m of housing . Within
this zone development is largely excluded and can only take place if it fulfils particular
criteria. The stone curlews occur primarily on arable land and in some places occur
outside the SPA boundary, therefore a second zone sets out those areas of the District that
are within 1500m of nesting stone curlew and fall outside the first 1500m zone. Within
this second zone, development needs to provide mitigation specifically targeted towards
stone curlews. A third zone – at 400m – has also been established around those parts of
the SPA that support nightjar and woodlark. This is a no development zone and has been
established for the same reasons as in Dorset and the Thames Basin Heaths. The Breckland

F o o t p r i n t E c o l o g y : E a s t D e v o n , E x e t e r a n d T e i g n b r i d g e H o u s e h o l d S u r v e y
102
Core Strategy was subject to various criticisms from developers (promoting sites within the
1500m zone) but has been formally adopted following examination in public.
11.21 The choice of 400m and 5km zones around heathland sites therefore represent pragmatic
choices, based on available evidence. The 400m development exclusion zone is intended
to reduce impacts such as increased predation from cats, fragmentation as well as
increased access and the effects of disturbance. Such zones are likely to be relatively site
specific and there is not necessarily any justification in applying such distances to coastal
or estuarine sites. Indeed, evidence presented here would suggest that for sites such as
the Exe, the site has a considerable draw and larger zones may be required. The
potentially difficult decision to make is to determine a sensible balance in terms of
development ‘exclusion’ zones ensuring no new housing close to sites, the provision of
alternative sites and on-site measures to reduce/remove disturbance issues.
11.22 The visitor rate curves show how visitor rates vary with distance away from the sites.
Visitors living very close to the respective sites visit the most, and clearly new housing
adjacent or nearby the boundaries of the relevant sites will result in the most increase in
recreational use. There is of course no clear distance threshold at which development is
best avoided. We have plotted maps to show indicative bands, to illustrate the distances
shown in the graphs. The lines on the maps are not intended to show zones but rather to
provide a spatial illustration of the distances discussed.
Efficacy of SANGs
11.23 A key issue to address when determining the level and location of housing which might
have an impact on a nearby European site is the potential use of SANGs to deflect
additional pressure on the site. Here we have used the results generated from this survey
to provide brief comments on the efficacy of SANGs in terms of their role in attracting
visitors away from the European sites within the study area. Here we consider the Exe and
Dawlish Warren together and also the Pebblebed Heaths. We do not consider Dartmoor
as it is a very unique location, used by visitors for its features as a large and diverse area of
semi-natural landscape which is impossible to replicate with SANGs.
Attracting visitors away from the Exe and Dawlish Warren
11.24 The Exe is a very popular location and like Dartmoor, in the context of the surrounding
area, it is highly unique. Access to the water’s edge is possible for thousands of residents
living in settlements along its shores and this provides many opportunities for a diverse
range of activities. In terms of visitors to the Exe, alternative sites and additional green
infrastructure are perhaps much less likely to be effective in their own right compared to
such measures on heathland sites. It is clear that it would be very difficult to attract
watersports users away from the Exe although a number of mitigation measures have
been recommended in Liley & Hoskin (2011) based on the Exe Disturbance Study (Liley et
al. 2011). These measures include provision or enhancement of watersports facilities
elsewhere, clear zoning for users and improved communication and awareness raising.
11.25 With respect to other activities such as walking and dog walking the effectiveness of
alternative sites would be greatly improved in combination with specific on-site
management measures that may serve to deter visitors (e.g. changes to parking or dog

F o o t p r i n t E c o l o g y : E a s t D e v o n , E x e t e r a n d T e i g n b r i d g e H o u s e h o l d S u r v e y
103
control orders in certain areas) and if they are targeted at very specific users (such as local
dog walkers). In the Exe Visitor Survey (Liley & Cruickshanks 2010) nearly one-third (30%)
of dog walkers indicated that no change was possible (i.e. an alternative site would be
unlikely to work). Dog friendliness was the most important feature of an additional site to
the 38% of respondents to the visitor survey who felt that they might use an alternative
site. Given that the seafront and the Duckpond are the most popular areas for dog
walking these would be the best places to target with on site measures and local SANGs.
11.26 Figure 6 provides some evidence that residents living along the coast are less likely to visit
Dawlish Warren than people living the same distance away from Dawlish Warren, but
inland. This only appears in the plot at distances beyond around 4km from Dawlish
Warren. This would suggest that residents living close to the coast choose local coastal
sites to visit, and this may mean there is merit in a coastal SANG, but that SANGs also
clearly need to be accessible and close to new housing to work.
Attracting visitors away from the Pebblebed Heaths
11.27 It is possible that SANGs may be a more suitable option for Pebblebeds sites where a large
proportion of the access comes from regular local visitors undertaking dog walking.
Looking at the household survey data, regular visitors to the Pebblebeds are very local to
the site. Of the 115 respondents who stated that they use the Pebblebeds for dog
walking, 82% also use the Exe for dog walking, 38% use other coastal locations, 63% use
Dartmoor and 56% use other countryside locations. Therefore dog walkers at the
Pebblebeds show a moderate level of site fidelity (‘faithfulness’) and given that they use
other sites, it could be assumed that they would be willing to try somewhere new.
However, it is clear that Exe still has the greatest pull to visitors, particularly dog walkers,
and any management to limit the level of use of the Pebblebeds could result in greater use
of the Exe by residents living between the two sites.
Future changes in visitor behaviour
11.28 There is evidence that recreational use of the English countryside is increasing. The MENE
(Monitor of Engagement with the Natural Environment; the national survey on people and
the natural environment) survey was commissioned by Natural England to understand
how people use, enjoy and are motivated to protect the natural environment and also to
provide data that monitors change in use and enjoyment of the natural environment over
time at a range of different spatial scales and key groups. The survey has revealed that for
the English adult population an average of 69 visits per year are made to the natural
environment (TNS Research International Travel & Tourism 2010). There are some issues
with the direct comparison of the MENE survey data with previous work, but following a
calibration exercise with the 2005 England Leisure Visits Survey (ELVS) there has been an
estimated 7% increase in volume of visits to the natural environment between 2005 and
2009-10 (TNS Research International Travel & Tourism 2010). This increased number of
visits to the natural environment is expected to continue and illustrates the importance of
implementing and monitoring effective mitigation measures to ensure there no impacts
occur to sensitive sites.

F o o t p r i n t E c o l o g y : E a s t D e v o n , E x e t e r a n d T e i g n b r i d g e H o u s e h o l d S u r v e y
104
11.29 MENE draws from the English population as a whole, including urban areas. The 69 visits
per person per year to the countryside is an interesting figure. The MENE survey gives an
average group size of 2.5 for each visit, and assuming an average occupancy rate of 2.4
people per household2, this would suggest that the visit rate per household is somewhere
less than 69.
11.30 There is relatively little work done to date on the impacts of climate change on people’s
recreational use of the countryside. Sea-level rise will result in potential changes to
beaches and the coastal environment which may have implications for recreational use.
Changes in weather patterns may also result in changes in access patterns. Milder winters
or warmer springs and autumns may result in increased use at these times. Milder
weather and increased storminess may change participation in watersports, for example
kite surfers and windsurfers require strong winds. Canoeists and kayakers are perhaps
more likely to be out when the weather is milder and the water calmer.
11.31 Coombes (2007) reviews the impacts of climate change on coastal recreation and presents
models to predict the changes in use in East Anglia. Her results suggest that climate
change will result in a net increase in visitors, the positive effects of warmer and drier
weather outweighing the predicted negative impacts of a loss of beach habitat and
changes in the habitat likely to occur as a result of sea-level rise.
11.32 The range of activities people undertake in the countryside is increasing. Activities such as
mountain biking are still relatively new - the first mountain bikes were imported into the
UK in 1982 (Palmer 2006). Many activities, such as the use of personal water craft are
showing an increasing trend in use (Whitfield & Roche 2007). Scottish Natural Heritage
have assessed future trends in recreation use (Brown et al. 2010) and this would indicate
that in general, the most likely trend in future outdoor recreation is an increasing diversity
of activities concentrated in a smaller range of the most accessible, specialised locations.
The report suggests that there will be less time for outdoor recreation given busy lifestyles
and the increasing choice of alternative activities available. The current financial crisis may
also dampen demand for some forms of outdoor recreation, at least in the short term. A
key implication that is identified is the need to provide quality outdoor recreation
opportunities, infrastructure and services, particularly in proximity to places of work and
residence, for encouraging and managing access for a diversity of uses and users.
Managing areas of concentrated use whilst maintaining sufficient investment in less used
areas that are ecologically, socially or economically significant will also require careful
balancing of resources.
Economic assessment
11.33 The data collected as part of this household survey can contribute to a limited economic
assessment of the different locations and the types of visitors that visit them. For each
2 Taken from the 2001 census, which gives an average of 2.36 for England and Wales and an average of 2.31 for the south-west region; http://www.statistics.gov.uk/census2001/profiles/commentaries/housing.asp

F o o t p r i n t E c o l o g y : E a s t D e v o n , E x e t e r a n d T e i g n b r i d g e H o u s e h o l d S u r v e y
105
location we can provide a summary of the number of visits during which a pub/cafe was
visited. For the coastal locations only we can also provide information on visits which
involved the amusements. As an example, we can also collate responses for ‘other’
activities such as shopping which was recorded in the free text activity response on 84
visits to the Exe. Pub/cafe visits was not an activity category in the face to face visitor
survey work undertaken around the Exe in 2010 for Teignbridge District Council (Liley &
Cruickshanks 2010). Therefore combining data on economic factors derived from the face
to face survey would require categorisation of free text responses, but could include
additional information on holiday makers.
Predicting visitor rates: data considerations
11.34 In the final chapter, the steps used to generate a visitor rate prediction spreadsheet are
described and there are some data quality issues to consider when interpreting the visit
rate predictions provided. Firstly the visit rates generated using the fitted curves are
limited by the fit of the curves. The curves were manually fitted using an exponential
curve to maximise R2 and these are displayed within the chapter relevant to each site. In
some cases the R2 was low due to low sample sizes in some distance bands therefore we
have provided the actual data and sample sizes (number of respondents) for reference.
11.35 Low numbers of respondents in certain distance bands from sites means that unusual
results were seen in some cases. Typically the closer people live to a site the more
frequently they visit but in cases where there are low numbers of responses to generate
the fitted curve a different pattern occurs whereby visit rate increases at certain distances.
This is the case with the data for Dawlish Warren where few responses were received from
residents within 1km, therefore the visit rate at 2km was higher than at 1km. To provide a
useful map, we assumed that the visit rate to Dawlish Warren at 2km was the same at
1km.
11.36 It is also important to consider that for visit rates to Dawlish Warren and the Pebblebeds, a
limited area has been selected to account for the fact that the Exe creates a barrier to
travel within the study area. Therefore average visit rates have been used for settlements
outside of the focal areas for these two sites except for Exmouth visit rates to Dawlish
Warren which take account of the ferries allowing travel across the Exe in the summer.
11.37 Scaling up visit rates to the number of houses within a settlement or distance band when
using the predictions spreadsheet does not take account for differences in visit rates of
respondents living in different types of houses. For example a people who undertake
watersports on the Exe are more likely to live in a house rather than a bungalow and a
high proportion of dog walkers at the Exe live in bungalows, flats or houses with less than
two bedrooms.
F o o t p r i n t E c o l o g y : E a s t D e v o n , E x e t e r a n d T e i g n b r i d g e H o u s e h o l d S u r v e y
106
References
Alessa, L., Bennett, S.M. & Kliskey, A.D. (2003) Effects of knowledge, personal attribution and
perception of ecosystem health on depreciative behaviors in the intertidal zone of Pacific Rim
National Park and Reserve. Journal of Environmental Management, 68, 207–218.
anon. (2004) Great Britain Day Visits Survey 2002/3. A survey undertaken by the Countryside
Agency, Countryside Council for Wales, British Waterways, Department for Culture, Media and
Sport, Environment Agency, Forestry Commission, Scottish Natural Heritage, VisitBritain,
VisitScotland and Wales Tourist Board. Natural England.
Bird, D.M. (2004) Natural fit, can green space and biodiversity increase levels of physical activity.
RSPB, Sandy, Bedfordshire.
Brown, K.M., Curry, N., Dilley, R., Taylor, K. & Clark, K. (2010) Assessing future recreation demand.
Buckley, R. (2004) Environmental impacts of Ecotourism. CABI, Wallingford, Oxfordshire.
Burley, P. (2007) Report to the panel for the draft south east plan examination in public on the
Thames Basin Heaths Special Protection Area and Natural England’s Draft Delivery Plan.
Inspectorate, Planning.
CCW & FC. (2009) Welsh Outdoor Recreation Survey 2008: Headline Results. Countryside Council for
Wales; Forestry Commission.
Clarke, R.T., Liley, D., Underhill-Day, J.C. & Rose, R.J. (2006) Visitor access patterns on the Dorset
Heaths. English Nature.
Clarke, R., Sharp, J. & Liley, D. (2010) Ashdown Forest visitor survey data analysis. Natural England.
Coombes, E.G. (2007) The effects of climate change on coastal recreation and biodiversity.
Dolman, P., Lake, I.R. & Bertoncelj, I. (2008) Visitor flow rate and recreational modelling in
Breckland. UEA, Norwich.
English Nature. (2002) Revealing the value of nature. English Nature, Peterborough.
Fearnley, H., Clarke, R.T. & Liley, D. (2010) The Solent Disturbance and Mitigation Project. Phase II.
On-site visitor survey results from the Solent Region. Footprint Ecology/Solent Forum.
Hockin, D., Ounsted, M., Gorman, M., Hill, D., Keller, V. & Barker, M.A. (1992) Examination of the
effects of Disturbance on birds with reference to its importance in Ecological Assessments. Journal
of Environmental Management, 36, 253–286.
Joint Strategic Partnership Board. (2008) Thames Basin heaths Delivery framework. South East
England Regional Assembly, Guildford.
Kirby, J., Davidson, N., Giles, N., Owen, M. & Spray, C. (2004) Waterbirds and Wetland Recreation
Handbook. Wildfowl and Wetlands Trust, Slimbridge, Gloustershire.
Lake, S. (2010) Assessment of recreational impacts on Dawlish Warren Special Area of Conservation.
Footprint Ecology/Teignbridge District Council.
Liddle, M.J. (1997) Recreation Ecology. Chapman & Hall, London.
Liley, D., Clarke, R.T., Mallord, J.W. & Bullock, J.M. (2006) The effect of urban development and
human disturbance on the distribution and abundance of nightjars on the Thames Basin and Dorset
Heaths. Natural England / Footprint Ecology.
Liley, D., Clarke, R.T., Underhill-Day, J. & Tyldesley, D.T. (2006) Evidence to support the Appropriate
Assessment of development plans and projects in south-east Dorset. Footprint Ecology / Dorset
County Council.
F o o t p r i n t E c o l o g y : E a s t D e v o n , E x e t e r a n d T e i g n b r i d g e H o u s e h o l d S u r v e y
107
Liley, D. & Cruickshanks, K. (2010) Exe Visitor Survey, 2010. Teignbridge District Council/Footprint
Ecology.
Liley, D., Cruickshanks, K., Waldon, J. & Fearnley, H. (2011) Exe Disturbance Study. Footprint
Ecology/Exe Estuary Management Partnership.
Liley, D. & Hoskin, R. (2011) Exe Estuary SPA and Dawlish Warren SAC Interim Overarching Report
Relating to Strategic Planning and Impacts from Recreation.
Liley, D., Jackson, D.B. & Underhill-Day, J.C. (2006) Visitor Access Patterns on the Thames Basin
Heaths. English Nature, Peterborough.
Liley, D., Sharp, J. & Clarke, R.T. (2008) Access patterns in south-east Dorset. Dorset household
survey and predictions of visitor use of potential greenspace sites. Dorset Heathlands Development
Plan Document. Footprint Ecology.
Liley, D., Sharp, J., Clarke, R.T. & Lake, S. (2009) Natural England’s approach to monitoring access on
sites, a review. Footprint Ecology.
Lowen, J., Liley, D., Underhill-Day, J. & Whitehouse, A.T. (2008) Access and Nature Conservation
Reconciliation: supplementary guidance for England.
Morris, N. (2003) Health, well-being and open space literature review. Edinburgh Colleage of Art
and Heriot-Watt University, Edinburgh.
Natural England, DEFRA, Environment Agency, Foresty Commission, Broads Authority, Dartmoor
NPA, Lake District NPA, North York Moors NPA, Northumberland NPA, Peak District NPA &
Yorkshire Dales NPA. (2006) England Leisure Visits Report of the 2005 Survey. Various.
Nisbet, I.C.T. (2000) Disturbance, habituation, and management of waterbird colonies -
Commentary. waterbirds, 23, 312–332.
Palmer, C. (2006) Mountain Biking: settling into middle age or clicking up a gear. Byway and
Bridleway, 3, 33–34.
Pretty, J., Griffin, M., Peacock, J., Hine, R., Selens, M. & South, N. (2005) A countryside for health
and well-being: the physical and mental health benefits of green exercise. Countryside Recreation,
13, 2–7.
Saunders, C., Selwyn, J., Richardson, S., May, V. & Heeps, C. (2000) A review of the effects of
recreational interactions within UK European marine sites. UK CEED & Bournemouth University.
Sharp, J., Lowen, J. & Liley, D. (2008) Recreational pressure on the New Forest National Park, with
particular reference to the New Forest SPA. New Forest National Park Authority / Footprint Ecology.
TNS Research International Travel & Tourism. (2010) Monitor of Engagement with the Natural
Environment: The national survey on people and the natural environment - Annual Report from the
2009-10 survey.
Tourism South East Research Services & Geoff Broom Associates. (2005) A survey of recreational
visits to the New Forest National Park. Countryside Agency.
UE Associates. (2009) Visitor Access Patterns on Ashdown Forest. Conducted for Mid Sussex and
Wealden District Councils.
UE Associates Ltd. (2009) Visitor access patterns on European sites surrounding Whitehill and
Bourdon, East Hampshire.
Whitfield, R. & Roche, R. (2007) UK Personal Watercraft Management: A user perspective. Marine
Policy, 31, 564–572.
Woodfield, E. & Langston, R. (2004) Literature review on the impact on bird populations of
disturbance due to human access on foot. Royal Society for the Protection of Birds, Sandy, Beds.

F o o t p r i n t E c o l o g y : E a s t D e v o n , E x e t e r a n d T e i g n b r i d g e H o u s e h o l d S u r v e y
108
Appendices
Appendix 1 the survey questionnaire sent to 5100 properties
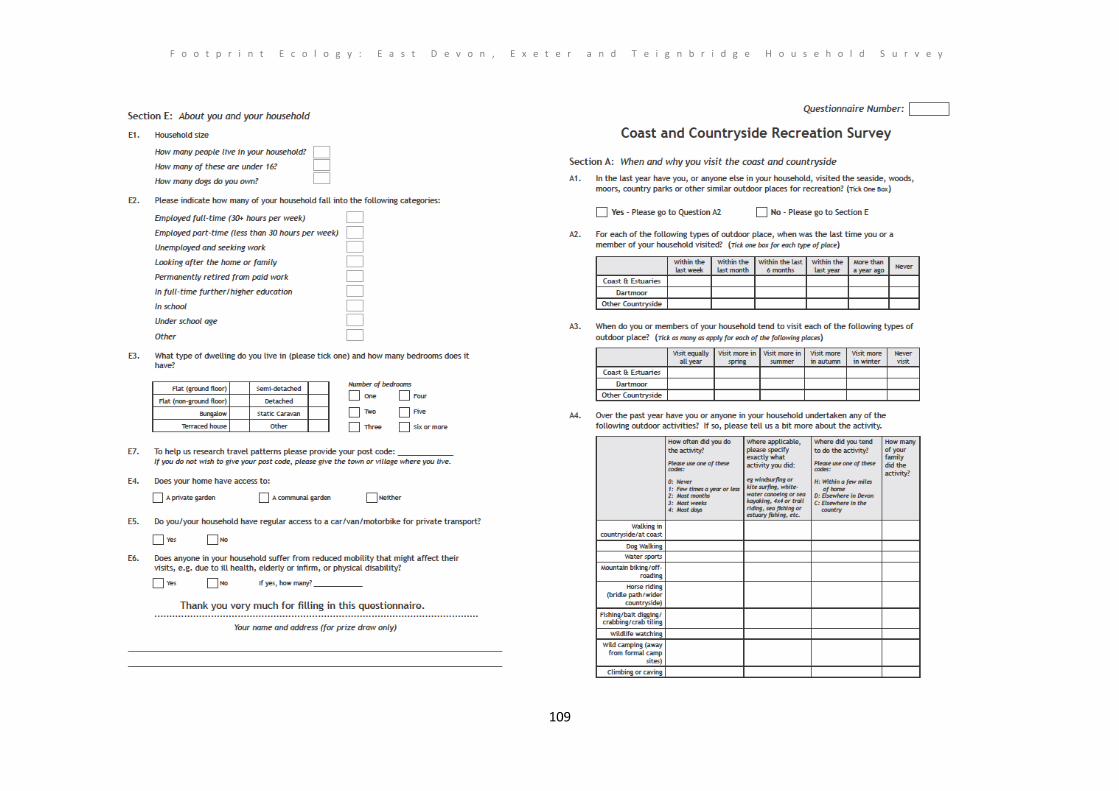
F o o t p r i n t E c o l o g y : E a s t D e v o n , E x e t e r a n d T e i g n b r i d g e H o u s e h o l d S u r v e y
109

F o o t p r i n t E c o l o g y : E a s t D e v o n , E x e t e r a n d T e i g n b r i d g e H o u s e h o l d S u r v e y
110

F o o t p r i n t E c o l o g y : E a s t D e v o n , E x e t e r a n d T e i g n b r i d g e H o u s e h o l d S u r v e y
111

F o o t p r i n t E c o l o g y : E a s t D e v o n , E x e t e r a n d T e i g n b r i d g e H o u s e h o l d S u r v e y
112
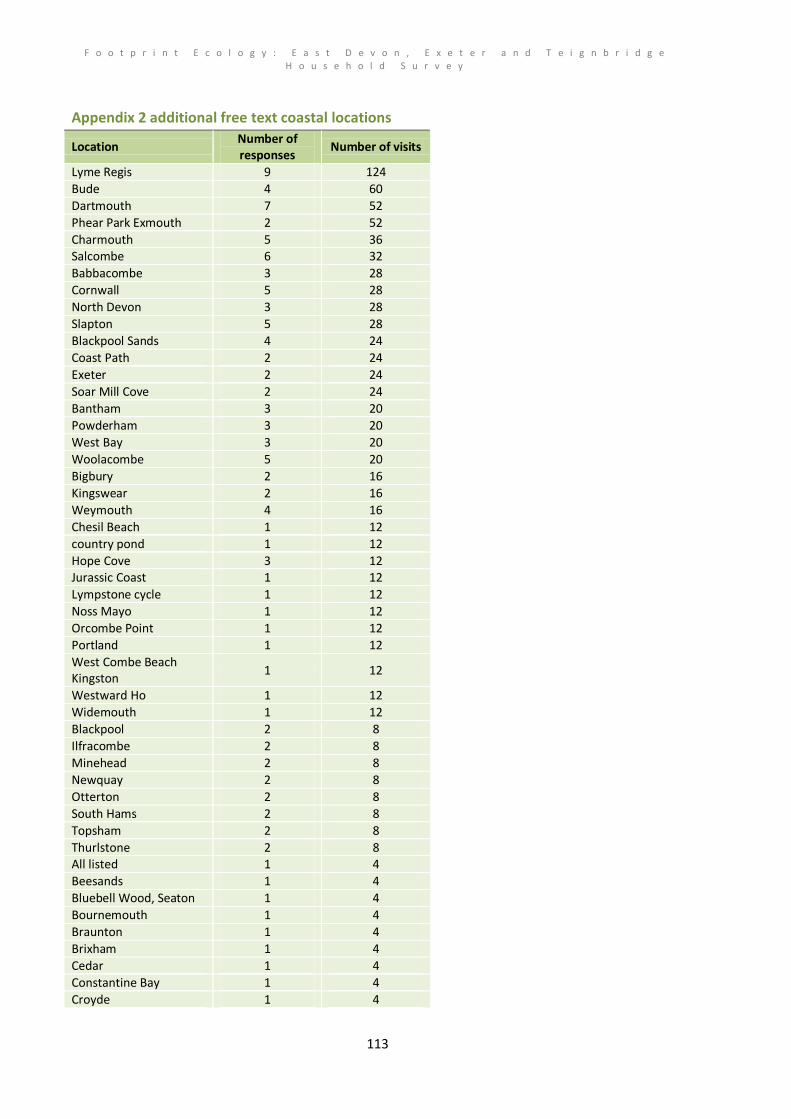
F o o t p r i n t E c o l o g y : E a s t D e v o n , E x e t e r a n d T e i g n b r i d g e H o u s e h o l d S u r v e y
113
Appendix 2 additional free text coastal locations
Location Number of responses
Number of visits
Lyme Regis 9 124
Bude 4 60
Dartmouth 7 52
Phear Park Exmouth 2 52
Charmouth 5 36 Salcombe 6 32
Babbacombe 3 28
Cornwall 5 28
North Devon 3 28
Slapton 5 28
Blackpool Sands 4 24
Coast Path 2 24
Exeter 2 24
Soar Mill Cove 2 24
Bantham 3 20
Powderham 3 20
West Bay 3 20
Woolacombe 5 20
Bigbury 2 16
Kingswear 2 16
Weymouth 4 16
Chesil Beach 1 12
country pond 1 12
Hope Cove 3 12 Jurassic Coast 1 12
Lympstone cycle 1 12
Noss Mayo 1 12
Orcombe Point 1 12
Portland 1 12
West Combe Beach Kingston
1 12
Westward Ho 1 12
Widemouth 1 12
Blackpool 2 8
Ilfracombe 2 8
Minehead 2 8
Newquay 2 8
Otterton 2 8
South Hams 2 8
Topsham 2 8
Thurlstone 2 8 All listed 1 4
Beesands 1 4
Bluebell Wood, Seaton 1 4
Bournemouth 1 4
Braunton 1 4
Brixham 1 4
Cedar 1 4
Constantine Bay 1 4
Croyde 1 4

F o o t p r i n t E c o l o g y : E a s t D e v o n , E x e t e r a n d T e i g n b r i d g e H o u s e h o l d S u r v e y
114
Location Number of responses
Number of visits
Dart estuary 1 4
Donegal 1 4
East Prawle 1 4
Fremington Beach 1 4
Hall Sands 1 4
Harlyn, Cornwall 1 4
Instow 1 4
Isle of Wight 1 4 Lamberts Castle 1 4
Little Dartmouth 1 4
Mousehole 1 4
Newlyn 1 4
North Cornwall 1 4
North Devon 1 4
Outer Hebrides 1 4
Padston 1 4
Penwith 1 4
Perranporth 1 4
Plymouth Hoe 1 4
Poole 1 4
Scilly Isles 1 4
South Devon Coast Path 1 4
Sennen 1 4
Sharkham Point 1 4
Spekes Mill Mouth 1 4
St Ives 1 4 Stoke Gabriel 1 4
Taw/Torridge 1 4
The Exe 1 4
Valley of the Rocks 1 4
Watcombe 1 4
Weston 1 4

F o o t p r i n t E c o l o g y : E a s t D e v o n , E x e t e r a n d T e i g n b r i d g e H o u s e h o l d S u r v e y
115
Appendix 3 additional free text countryside locations
Location Number of responses
Number of visits
Chudleigh 2 500
Shute Woods 2 500
Bradley Woods 4 306
Couchill Woods 2 290
Brampford Speke 3 266 South Hams 2 262
Blackdown Hills 1 250
Farway area 1 250
Ipplepen 1 250
Local Fields 1 250
Stoke Canon 1 250
Talaton area 1 250
The Glen Honiton 1 250
Upton Pyne 1 250
Walks around Pinhoe 1 250
Whimple 1 250
Holliford Woods 2 80
Escot 4 68
Dalditch 5 64
Hackney Marshes 3 56
Budleigh Cycle Route 2 52
Raddon Hills 2 52
Charmouth Woods 2 44
Barley Valley Nature Reserve
1 40
Colyford 1 40
Danes Wood 1 40
Dunkeswell Area 1 40
East Hill Strip 1 40
Footpaths in Ted St Mary
1 40
Ide/Coombehead 1 40
Lyme 1 40
Orcombe Point 1 40
Ottery St Mary 1 40
Pinhoe area 1 40
Rackerhayes 1 40
Route 2 cycle path 1 40
Teigngrace 1 40 Wapperwell 1 40
Wilmington 1 40
Woods nr Kenn 1 40
Knightshayes 5 36
Lamberts Castle 3 28
Exeter 3 20
Axminster 2 16
Tiverton 2 16
Devon 1 12
Dumpton Hill 1 12
Dumsdon Hill 1 12
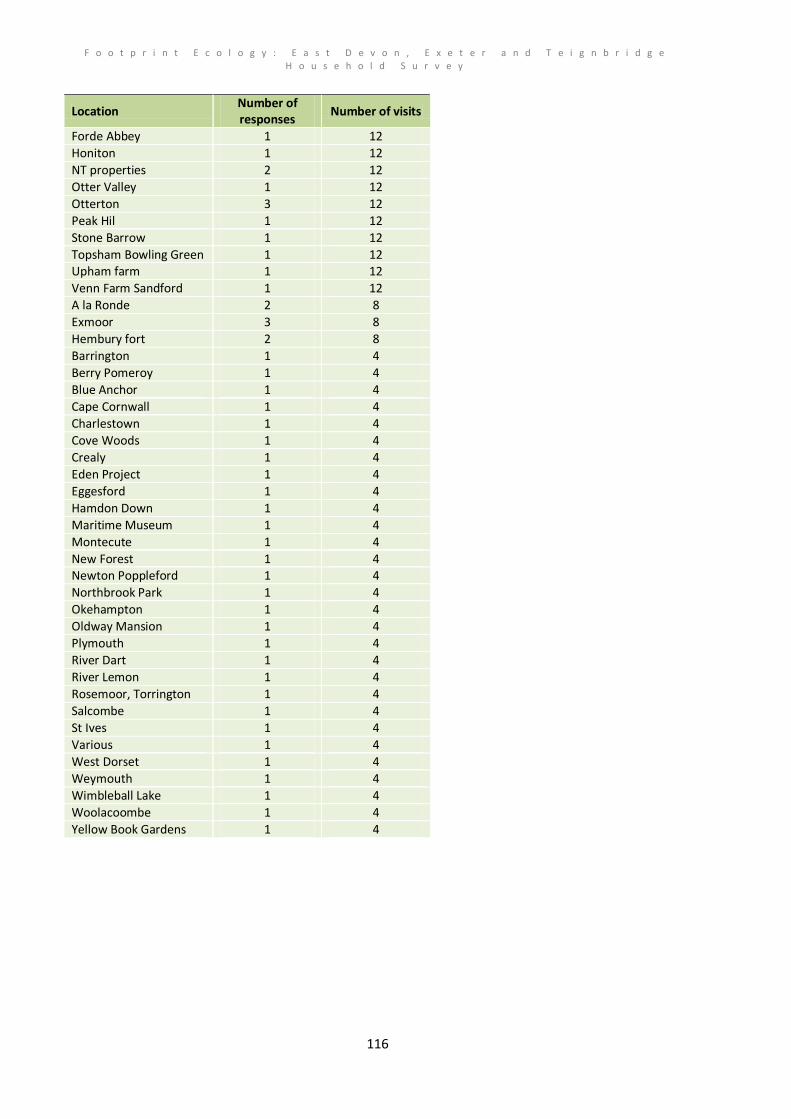
F o o t p r i n t E c o l o g y : E a s t D e v o n , E x e t e r a n d T e i g n b r i d g e H o u s e h o l d S u r v e y
116
Location Number of responses
Number of visits
Forde Abbey 1 12
Honiton 1 12
NT properties 2 12
Otter Valley 1 12
Otterton 3 12
Peak Hil 1 12
Stone Barrow 1 12
Topsham Bowling Green 1 12 Upham farm 1 12
Venn Farm Sandford 1 12
A la Ronde 2 8
Exmoor 3 8
Hembury fort 2 8
Barrington 1 4
Berry Pomeroy 1 4
Blue Anchor 1 4
Cape Cornwall 1 4
Charlestown 1 4
Cove Woods 1 4
Crealy 1 4
Eden Project 1 4
Eggesford 1 4
Hamdon Down 1 4
Maritime Museum 1 4
Montecute 1 4
New Forest 1 4 Newton Poppleford 1 4
Northbrook Park 1 4
Okehampton 1 4
Oldway Mansion 1 4
Plymouth 1 4
River Dart 1 4
River Lemon 1 4
Rosemoor, Torrington 1 4
Salcombe 1 4
St Ives 1 4
Various 1 4
West Dorset 1 4
Weymouth 1 4
Wimbleball Lake 1 4
Woolacoombe 1 4
Yellow Book Gardens 1 4