ExxonMobil “The Outlook for Energy A View to 2030”
42
Outlook for Energy A View to 2030 E x x o n M o b i l C o r o r a t i o n O t l k f o r E n e r : A V i e w t o 2 0 3 0
Transcript of ExxonMobil “The Outlook for Energy A View to 2030”
8/7/2019 ExxonMobil “The Outlook for Energy A View to 2030”
http://slidepdf.com/reader/full/exxonmobil-the-outlook-for-energy-a-view-to-2030 1/42
Outlook for Energy
A View to 2030
8/7/2019 ExxonMobil “The Outlook for Energy A View to 2030”
http://slidepdf.com/reader/full/exxonmobil-the-outlook-for-energy-a-view-to-2030 2/42IFC1 exxonmobil.com
Table o Contents
Transition to modern energy/technology 2
Our key energy challenges 6
Growing global demand 13
Global transportation demand 15
A single-cell oil well? 16
Improving today’s vehicle 18
Thinking outside the tank 20
Global industrial demand 21
Managing emissions 22
Global energy demand and supply 25
The importance o natural gas 27
Options or carbon policy 31
CO2 emissions 32
Integrated energy solutions 34
Key indings 36
Glossary 37
This publication includes orward-looking statements. Actual uture
conditions (including economic conditions, energy demand, and
energy supply) could dier materially due to changes in technology,
the development o new supply sources, political events, demographic
changes, and other actors discussed herein (and in Item 1 o
ExxonMobil’s latest report on Form 10-K). This material is not to be
reproduced without the permission o Exxon Mobil Corporation.
8/7/2019 ExxonMobil “The Outlook for Energy A View to 2030”
http://slidepdf.com/reader/full/exxonmobil-the-outlook-for-energy-a-view-to-2030 3/42The Outlook for Energy: A View to 2030 1
The Outlook or Energy:
A View to 2030
The Outlook for Energy: A View to 2030 1
In our Outlook or Energy – A View to 2030, we see many
hopeul things – economic recovery and growth, improved
living standards and a reduction in poverty, and promising
new energy technologies.
But we also see a tremendous challenge: how to meet the
world’s growing energy needs while also reducing the impact
o energy use on the environment.
As the Outlook shows, ExxonMobil expects that global energy
demand in 2030 will be almost 35 percent higher than in
2005, even accounting or the recession that dampened
energy demand in 2009. Other key ndings include:
• Growthwillbeledbyrapidexpansioninnon-OECD
countries such as China and India, where energy usage will
rise by about 65 percent.
• Demandwillbeparticularlyintenseforelectricpower
generation, which will comprise 40 percent o global energy
demand by 2030.
• Oilandnaturalgaswillremainessential,butothersources
including nuclear and renewables (e.g., wind, solar and
biouels) will play an expanded role.
The uture o energy is directly linked to the uture well-being
and prosperity o the world’s people.
Today, about 1.5 billion people – a quarter o the world’s
population – lack access to electricity. Even more lack modern
cooking and heating uels. Expanding access to energy – and
the opportunities it aords – should be a shared global goal.
Our energy and environmental challenges are intertwined and
their scale is enormous. Today, energy use per person around
the world varies dramatically but equates to an average o
200,000 British thermal units (BTUs) a day. Globally, that
translates to 15 billion BTUs every second.
ExxonMobil believes that meeting uture energy needs while
also reducing environmental risk will require an integrated set
o solutions that includes:
• Acceleratingenergyefciency,whichtempersdemandand
saves emissions
• Expandingall economic energy sources, including oil and
natural gas
• Mitigatingemissionsthroughtheuseofnewtechnologies
and cleaner-burning uels such as natural gas, nuclear and
other renewable sources.
This multidimensional approach will need trillions o dollars
in investment, and an unwavering commitment to innovation
and technology that evolves over years and decades. It will
require sound, stable government policies that enable access
to resources and encourage long-term investments and
technological development. And it will require the global
energy industry to operate on a scale even larger than today.
Updated each year, The Outlook or Energy is a comprehensive
look at long-term trends in energy demand, supply, emissions
and technology. The report is built upon detailed analysis o
data rom about 100 countries, incorporating publicly available
inormation as well as in-house expertise.
ExxonMobil uses the Outlook to guide its long-term investment
decisions. We share it publicly to encourage a better
understanding o our company, our industry and the global
energy challenges that we all have a vested interest in meeting.
8/7/2019 ExxonMobil “The Outlook for Energy A View to 2030”
http://slidepdf.com/reader/full/exxonmobil-the-outlook-for-energy-a-view-to-2030 4/42
Transition to modern energy/technology
2 exxonmobil.com
8/7/2019 ExxonMobil “The Outlook for Energy A View to 2030”
http://slidepdf.com/reader/full/exxonmobil-the-outlook-for-energy-a-view-to-2030 5/42The Outlook for Energy: A View to 2030 3

8/7/2019 ExxonMobil “The Outlook for Energy A View to 2030”
http://slidepdf.com/reader/full/exxonmobil-the-outlook-for-energy-a-view-to-2030 6/42

8/7/2019 ExxonMobil “The Outlook for Energy A View to 2030”
http://slidepdf.com/reader/full/exxonmobil-the-outlook-for-energy-a-view-to-2030 7/42
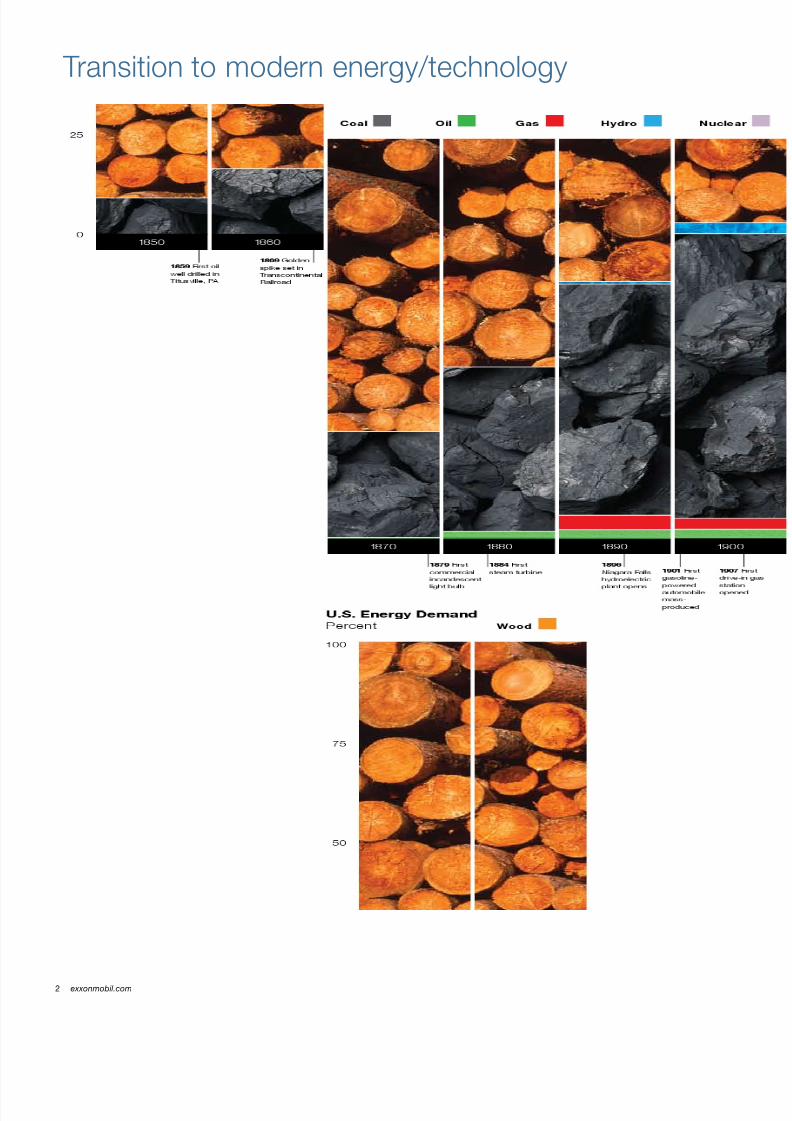
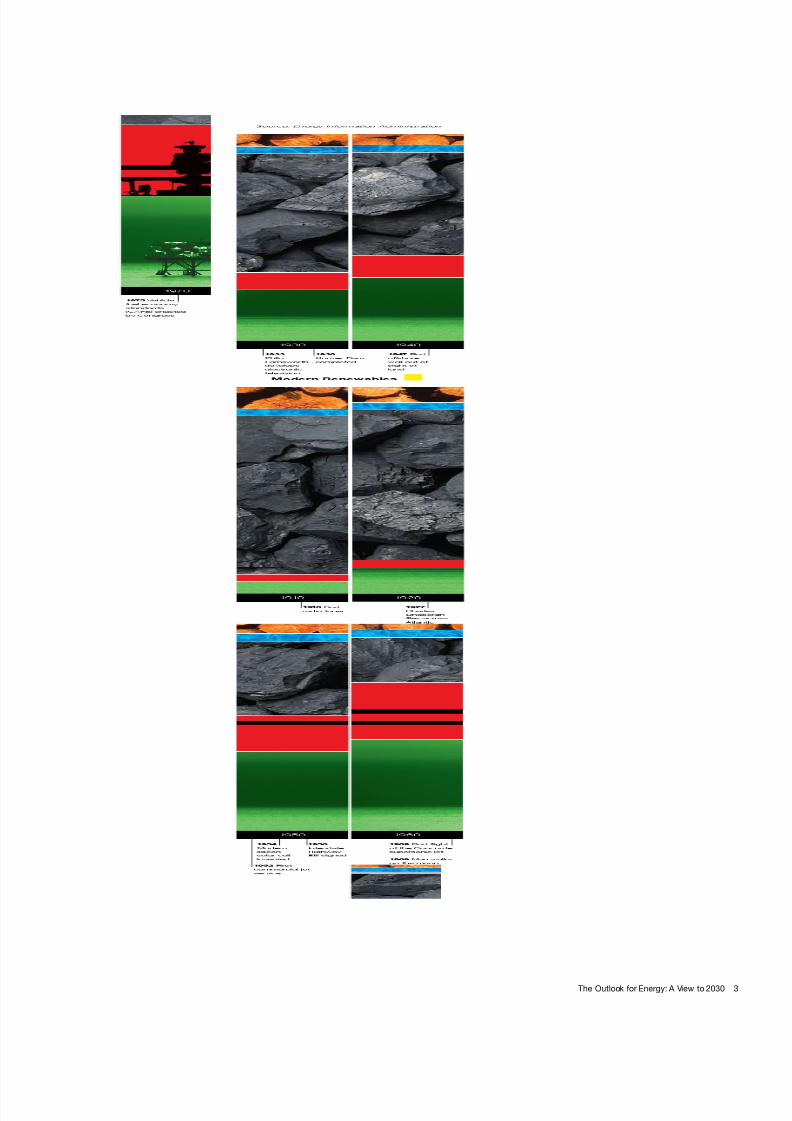
Energy sources and technology evolve
over time – and each infuences the
other. By understanding the history o
energy and technology, we can betterunderstand the uture course o the
energy challenge.
As an example, the history o energy
use in the United States over the last
150 years illustrates the way energy use
and technologies develop over time.
In the United States in 1850, wood
was the biggest energy source. But by
1900, coal had become predominant. Technology played a role in this trend, as
mining evolved and coal ed the newly
industrialized nation. America’s access to
energy enabled its growth as an industrial
economy; in turn, industrial growth and
the wealth it created expanded U.S.
energy demand. It is important to note
that it took about 40 years or coal to
achieve its substantial share.
By 1950, oil was overtaking coal, asmore Americans owned cars and rail
transport shited rom coal to diesel.
The growth o cars and trucks, as
well as the birth o the commercial
airline industry, meant a new need or
transportation uels. Improvements in
oil-exploration technologies helped keep
pace with this growing uel demand.
Also by 1950, hydroelectric power came
into use. And natural gas, considerednearly worthless a generation earlier, grew
as a uel to meet the growing heating and
industrial needs o an increasingly wealthy
nation. Coal remained signicant and
helped meet growing electricity demand.
From 1950 to 2000, we saw the
introduction and growth o nuclear energy
and the rst meaningul appearance o
modern renewable uels. Natural gas also
continued to grow and was now ueling
power generators as well.
Looking out to 2030, we see gradual
shits in energy and technology
continuing. Both the U.S. and world
energy mix continue to grow morediverse, which strengthens energy
security by reducing the risk rom
disruption to any single supply source.
We will need to expand all these
sources – and develop new ones –
to meet uture demand. New energy
technologies will open up new energy
sources, and new end-use technologies
will reshape demand patterns, just
as they have or the last 150 years. It
is important to remember, however,that these shits happen slowly, over
the course o decades. Free markets,
open trade, and stable legal, regulatory
and tax rameworks will acilitate these
positive transormations.
Change in energy use and technology
development is an evolutionary
process, but one that oten has
revolutionary impacts.
Evolution o energy and technology
8/7/2019 ExxonMobil “The Outlook for Energy A View to 2030”
http://slidepdf.com/reader/full/exxonmobil-the-outlook-for-energy-a-view-to-2030 8/42The Outlook for Energy: A View to 2030 4
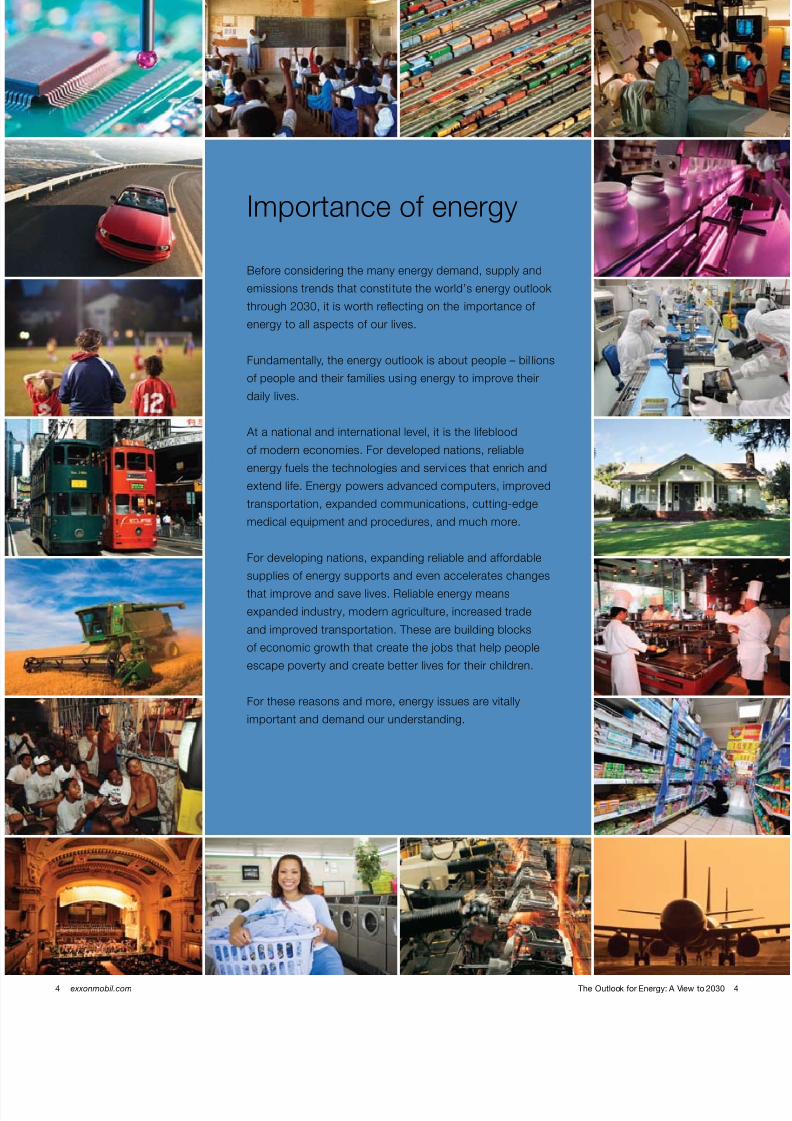
Importance o energy
Beore considering the many energy demand, supply and
emissions trends that consti tute the world’s energy outlook
through 2030, it is worth refecting on the importance o
energy to all aspects o our lives.
Fundamentally, the energy outlook is about people – bil lions
o people and their amilies using energy to improve their
daily lives.
At a national and international level, it is the lieblood
o modern economies. For developed nations, reliable
energy uels the technologies and services that enrich and
extend lie. Energy powers advanced computers, improved
transportation, expanded communications, cutting-edge
medical equipment and procedures, and much more.
For developing nations, expanding reliable and aordable
supplies o energy supports and even accelerates changes
that improve and save lives. Reliable energy means
expanded industry, modern agriculture, increased trade
and improved transportation. These are building blocks
o economic growth that create the jobs that help people
escape poverty and create better lives or their children.
For these reasons and more, energy issues are vitally
important and demand our understanding.
4 exxonmobil.com
8/7/2019 ExxonMobil “The Outlook for Energy A View to 2030”
http://slidepdf.com/reader/full/exxonmobil-the-outlook-for-energy-a-view-to-2030 9/42
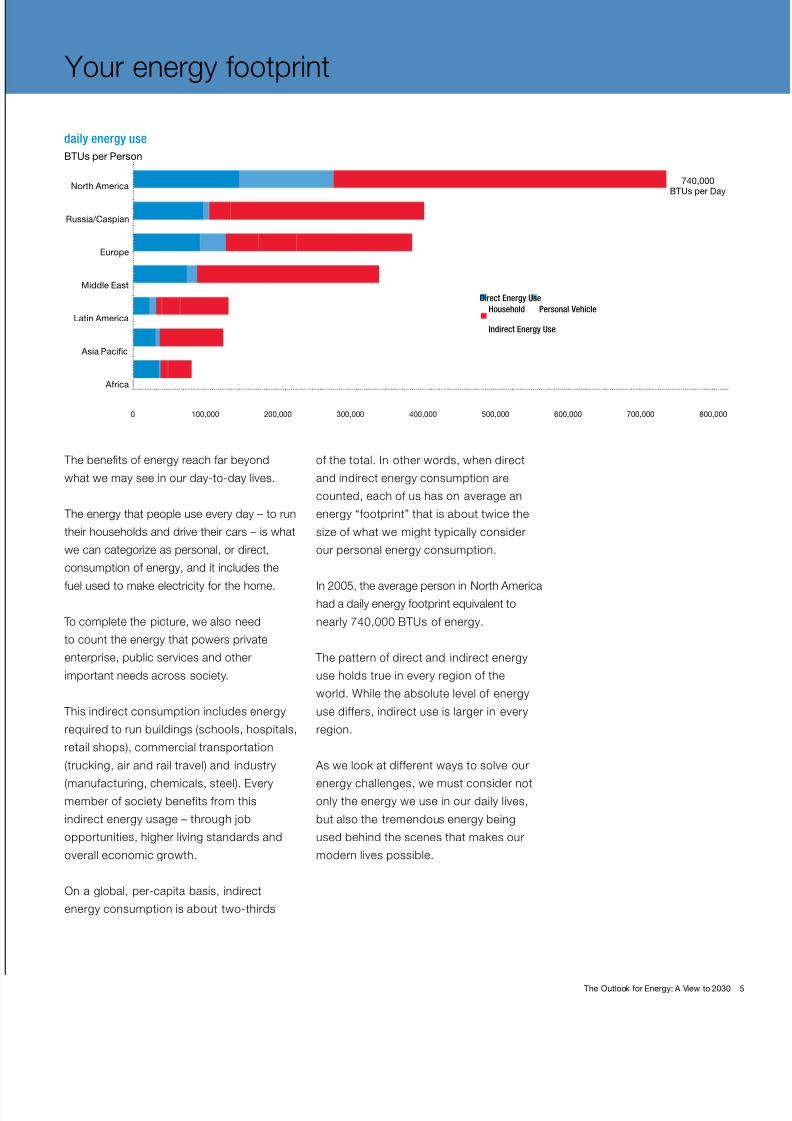
The benets o energy reach ar beyond
what we may see in our day-to-day lives.
The energy that people use every day – to run
their households and drive their cars – is what
we can categorize as personal, or direct,
consumption o energy, and it includes the
uel used to make electricity or the home.
To complete the picture, we also need
to count the energy that powers private
enterprise, public services and other
important needs across society.
This indirect consumption includes energy
required to run buildings (schools, hospitals,
retail shops), commercial transportation
(trucking, air and rail travel) and industry
(manuacturing, chemicals, steel). Everymember o society beneits rom this
indirect energy usage – through job
opportunities, higher living standards and
overall economic growth.
On a global, per-capita basis, indirect
energy consumption is about two-thirds
o the total. In other words, when direct
and indirect energy consumption are
counted, each o us has on average an
energy “ootprint” that is about twice the
size o what we might typically consider
our personal energy consumption.
In 2005, the average person in North Americahad a daily energy ootprint equivalent to
nearly 740,000 BTUs o energy.
The pattern o direct and indirect energy
use holds true in every region o the
world. While the absolute level o energy
use diers, indirect use is larger in every
region.
As we look at dierent ways to solve our
energy challenges, we must consider notonly the energy we use in our daily lives,
but also the tremendous energy being
used behind the scenes that makes our
modern lives possible.
Your energy ootprint
North America
Latin America
Europe
Middle East
Asia Pacific
Africa
Russia/Caspian
740,000
BTUs per Day
Direct Energy Use
Household
Indirect Energy Use
Personal Vehicle
daily energy use
BTUs per Person
200,000 300,000 500,000 600,000 700,000400,000 800,0000 100,000
The Outlook for Energy: A View to 2030

8/7/2019 ExxonMobil “The Outlook for Energy A View to 2030”
http://slidepdf.com/reader/full/exxonmobil-the-outlook-for-energy-a-view-to-2030 10/426 exxonmobil.com
As we survey the global energy landscape to
2030, we see several interlocking challenges.
One o the biggest jobs through 2030 will be
to reduce poverty and raise living standards
around the world. An important actor in
achieving this goal will be to continue meeting
the world’s energy needs saely, reliably andaordably, even as population and economic
growth – particularly in developing countries –
pushes global demand higher by almost 35
percent compared to 2005.
By providing reliable and aordable energy,
we will also help revitalize economies and
enable broad economic gains around the
world. Meeting this demand will not be
easy, especially considering that the world’s
energy resources are increasingly ound indicult or hard-to-reach places. And it will
require the global energy industry to operate
on a scale even larger than it does today.
At the same time, because we want to
ensure that today’s progress does not come
at the expense o uture generations, we
need to manage the risks to our climate
and environment. That includes taking
meaningul steps to curb carbon dioxide
(CO2) emissions, while at the same time
utilizing local resources to help maintain
secure supplies.
We can meet these interlockingchallenges. To do it, we will need an
integrated set o solutions that includes
expanding all economic energy sources,
improving efciency and mitigating
emissions through the use o cleaner-
burning uels such as natural gas.
These solutions must be supported
by trillions o dollars in new energy
investment, a long-term ocus and constant
technological innovation.
ExxonMobil is committed to pursuing each
o these integrated solutions.
Our key energy challenges
Globally, about 2.5 billion people rely
on traditional uels such as wood and
dung or heating and cooking.
8/7/2019 ExxonMobil “The Outlook for Energy A View to 2030”
http://slidepdf.com/reader/full/exxonmobil-the-outlook-for-energy-a-view-to-2030 11/42
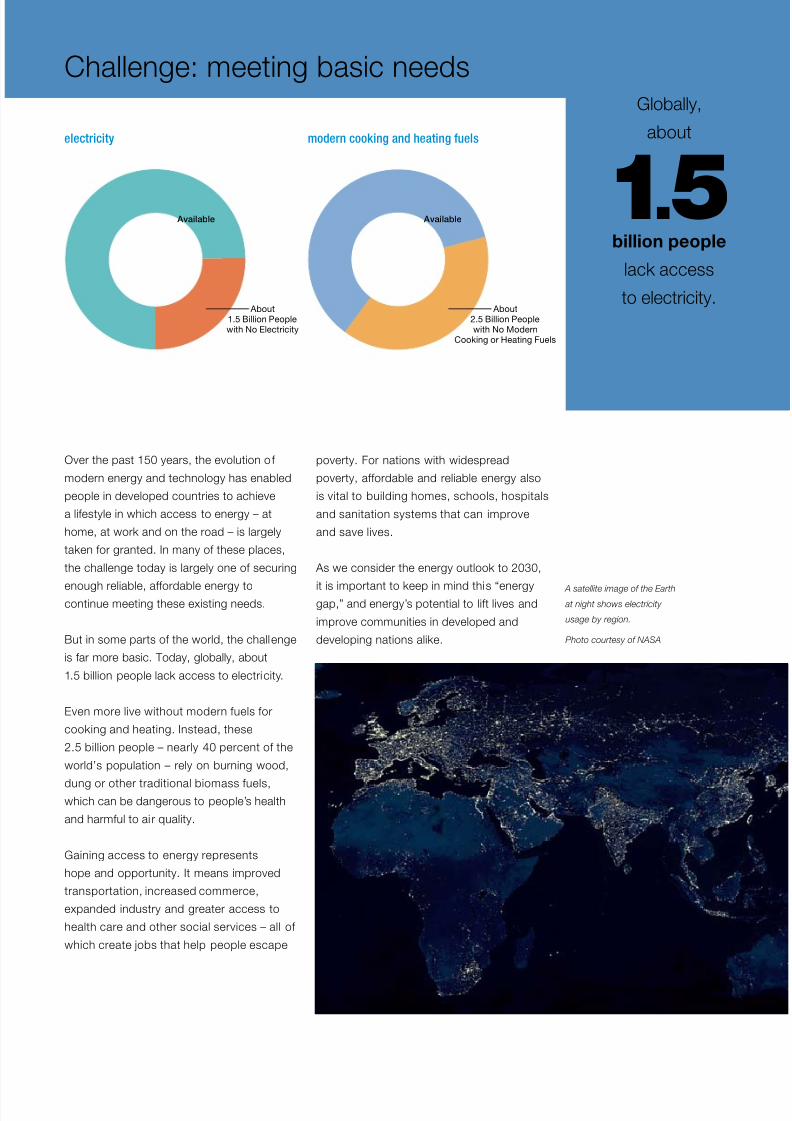
Over the past 150 years, the evolution o
modern energy and technology has enabled
people in developed countries to achieve
a liestyle in which access to energy – at
home, at work and on the road – is largely
taken or granted. In many o these places,
the challenge today is largely one o securing
enough reliable, aordable energy tocontinue meeting these existing needs.
But in some parts o the world, the challenge
is ar more basic. Today, globally, about
1.5 billion people lack access to electricity.
Even more live without modern uels or
cooking and heating. Instead, these
2.5 billion people – nearly 40 percent o the
world’s population – rely on burning wood,
dung or other traditional biomass uels,which can be dangerous to people’s health
and harmul to ai r quality.
Gaining access to energy represents
hope and opportunity. It means improved
transportation, increased commerce,
expanded industry and greater access to
health care and other social services – all o
which create jobs that help people escape
poverty. For nations with widespread
poverty, aordable and reliable energy also
is vital to building homes, schools, hospitals
and sanitation systems that can improve
and save lives.
As we consider the energy outlook to 2030,
it is important to keep in mind this “energygap,” and energy’s potential to lit lives and
improve communities in developed and
developing nations alike.
Challenge: meeting basic needsGlobally,
about
1.5billion people
lack access
to electricity.
A satellite image o the Earth
at night shows electricity
usage by region.
Photo courtesy o NASA
electricity modern cooking and heating fuels
Available Available
About1.5 Billion Peoplewith No Electricity
About2.5 Billion Peoplewith No Modern
Cooking or Heating Fuels
The Outlook for Energy: A View to 2030 7

8/7/2019 ExxonMobil “The Outlook for Energy A View to 2030”
http://slidepdf.com/reader/full/exxonmobil-the-outlook-for-energy-a-view-to-2030 12/428 exxonmobil.com
8/7/2019 ExxonMobil “The Outlook for Energy A View to 2030”
http://slidepdf.com/reader/full/exxonmobil-the-outlook-for-energy-a-view-to-2030 13/42The Outlook for Energy: A View to 2030 9
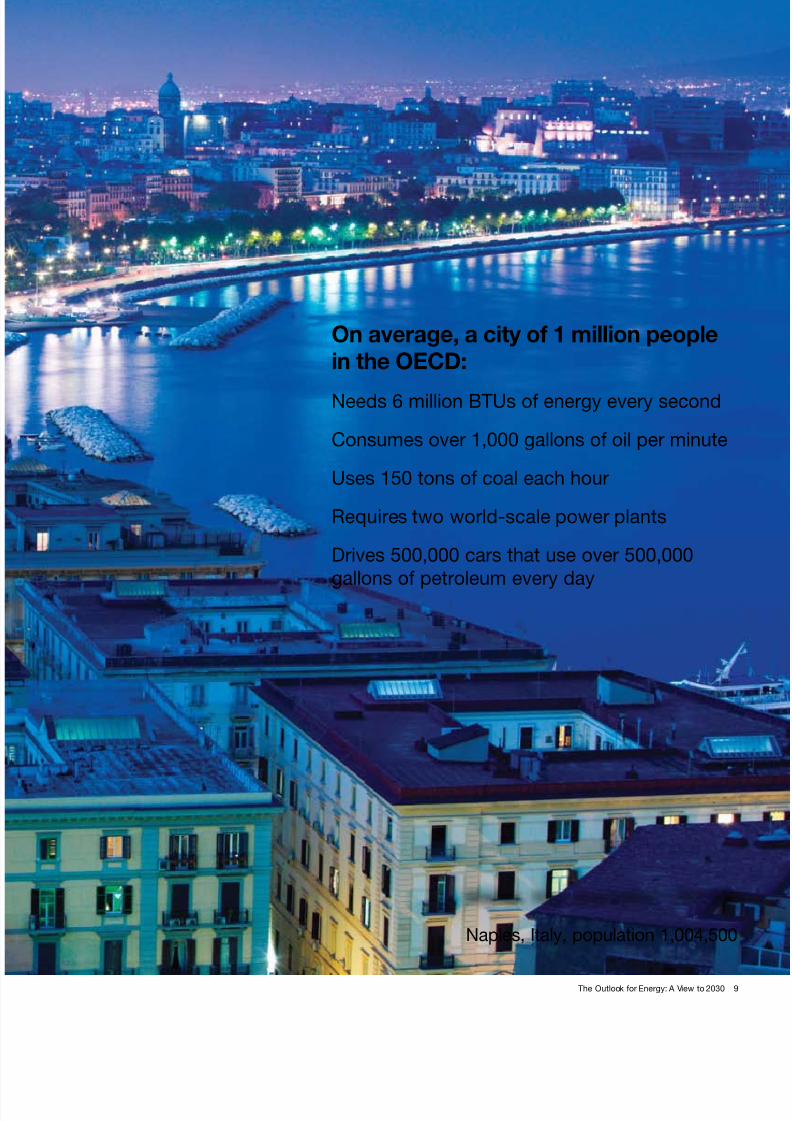
On average, a city o 1 million peoplein the OECD:
Needs 6 million BTUs of energy every second
Consumes over 1,000 gallons of oil per minute
Uses 150 tons of coal each hour
Requires two world-scale power plants
Drives 500,000 cars that use over 500,000
gallons of petroleum every day
Naples, Italy, population 1,004,500
8/7/2019 ExxonMobil “The Outlook for Energy A View to 2030”
http://slidepdf.com/reader/full/exxonmobil-the-outlook-for-energy-a-view-to-2030 14/4210 exxonmobil.com
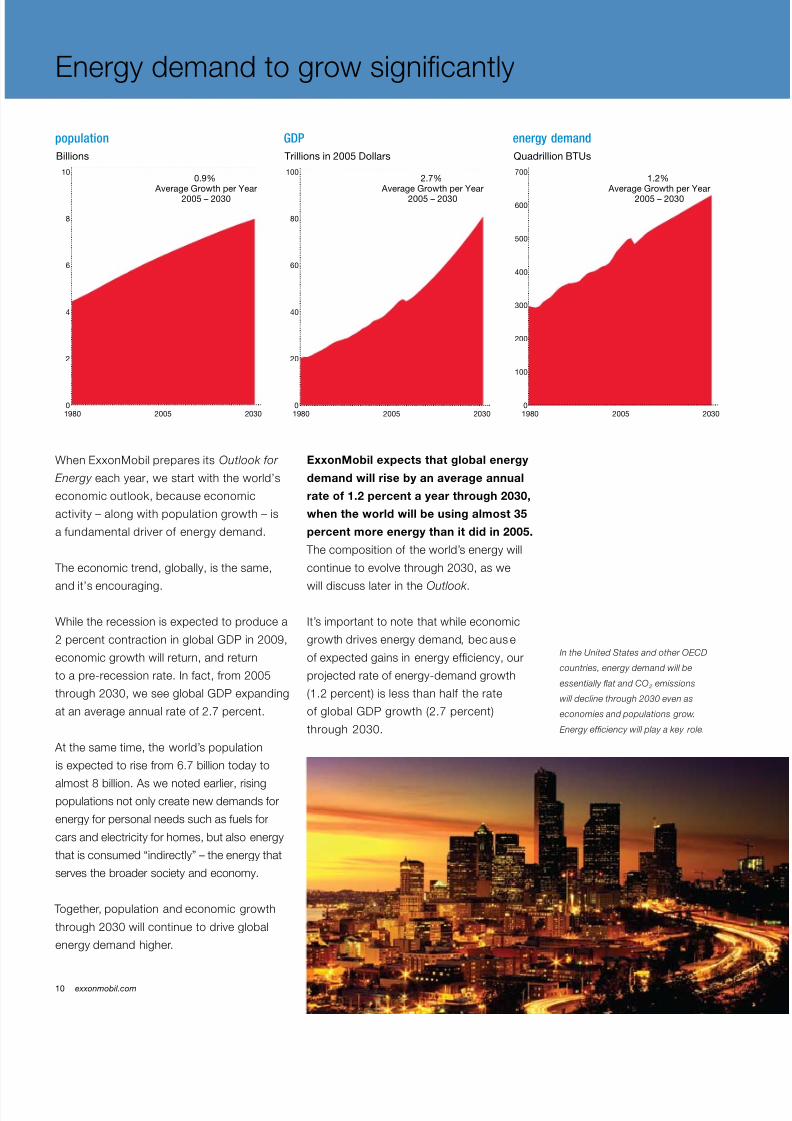
When ExxonMobil prepares its Outlook or
Energy each year, we start with the world’s
economic outlook, because economic
activity – along with population growth – is
a undamental driver o energy demand.
The economic trend, globally, is the same,
and it’s encouraging.
While the recession is expected to produce a
2percentcontractioninglobalGDPin2009,
economic growth will return, and return
to a pre-recession rate. In act, rom 2005
through2030,weseeglobalGDPexpanding
at an average annual rate o 2.7 percent.
At the same time, the world’s population
is expected to rise rom 6.7 billion today to
almost 8 billion. As we noted earlier, risingpopulations not only create new demands or
energy or personal needs such as uels or
cars and electricity or homes, but also energy
that is consumed “indirectly” – the energy that
serves the broader society and economy.
Together, population and economic growth
through 2030 will continue to drive global
energy demand higher.
ExxonMobil expects that global energy
demand will rise by an average annual
rate o 1.2 percent a year through 2030,
when the world will be using almost 35
percent more energy than it did in 2005.
The composition o the world’s energy will
continue to evolve through 2030, as we
will discuss later in the Outlook .
It’s important to note that while economic
growth drives energy demand, bec aus e
o expected gains in energy eciency, our
projected rate o energy-demand growth
(1.2 percent) is less than hal the rate
ofglobalGDPgrowth(2.7percent)
through 2030.
Energy demand to grow signicantly
In the United States and other OECD
countries, energy demand will be
essentially at and CO 2 emissions
will decline through 2030 even as
economies and populations grow.
Energy efciency will play a key role.
1980 20302005
0.9% Average Growth per Year
2005 – 2030
1980 20302005
2.7% Average Growth per Year
2005 – 2030
1980 20302005
1.2% Average Growth per Year
2005 – 2030
Quadrillion BTUs
700
600
500
400
300
200
100
0
energy demand
Trillions in 2005 Dollars
100
80
60
40
20
0
GDP
Billions
10
8
6
4
2
0
population
8/7/2019 ExxonMobil “The Outlook for Energy A View to 2030”
http://slidepdf.com/reader/full/exxonmobil-the-outlook-for-energy-a-view-to-2030 15/42The Outlook for Energy: A View to 2030 11
Economic growth drives energy demand
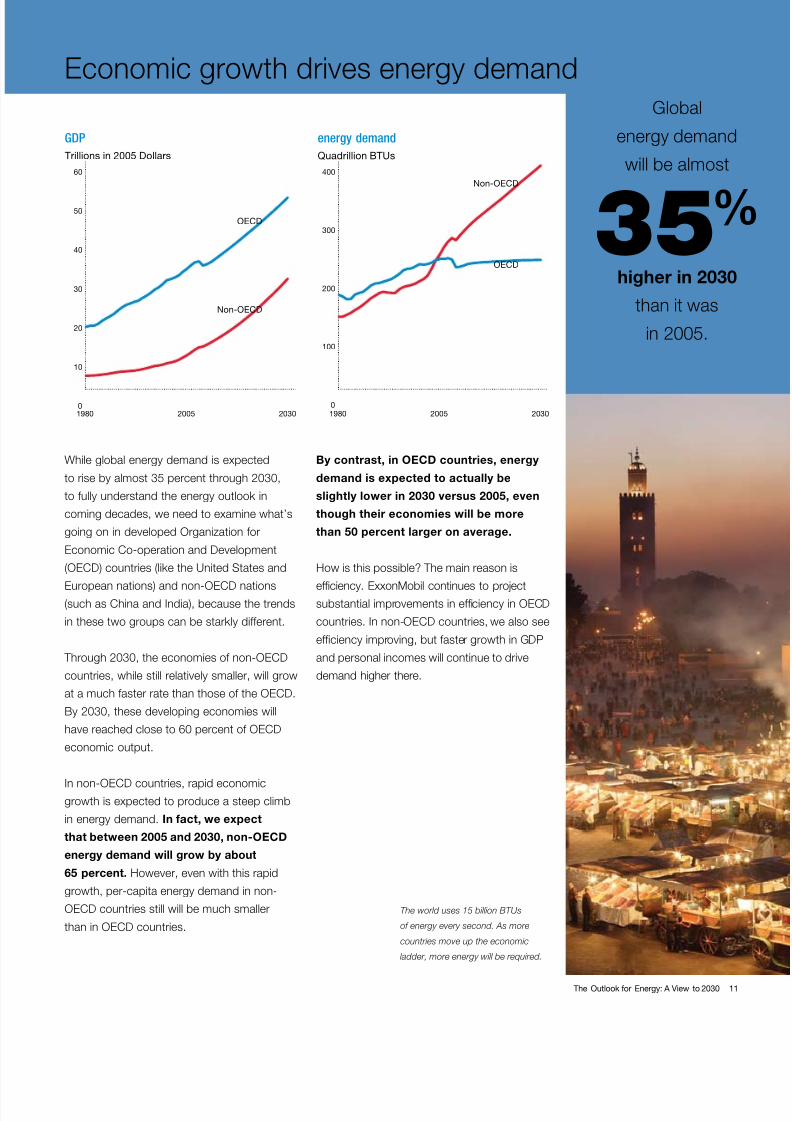
The world uses 15 billion BTUs
o energy every second. As more
countries move up the economic
ladder, more energy will be required.
GDP
1980 20302005
Trillions in 2005 Dollars
OECD
OECD
Non-OECD
Non-OECD
60
50
40
30
20
10
0
energy demand
1980 20302005
Quadrillion BTUs
400
300
200
100
0
Global
energy demand
will be almost
35%higher in 2030
than it was
in 2005.
While global energy demand is expected
to rise by almost 35 percent through 2030,
to ully understand the energy outlook in
coming decades, we need to examine what’s
going on in developed Organization or
EconomicCo-operationandDevelopment
(OECD)countries(liketheUnitedStatesand
Europeannations)andnon-OECDnations(such as China and India), because the trends
in these two groups can be starkly dierent.
Through2030,theeconomiesofnon-OECD
countries, while still relatively smaller, will grow
atamuchfasterratethanthoseoftheOECD.
By 2030, these developing economies will
havereachedcloseto60percentofOECD
economic output.
Innon-OECDcountries,rapideconomicgrowth is expected to produce a steep climb
in energy demand. In act, we expect
that between 2005 and 2030, non-OECD
energy demand will grow by about
65 percent. However, even with this rapid
growth, per-capita energy demand in non-
OECDcountriesstillwillbemuchsmaller
thaninOECDcountries.
By contrast, in OECD countries, energy
demand is expected to actually be
slightly lower in 2030 versus 2005, even
though their economies will be more
than 50 percent larger on average.
How is this possible? The main reason is
eciency. ExxonMobil continues to projectsubstantialimprovementsinefciencyinOECD
countries.Innon-OECDcountries,wealsosee
efciencyimproving,butfastergrowthinGDP
and personal incomes will continue to drive
demand higher there.
8/7/2019 ExxonMobil “The Outlook for Energy A View to 2030”
http://slidepdf.com/reader/full/exxonmobil-the-outlook-for-energy-a-view-to-2030 16/4212 exxonmobil.com
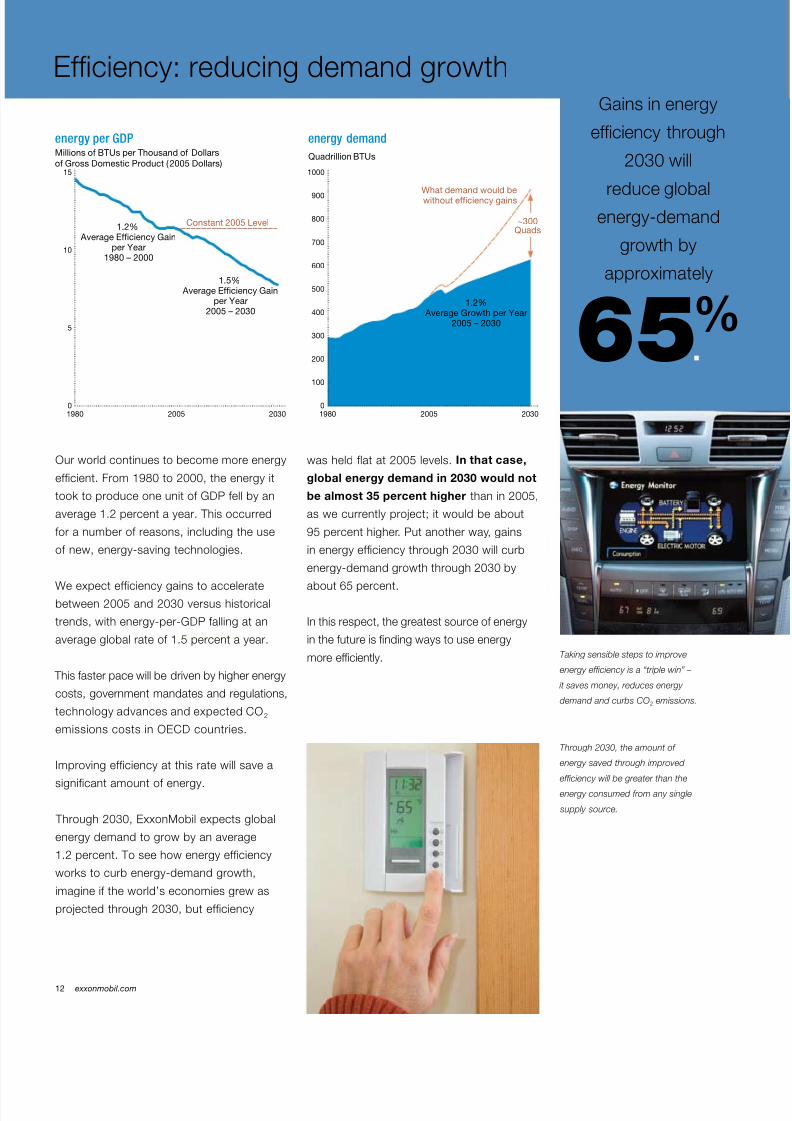
Our world continues to become more energy
eicient. From 1980 to 2000, the energy it
tooktoproduceoneunitofGDPfellbyan
average 1.2 percent a year. This occurred
or a number o reasons, including the use
o new, energy-saving technologies.
We expect eiciency gains to acceleratebetween 2005 and 2030 versus historical
trends,withenergy-per-GDPfallingatan
average global rate o 1.5 percent a year.
This aster pace will be driven by higher energy
costs, government mandates and regulations,
technology advances and expected CO2
emissionscostsinOECDcountries.
Improving eiciency at this rate will save a
signiicant amount o energy.
Through 2030, ExxonMobil expects global
energy demand to grow by an average
1.2 percent. To see how energy eiciency
works to curb energy-demand growth,
imagine i the world’s economies grew as
projected through 2030, but eiciency
was held lat at 2005 levels. In that case,
global energy demand in 2030 would not
be almost 35 percent higher than in 2005,
as we currently project; it would be about
95percenthigher.Putanotherway,gains
in energy eciency through 2030 will curb
energy-demand growth through 2030 by
about 65 percent.
In this respect, the greatest source o energy
in the uture is nding ways to use energy
more eciently.
Eciency: reducing demand growth
energy per GDP
energy demand
1980 2030
Millions of BTUs per Thousand of Dollars
of Gross Domestic Product (2005 Dollars)Quadrillion BTUs
1.2% Average Growth per Year
2005 – 2030
1.2% Average Efficiency Gain
per Year1980 – 2000
1.5% Average Efficiency Gain
per Year2005 – 2030
15
10
5
01980 2030
1000
600
500
400
300
800
700
900
200
100
02005
What demand would bewithout efficiency gains
Constant 2005 Level
2005
~300Quads
Through 2030, the amount o
energy saved through improved
efciency will be greater than the
energy consumed rom any single
supply source.
Taking sensible steps to improve
energy efciency is a “triple win” –
it saves money, reduces energy
demand and curbs CO 2 emissions.
Gains in energy
eciency through
2030 will
reduce globalenergy-demand
growth by
approximately
65%

8/7/2019 ExxonMobil “The Outlook for Energy A View to 2030”
http://slidepdf.com/reader/full/exxonmobil-the-outlook-for-energy-a-view-to-2030 17/42The Outlook for Energy: A View to 2030 13
Broken down by the our main end-use
sectors, the biggest demand or energy
comes rom electric power generation – a
act that might surprise some people, who
may think that transportation is the largest.
Transportation is, in act, in thi rd place
behind industrial demand, which represents
the energy used or manuacturing,steelmaking and other industrial purposes.
Residential/commercial demand is the
smallest sector.
Powergenerationisnotonlythelargest
energy-demand sector, but also the
astest-growing. Through 2030, this sector
represents 55 percent o the total growth
in energy demand.
The story behind the remarkable increasein demand or energy or power generation
is not just the high-tech demands o
the developed world, but also the more
basic needs and economic growth o the
developingworld.Non-OECDelectricity
demand more than doubles through 2030
and accounts or 80 percent o total growth
in electricity demand through 2030.
Anyone asking how the world will meet
its energy and environmental goals must
consider electric power generation; by
2030, this sector alone will account orabout 40 percent o total primary energy
demand, and its largest energy source
will continue to be coal, the uel with the
highest carbon intensity.
In each sector, demand would be growing
much aster without improvements in
eciency. Eciency improvements in each
sector will add up to signicant energy
savings each year – reaching 300 quadrillion
BTUs in 2030.
Growing global demand
2005 2030
Transportation
2005 2030
PowerGeneration
2005 2030
Residential/ Commercial
2005 2030
Industrial
2030 Energy Savings
Quadrillion BTUs
energy demand in each sector will increase . . . . . . but increasing efficiencieswill help mitigate growth
300
200
100
0
Transportation
Power
Generation
Residential/
Commercial
Industrial
Rising living standards in non-OECD
countries will create new demands
or energy through 2030.
By 2030,
power generation
will account or
40%o all energy
demand.
8/7/2019 ExxonMobil “The Outlook for Energy A View to 2030”
http://slidepdf.com/reader/full/exxonmobil-the-outlook-for-energy-a-view-to-2030 18/4214 exxonmobil.com
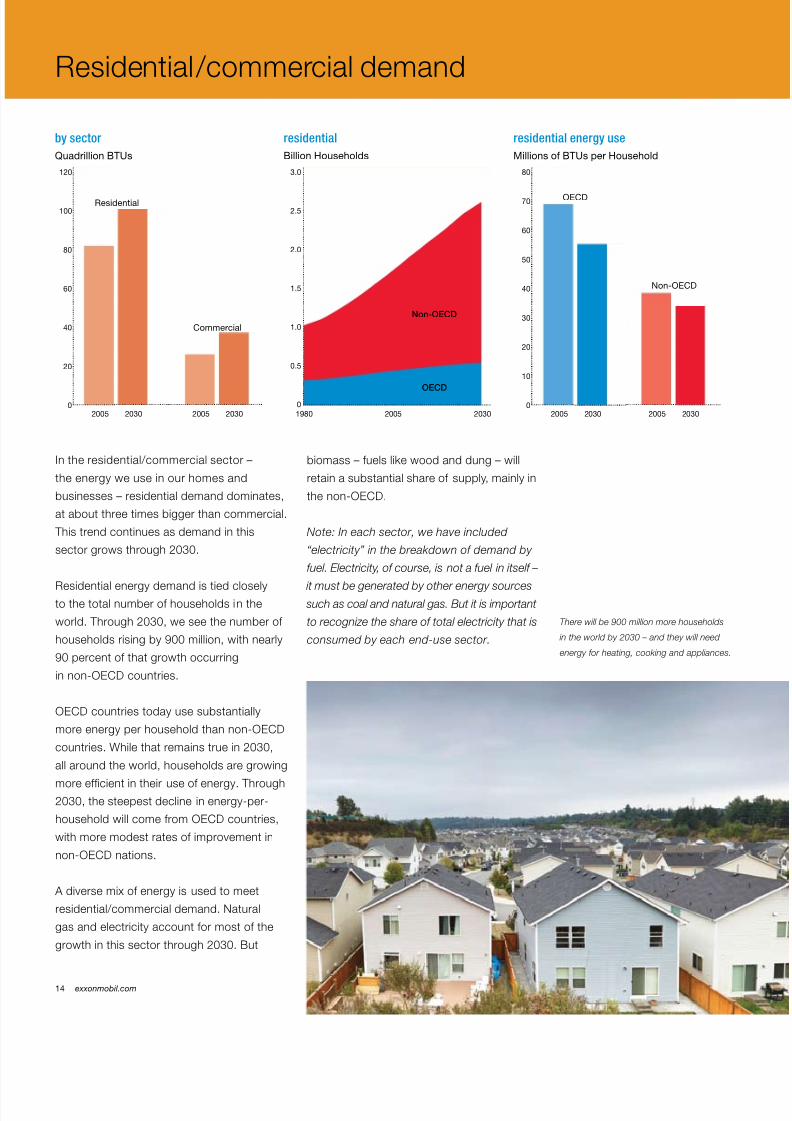
In the residential/commercial sector –
the energy we use in our homes and
businesses – residential demand dominates,
at about three times bigger than commercial.
This trend continues as demand in this
sector grows through 2030.
Residential energy demand is tied closelyto the total number o households in the
world. Through 2030, we see the number o
households rising by 900 million, with nearly
90 percent o that growth occurring
innon-OECDcountries.
OECDcountriestodayusesubstantially
moreenergyperhouseholdthannon-OECD
countries. While that remains true in 2030,
all around the world, households are growing
more ecient in their use o energy. Through2030, the steepest decline in energy-per-
householdwillcomefromOECDcountries,
with more modest rates o improvement in
non-OECDnations.
A diverse mix o energy is used to meet
residential/commercial demand. Natural
gas and electricity account or most o the
growth in this sector through 2030. But
biomass – uels like wood and dung – will
retain a substantial share o supply, mainly in
thenon-OECD.
Note: In each sector, we have included
“electricity” in the breakdown o demand by
uel. Electricity, o course, is not a uel in itsel –
it must be generated by other energy sources such as coal and natural gas. But it is important
to recognize the share o total electricity that is
consumed by each end-use sector.
Residential/commercial demand
2005 2030 2005 20302005 2030 2005 2030
by sector
Residential
Non-OECD
OECD
Commercial
Quadrillion BTUs
120
100
80
60
40
20
0
residential
1980 20302005
Billion Households
3.0
2.5
0
2.0
1.5
0.5
1.0
residential energy use
Non-OECD
OECD
Millions of BTUs per Household
80
70
60
50
40
30
20
10
0
There will be 900 million more households
in the world by 2030 – and they will need
energy or heating, cooking and appliances.
8/7/2019 ExxonMobil “The Outlook for Energy A View to 2030”
http://slidepdf.com/reader/full/exxonmobil-the-outlook-for-energy-a-view-to-2030 19/42The Outlook for Energy: A View to 2030 15
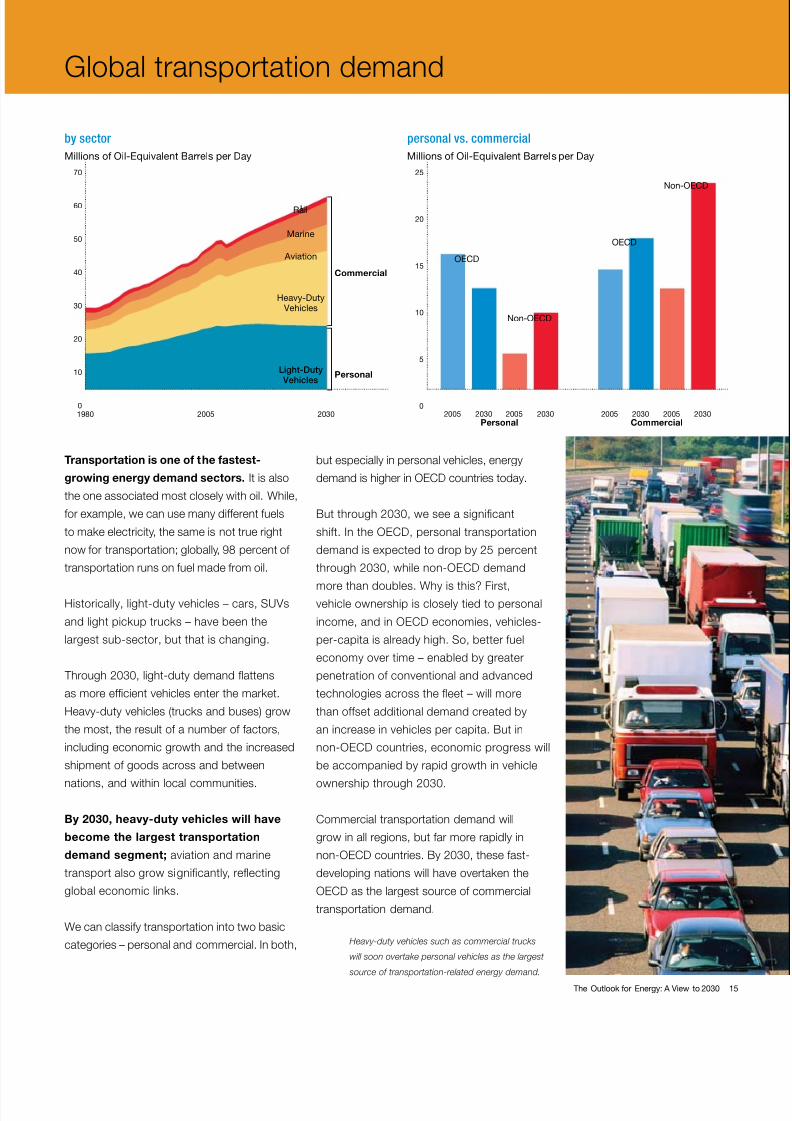
Transportation is one o the astest-
growing energy demand sectors. It is also
the one associated most closely with oil. While,
or example, we can use many dierent uels
to make electricity, the same is not true right
now or transportation; globally, 98 percent o
transportation runs on uel made rom oil.
Historically, light-duty vehicles – cars, SUVs
and light pickup trucks – have been the
largest sub-sector, but that is changing.
Through 2030, light-duty demand fattens
as more ecient vehicles enter the market.
Heavy-duty vehicles (trucks and buses) grow
the most, the result o a number o actors,
including economic growth and the increased
shipment o goods across and between
nations, and within local communities.
By 2030, heavy-duty vehicles will have
become the largest transportation
demand segment; aviation and marine
transport also grow signicantly, refecting
global economic links.
We can classiy transportation into two basic
categories – personal and commercial. In both,
but especially in personal vehicles, energy
demandishigherinOECDcountriestoday.
But through 2030, we see a signicant
shift.IntheOECD,personaltransportation
demand is expected to drop by 25 percent
through2030,whilenon-OECDdemand
more than doubles. Why is this? First,vehicle ownership is closely tied to personal
income,andinOECDeconomies,vehicles-
per-capita is already high. So, better uel
economy over time – enabled by greater
penetration o conventional and advanced
technologies across the feet – will more
than oset additional demand created by
an increase in vehicles per capita. But in
non-OECDcountries,economicprogresswill
be accompanied by rapid growth in vehicle
ownership through 2030.
Commercial transportation demand will
grow in all regions, but ar more rapidly in
non-OECDcountries.By2030,thesefast-
developing nations will have overtaken the
OECDasthelargestsourceofcommercial
transportation demand.
Global transportation demand
2005 20052030 2030 2005 2030 2005 2030Personal Commercial
PersonalLight-Duty Vehicles
Heavy-Duty Vehicles
Aviation
Marine
Rail
Commercial
OECD
Non-OECD
OECD
Non-OECD
by sector
personal vs. commercial
1980 2030
Millions of Oil-Equivalent Barrels per Day Millions of Oil-Equivalent Barrels per Day
70
60
50
40
30
20
10
0
25
20
15
10
5
02005
Heavy-duty vehicles such as commercial trucks
will soon overtake personal vehicles as the largest
source o transportation-related energy demand.
8/7/2019 ExxonMobil “The Outlook for Energy A View to 2030”
http://slidepdf.com/reader/full/exxonmobil-the-outlook-for-energy-a-view-to-2030 20/4216 exxonmobil.com
ExxonMobil believes that biouels rom photosynthetic
algae could someday play an important role in meeting the
world’s growing need or transportation uels, while also
reducing CO2 emissions.
In July 2009, we announced a signicant new project to research
and develop algae biouels. Our partner is Synthetic Genomics
Inc (SGI), a Caliornia-based biotech rm ounded by genome
researchpioneerDr.J.CraigVenter.Thegoaloftheprogram:to
produce a commercially scalable, renewable algae-based
uel compatible with today’s gasoline, diesel and jet uel.
• Why algae? Scientists already know that certain algae
naturally produce oils similar to the petroleum products we
use today. I commercial quantities o these algae-based oils
could be developed, they could avoid the need to build the
extensive new delivery inrastructure that some other alternative
transportation uels might require.
• Algae-based biouels have potential environmental
advantages. Through photosynthesis, algae absorb CO2 –
the main greenhouse gas – and convert it to useul products,
like oils and oxygen. As a result, uels made rom algae could
reduce greenhouse gas emissions.
• Algae-based biouels likely would not impact the global
ood supply. While biouels made rom plants l ike corn and
sugar cane are an expanding energy source, they require
ertile land and resh water; algae can be grown using land
and water unsuitable or plant or ood production. Algae also
could yield between three and eight times more biouel per
acre compared to other biouel sources.
Getting these algae uels rom the lab to broad, commercial
scale at the local gas station will be a tremendous
undertaking – and could require decades o work.
It is an exciting project that brings together SGI’s expertise in
genomics, synthetic biology, microbiology and biochemistry;
and ExxonMobil’s expertise in transportation uels and the
development o technologies and systems needed to increase
scale rom concept phase to large-scale manuacturing.
ExxonMobil expects to spend more than $600 million on
this project i research and development milestones are met.
ExxonMobil’s investment in algae-based uels is just one part
o our commitment to the breakthrough technologies and
integrated solutions that will be needed to address rising
demand or transportation uels and other long-term challenges
illustrated in our Outlook or Energy .
A single-cell
oil well?
8/7/2019 ExxonMobil “The Outlook for Energy A View to 2030”
http://slidepdf.com/reader/full/exxonmobil-the-outlook-for-energy-a-view-to-2030 21/42The Outlook for Energy: A View to 2030 17
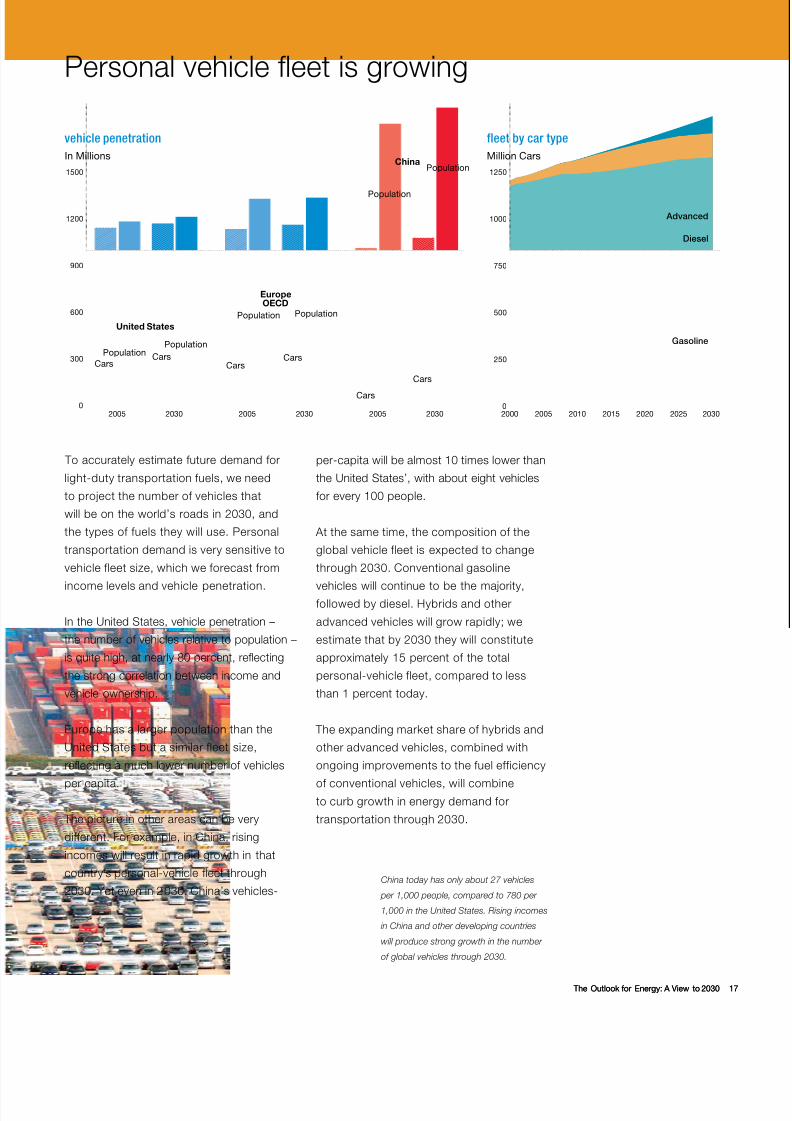
To accurately estimate uture demand or
light-duty transportation uels, we need
to project the number o vehicles that
will be on the world’s roads in 2030, and
thetypesoffuelstheywilluse.Personal
transportation demand is very sensitive to
vehicle leet size, which we orecast rom
income levels and vehicle penetration.
In the United States, vehicle penetration –
the number o vehicles relative to population –
is quite high, at nearly 80 percent, refecting
the strong correlation between income and
vehicle ownership.
Europe has a larger population than the
United States but a similar leet size,
refecting a much lower number o vehicles
per capita.
The picture in other areas can be very
dierent. For example, in China, rising
incomes will result in rapid growth in that
country’s personal-vehicle feet through
2030. Yet even in 2030, China’s vehicles-
per-capita will be almost 10 times lower than
the United States’, with about eight vehicles
or every 100 people.
At the same time, the composition o the
global vehicle leet is expected to change
through 2030. Conventional gasoline
vehicles will continue to be the majority,ollowed by diesel. Hybrids and other
advanced vehicles will grow rapidly; we
estimate that by 2030 they will constitute
approximately 15 percent o the total
personal-vehicle leet, compared to less
than 1 percent today.
The expanding market share o hybrids and
other advanced vehicles, combined with
ongoing improvements to the uel eiciency
o conventional vehicles, will combineto curb growth in energy demand or
transportation through 2030.
Personalvehicleeetisgrowing
2005 2030
United States
CarsCars
PopulationPopulation
2005 2030
CarsCars
Population Population
EuropeOECD
2005 2030
Cars
Cars
Population
vehicle penetration
In Millions
1500
1200
900
600
300
0
fleet by car type
Million Cars
Gasoline
Diesel
Advanced
1250
1000
750
500
250
02000 20302015 2020 20252005 2010
PopulationChina
China today has only about 27 vehicles
per 1,000 people, compared to 780 per
1,000 in the United States. Rising incomes
in China and other developing countries
will produce strong growth in the number
o global vehicles through 2030.
The Outlook for Energy: A View to 2030 17
8/7/2019 ExxonMobil “The Outlook for Energy A View to 2030”
http://slidepdf.com/reader/full/exxonmobil-the-outlook-for-energy-a-view-to-2030 22/4218 exxonmobil.com
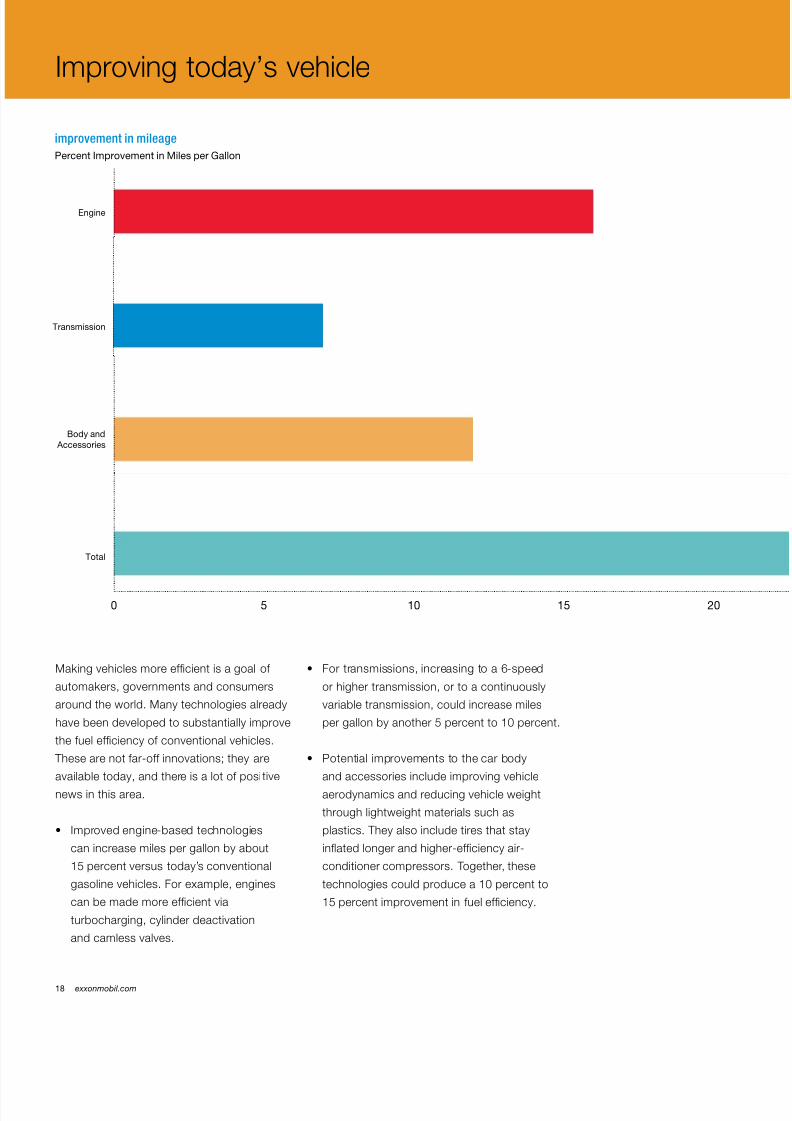
Making vehicles more ecient is a goal o
automakers, governments and consumers
around the world. Many technologies already
have been developed to substantially improve
the uel eciency o conventional vehicles.
These are not ar-o innovations; they are
available today, and there is a lot o posi tive
news in this area.
• Improvedengine-basedtechnologies
can increase miles per gallon by about
15 percent versus today’s conventional
gasoline vehicles. For example, engines
can be made more ecient via
turbocharging, cylinder deactivation
and camless valves.
• Fortransmissions,increasingtoa6-speed
or higher transmission, or to a continuously
variable transmission, could increase miles
per gallon by another 5 percent to 10 percent.
• Potentialimprovementstothecarbody
and accessories include improving vehicle
aerodynamics and reducing vehicle weight
through lightweight materials such as
plastics. They also include tires that stay
infated longer and higher-eciency air-
conditioner compressors. Together, these
technologies could produce a 10 percent to
15 percent improvement in uel eciency.
Improving today’s vehicle
0 10 20155
improvement in mileage
Engine
Transmission
Body and
Accessories
Total
Percent Improvement in Miles per Gallon

8/7/2019 ExxonMobil “The Outlook for Energy A View to 2030”
http://slidepdf.com/reader/full/exxonmobil-the-outlook-for-energy-a-view-to-2030 23/42The Outlook for Energy: A View to 2030 19
When we combine all these improvements
to conventional vehicles, we see an overall
potential increase in miles per gallon o
about 35 percent.
While these technologies are available today,
some have not yet been widely utilized
because o cost or other issues. We expect,
however, that this wil l change as automakers
seek to ramp up feet eciencies to meet
mandates.
Our view is that compared to hybrids, plug-
in hybrids or electric vehicles, improvements
to conventional vehicles will likely be a more
cost-eective approach or improving light-
duty vehicle eciency through 2030. It’s a
matter o aordability and scale – making
incremental and economical improvements
to the millions o conventional cars that
make up the vast majority o new-car sales
is expected to have a greater overall impact
than revolutionary and costly changes in
new cars with technologies that as o yet
have not proven capable o signicantly
penetrating the market.
3025 35
Aerodynamics
Turbocharging
LightweightMaterials
CylinderDeactivation
Camless Valves
Air ConditioningEfficiency
6 Speedand
7 Speed
Continuously Variable
Transmission
Improved Tires
8/7/2019 ExxonMobil “The Outlook for Energy A View to 2030”
http://slidepdf.com/reader/full/exxonmobil-the-outlook-for-energy-a-view-to-2030 24/4220 exxonmobil.com
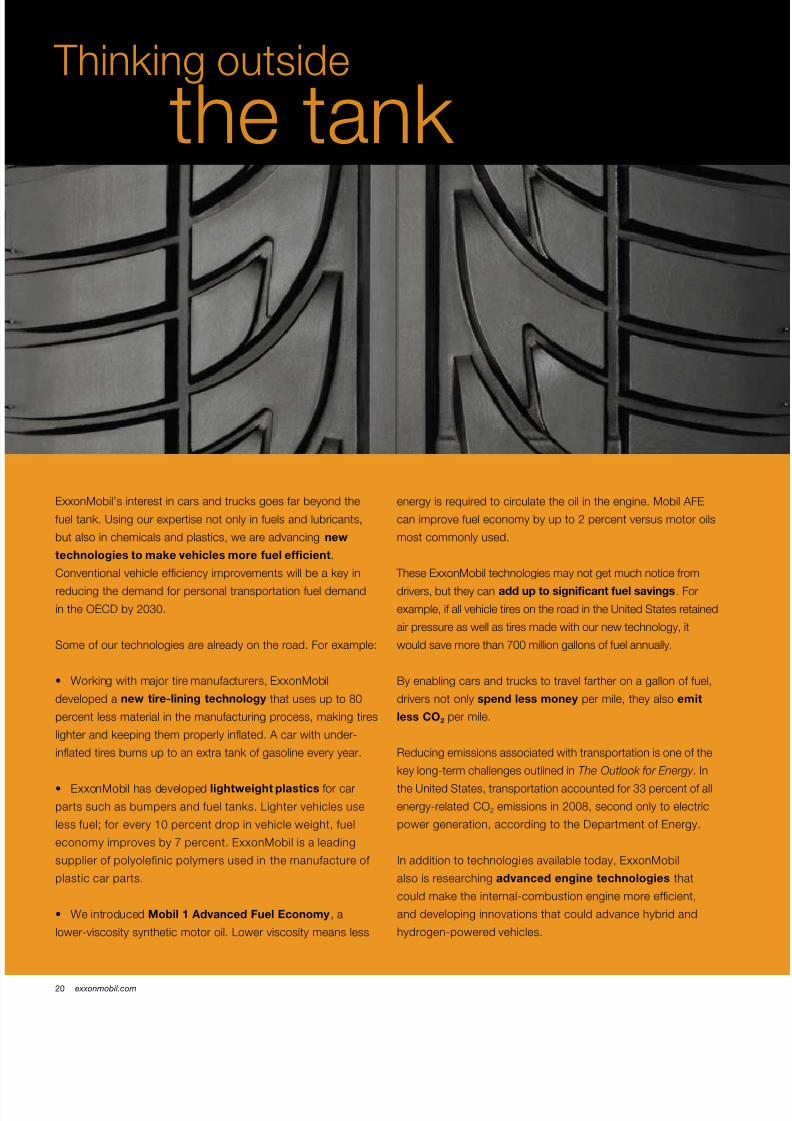
ExxonMobil’s interest in cars and trucks goes ar beyond the
uel tank. Using our expertise not only in uels and lubricants,
but also in chemicals and plastics, we are advancing new
technologies to make vehicles more uel efcient.
Conventional vehicle eciency improvements will be a key in
reducing the demand or personal transportation uel demand
intheOECDby2030.
Some o our technologies are already on the road. For example:
• Workingwithmajortiremanufacturers,ExxonMobil
developed a new tire-lining technology that uses up to 80
percent less material in the manuacturing process, making tires
lighter and keeping them properly infated. A car with under-
infated tires burns up to an extra tank o gasoline every year.
• ExxonMobilhasdevelopedlightweight plastics or car
parts such as bumpers and uel tanks. Lighter vehicles use
less uel; or every 10 percent drop in vehicle weight, uel
economy improves by 7 percent. ExxonMobil is a leading
supplier o polyoleinic polymers used in the manuacture o
plastic car parts.
• WeintroducedMobil 1 Advanced Fuel Economy, a
lower-viscosity synthetic motor oil. Lower viscosity means less
energy is required to circulate the oil in the engine. Mobil AFE
can improve uel economy by up to 2 percent versus motor oils
most commonly used.
These ExxonMobil technologies may not get much notice rom
drivers, but they can add up to signifcant uel savings. For
example, i all vehicle tires on the road in the United States retained
air pressure as well as tires made with our new technology, it
would save more than 700 million gallons o uel annually.
By enabling cars and trucks to travel arther on a gallon o uel,
drivers not only spend less money per mile, they also emit
less CO2 per mile.
Reducing emissions associated with transportation is one o the
key long-term challenges outlined in The Outlook or Energy . In
the United States, transportation accounted or 33 percent o all
energy-related CO2 emissions in 2008, second only to electric
powergeneration,accordingtotheDepartmentofEnergy.
In addition to technologies available today, ExxonMobil
also is researching advanced engine technologies that
could make the internal-combustion engine more ecient,
and developing innovations that could advance hybrid and
hydrogen-powered vehicles.
Thinking outside
the tank
8/7/2019 ExxonMobil “The Outlook for Energy A View to 2030”
http://slidepdf.com/reader/full/exxonmobil-the-outlook-for-energy-a-view-to-2030 25/42The Outlook for Energy: A View to 2030 21
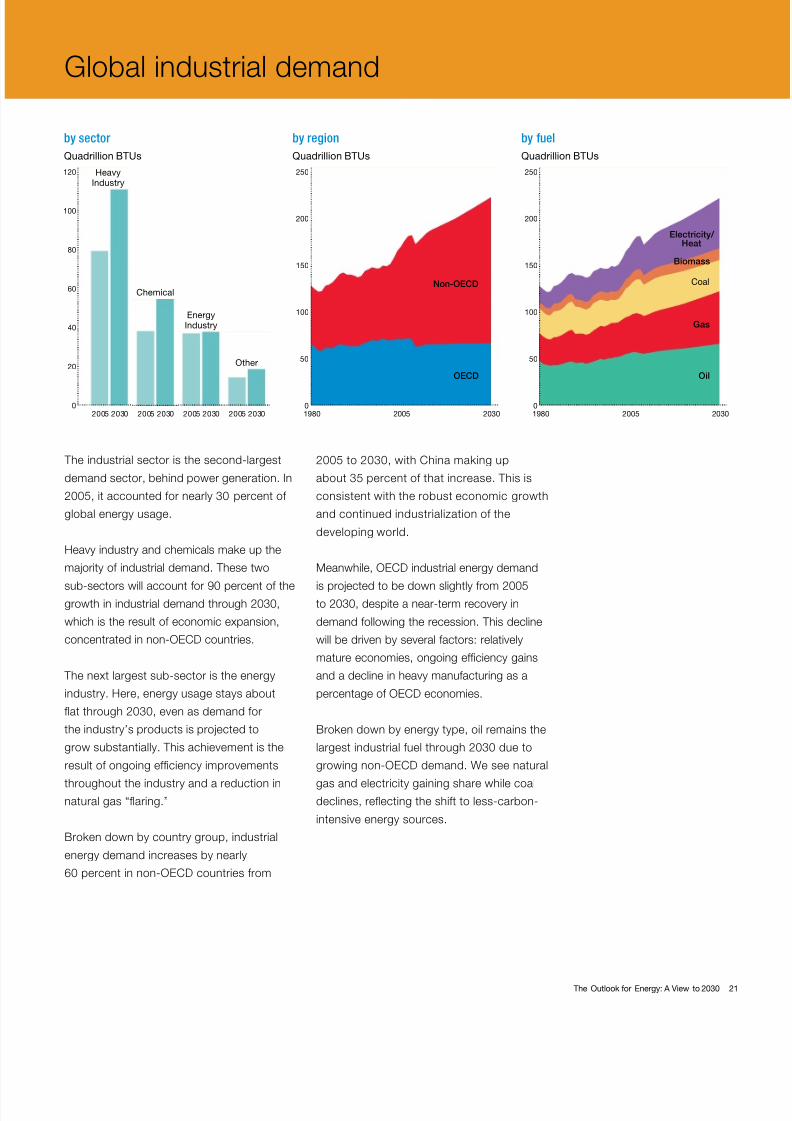
The industrial sector is the second-largest
demand sector, behind power generation. In
2005, it accounted or nearly 30 percent o
global energy usage.
Heavy industry and chemicals make up the
majority o industrial demand. These two
sub-sectors will account or 90 percent o thegrowth in industrial demand through 2030,
which is the result o economic expansion,
concentratedinnon-OECDcountries.
The next largest sub-sector is the energy
industry. Here, energy usage stays about
fat through 2030, even as demand or
the industry’s products is projected to
grow substantially. This achievement is the
result o ongoing eciency improvements
throughout the industry and a reduction innatural gas “faring.”
Broken down by country group, industrial
energy demand increases by nearly
60percentinnon-OECDcountriesfrom
2005 to 2030, with China making up
about 35 percent o that increase. This is
consistent with the robust economic growth
and continued industrialization o the
developing world.
Meanwhile,OECDindustrialenergydemand
is projected to be down slightly rom 2005to 2030, despite a near-term recovery in
demand ollowing the recession. This decline
will be driven by several actors: relatively
mature economies, ongoing eciency gains
and a decline in heavy manuacturing as a
percentageofOECDeconomies.
Broken down by energy type, oil remains the
largest industrial uel through 2030 due to
growingnon-OECDdemand.Weseenatural
gas and electricity gaining share while coaldeclines, refecting the shit to less-carbon-
intensive energy sources.
Global industrial demand
2005 2030
HeavyIndustry
2005 2030
Chemical
2005 2030
EnergyIndustry
2005 2030
Other
by sector
Quadrillion BTUs
120
100
80
60
40
20
0
Oil
Gas
Coal
Biomass
Electricity/ Heat
by fuel
Quadrillion BTUs
250
200
150
100
50
01980 20302005
OECD
Non-OECD
by region
Quadrillion BTUs
250
200
150
100
50
01980 20302005
8/7/2019 ExxonMobil “The Outlook for Energy A View to 2030”
http://slidepdf.com/reader/full/exxonmobil-the-outlook-for-energy-a-view-to-2030 26/4222 exxonmobil.com
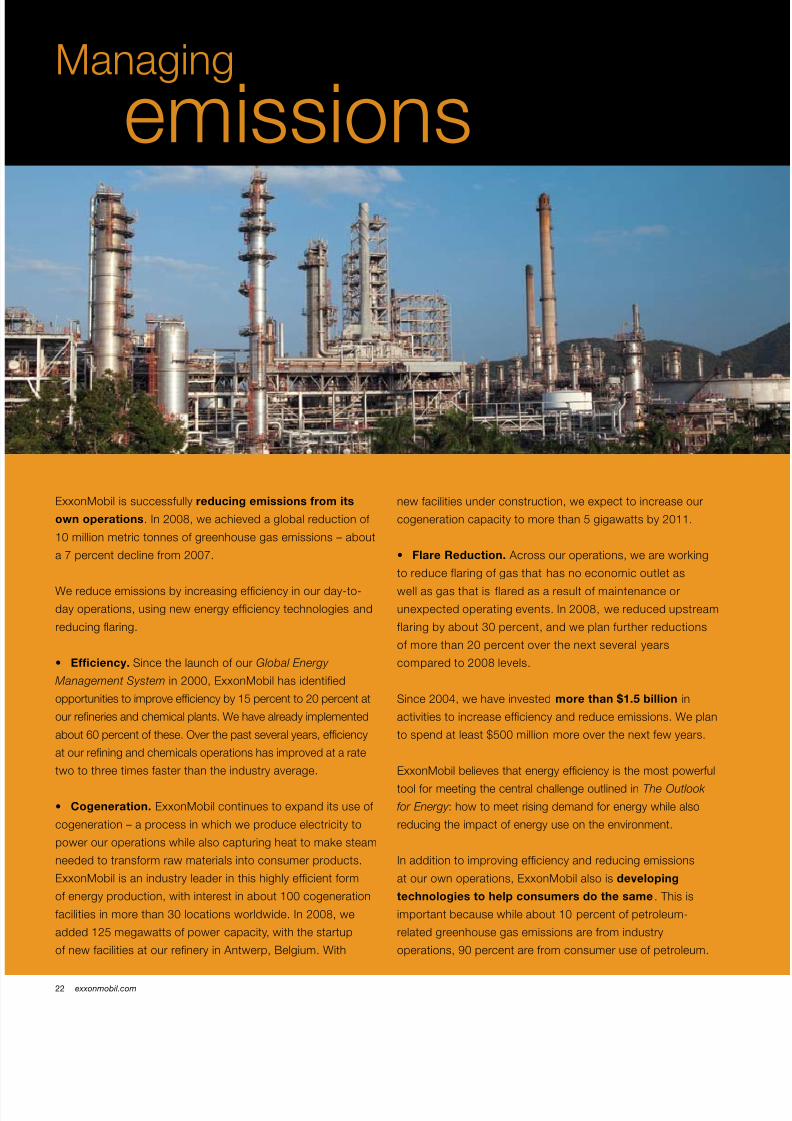
ExxonMobil is successully reducing emissions rom its
own operations. In 2008, we achieved a global reduction o
10 million metric tonnes o greenhouse gas emissions – about
a 7 percent decline rom 2007.
We reduce emissions by increasing eciency in our day-to-
day operations, using new energy eciency technologies and
reducing faring.
• Efciency. Since the launch o our Global Energy
Management System in 2000, ExxonMobil has identied
opportunities to improve eciency by 15 percent to 20 percent at
our reneries and chemical plants. We have already implemented
about 60 percent o these. Over the past several years, eciency
at our rening and chemicals operations has improved at a rate
two to three times aster than the industry average.
• Cogeneration. ExxonMobil continues to expand its use o
cogeneration – a process in which we produce electricity to
power our operations while also capturing heat to make steam
needed to transorm raw materials into consumer products.
ExxonMobil is an industry leader in this highly ecient orm
o energy production, with interest in about 100 cogeneration
acilities in more than 30 locations worldwide. In 2008, we
added 125 megawatts o power capacity, with the startup
o new acilities at our renery in Antwerp, Belgium. With
new acilities under construction, we expect to increase our
cogeneration capacity to more than 5 gigawatts by 2011.
• Flare Reduction. Across our operations, we are working
to reduce laring o gas that has no economic outlet as
well as gas that is lared as a result o maintenance or
unexpected operating events. In 2008, we reduced upstream
laring by about 30 percent, and we plan urther reductions
o more than 20 percent over the next several years
compared to 2008 levels.
Since 2004, we have invested more than $1.5 billion in
activities to increase eciency and reduce emissions. We plan
to spend at least $500 million more over the next ew years.
ExxonMobil believes that energy eciency is the most powerul
tool or meeting the central challenge outlined in The Outlook
or Energy : how to meet rising demand or energy while also
reducing the impact o energy use on the environment.
In addition to improving eciency and reducing emissions
at our own operations, ExxonMobil also is developing
technologies to help consumers do the same. This is
important because while about 10 percent o petroleum-
related greenhouse gas emissions are rom industry
operations, 90 percent are rom consumer use o petroleum.
Managing
emissions

8/7/2019 ExxonMobil “The Outlook for Energy A View to 2030”
http://slidepdf.com/reader/full/exxonmobil-the-outlook-for-energy-a-view-to-2030 27/42The Outlook for Energy: A View to 2030 23
Growing demand or electricity, and the uels
used or power generation, is a major trend
o the last 25 years, and will remain so or the
next 25 years as living standards continue
to improve worldwide and more people gain
access to electricity.
Powergenerationisthelargestenergy-demandsector and the astest-growing – rising at an
average o approximately 1.7 percent a year –
and will account or about 40 percent o all
energy demand, up rom 36 percent in 2005
and 26 percent in 1980. This will support
strong increases in global electricity demand,
which will be about our times higher than 1980.
Electricity demand rises at a much aster rate
innon-OECDcountries,reectingtheirfaster
economic growth and relatively low electricitypenetration to date.
What uels will be used to generate this
electricity? Through 2030, there is a shit
away rom coal toward natural gas, as well
as to nuclear and renewable uels. This will
be driven by environmental policies, including
ones that seek to reduce emissions by
putting a cost on carbon emissions.
By 2030, we expect that 40 percent o the
world’s electricity will be generated by
nuclear and renewable uels.
Projectingthefuturemixoffuelsforpowergeneration is a complex task with many
variables. As part o this process, we must
consider how these uels will compete
economically, because these are the real-lie
actors that utilities and power generators
look at when considering which uels to use
or what types o new power plants to build.
Electricity use is growing rapidly
by sector
Residential
Commercial
HeavyIndustry
OtherIndustry
Transportation
Thousands of Terrawatt Hours
30
25
20
15
10
5
01980 20302005
40%
by generation
Thousands of Terrawatt Hours
1980 20302005
30
25
20
15
10
5
0
Renewables
Nuclear
Oil
Coal
Gas
Thousands of Terrawatt Hours
30
25
20
15
10
5
0
by region
1980 20302005
United States
Europe
Asia Pacific
OECD
China
Other Asia Pacific
Other
Non-OECDOther
By 2030, about 40 percent o the
world’s electricity will be generated
by nuclear and renewable uels.
The Outlook for Energy: A View to 2030 23
8/7/2019 ExxonMobil “The Outlook for Energy A View to 2030”
http://slidepdf.com/reader/full/exxonmobil-the-outlook-for-energy-a-view-to-2030 28/4224 exxonmobil.com
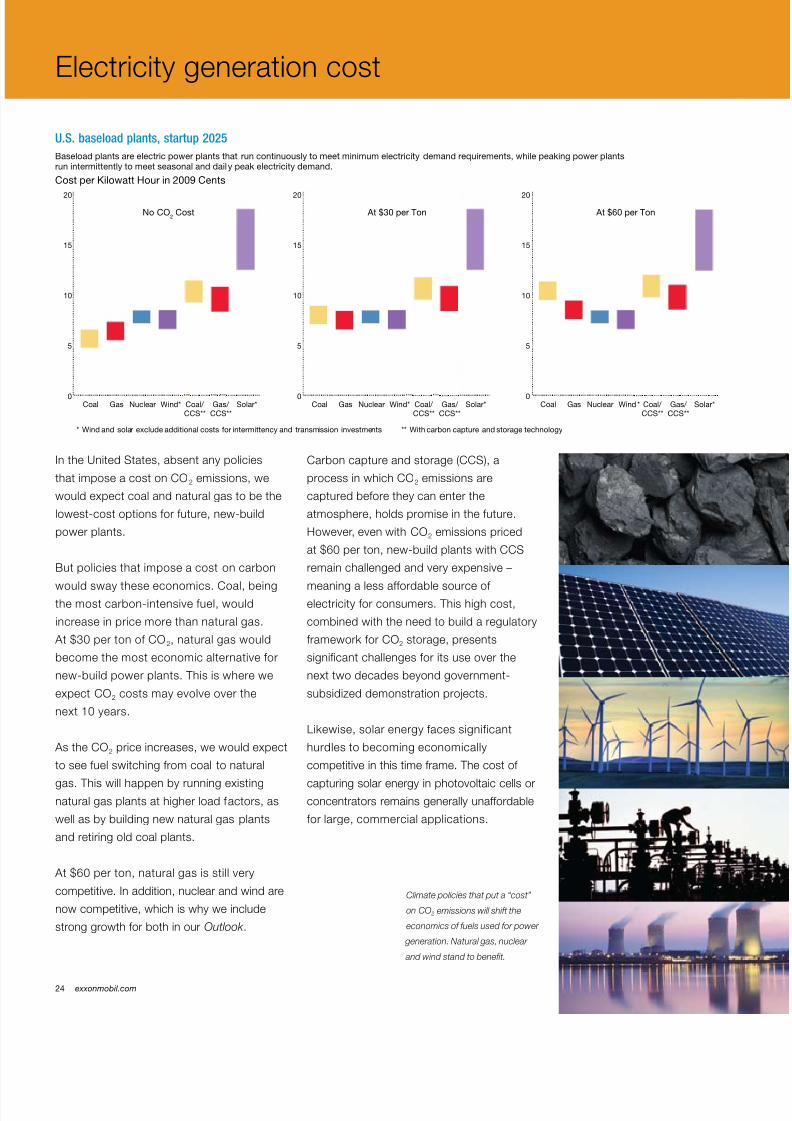
In the United States, absent any policies
that impose a cost on CO2 emissions, we
would expect coal and natural gas to be the
lowest-cost options or uture, new-build
power plants.
But policies that impose a cost on carbon
would sway these economics. Coal, beingthe most carbon-intensive uel, would
increase in price more than natural gas.
At $30 per ton o CO2, natural gas would
become the most economic alternative or
new-build power plants. This is where we
expect CO2 costs may evolve over the
next 10 years.
As the CO2 price increases, we would expect
to see uel switching rom coal to natural
gas. This will happen by running existingnatural gas plants at higher load actors, as
well as by building new natural gas plants
and retiring old coal plants.
At $60 per ton, natural gas is still very
competitive. In addition, nuclear and wind are
now competitive, which is why we include
strong growth or both in our Outlook .
Carbon capture and storage (CCS), a
process in which CO2 emissions are
captured beore they can enter the
atmosphere, holds promise in the uture.
However, even with CO2 emissions priced
at $60 per ton, new-build plants with CCS
remain challenged and very expensive –
meaning a less aordable source o electricity or consumers. This high cost,
combined with the need to build a regulatory
ramework or CO2 storage, presents
signicant challenges or its use over the
next two decades beyond government-
subsidized demonstration projects.
Likewise, solar energy aces signiicant
hurdles to becoming economically
competitive in this time rame. The cost o
capturing solar energy in photovoltaic cells orconcentrators remains generally unaordable
or large, commercial applications.
Electricity generation cost
Baseload plants are electric power plants that run continuously to meet minimum electricity demand requirements, while peaking power plantsrun intermittently to meet seasonal and daily peak electricity demand.
* Wind and solar exclude additional costs for intermittency and transmission investments ** With carbon capture and storage technology
U.S. baseload plants, startup 2025
Coal Gas Nuclear Wind* Coal/ CCS**
Gas/ CCS**
Solar*
No CO2
Cost
Coal Gas Nuclear Wind* Coal/ CCS**
Gas/ CCS**
Solar*
At $30 per Ton
Coal Gas Nuclear Wind* Coal/ CCS**
Gas/ CCS**
Solar*
At $60 per Ton
Cost per Kilowatt Hour in 2009 Cents
20
15
10
5
0
20
15
10
5
0
20
15
10
5
0
Climate policies that put a “cost”
on CO 2 emissions will shit the
economics o uels used or power
generation. Natural gas, nuclear
and wind stand to beneft.
8/7/2019 ExxonMobil “The Outlook for Energy A View to 2030”
http://slidepdf.com/reader/full/exxonmobil-the-outlook-for-energy-a-view-to-2030 29/42The Outlook for Energy: A View to 2030 25
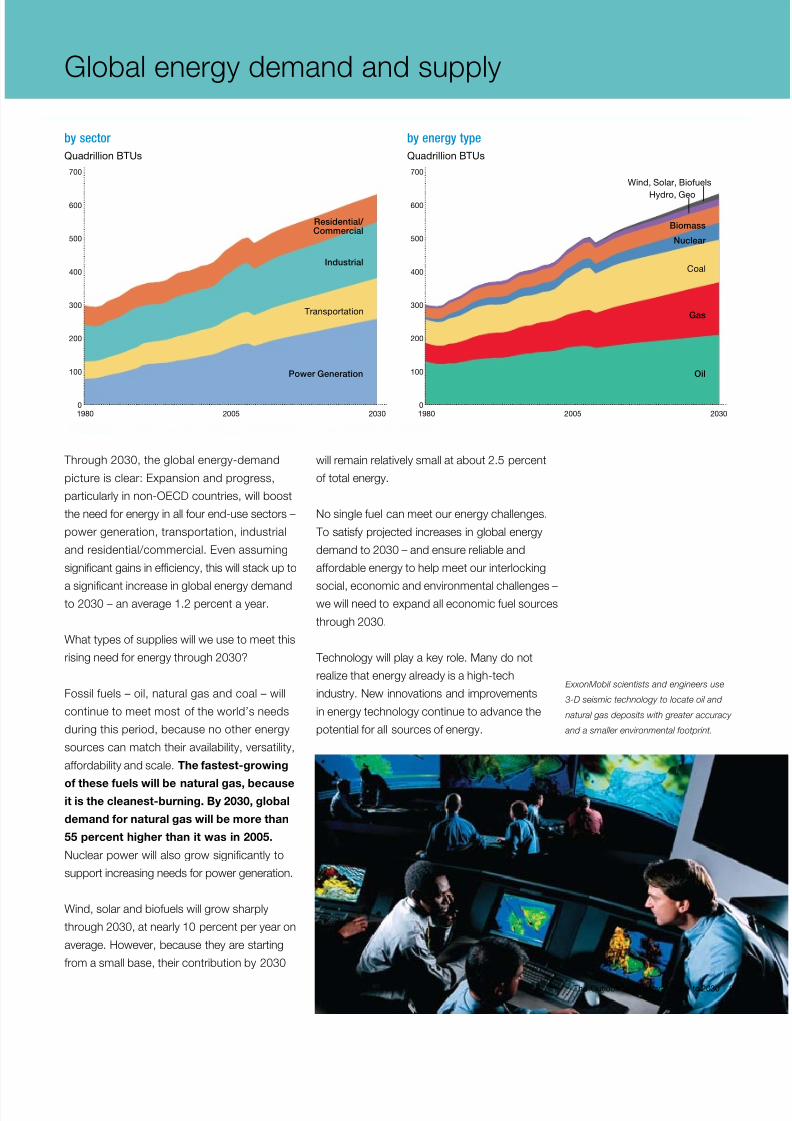
Through 2030, the global energy-demand
picture is clear: Expansion and progress,
particularlyinnon-OECDcountries,willboost
the need or energy in all our end-use sectors –
power generation, transportation, industrial
and residential/commercial. Even assuming
signicant gains in eciency, this will stack up to
a signicant increase in global energy demandto 2030 – an average 1.2 percent a year.
What types o supplies will we use to meet this
rising need or energy through 2030?
Fossil uels – oil, natural gas and coal – will
continue to meet most o the world’s needs
during this period, because no other energy
sources can match their availability, versatility,
aordability and scale. The astest-growing
o these uels will be natural gas, becauseit is the cleanest-burning. By 2030, global
demand or natural gas will be more than
55 percent higher than it was in 2005.
Nuclear power will also grow signicantly to
support increasing needs or power generation.
Wind, solar and biouels will grow sharply
through 2030, at nearly 10 percent per year on
average. However, because they are starting
rom a small base, their contribution by 2030
will remain relatively small at about 2.5 percent
o total energy.
No single uel can meet our energy challenges.
To satisy projected increases in global energy
demand to 2030 – and ensure reliable and
aordable energy to help meet our interlocking
social, economic and environmental challenges –we will need to expand all economic uel sources
through 2030.
Technology will play a key role. Many do not
realize that energy already is a high-tech
industry. New innovations and improvements
in energy technology continue to advance the
potential or all sources o energy.
Global energy demand and supply
Industrial
Transportation
Oil
Gas
Coal
Nuclear
Biomass
Hydro, Geo
Wind, Solar, Biofuels
Power Generation
Residential/
Commercial
by sector
by energy type
1980 2030
Quadrillion BTUs Quadrillion BTUs
700
600
500
400
300
200
100
0
700
600
500
400
300
200
100
02005 1980 20302005
ExxonMobil scientists and engineers use
3-D seismic technology to locate oil and
natural gas deposits with greater accuracy
and a smaller environmental ootprint.
8/7/2019 ExxonMobil “The Outlook for Energy A View to 2030”
http://slidepdf.com/reader/full/exxonmobil-the-outlook-for-energy-a-view-to-2030 30/4226 exxonmobil.com
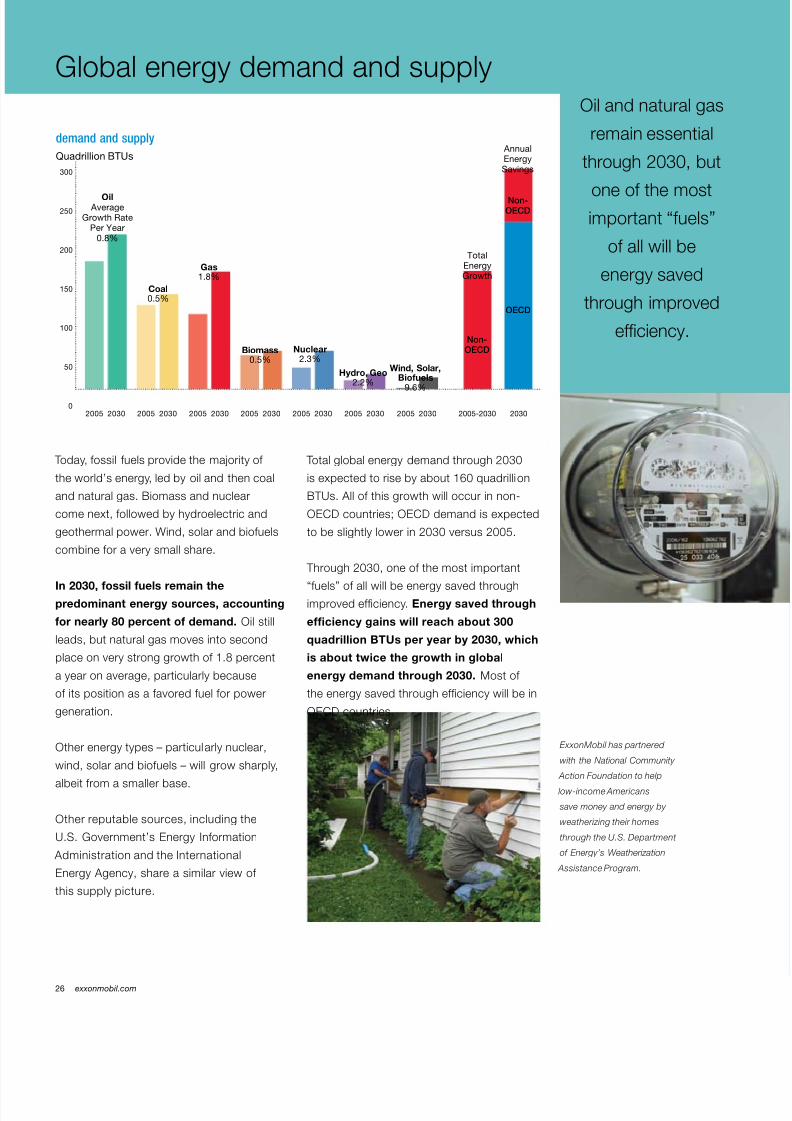
Today, ossil uels provide the majority o
the world’s energy, led by oil and then coal
and natural gas. Biomass and nuclear
come next, ollowed by hydroelectric and
geothermal power. Wind, solar and biouels
combine or a very small share.
In 2030, ossil uels remain thepredominant energy sources, accounting
or nearly 80 percent o demand. Oil still
leads, but natural gas moves into second
place on very strong growth o 1.8 percent
a year on average, particularly because
o its position as a avored uel or power
generation.
Other energy types – particularly nuclear,
wind, solar and biouels – will grow sharply,
albeit rom a smaller base.
Other reputable sources, including the
U.S. Government’s Energy Inormation
Administration and the International
Energy Agency, share a similar view o
this supply picture.
Total global energy demand through 2030
is expected to rise by about 160 quadrillion
BTUs. All o this growth will occur in non-
OECDcountries;OECDdemandisexpected
to be slightly lower in 2030 versus 2005.
Through 2030, one o the most important
“uels” o all will be energy saved throughimproved eciency. Energy saved through
efciency gains will reach about 300
quadrillion BTUs per year by 2030, which
is about twice the growth in global
energy demand through 2030. Most o
the energy saved through eciency will be in
OECDcountries.
Global energy demand and supplyOil and natural gas
remain essential
through 2030, but
one o the mostimportant “uels”
o all will be
energy saved
through improved
eciency.
2005 2030
Oil Average
Growth RatePer Year
0.8%
2005-2030
TotalEnergyGrowth
AnnualEnergySavings
Non-
OECD
Non-
OECD
OECD
20302005 2030
Gas1.8%
2005 2030
Quadrillion BTUs
demand and supply
300
250
200
150
100
50
02005 2030
Nuclear2.3%
2005 2030
Hydro, Geo2.2%
2005 2030
Wind, Solar,Biofuels
9.6%
2005 2030
Biomass0.5%
Coal0.5%
ExxonMobil has partnered
with the National Community
Action Foundation to help
low-income Americans
save money and energy by
weatherizing their homes
through the U.S. Department
o Energy’s Weatherization
Assistance Program.
8/7/2019 ExxonMobil “The Outlook for Energy A View to 2030”
http://slidepdf.com/reader/full/exxonmobil-the-outlook-for-energy-a-view-to-2030 31/42The Outlook for Energy: A View to 2030 27
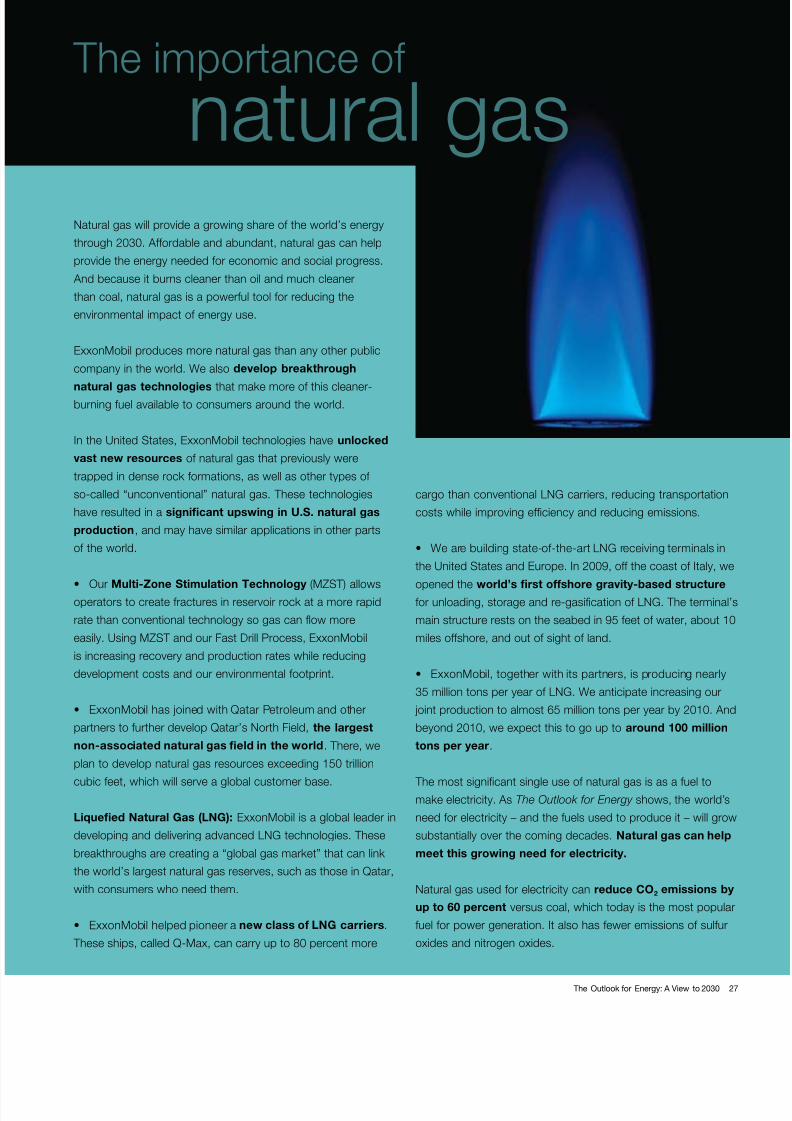
Natural gas will provide a growing share o the world’s energy
through 2030. Aordable and abundant, natural gas can help
provide the energy needed or economic and social progress.
And because it burns cleaner than oil and much cleaner
than coal, natural gas is a powerul tool or reducing the
environmental impact o energy use.
ExxonMobil produces more natural gas than any other public
company in the world. We also develop breakthrough
natural gas technologies that make more o this cleaner-burning uel available to consumers around the world.
In the United States, ExxonMobil technologies have unlocked
vast new resources o natural gas that previously were
trapped in dense rock ormations, as well as other types o
so-called “unconventional” natural gas. These technologies
have resulted in a signifcant upswing in U.S. natural gas
production, and may have similar applications in other parts
o the world.
• OurMulti-Zone Stimulation Technology (MZST) allowsoperators to create ractures in reservoir rock at a more rapid
rate than conventional technology so gas can fow more
easily.UsingMZSTandourFastDrillProcess,ExxonMobil
is increasing recovery and production rates while reducing
development costs and our environmental ootprint.
• ExxonMobilhasjoinedwithQatarPetroleumandother
partnerstofurtherdevelopQatar’sNorthField, the largest
non-associated natural gas feld in the world. There, we
plan to develop natural gas resources exceeding 150 trillion
cubic eet, which will serve a global customer base.
Liquefed Natural Gas (LNG): ExxonMobil is a global leader in
developing and delivering advanced LNG technologies. These
breakthroughs are creating a “global gas market” that can link
theworld’slargestnaturalgasreserves,suchasthoseinQatar,
with consumers who need them.
• ExxonMobilhelpedpioneeranew class o LNG carriers.
Theseships,calledQ-Max,cancarryupto80percentmore
cargo than conventional LNG carriers, reducing transportation
costs while improving eciency and reducing emissions.
• Wearebuildingstate-of-the-artLNGreceivingterminalsin
the United States and Europe. In 2009, o the coast o Italy, we
opened the world’s frst oshore gravity-based structure or unloading, storage and re-gasication o LNG. The terminal’s
main structure rests on the seabed in 95 eet o water, about 10
miles oshore, and out o sight o land.
• ExxonMobil,togetherwithitspartners,isproducingnearly
35 million tons per year o LNG. We anticipate increasing our
joint production to almost 65 million tons per year by 2010. And
beyond 2010, we expect this to go up to around 100 million
tons per year.
The most signicant single use o natural gas is as a uel tomake electricity. As The Outlook or Energy shows, the world’s
need or electricity – and the uels used to produce it – will grow
substantially over the coming decades. Natural gas can help
meet this growing need or electricity.
Natural gas used or electricity can reduce CO2 emissions by
up to 60 percent versus coal, which today is the most popular
uel or power generation. It also has ewer emissions o sulur
oxides and nitrogen oxides.
The importance o
natural gas
8/7/2019 ExxonMobil “The Outlook for Energy A View to 2030”
http://slidepdf.com/reader/full/exxonmobil-the-outlook-for-energy-a-view-to-2030 32/4228 exxonmobil.com
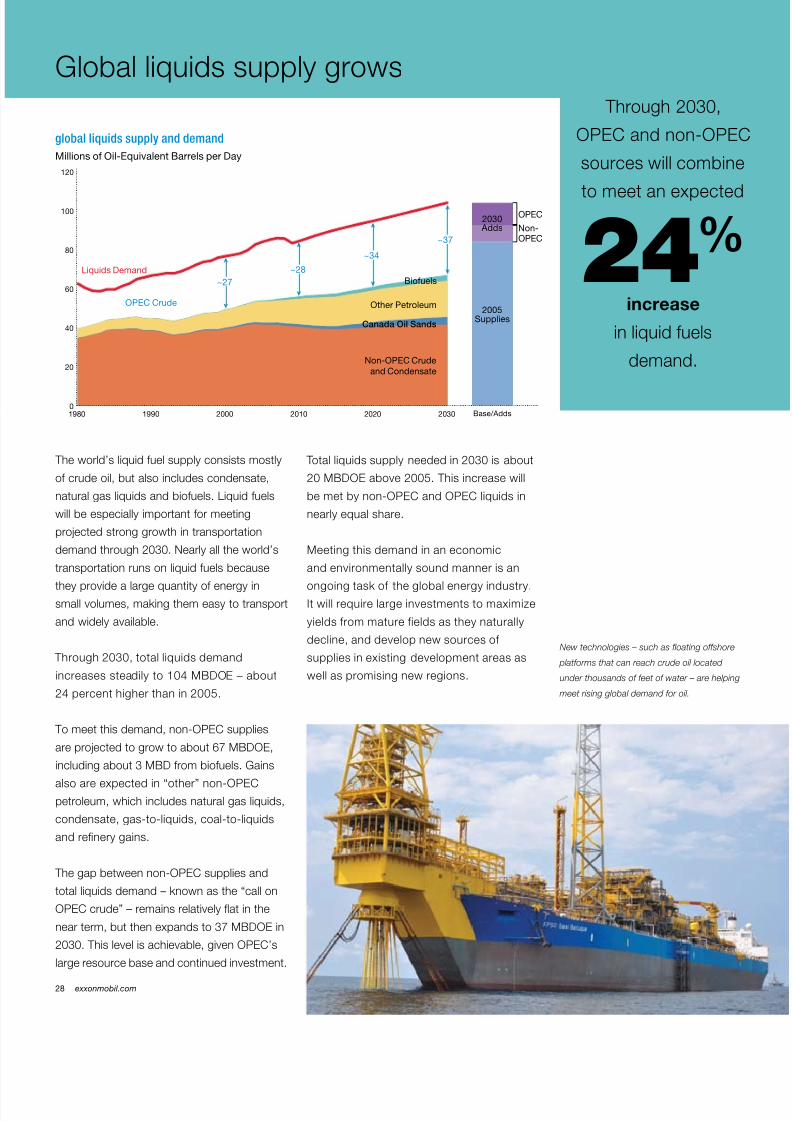
The world’s liquid uel supply consists mostly
o crude oil, but also includes condensate,
natural gas liquids and biouels. Liquid uels
will be especially important or meeting
projected strong growth in transportation
demand through 2030. Nearly all the world’s
transportation runs on liquid uels because
they provide a large quantity o energy insmall volumes, making them easy to transport
and widely available.
Through 2030, total liquids demand
increasessteadilyto104MBDOE–about
24 percent higher than in 2005.
Tomeetthisdemand,non-OPECsupplies
areprojectedtogrowtoabout67MBDOE,
includingabout3MBDfrombiofuels.Gains
alsoareexpectedin“other”non-OPECpetroleum, which includes natural gas liquids,
condensate, gas-to-liquids, coal-to-liquids
and renery gains.
Thegapbetweennon-OPECsuppliesand
total liquids demand – known as the “call on
OPECcrude”–remainsrelativelyatinthe
nearterm,butthenexpandsto37MBDOEin
2030.Thislevelisachievable,givenOPEC’s
large resource base and continued investment.
Total liquids supply needed in 2030 is about
20MBDOEabove2005.Thisincreasewill
bemetbynon-OPECandOPECliquidsin
nearly equal share.
Meeting this demand in an economic
and environmentally sound manner is an
ongoing task o the global energy industry.It will require large investments to maximize
yields rom mature ields as they naturally
decline, and develop new sources o
supplies in existing development areas as
well as promising new regions.
Global liquids supply grows
2005Supplies
2030 Adds Non-
OPEC
Base/Adds
OPEC
global liquids supply and demand
Millions of Oil-Equivalent Barrels per Day
Non-OPEC Crude
and Condensate
Canada Oil Sands
Other Petroleum
Biofuels
Liquids Demand
OPEC Crude
120
100
80
60
40
20
01980 20302010 20201990 2000
~27
~28
~34
~37
New technologies – such as oating oshore
platorms that can reach crude oil located
under thousands o eet o water – are helping
meet rising global demand or oil.
Through 2030,
OPECandnon-OPEC
sources will combine
to meet an expected
24%increase
in liquid uels
demand.
8/7/2019 ExxonMobil “The Outlook for Energy A View to 2030”
http://slidepdf.com/reader/full/exxonmobil-the-outlook-for-energy-a-view-to-2030 33/42The Outlook for Energy: A View to 2030 29
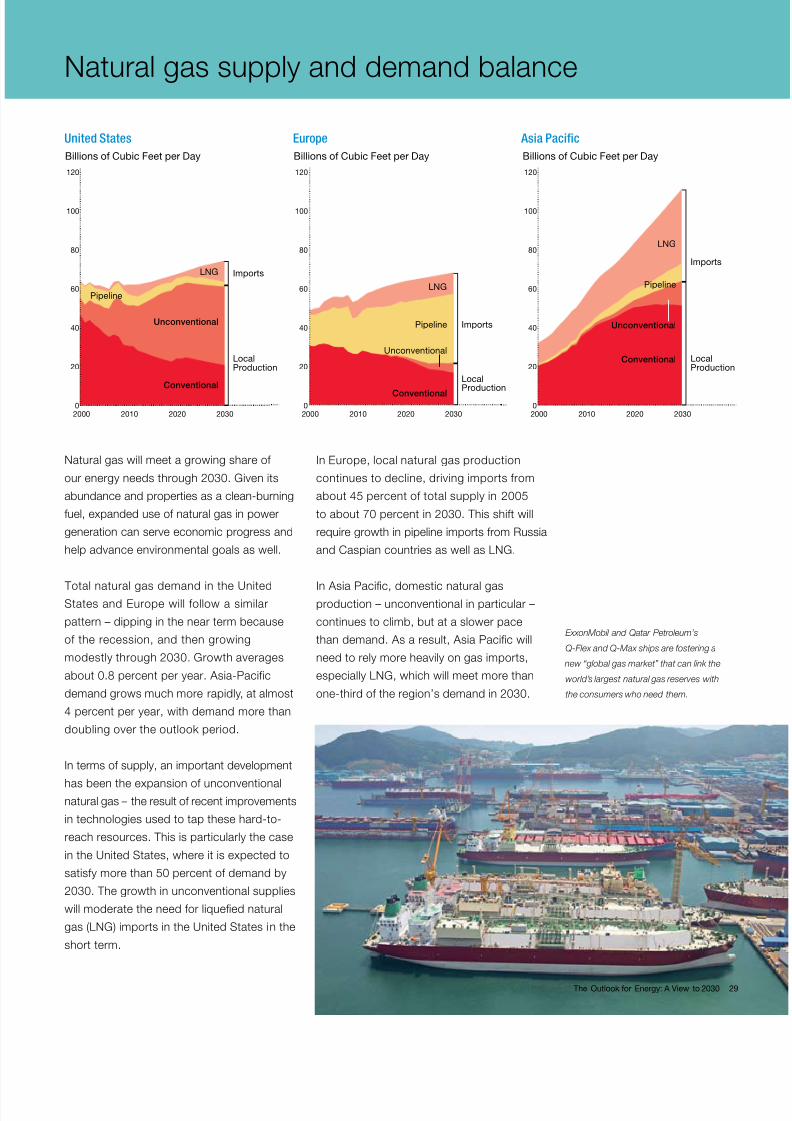
Natural gas will meet a growing share o
our energy needs through 2030. Given its
abundance and properties as a clean-burning
uel, expanded use o natural gas in power
generation can serve economic progress and
help advance environmental goals as well.
Total natural gas demand in the UnitedStates and Europe will ollow a similar
pattern – dipping in the near term because
o the recession, and then growing
modestly through 2030. Growth averages
about0.8percentperyear.Asia-Pacific
demand grows much more rapidly, at almost
4 percent per year, with demand more than
doubling over the outlook period.
In terms o supply, an important development
has been the expansion o unconventionalnatural gas – the result o recent improvements
in technologies used to tap these hard-to-
reach resources. This is particularly the case
in the United States, where it is expected to
satisy more than 50 percent o demand by
2030. The growth in unconventional supplies
will moderate the need or liqueed natural
gas (LNG) imports in the United States in the
short term.
In Europe, local natural gas production
continues to decline, driving imports rom
about 45 percent o total supply in 2005
to about 70 percent in 2030. This shit will
require growth in pipeline imports rom Russia
and Caspian countries as well as LNG.
InAsiaPacic,domesticnaturalgasproduction – unconventional in particular –
continues to climb, but at a slower pace
thandemand.Asaresult,AsiaPacicwill
need to rely more heavily on gas imports,
especially LNG, which will meet more than
one-third o the region’s demand in 2030.
Natural gas supply and demand balance
LocalProduction
Imports
LNG
Pipeline
Unconventional
Conventional
Billions of Cubic Feet per Day
120
100
80
60
40
20
0
Asia Pacific
2000 203020202010
Local
Production
Imports
LNG
Pipeline
Unconventional
Conventional
Billions of Cubic Feet per Day
120
100
80
60
40
20
0
Europe
2000 203020202010
LocalProduction
ImportsLNG
Pipeline
Unconventional
Conventional
Billions of Cubic Feet per Day
120
100
80
60
40
20
0
United States
2000 203020202010
ExxonMobil and Qatar Petroleum’s
Q-Flex and Q-Max ships are ostering a
new “global gas market” that can link the
world’s largest natural gas reserves with
the consumers who need them.
The Outlook for Energy: A View to 2030 29
8/7/2019 ExxonMobil “The Outlook for Energy A View to 2030”
http://slidepdf.com/reader/full/exxonmobil-the-outlook-for-energy-a-view-to-2030 34/4230 exxonmobil.com
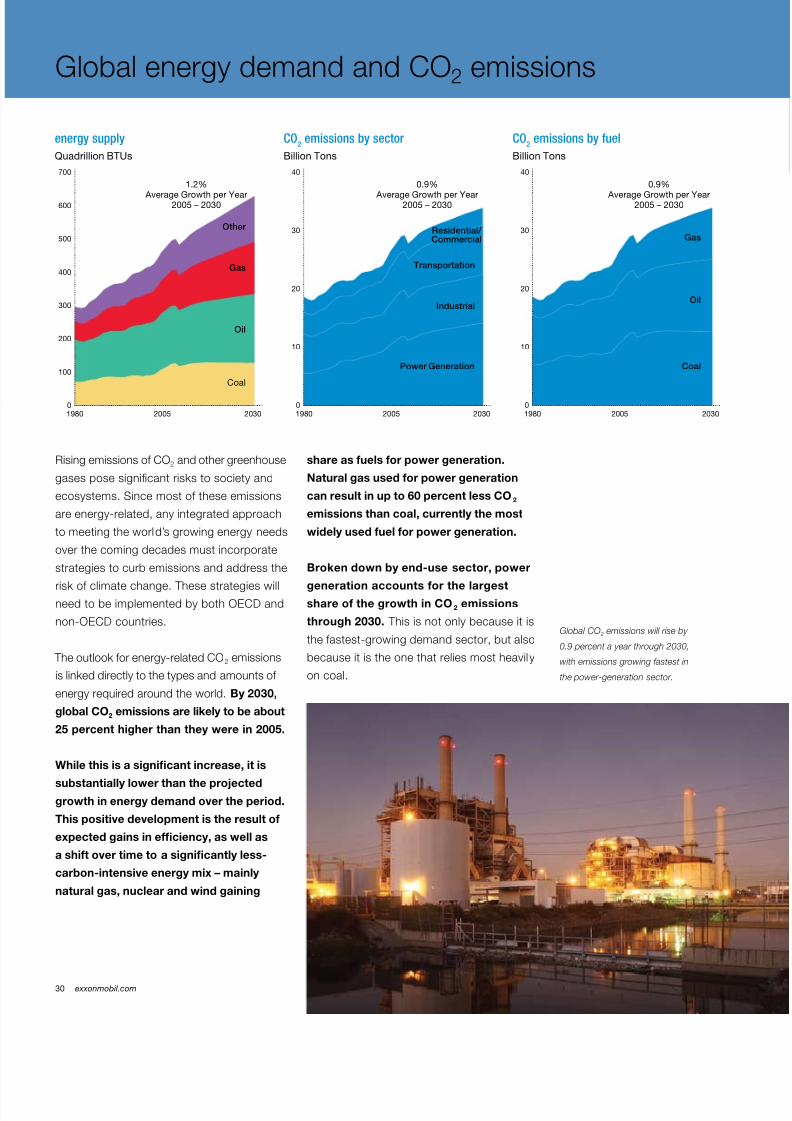
Rising emissions o CO2 and other greenhouse
gases pose signicant risks to society and
ecosystems. Since most o these emissions
are energy-related, any integrated approach
to meeting the world’s growing energy needs
over the coming decades must incorporate
strategies to curb emissions and address the
risk o climate change. These strategies willneedtobeimplementedbybothOECDand
non-OECDcountries.
The outlook or energy-related CO2 emissions
is linked directly to the types and amounts o
energy required around the world. By 2030,
global CO2 emissions are likely to be about
25 percent higher than they were in 2005.
While this is a signifcant increase, it is
substantially lower than the projectedgrowth in energy demand over the period.
This positive development is the result o
expected gains in efciency, as well as
a shit over time to a signifcantly less-
carbon-intensive energy mix – mainly
natural gas, nuclear and wind gaining
share as uels or power generation.
Natural gas used or power generation
can result in up to 60 percent less CO2
emissions than coal, currently the most
widely used uel or power generation.
Broken down by end-use sector, power
generation accounts or the largestshare o the growth in CO2 emissions
through 2030. This is not only because it is
the astest-growing demand sector, but also
because it is the one that relies most heavily
on coal.
Global energy demand and CO2 emissions
Global CO 2 emissions will rise by
0.9 percent a year through 2030,
with emissions growing astest in
the power-generation sector.
Gas
Oil
Coal
1.2%
Average Growth per Year2005 – 2030
Other
energy supply
1980 2030
Quadrillion BTUs
700
600
500
400
300
200
100
02005
Gas
Oil
Coal
0.9%
Average Growth per Year2005 – 2030
CO2
emissions by fuel
1980 2030
Billion Tons
40
30
20
10
02005
Transportation
Industrial
Power Generation
0.9%
Average Growth per Year2005 – 2030
CO2
emissions by sector
1980 2030
Billion Tons
40
30
20
10
02005
Residential/ Commercial
8/7/2019 ExxonMobil “The Outlook for Energy A View to 2030”
http://slidepdf.com/reader/full/exxonmobil-the-outlook-for-energy-a-view-to-2030 35/42The Outlook for Energy: A View to 2030 31
ExxonMobil believes that the broad objective o actions
to address climate change should be to reduce the risk o
serious impacts on society and the environment, while not
harming the contribution o energy to economic development
and expanded prosperity around the world.
As a company with 125 years o experience developing the
technology and inrastructure that delivers the world’s energy,
we believe we have a unique perspective on what types
o conditions are necessary to successully tackle such a
complex global energy challenge.
Above all, companies, consumers and investors will need a
market environment that provides clear signals to encourage
sensible and broad-based investment in the two most
powerul emissions-ghting tools: improvements to energy
eciency and the expanded use o lower-carbon uels such
as natural gas. Continued progress on these ronts will require
trillions o dollars in new investment, and steadast work on
the creation o new technologies.
Some governments are considering policies that would
impose a “cost” on CO2 emissions. In these cases,
ExxonMobil believes that a revenue-neutral carbon tax
has many advantages over a cap-and-trade system in terms
o achieving our society’s shared goal o reducing emissions
over the long term:
• Acarbontaxcancreate a clear and uniorm cost or
emissions in all economic decisions. This price stability
encourages companies to invest in advanced technologies,
and provides a clear incentive or all consumers to increase
eciency and reduce emissions.
• Acarbontaxavoids the costs and complexity o having
to build a new market or emissions allowances or the need
or new layers o regulators and administrators to manage
this market. It also does not open up signicant opportunities
or market manipulation, or require complex and costly
compliance and enorcement systems.
• A carbon tax can be made revenue-neutral. Returning
the tax revenue to consumers through reductions in other
taxes – payroll taxes or a simple dividend – reduces the
burden on the economy, and ensures that government
policy is specically ocused on reducing emissions, not on
becoming a revenue stream or other purposes.
• Becauseglobalparticipationissoimportanttocontrolling
emissions, a carbon tax may be a more viable ramework or
engaging participation by other nations.
As The Outlook or Energy shows, curbing greenhouse gas
emissions while also meeting rising energy demand will
require a tremendous global eort, sustained over decades.
Compared with a cap-and-trade system, a carbon tax – by being
predictable, transparent, and comparatively simple to understand
and implement – is a more eective approach or creating the
conditions necessary to achieve emissions-reduction goals.
Options or
carbon policy
The Outlook for Energy: A View to 2030 31
8/7/2019 ExxonMobil “The Outlook for Energy A View to 2030”
http://slidepdf.com/reader/full/exxonmobil-the-outlook-for-energy-a-view-to-2030 36/4232 exxonmobil.com
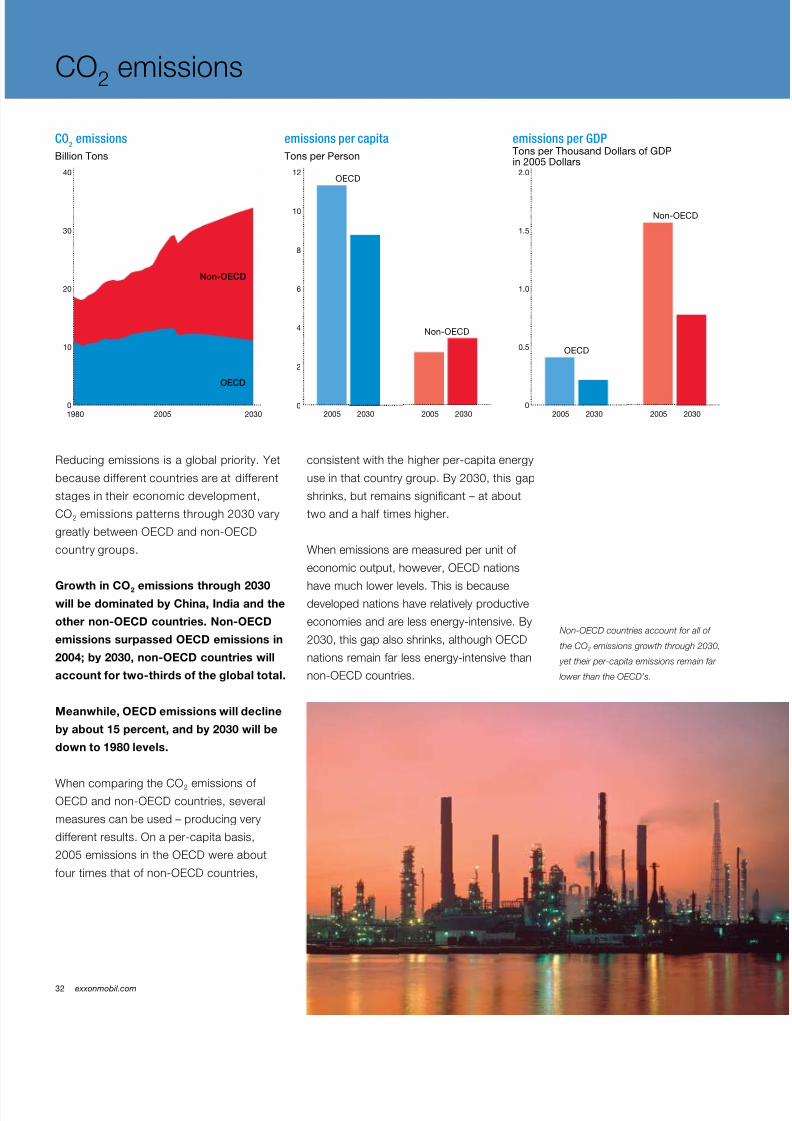
Reducing emissions is a global priority. Yet
because dierent countries are at dierent
stages in their economic development,
CO2 emissions patterns through 2030 vary
greatlybetweenOECDandnon-OECD
country groups.
Growth in CO2 emissions through 2030will be dominated by China, India and the
other non-OECD countries. Non-OECD
emissions surpassed OECD emissions in
2004; by 2030, non-OECD countries will
account or two-thirds o the global total.
Meanwhile, OECD emissions will decline
by about 15 percent, and by 2030 will be
down to 1980 levels.
When comparing the CO2 emissions o OECDandnon-OECDcountries,several
measures can be used – producing very
dierent results. On a per-capita basis,
2005emissionsintheOECDwereabout
fourtimesthatofnon-OECDcountries,
consistent with the higher per-capita energy
use in that country group. By 2030, this gap
shrinks, but remains signicant – at about
two and a hal times higher.
When emissions are measured per unit o
economicoutput,however,OECDnations
have much lower levels. This is becausedeveloped nations have relatively productive
economies and are less energy-intensive. By
2030,thisgapalsoshrinks,althoughOECD
nations remain ar less energy-intensive than
non-OECDcountries.
CO2 emissions
2005 2030 2005 2030
Non-OECD
OECD
2005 2030 2005 2030
Non-OECD
OECD
OECD
Non-OECD
1980 2030
Billion Tons
40
30
20
10
02005
emissions per capitaCO2
emissions
Tons per Person
12
10
8
6
4
2
0
emissions per GDPTons per Thousand Dollars of GDPin 2005 Dollars
2.0
1.5
1.0
0.5
0
Non-OECD countries account or all o
the CO 2 emissions growth through 2030,
yet their per-capita emissions remain ar
lower than the OECD’s.
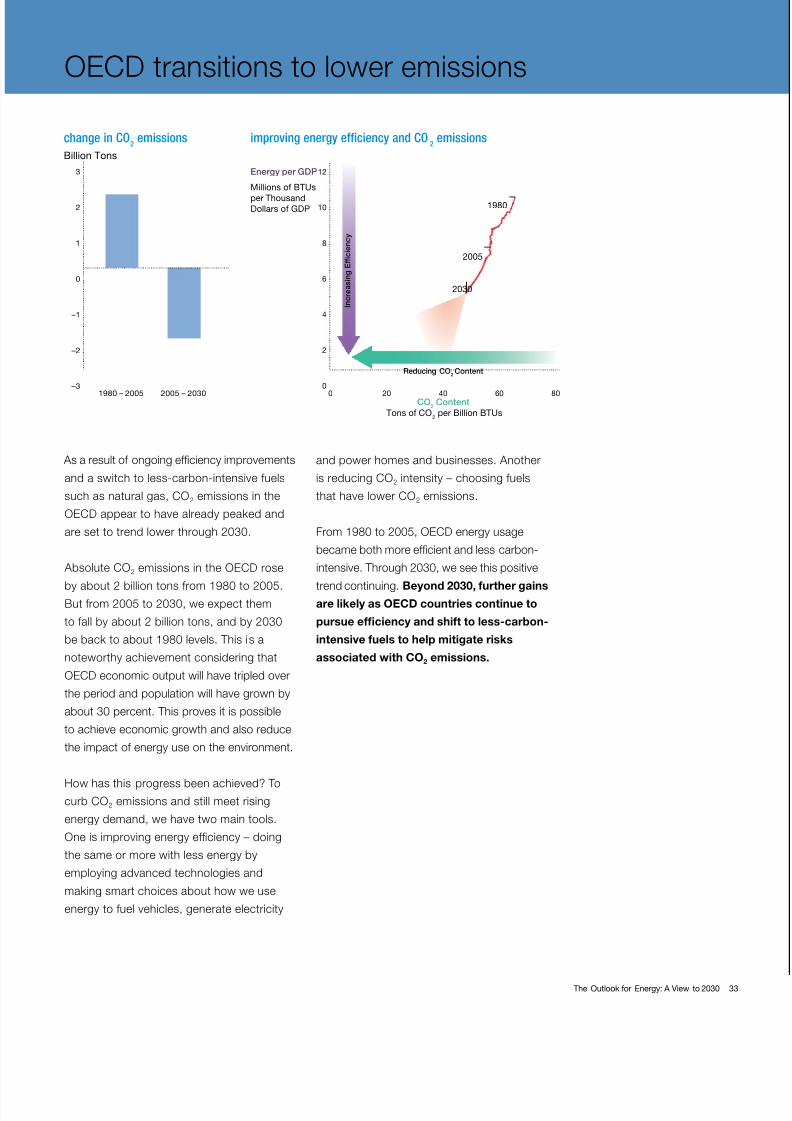
8/7/2019 ExxonMobil “The Outlook for Energy A View to 2030”
http://slidepdf.com/reader/full/exxonmobil-the-outlook-for-energy-a-view-to-2030 37/42The Outlook for Energy: A View to 2030 33
As a result o ongoing eciency improvements
and a switch to less-carbon-intensive uels
such as natural gas, CO2 emissions in the
OECDappeartohavealreadypeakedand
are set to trend lower through 2030.
Absolute CO2emissionsintheOECDrose
by about 2 billion tons rom 1980 to 2005.But rom 2005 to 2030, we expect them
to all by about 2 billion tons, and by 2030
be back to about 1980 levels. This is a
noteworthy achievement considering that
OECDeconomicoutputwillhavetripledover
the period and population will have grown by
about 30 percent. This proves it is possible
to achieve economic growth and also reduce
the impact o energy use on the environment.
How has this progress been achieved? Tocurb CO2 emissions and still meet rising
energy demand, we have two main tools.
One is improving energy eciency – doing
the same or more with less energy by
employing advanced technologies and
making smart choices about how we use
energy to uel vehicles, generate electricity
and power homes and businesses. Another
is reducing CO2 intensity – choosing uels
that have lower CO2 emissions.
From1980to2005,OECDenergyusage
became both more ecient and less carbon-
intensive. Through 2030, we see this positive
trend continuing. Beyond 2030, urther gainsare likely as OECD countries continue to
pursue efciency and shit to less-carbon-
intensive uels to help mitigate risks
associated with CO2 emissions.
OECDtransitionstoloweremissions
Tons of CO2
per Billion BTUs
Reducing CO2Content
I n c r e a s i n g E
f f i c i e n c y
1980
2005
2030
1980 – 2005
Billion Tons
3
2
1
0
–1
–2
–3
2005 – 2030
improving energy efficiency and CO2
emissionschange in CO2
emissions
12
10
8
6
4
2
060 8040200
Millions of BTUs
per ThousandDollars of GDP
Energy per GDP
CO2
Content
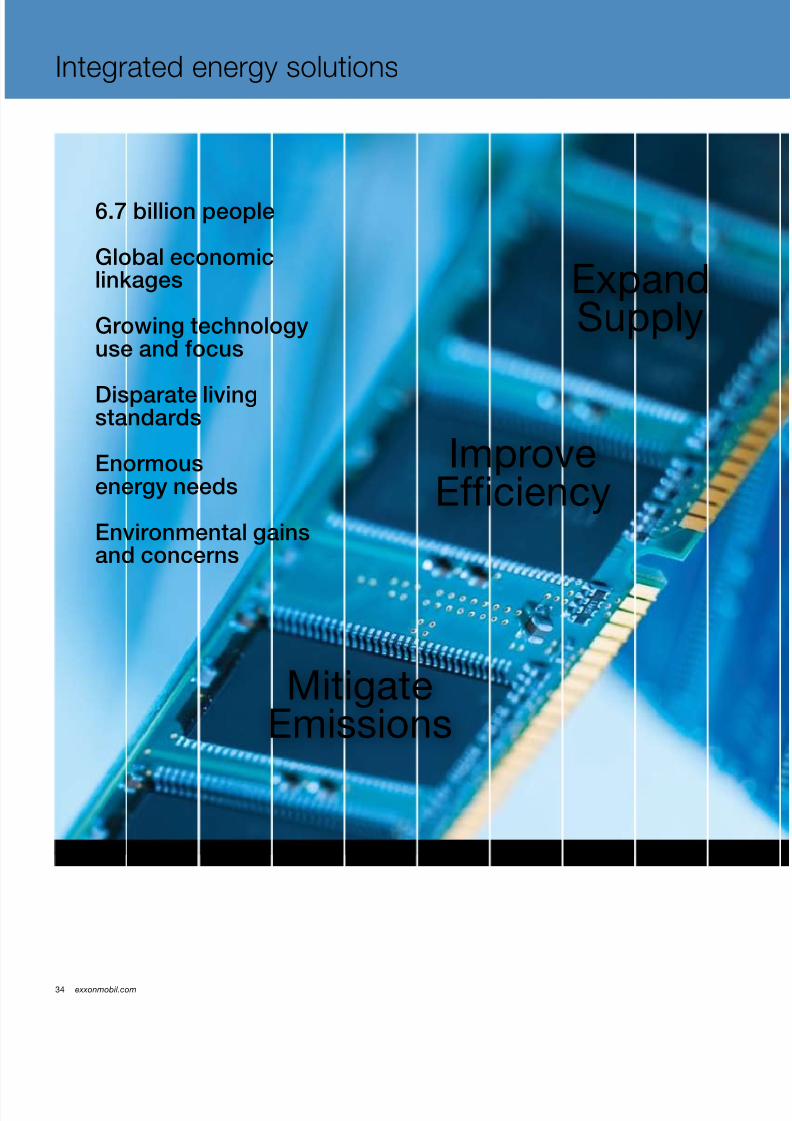
8/7/2019 ExxonMobil “The Outlook for Energy A View to 2030”
http://slidepdf.com/reader/full/exxonmobil-the-outlook-for-energy-a-view-to-2030 38/4234 exxonmobil.com
2005 2010 2015 20
6.7 billion people
Global economiclinkages
Growing technologyuse and focus
Disparate livingstandards
Enormousenergy needs
Environmental gainsand concerns
ExpandSupply
ImproveEfficiency
MitigateEmissions
Integrated energy solutions
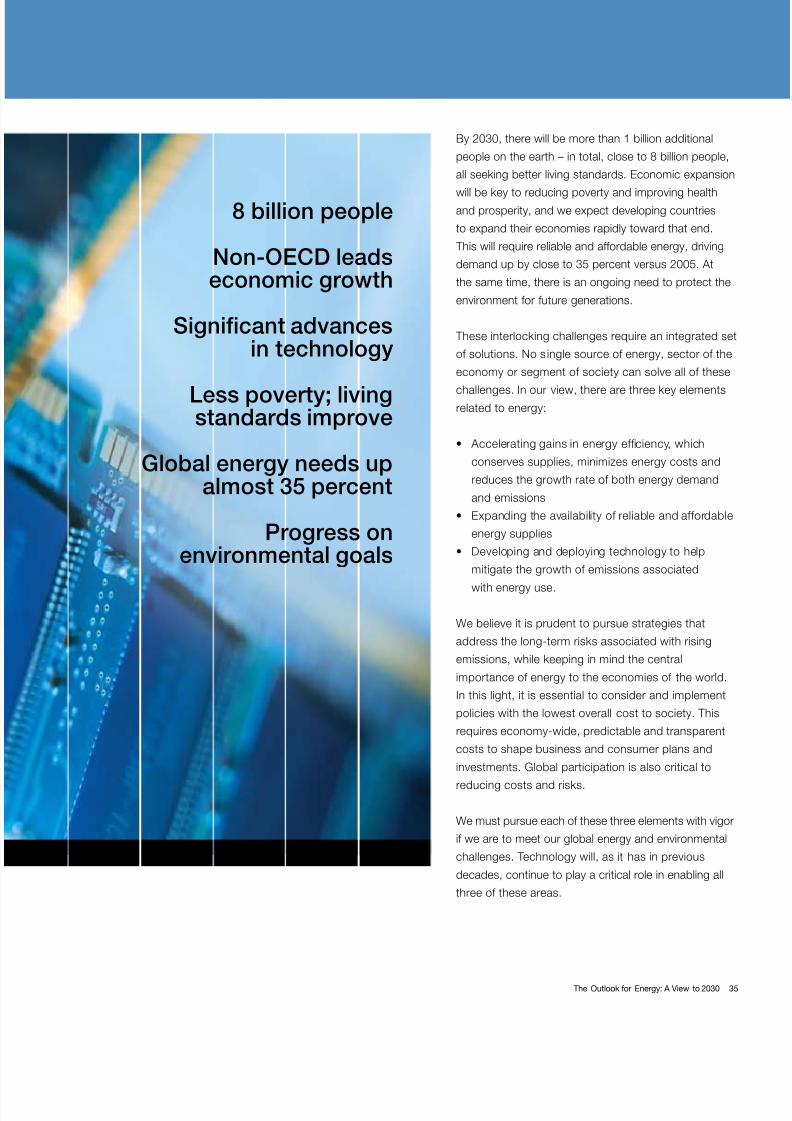
8/7/2019 ExxonMobil “The Outlook for Energy A View to 2030”
http://slidepdf.com/reader/full/exxonmobil-the-outlook-for-energy-a-view-to-2030 39/42The Outlook for Energy: A View to 2030 35
By 2030, there will be more than 1 billion additional
people on the earth – in total, close to 8 billion people,
all seeking better living standards. Economic expansion
will be key to reducing poverty and improving healthand prosperity, and we expect developing countries
to expand their economies rapidly toward that end.
This will require reliable and aordable energy, driving
demand up by close to 35 percent versus 2005. At
the same time, there is an ongoing need to protect the
environment or uture generations.
These interlocking challenges require an integrated set
o solutions. No s ingle source o energy, sector o the
economy or segment o society can solve all o these
challenges. In our view, there are three key elementsrelated to energy:
• Acceleratinggainsinenergyefciency,which
conserves supplies, minimizes energy costs and
reduces the growth rate o both energy demand
and emissions
• Expandingtheavailabilityofreliableandaffordable
energy supplies
• Developinganddeployingtechnologytohelp
mitigate the growth o emissions associated
with energy use.
We believe it is prudent to pursue strategies that
address the long-term risks associated with rising
emissions, while keeping in mind the central
importance o energy to the economies o the world.
In this light, it is essential to consider and implement
policies with the lowest overall cost to society. This
requires economy-wide, predictable and transparent
costs to shape business and consumer plans and
investments. Global participation is also critical to
reducing costs and risks.
We must pursue each o these three elements with vigor
i we are to meet our global energy and environmental
challenges. Technology will, as it has in previous
decades, continue to play a critical role in enabling all
three o these areas.
2025 2030
8 billion people
Non-OECD leadseconomic growth
Significant advancesin technology
Less poverty; livingstandards improve
Global energy needs upalmost 35 percent
Progress onenvironmental goals
8/7/2019 ExxonMobil “The Outlook for Energy A View to 2030”
http://slidepdf.com/reader/full/exxonmobil-the-outlook-for-energy-a-view-to-2030 40/4236 exxonmobil.com
The Outlook or Energy through 2030 – key ndings
DemandEconomic recovery and growth, coupled with rising
populations and living standards, will push energy demand
up by 1.2 percent a year on average through 2030.
• By 2030, global energy demand will be almost 35 percent
higher than in 2005. This assumes signicant gains in
energy eciency. Without eciency improvements,
demand in 2030 could be about 95 percent higher.
• All the growth in demand through 2030 occurs in non-
OECDcountries,whereeconomiesaregrowingmost
rapidly.Non-OECDenergydemandrisesbymorethan
60 percent;demandinOECDcountriesdeclines
slightly even as their economies expand.
• Power generation is the largest and astest-growing
sector. By 2030, power generation will account or
40 percent o all energy demand.
• Demandfortransportation uels continues to increase,
due largely to greater use o heavy-duty vehicles (trucks
andbuses).Demandforlight-dutyvehicles(carsand
SUVs) actually plateaus and declines toward 2030.
Supply To meet demand through 2030, we will need to expand all
economicenergysources.Demandwillbestrongestforfuels
that can help reduce CO2
emissions , such as natural gas.
• Oil remains the largest energy source through 2030, but
natural gas will move into second place ahead o coal. In
2030, these three uels will meet close to 80 percent o
global energy needs.
• Natural gas will be the astest-growing major uel.
By 2030, demand or natural gas will be more than
55 percent higher than in 2005. Technologies that
have unlocked “unconventional” gas will help satisy
this demand.
• Nuclear and renewable uels will see strong growth,
particularly in the power-generation sector. By 2030,
about 40 percent o the world’s electricity will be
generated by nuclear and renewable uels.
• One o the most important “uels” o all is energy efciency.
The energy saved by improved eiciency through 2030 is
larger than rom any other single source, including oil.
EmissionsGlobal CO2 emissions will rise by an average 0.9 percent a
year – a signiicant increase but substantially slower than
the pace o energy-demand growth because o improved
eiciency and a shit toward lower-carbon uels.
• Non-OECDcountriesaccountforall o the CO2 emissions
growth through 2030, yet their per-capita emissions
remain ar lowerthantheOECD’s.
• CO2emissionsintheUnitedStatesandotherOECD
countries are declining, even as their populations and
economiesgrow;by2030,OECDemissionswillbe
approaching 1980 levels.
• Emissions grow astest in the power-generation sector,
in part because it is the sector that relies most heavily
on coal.
• Beyond 2030, urther progress on emissions will require
more aggressive gains in efciency and/or the use
o less-carbon-intensive uels. New technologies will
be essential on both ronts.
Improve efciency. Expand energy supplies. Mitigate
emissions. Develop new technologies. Each o these
solutions will be needed to meet our interlocking energy
challenges through 2030 and beyond.
The Outlook or Energy is available on our Web site at
www.exxonmobil.com.

8/7/2019 ExxonMobil “The Outlook for Energy A View to 2030”
http://slidepdf.com/reader/full/exxonmobil-the-outlook-for-energy-a-view-to-2030 41/42The Outlook for Energy: A View to 2030 37
Glossary
ExxonMobil’s Outlook or Energy contains global
projections for the period 2005-2030. In the Outlook ,we reer to standard units or the measurement o energy:
BCFD. Billion cubic eet per day. This is used to measure
volumesofnaturalgas.OneBCFDofnaturalgascanheat
approximately 5 million homes in the U.S. or one year. Six
BCFDofnaturalgasisequivalenttoabout1MBDOE.
BTU. British Thermal Unit. A BTU is a standard unit o
energy that can be used to measure any type o energy
source. It takes approximately 400,000 BTUs per day to
run the average North American household.
Gigawatt (GW). A unit o electric power, a gigawatt
is equal to 1 billion watts, or 1,000 megawatts. A
1-GW power plant can meet the electricity demand o
approximately 500,000 homes in the U.S.
MBDOE. Million barrels per day o oil-equivalent. This
term provides a standardized unit o measure or dierent
types o energy sources (oil, gas, coal, etc.) based on
energy content relative to a typical barrel o oil. One
MBDOEisenoughenergytofuelabout3percentofthe
vehicles on the world’s roads today.

8/7/2019 ExxonMobil “The Outlook for Energy A View to 2030”
http://slidepdf.com/reader/full/exxonmobil-the-outlook-for-energy-a-view-to-2030 42/42
Corporate Headquarters
5959 Las Colinas Blvd.
Irving, Texas 75039-2298
exxonmobil.com