Extraordinary measures in extraordinary times – public - EconStor
84
Extraordinary measures in extraordinary times – public measures in support of the financial sector in the EU and the United States Stéphanie Marie Stolz (European Central Bank and IMF) Michael Wedow (Deutsche Bundesbank) Discussion Paper Series 1: Economic Studies No 13/2010 Discussion Papers represent the authors’ personal opinions and do not necessarily reflect the views of the Deutsche Bundesbank or its staff.
Transcript of Extraordinary measures in extraordinary times – public - EconStor
Extraordinary measures inextraordinary times – public measuresin support of the financial sector in the EUand the United States
Stéphanie Marie Stolz(European Central Bank and IMF)
Michael Wedow(Deutsche Bundesbank)
Discussion PaperSeries 1: Economic StudiesNo 13/2010Discussion Papers represent the authors’ personal opinions and do not necessarily reflect the views of theDeutsche Bundesbank or its staff.

Editorial Board: Klaus Düllmann Frank Heid Heinz Herrmann Karl-Heinz Tödter Deutsche Bundesbank, Wilhelm-Epstein-Straße 14, 60431 Frankfurt am Main, Postfach 10 06 02, 60006 Frankfurt am Main Tel +49 69 9566-0 Telex within Germany 41227, telex from abroad 414431 Please address all orders in writing to: Deutsche Bundesbank, Press and Public Relations Division, at the above address or via fax +49 69 9566-3077
Internet http://www.bundesbank.de
Reproduction permitted only if source is stated.
ISBN 978-3–86558–626–1 (Printversion) ISBN 978-3–86558–627–8 (Internetversion)
Abstract
The extensive public support measures for the financial sector have been key for the management of the current financial crisis. This paper gives a detailed description of the measures taken bycentral banks and governments and attempts a preliminary assessment of the effectiveness of such measures. The geographical focus of the paper is on the European Union (EU) and the United States. The crisis response in both regions has been largely similar in terms of both tools and scope, and monetary policy actions and bank rescue measures have become increasinglyintertwined. However, there are important differences, not only between the EU and the United States (e.g. with regard to the involvement of the central bank), but also within the EU (e.g. asset relief schemes).
JEL Classification Numbers: E58, E61, G21, G38
Keywords: bank rescue measures, public crisis management.
Non-technical summary
The financial crisis has become a key challenge for policy-makers. The support of
banks is seen as paramount for restoring the stability of the financial system and for
maintaining lending to the real economy. Hence, an assessment of what has been done
to contain the crisis is warranted. This paper provides a systematic overview and a
preliminary assessment of the measures adopted by governments and central banks. In
geographical terms, the review is primarily focused on the EU and the United States,
where support measures have been most prevalent.
Overall, the crisis responses in the United States have been broadly similar to those in
the EU. First, they have employed broadly the same tools (government guarantees,
capital and liquidity injections, and asset protection). Second, apart from their scope,
they have also been similar in size. Like the EU, the United States has relied on a mix
of ad hoc measures for individual institutions and schemes addressing the wider needs
of the financial system. Also, monetary policy actions and bank rescue measures have
become increasingly intertwined.
However, there are also important differences between the support measures in the
United States and the EU. For example, the Federal Reserve System has been more
expansive and has also targeted individual financial intermediaries; the Eurosystem’s
actions, however, have been limited to liquidity extension. A further key difference
has been the sizable repayments of capital by US banks. This may be partly attributed
to the fact that capital injections were a requirement in the United States, while in
Europe capital support has typically been voluntary.
Also, sizable differences in crisis responses have emerged within the EU. These
differences partly reflect the magnitude of the problems faced by banking systems, the
degree to which banking systems are exposed to bad assets and potential budgetary
restrictions, which impose constraints on making commitments by governments.
More specifically, a number of EU countries have set up schemes to address the
problems in their financial system, while many others have relied on ad hoc measures
for individual institutions. Given the wide range of approaches in the EU, the United
States naturally lies somewhere between the extremes.
Nicht-technische Zusammenfassung
Die Finanzkrise hat die politischen Entscheidungsträger vor große Herausforderungen
gestellt. Die Unterstützung des Finanzsystems wird dabei als die Vorraussetzung für
die Wiederherstellung der Finanzstabilität und die Aufrechterhaltung der
Kreditvergabe an die Realwirtschaft gesehen. Eine umfassende Bewertung der
Krisenmaßnahmen erscheint daher geboten. Das vorliegende Papier enthält eine
systematische Übersicht und eine erste vorläufige Bewertung der von Regierungen
und Zentralbanken umgesetzten Maßnahmen. Der geographische Schwerpunkt dieser
Übersicht liegt dabei auf Europa und den USA, da in diesen Regionen die meisten
Stützungsmaßnahmen eingeleitet wurden.
Insgesamt sind die Reaktionen auf die Krise in den USA und Europa weitgehend
ähnlich ausgefallen. So sind mit Staatsgarantien, Rekapitalisierungen und
Risikoübernahmen weitgehend die gleichen Instrumente zum Einsatz gekommen.
Auch haben sich Anwendungsbereich und Umfang der Maßnahmen stark geähnelt.
Sowohl Europa als auch die USA haben sich einer Kombination von allgemeinen
Programmen und von Stützungsmaßnahmen für einzelne Finanzintermediäre bedient,
um das Finanzsystem zu stützen. Außerdem wurden die geldpolitischen
Stützungsmaßnahmen zunehmend mit den Bankenrettungsplänen abgestimmt.
Allerdings unterscheiden sich die Maßnahmen beider Regionen auch in wesentlichen
Punkten. So hat die US-Notenbank expansiver reagiert und auch gezielt einzelne
Banken gestützt, wohingegen das Eurosystem seine Maßnahmen auf die
Liquiditätsausweitung beschränkt hat. Ein weiterer Unterschied besteht in den
substanziellen Rückzahlungen von Kapitalinjektionen durch Banken in den USA.
Während die Rekapitalisierung in den USA verpflichtend erfolgte, blieb sie in Europa
zumeist freiwillig.
Auch innerhalb Europas sind die Krisenreaktionen keineswegs einheitlich
ausgefallen. Diese Unterschiede resultieren unter anderen aus dem unterschiedlichen
Ausmaß, in welchen die nationalen Bankensysteme in Probleme geraten sind, aus den
unterschiedlichen Exposure gegenüber „risikoträchtigen Aktiva“ („bad assets“) und
aus unterschiedlichen budgetären Spielräumen für etwaige Maßnahmen. Einige
europäische Länder haben Programme zur Bewältigung der Probleme im
Finanzsektor aufgelegt, während andere fallweise über Hilfsmaßnahmen für einzelne Unternehmen entschieden haben. Bezogen auf das breite Spektrum europäischer
Ansätze nehmen die USA eine Mittelposition zwischen den Extremen ein.

Contents
1 Introduction........................................................................................................1
2 The financial crisis.............................................................................................2
3 Discussion of support measures.........................................................................3 3.1 Central bank measures .......................................................................................5 3.1.1 The Eurosystem ................................................................................................ 6 3.1.2 The Bank of England ........................................................................................ 7 3.1.3 The Federal Reserve System............................................................................. 9 3.1.4 Comparison between the Eurosystem, the Bank of England, and the
Federal Reserve System.................................................................................. 12 3.2 Government measures......................................................................................14 3.2.1 General aspects ............................................................................................... 14
Institutions involved, eligibility, and conditionality................................................... 14 Ad hoc measures vs national schemes........................................................................ 15
3.2.2 Measures adopted............................................................................................ 18 Enhanced deposit insurance ....................................................................................... 22 Guarantees on bank bonds.......................................................................................... 23 Recapitalisations......................................................................................................... 26 Asset support .............................................................................................................. 29
3.2.3 Exit from government measures ..................................................................... 35 Exit from enhanced deposit insurance........................................................................ 37 Exit from guarantees on bank bonds .......................................................................... 37 Exit from Recapitalisations ........................................................................................ 38 Exit from asset support............................................................................................... 41
4 Preliminary assessment of the measures adopted ............................................42 4.1 Safeguarding financial stability and promoting a timely return to
normal market conditions ................................................................................42 4.2 Restoring the provision of credit and lending to the economy ........................44 4.3 Restoring the long-term viability of the banking sector ..................................45 4.4 The impact on public finances and the public cost ..........................................47
5 Conclusion and outlook ...................................................................................50
Tables 1. Government support measures to financial institutions since October 2008.......................20 2. Maturity and volume of government guaranteed bonds issued since October 2008 ...........25 3. Comparison of the asset removal schemes in the US, Germany, and Ireland .....................35 4. Measures adopted by the US administration .......................................................................60 5. Treasury measures under the Troubled Asset Relief Program (TARP) ..............................62 6. FDIC measures under the Temporary Liquidity Guarantee Program..................................63 7. Fed’s non-standard measures...............................................................................................63 8. Setup and state of approval of national schemes .................................................................65 Charts 1. Securities held by the Eurosystem for monetary policy purposes .........................................6 2. Balance sheets of the Eurosystem, the Bank of England, and the US Federal Reserve System........................................................................................................................13 3. Take-up rates within national support schemes ...................................................................21 4. Concentration ratio of implemented measures in the Euro Area.........................................21 5. Volume of outstanding government-guaranteed bank bonds by region ..............................23 6. Euro area sovereign bond spreads........................................................................................24 7. Government-guaranteed bank bond spreads........................................................................24 8. Issued and matured senior bank bonds in the euro area.......................................................25 9. Issued and matured senior bank bonds cumulative for 1 October 2008 through 24 June 2010 .................................................................................................................................25 10. Government capital injections since October 2008 ...........................................................27 11. Capital repayment since October 2008 ..............................................................................38 12. Stock prices for large and complex banking groups in the euro area ................................40 13. Stock prices for global large and complex banking groups...............................................40 14. CDS spreads of large and complex banking groups in the euro area ................................43 15. Stock prices of large and complex banking groups in the euro area .................................43 16. Spread between the Euribor and the Eonia swap rate........................................................43 17. Capital raised vs. losses .....................................................................................................43 18. Loan growth in the Euro Area ...........................................................................................44 19. Loan growth in the US.......................................................................................................44 Boxes 1. The ING rescue package........................................................................................................4 2. The concerted European approach.......................................................................................17 3. State aid control in the European Union ..............................................................................18 4. Cross-border bank rescues in Europe ..................................................................................19 5. The German special purpose vehicle scheme ......................................................................33 6. International coordination of exit.........................................................................................36 7. The cost of failed banks in the United States.......................................................................49 Appendices 1. The support measures in the US ..........................................................................................54 2. Institutional setup across countries ......................................................................................65 3. Methodology of the data collection .....................................................................................66
Glossary
ABS Asset backed securities
AGP Asset Guarantee Program
BLS Bank lending survey
BoE Bank of England
BofA Bank of America
CAP Capital Assistance Program
CD Certificate of deposit
CPP Capital Purchase Program
EC European Commission
EFC Economic and Financial Committee
EU European Union
FDIC Federal Deposit Insurance Corporation
Fed Federal Reserve System
FROB Spanish bank restructuring fund (Fondo de Reestructuratión
Ordenada Bancaria)
FSB Financial Stability Board
GSE Government Sponsored Enterprise
LLC Limited liability company
LCBGs Large and complex banking groups
MFIs Monetary Financial Institutions
MPC Monetary Policy Committee
NAMA National Asset Management Agency
PCA Prompt Corrective Action
PPIP Public-Private Investment Program
RBS Royal Bank of Scotland
SFEF Société de Financement de l'Economie Française
SoFFin German financial market stabilisation fund (Sonderfonds
Finanzmarktstabilisierung)
SOMA System Open Market Account
SPV Special Purpose Vehicle
SSFI Systemically Significant Failing Institution Program
TALF Term Asset-backed Securities Loan Facility
TARP Troubled Asset Relief Program

TIP Targeted Investment Program
TLGP Temporary Liquidity Guarantee Program
TSLF Term Security Lending Facility
1
Extraordinary Measures in Extraordinary Times –
Public Measures in Support of the Financial Sector in the EU and the United
States1
“In mid-October [2008], an aggressive international response was required to avert a global banking meltdown.”
Ben Bernanke, Fed Chairman, testimony before the Committee on Oversight and Government Reform, 25 June 2009.
“This is the paradox of policy at present – almost any policy measure that is desirable now appears diametrically opposite to the direction in which we need to go in the long term.”
Mervyn King, Governor of the Bank of England, Confederation of British Industry (CBI) Dinner, Nottingham, 20 January 2009.
“We have […] used an exceptional set of non-standard policy tools. These tools, combined with the bold action taken by euro area governments over recent months, have played an essential role in preventing a collapse of the financial system and in bolstering confidence.”
Jean-Claude Trichet, President of the European Central Bank (ECB), ceremony conferring the honorary title of Doctor Honoris Causa at the University of National and World Economy, Sofia,
12 June 2009.
“We tell the savers that their deposits are safe.”
Angela Merkel, German Chancellor, announcing a blanket guarantee for private deposits during a press conference, Berlin, 5 October 2008.
1 Introduction In the course of the current global financial crisis, various authors have deliberated on its
possible causes (see, for example, Blanchard, 2008; Gorton, 2008). One aspect that has until now
hardly been assessed is crisis management, and in particular the support measures adopted by
public authorities during the crisis. This paper aims to fill this void by providing a systematic
overview and a preliminary assessment of the measures adopted by governments and central
banks.2 The financial crisis has been a key challenge for policy-makers. The support of banks is
1 Corresponding address: Stéphanie Stolz, E-mail: [email protected] and Michael Wedow, E-mail: [email protected]. The views expressed in this paper are those of the authors and do not necessarily reflect the views of the Deutsche Bundesbank, the ECB or the IMF. We are particularly indebted to Perttu Korhonen who started to collect information on bank rescue measures and from whom we took over the database. We also thank Mauro Grande, John Fell, Panagiotis Strouzas, Soraya Belghazi, Olli Castrén, Jens Eisenschmidt, Urszula Kochanska, Wolfgang Lemke, Edward O’Brien, Lucas Papademos, Nico Valckx, Nikoforos Vidalis and an anonymous referee for comments and Philip Hill for editorial support. All remaining errors are our own. 2 A recent publication by the BIS also addresses this issue, but the present paper focuses on a larger sample of countries and, in addition to government measures, also covers those adopted by central banks (Bank for International Settlements, 2009).
seen as paramount for restoring stability of the financial system and for maintaining lending to
the real economy. Hence, an assessment of what has been done to contain the crisis is warranted.
The objective of this paper is, therefore, to review the support measures adopted by categorising
and describing them and to provide some initial considerations on their effectiveness. The
geographical scope of the review is primarily focused on the EU and the United States, where
support measures have been most prevalent. The structure of the remainder of the paper is as
follows. Section 2 briefly sketches the main events of the current financial crisis, to set the stage
for the description and assessment of the public support measures. Section 3 gives a detailed
description of the support measures employed (including the amounts extended and committed),
ranging from provisions of liquidity by central banks to deposit insurance enhancements,
guarantee schemes, recapitalisation measures and asset protection schemes. Section 4 offers a
preliminary assessment of the effectiveness of the measures, while Section 5 concludes by
comparing the measures adopted in the EU and in the United States and briefly outlining further
issues. An appendix gives a detailed overview of the support measures taken by the US
Administration (Treasury, Federal Reserve System, and FDIC), thereby reflecting the
prominence of the TARP.
2 The financial crisis Originating in the US mortgage market, the financial crisis rapidly spread through the financial
sector and spilled over to other industrialised and emerging market economies. Central banks
became the first line of defence, responding to the emerging crisis through the injection of
liquidity into the financial system. When it became evident that the financial crisis was driven by
concerns over solvency, rather than liquidity, which threatened the stability of the financial
system, governments resorted to traditional rescue measures directed at individual institutions.
These early support measures for individual banks consisted of lines of liquidity to failing
institutions, which were often subsequently sold and merged with an allegedly stronger partner.3
Despite these initial support measures, in Autumn 2008 the financial system was faced with an
abyss, when Lehman Brothers collapsed on 15 September. The bankruptcy was partly instigated
by the takeover of the government-sponsored enterprises (GSEs) Fannie Mae and Freddie Mac,
which had been taken into conservatorship by the US Treasury on 7 September. The GSEs are an 3 Examples of banks which fall into this category are IKB (which received liquidity guarantees and recapitalisation from KfW and a group of private banks and was eventually sold to LoneStar) and SachsenLB (which received a liquidity line from Sachsen in August 2007 and was eventually merged with LBBW in April 2008) in Germany, Northern Rock (nationalised in February 2008) and Bradford and Bingley (nationalised in September 2008 and partly sold to Abbey (Santander)) in the UK and Bear Stearns (sold in March 2008 to JPMorgan Chase) in the United States.
2

integral part of the mortgage market and their takeover made market sentiment extremely
nervous with regard to mortgage exposures. Their takeover, combined with the concern over the
possible collapse of Lehman Brothers, led to the sale of Merrill Lynch to Bank of America. The
collapse of Lehman Brothers subsequently sent a shock wave through the global financial
system, which was largely attributable to Lehman Brothers’ importance as a counterparty in the
credit derivative market. On 16 September, the Federal Reserve System averted the failure of
American International Group (AIG) with the extension of a USD 85 billion loan, and on
25 September, Washington Mutual was seized by the Federal Deposit Insurance Corporation
(FDIC) and partly sold to JP Morgan Chase. Later that month, Wachovia faced intense liquidity
pressures, which threatened its viability and finally resulted in its acquisition by Wells Fargo. “In
short, the period was one of extraordinary risk for the financial system and the global
economy.”4
The repercussions of the Lehman Brothers collapse crossed the Atlantic. Losses on exposures to
Lehman Brothers showed up in the balance sheets of banks around the globe. In Europe, the
crisis gained new momentum when several large banks received substantial government support
and some institutions were even broken up (e.g. Fortis).
While risk aversion and mistrust between financial players led to the drying up of funding
markets, concern over the solvency of financial institutions was now severely affecting the
confidence of depositors and revealed the weaknesses of deposit insurance schemes. Hence, in
October 2009, governments around the world stepped in and adopted a series of extraordinary
measures, which would have been unimaginable only months previously. Many countries
increased the coverage of their deposit insurance schemes and moved away from co-insurance.
They guaranteed newly issued bank bonds or announced blanket guarantees for all bank
liabilities. They injected capital, in some cases to such an extent that they actually became the
majority owners or squeezed out shareholders. They ring-fenced, swapped and transferred toxic
assets, extended non-recourse loans and replaced private investors in illiquid markets.
Governments pursued this policy partly through ad hoc measures, but increasingly by
implementing explicit schemes, the US Troubled Assets Relief Program (TARP) being the
largest (USD 700 billion) and most prominent.
3 Discussion of support measures This section discusses the various types of measures used during the crisis. Each sub-section
considers a different type of measure. It should be noted that these measures to support banks
4 Ben Bernanke, Fed Chairman, testimony before the Committee on Oversight and Government Reform, 25 June 2009
3
4
have typically been used in combination. By way of example, Box 1 shows how these measures
were combined in the case of the ING rescue. However, the actual use of measures has
generally followed an observable sequence, whereby support has been provided to banks
on the liabilities side before the assets side of their balance sheets has been relieved. Hoggart
and Reidhill (2003) argue that this is in line with the immediate objective of the authorities of
restoring public confidence in order to avoid bank runs. Furthermore, governments had
recourse to ad hoc measures for individual banks when the crisis erupted, but shifted to
setting up system-wide schemes, as the crisis persisted and intensified. In this section, we
first review central bank actions, before going on to consider government measures.
Box 1. The ING rescue package
The rescue package for ING comprised recapitalisations, government guarantees and asset relief measures. In sum, ING received EUR 10 billion in capital, EUR 17 billion in government-guaranteed bonds and asset guarantees on an Alt-A portfolio of EUR 27 billion, of which the government-guaranteed 80%, i.e. EUR 21 billion. Capital injections In October 2008 the Dutch State purchased EUR 10 billion worth of subordinated bonds to bolster the bank’s Tier 1 capital. The bonds had an issue price of EUR 10, based on the closing share price on 16 October, and pay non-cumulative coupons linked to the dividends on ordinary shares.1 The rate of return is fixed at an annual coupon of 8.5%, but rises if the dividends on ordinary shares exceed 8.5% (110% of dividends in 2009, 120% in 2010 and 125% in 2011). The link to dividends on ordinary shares and the step-up provides an incentive to repay taxpayers money and thus represents a viable exit strategy. Exit of the government is further facilitated by a call option on the bonds, whereby ING is entitled to buy back the bonds at any time for 150% of the issue price. ING also has the option to convert the bonds into ordinary shares after three years. If conversion is chosen, ING can repurchase the shares at the issue price, which serves to protect taxpayers’ money. All coupon payments need to be approved by De Nederlandsche Bank. Shareholders rights are not diluted and the government does not obtain any voting rights, although it has the right to appoint two out of twelve supervisory Board Members. In December 2009, ING made use of an early repayment option to repurchase EUR 5 billion of core Tier 1 securities at the issue price. In addition, ING paid EUR 259 million for accrued coupons and a premium of EUR 346 million. The repayment was financed through a EUR 7.5 billion rights issue. Asset support On 26 January 2009, a back-up facility was granted to ING, in relation to its Alt-A securitised mortgage portfolio. The government agreed to share 80% of losses and profits on a portfolio of EUR 26.77 billion. The value of the portfolio had previously been written down from USD 39 billion to USD 35.1 billion (equivalent to EUR 26.77 billion). ING pays the Government a fee for the guarantee, while the government pays ING a management and funding fee. However, ING remains the legal owner of the portfolio. Accordingly, ING’s risk-weighted assets were reduced by EUR 15 billion, increasing ING’s core Tier 1 ratio by 32 basis points to 7.4%. The annual guarantee fee consists of a fixed amount plus a percentage of the payments received on the securities. Government-guaranteed bonds In addition, ING obtained EUR 17 billion of government bond guarantees. The bonds are mainly denominated in USD. Their maturity at issuance is between 1.5 and 5 years. About EUR 9 billion of the bonds will mature in February 2012.
5
Restructuring As a consequence of the substantial government support received, ING is among the banks required to undergo a restructuring procedure enforced by the European Commission (see Box 3). The restructuring involves the break-up of ING, which will have to sell off its insurance and investment management business. Compared with before the bailout, ING’s balance sheet will shrink considerably. 1. The share price of ING dropped by 27% on 17 October 2008, and thus 16 October was chosen as the basis for the issue price.
3.1 Central bank measures Early on in the crisis, it became clear that the provision of central bank liquidity was paramount
to support banks when liquidity in the market dried up. A primary reason for the freeze in the
money market was a lack of confidence, owing to the uncertainty regarding banks’ exposure to
subprime assets and structured products, and the perceived rise in counterparty risk (see
Committee on the Global Financial System, 2008). As a reflection of this lack of confidence, the
spreads between the three-month deposit and overnight swap rates, which were already at
elevated levels, soared during September 2008 (see European Central Bank, 2008).
Central banks had already lowered their policy rates as the substantial and rapid deterioration in
the financial market conditions and the macroeconomic environment had changed the outlook
for price stability, with inflation risks declining and deflation risks emerging both in the euro
area as well as globally. In response to the intensification of the crisis, central banks additionally
adopted various measures to enhance liquidity provision to banks, which can be broadly divided
into traditional and nonstandard categories.5 At the onset of the crisis, the measures adopted
consisted of traditional market operations, outside the regular schedule or of larger amounts, to
keep short-term money-market rates close to policy rates (see Committee on the Global Financial
System, 2008).6
When these measures proved insufficient to reduce funding pressures and the widening spread
between overnight and term interbank lending rates, central banks implemented changes to their
operational framework. These changes included, inter alia, more frequent auctions, an
expansion of the volume of lending facilities, longer-term financing, changes in the
5 The distinction between standard and non-standard measures varies across central banks owing to different traditions, frameworks and financial system structures. 6 For example, the ECB started to conduct supplementary liquidity-providing longer-term refinancing operations on 12 September 2007 with the objective to support the normalisation of the euro money market. See http://www.ecb.int/press/pr/date/2007/html/pr070906_1.en.html.
auctioning process, a broadening of the range of accepted collateral, outright asset
purchases and the setting up of liquidity facilities for intermediaries other than banks.7
In addition, the large central banks coordinated some of their actions.8 This cooperation was
reflected in the joint announcement to provide term funding and to enter into temporary swap
agreements to obtain foreign currency liquidity, which they passed on to the financial sector.9 In
the following sub-section, the non-standard measures taken by the Eurosystem, the Federal
Reserve System and the Bank of England are described in more detail.
3.1.1 The Eurosystem10 While it was sufficient to adjust the operational framework in the first year of the crisis (i.e. with
more frequent fine-tuning operations and supplementary longer-term refinancing operations with
maturities of three months, and subsequently also six months), the Eurosystem decided to adopt
non-standard measures in response to the intensification of the crisis after Lehman Brothers
collapsed. Hence, in October 2008 the Eurosystem changed the procedures for the
implementation of monetary policy by carrying out its main refinancing operations through a
fixed-rate full allotment tender procedure (see European Central Bank, 2009). In addition, the
Eurosystem temporarily reduced the corridor of the standing facilities to 100 basis points until
7 The ECB widened its pool of eligible collateral to include marketable and non-marketable securities with a rating of at least “BBB-”, but applied additional credit-risk haircuts to debt securities with a rating below “A-”. See http://www.ecb.europa.eu/ecb/legal/pdf/l_31420081125en00140015.pdf. 8 Since the coordinated actions taken in December 2007, the G-10 central banks have continued to work together closely and to consult regularly on liquidity pressures in funding markets. 9 For instance, in December 2007 the ECB launched (in cooperation with the Federal Reserve System and other major central banks) US dollar liquidity providing operations, against collateral eligible for Eurosystem credit operations, in connection with the Federal Reserve System’s US dollar Term Auction Facility. The Federal Reserve System provided the US dollars to the ECB by means of a temporary swap line, and the Eurosystem passed on these US dollars to its counterparties in repo operations. In addition, on 15 October 2008 the ECB and the Swiss National Bank jointly announced that they would start providing Swiss Franc liquidity to their counterparties via EUR/CHF foreign exchange swap operations. On 10 May 2010, the ECB announced to reactivate the temporary US Dollar liquidity swap lines with the Federal Reserve which started on the following day. The liquidity swap lines with the Fed and the Swiss National Bank had been discontinued in January 2010. 10 More details on the implementation of monetary policy by the Eurosystem in response to the financial market tensions can be found in the article entitled “The implementation of monetary policy since August 2007” in the July 2009 issue of the ECB’s Monthly Bulletin.
Chart 1. Securities held by the Eurosystem for
monetary policy purposes
(EUR billions)
6
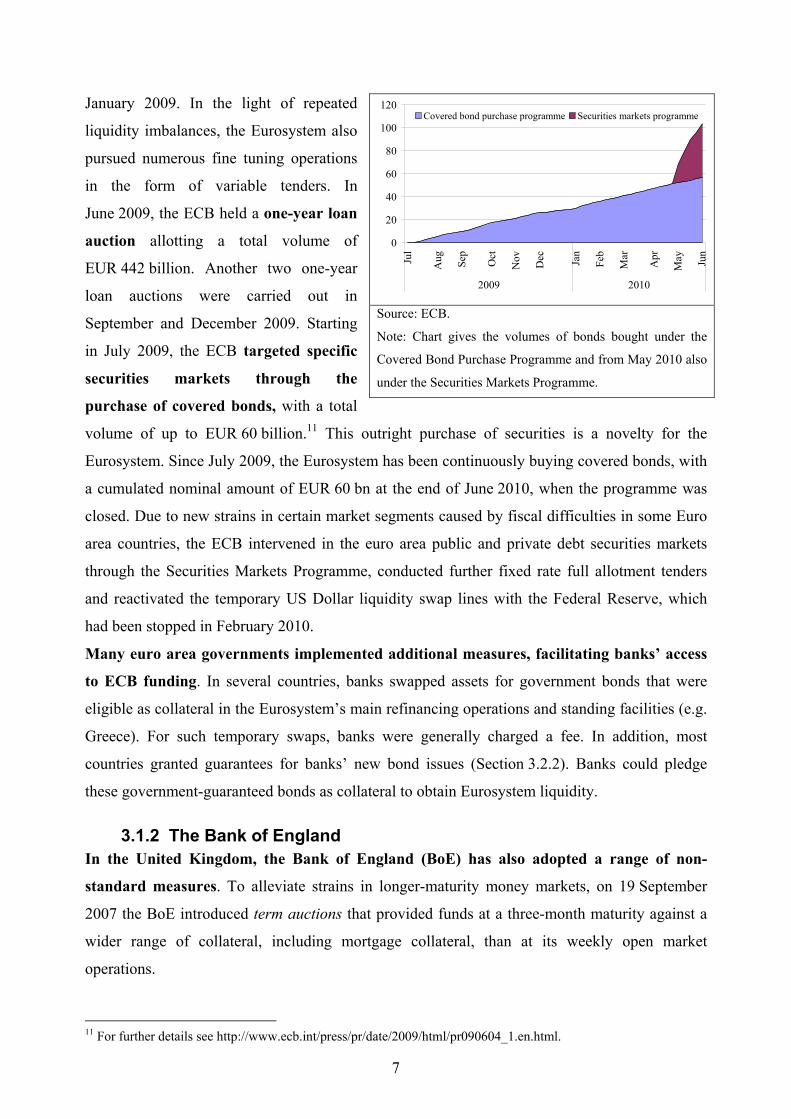
January 2009. In the light of repeated
liquidity imbalances, the Eurosystem also
pursued numerous fine tuning operations
in the form of variable tenders. In
June 2009, the ECB held a one-year loan
auction allotting a total volume of
EUR 442 billion. Another two one-year
loan auctions were carried out in
September and December 2009. Starting
in July 2009, the ECB targeted specific
securities markets through the
purchase of covered bonds, with a total
volume of up to EUR 60 billion.11 This outright purchase of securities is a novelty for the
Eurosystem. Since July 2009, the Eurosystem has been continuously buying covered bonds, with
a cumulated nominal amount of EUR 60 bn at the end of June 2010, when the programme was
closed. Due to new strains in certain market segments caused by fiscal difficulties in some Euro
area countries, the ECB intervened in the euro area public and private debt securities markets
through the Securities Markets Programme, conducted further fixed rate full allotment tenders
and reactivated the temporary US Dollar liquidity swap lines with the Federal Reserve, which
had been stopped in February 2010.
Many euro area governments implemented additional measures, facilitating banks’ access
to ECB funding. In several countries, banks swapped assets for government bonds that were
eligible as collateral in the Eurosystem’s main refinancing operations and standing facilities (e.g.
Greece). For such temporary swaps, banks were generally charged a fee. In addition, most
countries granted guarantees for banks’ new bond issues (Section 3.2.2). Banks could pledge
these government-guaranteed bonds as collateral to obtain Eurosystem liquidity.
3.1.2 The Bank of England In the United Kingdom, the Bank of England (BoE) has also adopted a range of non-
standard measures. To alleviate strains in longer-maturity money markets, on 19 September
2007 the BoE introduced term auctions that provided funds at a three-month maturity against a
wider range of collateral, including mortgage collateral, than at its weekly open market
operations.
11 For further details see http://www.ecb.int/press/pr/date/2009/html/pr090604_1.en.html.
0
20
40
60
80
100
120
Jul
Aug Sep
Oct
Nov Dec Jan
Feb
Mar
Apr
May Jun
2009 2010
Covered bond purchase programme Securities markets programme
Source: ECB.
Note: Chart gives the volumes of bonds bought under the
Covered Bond Purchase Programme and from May 2010 also
under the Securities Markets Programme.
7
In January 2009 the BoE set up an Asset Purchase Facility (APF) to buy up to
GBP 250 billion of high-quality assets.12 GBP 50 billion may be purchased finance by the issue
of Treasury bills and the Debt Management Office’s cash management operations, and
GBP 200 billion were to be purchased by the creating of central bank reserves. The aim of the
facility was to improve liquidity in credit markets by buying UK government securities (gilts),
commercial paper and corporate bonds. An indemnity was provided by the government to cover
any losses arising from the facility. Via the APF and through the creation of central bank
reserves, the BoE bought GBP 200 billion of assets and decided in February 2010 to maintain
this stock of asset purchases. More than 99 percent of the assets purchased were UK government
securities (gilts), the remainder being corporate bonds. The BoE did not buy commercial paper.13
The APF continues to operate its facilities for commercial paper and corporate bonds, with
purchases financed by the issue of Treasury bills and the Debt Management Office’s cash
management operations. By 24 June 2010, GBP 51 million of commercial paper and
GBP 351 million of corporate bonds had been bought. Apart from the purchase programs for
gilts, corporate bonds, and commercial paper, the APF also comprises a Credit Guarantee
Scheme (CGS), which offers to make small purchases of bonds issued by banks under the UK
Treasury’s Credit Guarantee Scheme. To date, this facility has not been used. On 3 August 2009
the BoE launched, also through the APF, a Secured Commercial Paper (SCP) Facility, which
enables investment-grade GBP asset-backed commercial paper securities that support the
financing of working capital to be purchased in both the primary and secondary markets. No
purchases had been made as at the end of June 2010. Finally, a Supply Chain Finance Facility is
currently being planned. This facility is intended to provide working-capital financing to the
suppliers of investment-grade companies.
12 The APF was initially authorised by the UK Treasury to purchase up to a total of GBP 50 billion of private sector assets financed by Treasury bills, thereby ensuring neutrality with respect to monetary policy. The scope of the APF was also designed so as to enable the Facility to be used by the Monetary Policy Committee (MPC) as a monetary policy tool, by financing purchases by issuing central bank reserves. For this purpose, the Facility was authorised to purchase up to GBP 150 billion, of which up to GBP 50 billion was to be used to purchase private sector assets. The MPC voted at its March 2009 policy meeting for the Facility to purchase GBP 75 billion of assets financed by the issuance of central bank reserves. The MPC subsequently voted at its May 2009 policy meeting to increase this to a total GBP 125 billion of assets. The MPC voted for two further increases to its asset purchase programme in 2009. At its meeting in August, the MPC decided to finance a further GBP 50 billion of asset purchases so that total purchases would rise to GBP 175 billion. And at its meeting in November, the MPC voted to increase total asset purchases to GBP 200 billion. At its meeting in February 2010, the MPC voted to maintain the stock of asset purchases at GBP 200 billion but the MPC will continue to monitor the appropriate scale of the asset purchase programme and further purchases would be made should the outlook warrant them. The latest figures for asset purchases are available at http://www.bankofengland.co.uk/markets/apf/results.htm. 13 Purchases of assets were undertaken by a subsidiary of the BoE, the BoE Asset Purchase Facility Fund Limited (BEAPFF). The BEAPFF borrowed from the BoE to pay for the purchases. Hence, the lending to the BEAPFF, rather than the purchased securities, appears as an asset in the BoE's balance sheet.
8
In addition, on 21 April 2009 the BoE launched a swap scheme. The Special Liquidity
Scheme allows banks to temporarily swap their high-quality mortgage-backed and other
securities for UK Treasury bills for up to three years. Haircuts apply, and margins are calculated
daily. The Scheme was designed to finance part of the overhang of illiquid assets on banks'
balance sheets by exchanging them temporarily for more easily tradable assets.
3.1.3 The Federal Reserve System In the United States, the Federal Reserve System (the Fed) has adopted a range of non-
standard measures in response to the current financial crisis. These measures are reflected in
the establishment of several separate facilities that target specific financial institutions or market
segments. Appendix 1 provides the details of these measures including the amounts committed
and extended under each of the facilities.
The bulk of the measures (in terms of volumes) target financial institutions. The most
important innovation was the introduction of the Term Auction Facility (TAF), which allowed
the Federal Reserve System to relieve pressures in short-term funding markets by auctioning
term funds to depository institutions against full collateral. In addition, the Term Asset-backed
Securities Loan Facility (TALF) was set up to help market participants meet the credit needs of
households and small businesses by supporting the issuance of asset-backed securities (ABSs).
Under the TALF, the Federal Reserve System set up an SPV to buy up to USD 1,000 billion of
ABSs, granting the borrowers one and three-year loans; in exceptional cases, loans for up to
five years were granted.14 The SPV is partially funded through the US Treasury’s Troubled
Assets Relief Program (TARP), which has purchased USD 20 billion of subordinated debt issued
by the SPV.
Another important novelty for the Fed was the outright purchase of securities issued by
government-sponsored enterprises (GSEs) and of mortgage-backed securities (MBSs)
guaranteed by GSEs, acquired via open market operations. The aim was to support the
mortgage market, and the volumes involved were large: as of 28 April 2010, they amounted to
USD 196 billion and USD 1,096 billion for GSE securities and MBSs, respectively. These
securities are held in the System Open Market Account (SOMA), which is managed by the
Federal Reserve Bank of New York.
The Federal Reserve System also took measures to restore liquidity in short-term debt
markets. The Commercial Paper Funding Facility (CPFF) is a limited liability company (LLC)
14 The amount originally committed under TALF was USD 200 billion. This was increased to USD 1,000 billion in May 2009.
9
that provides a liquidity backstop to US issuers of commercial paper and was intended to
contribute to the liquidity in the short-term paper market. The Money Market Investor Funding
Facility (MMIFF) was specifically designed to restore liquidity in the money-market and
particularly the liquidity of money market funds.15 Both the CPFF and the MMIFF aimed to
increase the availability of credit for businesses and households through a revival of short-term
debt markets. Like the MMIFF, the Asset-backed Commercial Paper Money Market Mutual
Fund Liquidity Facility (AMLF) has the objective of facilitating the sale of assets by money-
market mutual funds in the secondary market to increase their liquidity.16
Two further facilities introduced in March 2009 in support of primary dealers were: (i) the
Term Securities Lending Facility (TSLF), an expansion of the Federal Reserve System’s
securities lending program, under which up to USD 200 billion of treasury securities were lent to
primary dealers and secured for a month (rather than overnight, as under the existing program)
by a pledge of other securities as collateral17; and (ii) the Primary Dealer Credit Facility
(PDCF), which provides overnight funding to primary dealers in exchange for a specified range
of collateral, thereby improving the ability of primary dealers to provide financing to participants
in securitisation markets.
The Federal Reserve System has also supported some financial institutions directly. The so-
called Maiden Lane (M-L) transactions involved three separate Limited Liability Companies
(LLCs), which acquired assets from Bear Stearns (ML-I) and AIG (ML-II, and ML-III).18 The
Federal Reserve System provided USD 72.8 billion in senior loans to the LLCs. After the
repayment of the loans, any remaining proceeds from ML-I are paid to the Federal Reserve
System and, in the cases of ML-II and ML-III, shared between the Federal Reserve System and
AIG. The transactions thus resemble those of a so-called bad bank, which transfer assets off the
institutions’ balance sheets. The Federal Reserve System also made a lending facility available
to AIG in September 2008. In addition, the Federal Reserve System contributed to a ring-fencing
agreement with Citigroup, which also involved the US Treasury and the Federal Deposit
Insurance Corporation (FDIC), by committing to extend a non-recourse loan should the losses on
15 The facility became operational in November 2008 and expired in October 2009. 16 The AMLF was established shortly after the default of Lehman Brothers on 19 September 2008 and will be in effect until February 2010. 17 The Open Market Trading Desk of the Federal Reserve Bank of New York auctioned general Treasury collateral (Treasury bills, notes, bonds and inflation-indexed securities) held by SOMA for loan against all collateral eligible for tri-party repurchase agreements arranged by the Open Market Trading Desk under Schedule 1 and, separately, against Schedule 1 collateral and investment grade corporate securities, municipal securities, mortgage-backed securities, and asset-backed securities under Schedule 2. 18 The two Maiden Lane transactions involving AIG differ in terms of the acquired asset pools. ML-II involved the purchase of residential mortgage-backed securities and ML-III the purchase of multi-sector collateralised debt obligations.
10
the specified asset pool exceed a certain threshold.19 The Fed did not extended credit to
Citigroup under this agreement. The US Treasury, the FDIC and the Fed terminated this
agreement on 23 December 2009. Finally, on 16 January 2009 the Fed, together with the US
Treasury and the FDIC, agreed to provide support to Bank of America, involving a ring-fencing
arrangement on a pool of assets. However, following the release of the results of the Supervisory
Capital Assessment Program, the support package was abandoned without having been
implemented, and Bank of America paid an exit fee of USD 425 billion, out of which
USD 57 billion was allocated to the Fed.
The Federal Reserve System has already implemented an exit from most of the facilities. In
June 2009, the Federal Reserve System announced its intention to scale back its commitments
under the TSLF from USD 200 billion to USD 75 billion. Further to this, the amounts auctioned
at the TAF’s biweekly auctions were gradually decreased, given the reduced demand for this
facility.20 The final auction under TAF was conducted in March 2010 and credit extended under
that auction matured in April 2010. As a result of improving market conditions, the Fed ended
the AMLF, TSLF, PDCF and the CPFF. All loans under the programmes have been repaid and
all commercial paper holdings under CPFF had matured by April 2010. In addition, the MMIFF,
which had not been drawn upon, expired on 30 October 2009. With regard to TALF, the offering
of loans against newly issued ABS and legacy CMBS was discontinued on 31 March 2010 while
loans against newly issued CMBS continue until 30 June 2010. Finally, the Federal Reserve
System withdrew the programme to guarantee newly issued bank debt securities in
October 2009.
The different measures vary to with respect to their implication for the Federal Reserve
System’s profitability but so far have not incurred a loss. The investments in GSE securities
and in MBSs guaranteed by the GSEs contributed about USD 36 billion of net earnings of
SOMA from January 2009 to March 2010. In addition, the loan programs (AMLF, PDCF,
TALF, and the credit line to AIG) earned USD 5.2 billion over the period, which translates into
USD 2.6 billion net of provisions for loan restructuring. TAF earned USD 0.8 billion in the same
period. However, while the Fed earned a combined profit of USD 8.4 billion on the consolidated
LLCs (CPFF, ML-I, ML-II, and ML-III), the picture is more mixed with regard to the income
19 The loss-sharing arrangement is complex: Citigroup will cover the first USD 39.5 billion of losses on an asset pool of USD 301 billion; the U.S. Treasury will absorb 90% of the second loss tranche up to USD 5 billion, with Citigroup covering the remainder; the FDIC will absorb 90% of the third loss tranche up to USD 10 billion, with Citigroup covering the remainder; should even higher losses materialise, the Federal Reserve will extend a non-recourse loan to cover the rest of the asset pool, with Citigroup being required to immediately repay 10% of such losses to the Federal Reserve. 20 The TAF auctions were reduced from USD 150 billion to USD 125 billion in July 2009, to USD 100 billion in August 2009 and to USD 75 billion in September 2009.
11
12
sources: while all LLCs earned sizable interest income, the ML LLCs suffered from losses on
their portfolio holdings in 2009, which could only be recouped during the first quarter of 2010.21
In sum, some of the non-standard measures involved sizeable risks for the Federal Reserve
System.
3.1.4 Comparison between the Eurosystem, the Bank of England, and the Federal Reserve System
The efforts undertaken by central banks are reflected in the expansion of their balance
sheets. Chart 2 shows the main components of the balance sheets of the Eurosystem, the Bank of
England, and the US Federal Reserve System. Starting in Spring 2008, the Federal Reserve
System extended its term auction facilities and repo business, albeit offsetting the effect on its
balance sheet by reducing the portfolio of securities it held outright. In September 2008,
however, the Federal Reserve System gave up its sterilisation policy and allowed its balance
sheet to more than double in size. Likewise, owing to repo transactions and lending to the
BEAPFF, the Bank of England doubled the size of its balance sheet. By October 2008 it had
even allowed it to triple in size. In contrast, the Eurosystem’s balance sheet has been expanded to
a lesser extent.
21 These figures are taken from the Federal Reserve System Monthly Report on Credit and Liquidity Programs and the Balance Sheet. Profits and losses refer to the four quarters of 2009 and the first quarter in 2010.
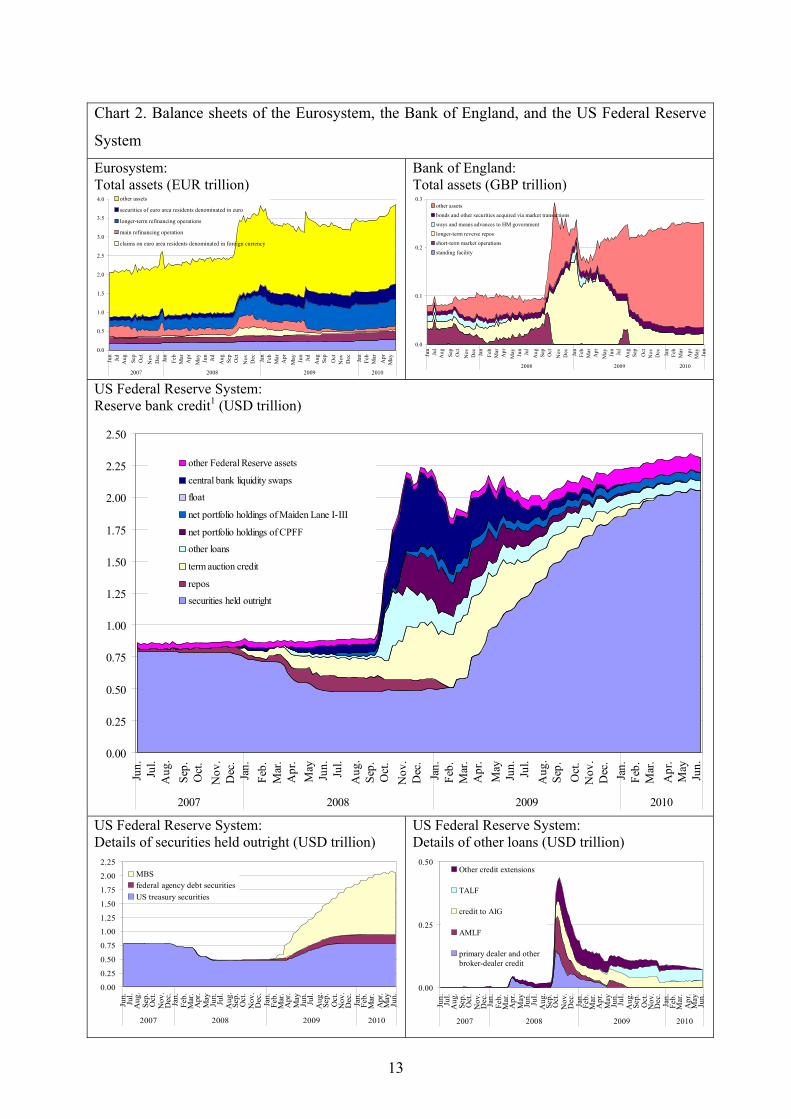
Chart 2. Balance sheets of the Eurosystem, the Bank of England, and the US Federal Reserve
System
Eurosystem: Total assets (EUR trillion)
0.0
0.5
1.0
1.5
2.0
2.5
3.0
3.5
4.0
Jun
Jul
Aug Se
pO
ctN
ov Dec Jan
Feb
Mar
Apr
May Jun
Jul
Aug Se
pO
ctN
ov Dec Jan
Feb
Mar
Apr
May Jun
Jul
Aug Se
pO
ctN
ov Dec Jan
Feb
Mar
Apr
May
2007 2008 2009 2010
other assets
securities of euro area residents denominated in euro
longer-term refinancing operations
main refinancing operation
claims on euro area residents denominated in foreign currency
Bank of England: Total assets (GBP trillion)
0.0
0.1
0.2
0.3
Jun
Jul
Aug Sep
Oct
Nov Dec Jan
Feb
Mar
Apr
May Jun
Jul
Aug Sep
Oct
Nov Dec Jan
Feb
Mar
Apr
May Jun
Jul
Aug Sep
Oct
Nov Dec Jan
Feb
Mar
Apr
May Jun
2008 2009 2010
other assets
bonds and other securities acquired via market transactions
ways and means advances to HM government
longer-term reverse repos
short-term market operations
standing facility
US Federal Reserve System: Reserve bank credit1 (USD trillion)
0.00
0.25
0.50
0.75
1.00
1.25
1.50
1.75
2.00
2.25
2.50
Jun. Jul.
Aug
.Se
p.O
ct.
Nov
.D
ec.
Jan.
Feb.
Mar
.A
pr.
May
Jun. Jul.
Aug
.Se
p.O
ct.
Nov
.D
ec.
Jan.
Feb.
Mar
.A
pr.
May
Jun. Jul.
Aug
.Se
p.O
ct.
Nov
.D
ec.
Jan.
Feb.
Mar
.A
pr.
May
Jun.
2007 2008 2009 2010
other Federal Reserve assets
central bank liquidity swaps
float
net portfolio holdings of Maiden Lane I-III
net portfolio holdings of CPFF
other loans
term auction credit
repos
securities held outright
US Federal Reserve System: Details of securities held outright (USD trillion)
0.00
0.25
0.50
0.75
1.00
1.25
1.50
1.75
2.00
2.25
Jun.
Jul.
Aug
.Se
p.O
ct.
Nov
.D
ec.
Jan.
Feb.
Mar
.A
pr.
May
Jun.
Jul.
Aug
.Se
p.O
ct.
Nov
.D
ec.
Jan.
Feb.
Mar
.A
pr.
May
Jun.
Jul.
Aug
.Se
p.O
ct.
Nov
.D
ec.
Jan.
Feb.
Mar
.A
pr.
May
Jun.
2007 2008 2009 2010
MBSfederal agency debt securitiesUS treasury securities
US Federal Reserve System: Details of other loans (USD trillion)
0.00
0.25
0.50
Jun.
Jul.
Aug
.Se
p.O
ct.
Nov
.D
ec.
Jan.
Feb.
Mar
.A
pr.
May
Jun.
Jul.
Aug
.Se
p.O
ct.
Nov
.D
ec.
Jan.
Feb.
Mar
.A
pr.
May
Jun.
Jul.
Aug
.Se
p.O
ct.
Nov
.D
ec.
Jan.
Feb.
Mar
.A
pr.
May
Jun.
2007 2008 2009 2010
Other credit extensions
TALF
credit to AIG
AMLF
primary dealer and otherbroker-dealer credit
13
1. Reserve bank credit accounts for about 99% of the Federal Reserve System’s balance sheet.
Sources: Federal Reserve System, Bank of England, European Central Bank and ECB calculations.
The difference can partly be attributed to the specific features of the respective financial systems
and to different operational frameworks, i.e. the number of eligible institutions with access to the
Fed’s facilities vis–à-vis the Eurosystem that require different actions.22 In addition, differences
are partly due to the fact that national governments remain responsible for fiscal policies in
Europe.
The most important difference between Europe and the United States is the fact that the
Federal Reserve System has been supporting individual institutions, while the
Eurosystem’s and the BoE’s role has been limited to liquidity extension.
Another important difference in the policies adopted lies in the extent of repurchase
agreements and outright purchases of securities. In contrast to the Federal Reserve System,
both the Eurosystem and the BoE have used repurchase agreements extensively. However, while
the Eurosystem is active only in the covered bonds market, and only to a very limited extent, the
Federal Reserve System’s strategy is partly based on large-scale outright purchases of
government bonds and private sector securities. The BoE also buys securities outright, but limits
its acquisitions mostly to government bonds. In addition, a government indemnity shields it from
any losses resulting from these investments. As at the Federal Reserve System, the BoE allowed
these purchases to increase reserve balances.
3.2 Government measures Central banks have not acted alone in attempting to stem the effects of the crisis. Governments
also came to the rescue of financial institutions, in particular after Lehman Brothers collapsed. In
this sub-section, we outline general aspects of the institutional set-up for government measures,
before discussing chronologically the various measures that have been implemented during the
crisis.
3.2.1 General aspects
Institutions involved, eligibility, and conditionality The management of the support measures varies widely across countries, with the number
of institutions involved differing from country to country (see Table 8 in Appendix 2 for
details). At one extreme, all measures have been handled by a single institution (as in the case of
Germany), while in other countries separate institutions have been responsible for different 22 Mr. Trichet in a speech at the University of Munich, 13 June 2009. The IMF makes the same point in a recent publication: Fiscal Implications of the Global Economic and Financial Crisis, IMF staff position note SPN/09/13).
14
measures. Typically, the measures have been implemented by Ministries of Finance, but with the
involvement of the national central bank and/or the supervisory authority.
The support measures have typically applied to financial institutions operating in a country and
to foreign subsidiaries with substantial domestic operations. Support has typically been provided
upon request from a financial institution, although, in a number of cases, banks have also been
instructed to accept government support (for example in the United States and France).
Similar conditions for all types of support measures have been implemented in all countries
and typically involve restrictions on dividend payments, regular reporting on business
developments, restructuring requirements, government participation in banks’ management, and
restrictions on executive compensation. In addition, government support in some cases also
entailed explicit targets for lending growth, with the objective of maintaining the supply of credit
to the economy (for example in France, Ireland, and the UK).
Ad hoc measures vs national schemes At the outset, the financial turmoil manifested itself at the level of individual financial
institutions, and governments, therefore, had recourse to ad hoc measures tailored to the needs of
these institutions. As the crisis intensified, however, in October 2008 and it became clear that
interventions had to be extended to a larger number of banks, more comprehensive schemes were
adopted in a number of countries. One of the first schemes was the Troubled Assets Relief
Program, better known by the acronym TARP (outlined in Appendix 1). As the crisis deepened,
other countries began to establish financial support schemes, for example the Financial Market
Stabilisation Fund (SoFFin) in Germany on 17 October 2008. The distinguishing feature of
these schemes was that they established a more transparent system through which banks
could obtain financial support. More specifically, transparency was provided by the overall
commitment of governments to support the financial system. Typically, the schemes also had
specific criteria for eligibility, pricing, and the duration of support measures available under the
schemes.
While ad hoc measures can be, and were, implemented rapidly and flexibly, the advantage
of national schemes is threefold. First, national schemes have often considerably increased
transparency in comparison with ad hoc measures. The degree of transparency and
accountability involved in support to the financial system is important and largely depends on
the institutional framework. This was highlighted by the uncertainty caused in the United States
by the decisions to intervene in the case of Bear Stearns and American International Group but
not in that of Lehman Brothers (see Taylor, 2008). Clarity of the support criteria signals to the
wider public that the government stands ready to curb the crisis from widening and is important
15
to stabilise confidence. More generally, clear and transparent support measures for banks,
combined with strict conditions, may contribute to the success of banks’ restructuring. In sum,
the advantage of an explicit scheme resides in transparency regarding the institutions eligible, the
volume of support available, the pricing and the duration.
Second, national schemes are less likely to distort competition within and across countries
than ad hoc measures. There is a risk that support measures will distort the level playing field.
This may be the case both within a single country and across countries. This international
dimension is particularly relevant for Europe, owing to its high degree of financial integration.
To limit this danger, European countries agreed on a concerted action plan (see Box 2 for
details). They committed themselves to adhere to certain principles in their crisis response
measures so that “the European Union as a whole can act in a united manner and avoid that
national measures adversely affect the functioning of the single market and the other member
States.”23
Third, in the European context, approval of a particular measure by the European
Commission (EC) may be simpler if it is part of a national scheme. In the European Union,
national intervention requires approval by the EC, which aims to ensure that the measures do not
distort competition (see Box 3). Each individual measure requires approval, while measures that
are part of a scheme are typically subject to the scheme’s approval. This represents a further
advantage of explicit schemes over ad hoc measures. Generally, the EC assesses the eligibility of
institutions, the volume of support and the pricing to ensure a level playing field. However,
possible delays in the approval of government support measures may cause considerable concern
over the effectiveness of the measures and the deterioration of the situation of the bank or banks
under consideration. That said, approval by the EC has typically been rapid. In a number of
cases, however, considerable delays have occurred when restructuring requirements entailed
lengthy negotiations with the national authorities. This was an issue in particular for the few
cases that involved support by several governments for the same institution, i.e. Dexia and Fortis
(see Box 4). The EC extended approvals for capital injections for a period of six months, after
which the decision were to be reappraised, on the basis of a progress report (EC, 2009). In
August 2009, the EC clarified the framework for its examination of viability and restructuring
plans of banks, which are to be submitted following the provision of state aid (see Box 3).24 In
23 Declaration of the emergency summit of euro area heads of government in Paris on 12 October 2008. The declaration is available at http://www.eu2008.fr/PFUE/lang/en/accueil/PFUE-10_2008/PFUE-12.10.2008/sommet_pays_zone_euro_declaration_plan_action_concertee.html. 24 The communication “The return to viability and the assessment under the State aid rules of restructuring measures in the financial sector in the current crisis” was published on 22 July 2009. The adoption of the Communication was finalised through its publication in the Official Journal.
16
particular, the EC takes into account: (i) the past practice of the EC; (ii) the global scale of the
present crisis; (iii) the systemic role of the banking sector for the whole economy; and (iv) the
possible systemic effects arising from the need for a number of banks to restructure within the
same period.
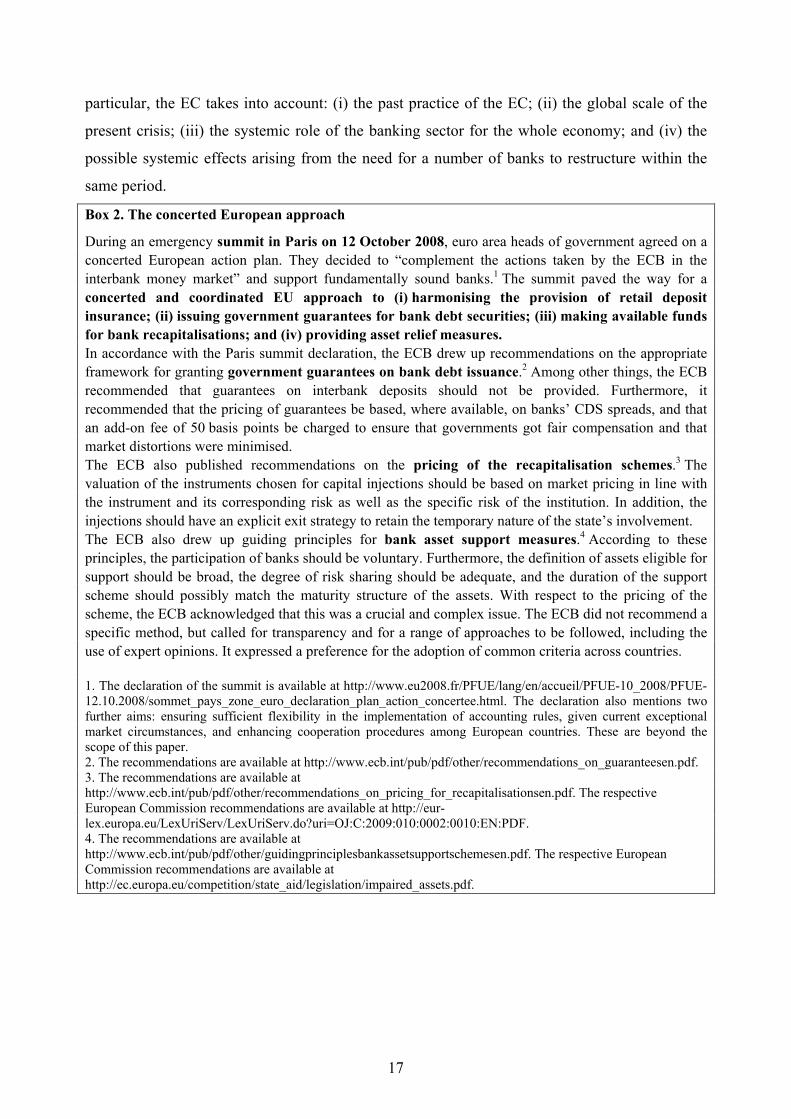
Box 2. The concerted European approach
During an emergency summit in Paris on 12 October 2008, euro area heads of government agreed on a concerted European action plan. They decided to “complement the actions taken by the ECB in the interbank money market” and support fundamentally sound banks.1 The summit paved the way for a concerted and coordinated EU approach to (i) harmonising the provision of retail deposit insurance; (ii) issuing government guarantees for bank debt securities; (iii) making available funds for bank recapitalisations; and (iv) providing asset relief measures. In accordance with the Paris summit declaration, the ECB drew up recommendations on the appropriate framework for granting government guarantees on bank debt issuance.2 Among other things, the ECB recommended that guarantees on interbank deposits should not be provided. Furthermore, it recommended that the pricing of guarantees be based, where available, on banks’ CDS spreads, and that an add-on fee of 50 basis points be charged to ensure that governments got fair compensation and that market distortions were minimised. The ECB also published recommendations on the pricing of the recapitalisation schemes.3 The valuation of the instruments chosen for capital injections should be based on market pricing in line with the instrument and its corresponding risk as well as the specific risk of the institution. In addition, the injections should have an explicit exit strategy to retain the temporary nature of the state’s involvement. The ECB also drew up guiding principles for bank asset support measures.4 According to these principles, the participation of banks should be voluntary. Furthermore, the definition of assets eligible for support should be broad, the degree of risk sharing should be adequate, and the duration of the support scheme should possibly match the maturity structure of the assets. With respect to the pricing of the scheme, the ECB acknowledged that this was a crucial and complex issue. The ECB did not recommend a specific method, but called for transparency and for a range of approaches to be followed, including the use of expert opinions. It expressed a preference for the adoption of common criteria across countries. 1. The declaration of the summit is available at http://www.eu2008.fr/PFUE/lang/en/accueil/PFUE-10_2008/PFUE-12.10.2008/sommet_pays_zone_euro_declaration_plan_action_concertee.html. The declaration also mentions two further aims: ensuring sufficient flexibility in the implementation of accounting rules, given current exceptional market circumstances, and enhancing cooperation procedures among European countries. These are beyond the scope of this paper. 2. The recommendations are available at http://www.ecb.int/pub/pdf/other/recommendations_on_guaranteesen.pdf. 3. The recommendations are available at http://www.ecb.int/pub/pdf/other/recommendations_on_pricing_for_recapitalisationsen.pdf. The respective European Commission recommendations are available at http://eur-lex.europa.eu/LexUriServ/LexUriServ.do?uri=OJ:C:2009:010:0002:0010:EN:PDF. 4. The recommendations are available at http://www.ecb.int/pub/pdf/other/guidingprinciplesbankassetsupportschemesen.pdf. The respective European Commission recommendations are available at http://ec.europa.eu/competition/state_aid/legislation/impaired_assets.pdf.
17
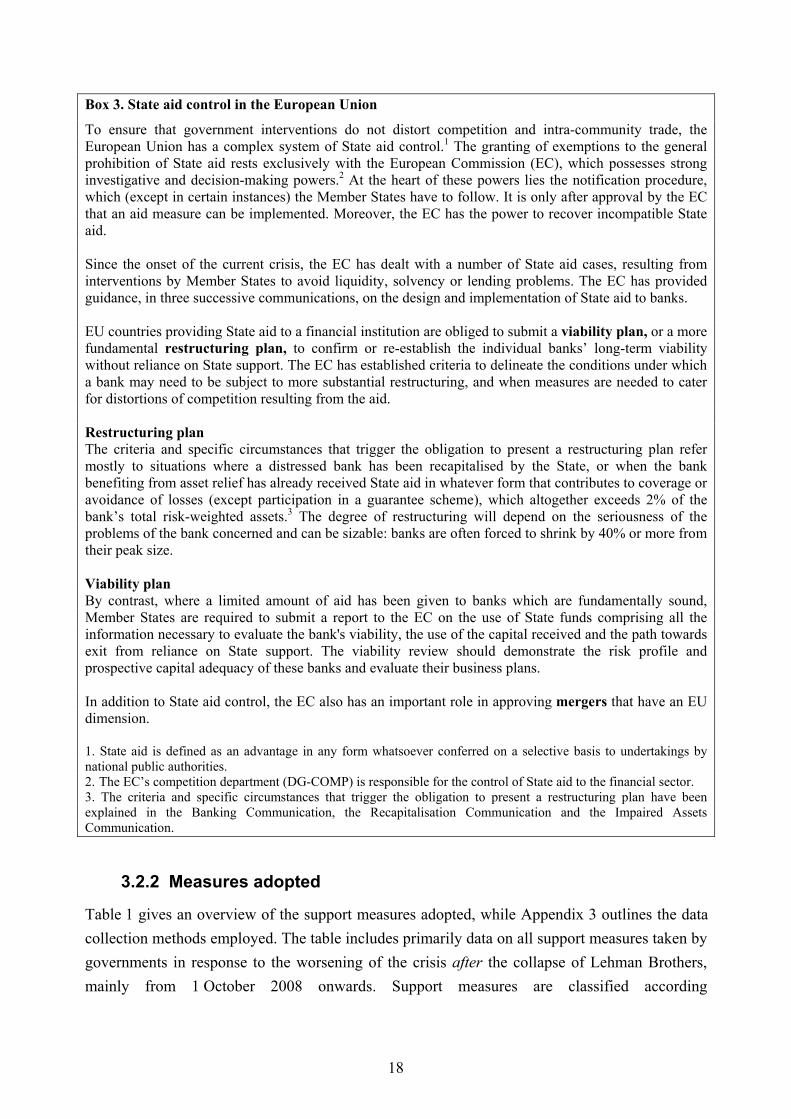
Box 3. State aid control in the European Union
To ensure that government interventions do not distort competition and intra-community trade, the European Union has a complex system of State aid control.1 The granting of exemptions to the general prohibition of State aid rests exclusively with the European Commission (EC), which possesses strong investigative and decision-making powers.2 At the heart of these powers lies the notification procedure, which (except in certain instances) the Member States have to follow. It is only after approval by the EC that an aid measure can be implemented. Moreover, the EC has the power to recover incompatible State aid. Since the onset of the current crisis, the EC has dealt with a number of State aid cases, resulting from interventions by Member States to avoid liquidity, solvency or lending problems. The EC has provided guidance, in three successive communications, on the design and implementation of State aid to banks. EU countries providing State aid to a financial institution are obliged to submit a viability plan, or a more fundamental restructuring plan, to confirm or re-establish the individual banks’ long-term viability without reliance on State support. The EC has established criteria to delineate the conditions under which a bank may need to be subject to more substantial restructuring, and when measures are needed to cater for distortions of competition resulting from the aid. Restructuring plan The criteria and specific circumstances that trigger the obligation to present a restructuring plan refer mostly to situations where a distressed bank has been recapitalised by the State, or when the bank benefiting from asset relief has already received State aid in whatever form that contributes to coverage or avoidance of losses (except participation in a guarantee scheme), which altogether exceeds 2% of the bank’s total risk-weighted assets.3 The degree of restructuring will depend on the seriousness of the problems of the bank concerned and can be sizable: banks are often forced to shrink by 40% or more from their peak size. Viability plan By contrast, where a limited amount of aid has been given to banks which are fundamentally sound, Member States are required to submit a report to the EC on the use of State funds comprising all the information necessary to evaluate the bank's viability, the use of the capital received and the path towards exit from reliance on State support. The viability review should demonstrate the risk profile and prospective capital adequacy of these banks and evaluate their business plans. In addition to State aid control, the EC also has an important role in approving mergers that have an EU dimension. 1. State aid is defined as an advantage in any form whatsoever conferred on a selective basis to undertakings by national public authorities. 2. The EC’s competition department (DG-COMP) is responsible for the control of State aid to the financial sector. 3. The criteria and specific circumstances that trigger the obligation to present a restructuring plan have been explained in the Banking Communication, the Recapitalisation Communication and the Impaired Assets Communication.
3.2.2 Measures adopted
Table 1 gives an overview of the support measures adopted, while Appendix 3 outlines the data collection methods employed. The table includes primarily data on all support measures taken by governments in response to the worsening of the crisis after the collapse of Lehman Brothers, mainly from 1 October 2008 onwards. Support measures are classified according
18

Box 4. Cross-border bank rescues in Europe
This box shows, by giving examples, how complex the rescue of cross-border banks can be. The cases of Fortis and Dexia are two prominent examples in Europe. Fortis On 28 September 2008 the three Benelux governments agreed to partly nationalise Fortis, a Belgo-Dutch banking and insurance group, with a EUR 11.2 billion capital injection. The agreed burden sharing was originally as follows: EUR 4.7 billion from Belgium, EUR 4 billion from the Netherlands and EUR 2.5 billion from Luxembourg. As a result, each government was to acquire 49% of the banking institution in their country. In fact, the Belgian authorities invested in Fortis’ overall banking division, while the Dutch and Luxembourg authorities received stakes in Fortis’ national banking divisions. Subsequently however, the rescue plan was abandoned and replaced by different solutions in the Netherlands and in Belgium/Luxembourg that led to the final break-up of Fortis. On 3 October 2008 the Dutch government fully nationalised Fortis Netherlands, buying 100% of the shares for EUR 16.8 billion. The acquisition of Fortis Bank Nederland NV included Fortis’ stake in ABN AMRO Holding NV and its Dutch insurance activities. In contrast to the nationalisation in the Netherlands, the Belgian and Luxembourg parts of Fortis were sold in a private takeover on 6 October, with BNP Paribas (BNPP) buying 75% of Fortis Belgium and 67% of Fortis Luxembourg for EUR 14.5 billion. The Belgian government retained a 25% stake in Fortis Belgium. For this transaction to take place, the government had to buy the remaining 51% of the shares (investing another EUR 4.7 billion) before transferring 75% of shares to BNPP. Also, Fortis Insurance Belgium was entirely acquired by BNPP for EUR 5.73 billion in cash. Several organisations representing Fortis shareholders immediately announced legal action to challenge this agreement. On 6 November, the public attorney of the Brussels Tribunal of Commerce accepted their reasoning and declared the sell-off process irregular. In Luxembourg, the government holds 33% of Fortis Luxembourg, now renamed BGL. Dexia On 30 September 2008 the French, Belgian and Luxembourg public authorities injected EUR 6.4 billion of capital into Dexia. The burden sharing was complex: in Belgium (EUR 3 billion), the government, the three Belgian regions, and three Belgian institutional shareholders (Gemeentelijke Holding NV, Arcofin CV and Ethias) invested EUR 1 billion each in Dexia SA; in France (EUR 3 billion), the French government invested EUR 1 billion in Dexia SA, and Caisse des Dépôts et Consignations contributed EUR 2 billion; in Luxembourg, the government disbursed EUR 376 million for purchasing convertible bonds issued by Dexia Banque Internationale à Luxembourg SA. On 9 October 2008 the Belgian, French and Luxembourg governments agreed to guarantee Dexia's liabilities to credit institutions and institutional counterparties, as well as bonds and other debt securities issued to the same counterparties. The objective was to assist the bank in regaining access to funding markets. The eligible liabilities, bonds and securities are required to fall due before 31 October 2011 and must have been contracted, issued or renewed between 9 October 2008 and 31 October 2009. The guarantee, which may be renewed for a term of one year, is subject to remuneration reflecting the advantage thus obtained by the entities of the Dexia Group concerned. It consolidates the activity of the entire Group, including its US subsidiary, FSA. The guarantee is assumed jointly by the French, Belgian and Luxembourg Governments and has a cap of EUR 150 billion. The experience of these two cross-border bank rescues shows that problems stem inter alia from a lack of clarity with regard to the national authorities to be involved in the rescue process, the extraordinary time pressure necessary to delineate the rescue operation and subsequent disagreement over burden sharing. These problems could be at least partially avoided under an orderly framework which sets criteria for the rescue process and provides a feasible time frame for the process. In the case of Fortis, it has been argued that the ultimate break-up could have been avoided if the process had been pursued under an explicit framework. 1/ The aggregate guaranteed amount is published on a daily basis on the following website: http://www.nbb.be/DOC/DQ/warandia/index.htm. Accordingly, investors can monitor the total amount under guarantee, compared with the total cap of the guarantee.
19
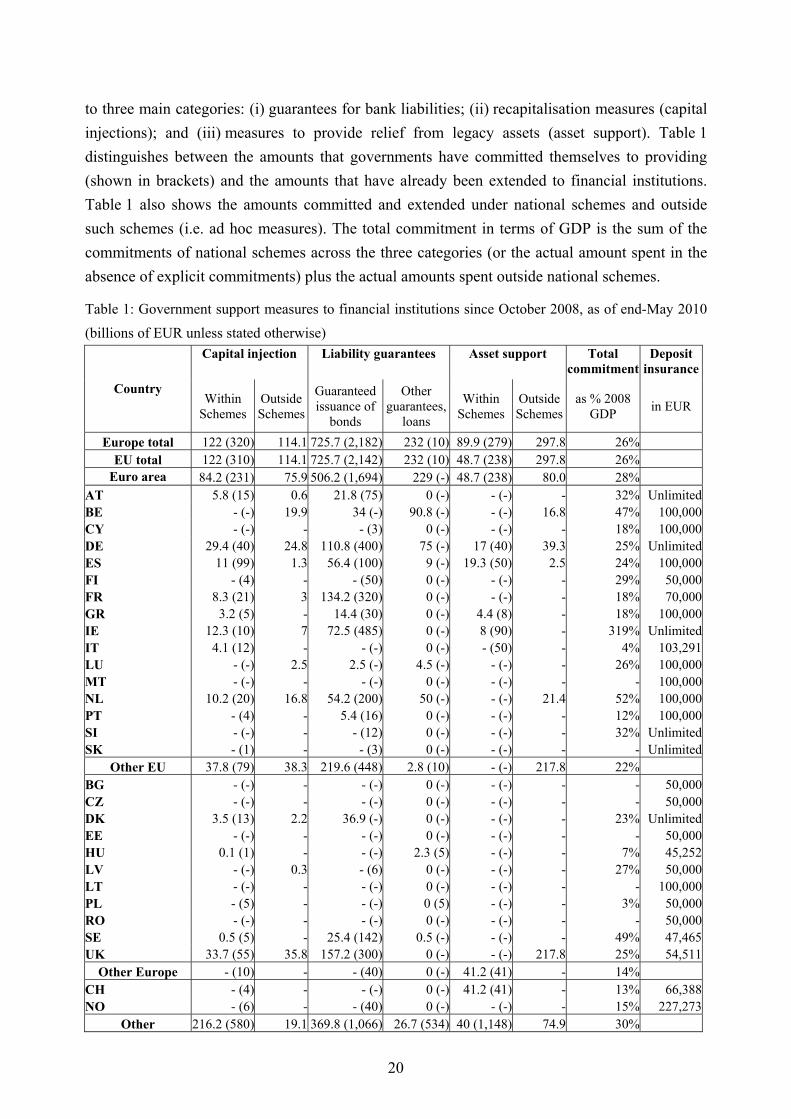
to three main categories: (i) guarantees for bank liabilities; (ii) recapitalisation measures (capital injections); and (iii) measures to provide relief from legacy assets (asset support). Table 1 distinguishes between the amounts that governments have committed themselves to providing (shown in brackets) and the amounts that have already been extended to financial institutions. Table 1 also shows the amounts committed and extended under national schemes and outside such schemes (i.e. ad hoc measures). The total commitment in terms of GDP is the sum of the commitments of national schemes across the three categories (or the actual amount spent in the absence of explicit commitments) plus the actual amounts spent outside national schemes.
Table 1: Government support measures to financial institutions since October 2008, as of end-May 2010 (billions of EUR unless stated otherwise)
Capital injection Liability guarantees Asset support Total commitment
Deposit insurance
Country Within
Schemes Outside Schemes
Guaranteed issuance of
bonds
Other guarantees,
loans
Within Schemes
Outside Schemes
as % 2008 GDP in EUR
Europe total 122 (320) 114.1 725.7 (2,182) 232 (10) 89.9 (279) 297.8 26% EU total 122 (310) 114.1 725.7 (2,142) 232 (10) 48.7 (238) 297.8 26%
Euro area 84.2 (231) 75.9 506.2 (1,694) 229 (-) 48.7 (238) 80.0 28% AT 5.8 (15) 0.6 21.8 (75) 0 (-) - (-) - 32% UnlimitedBE - (-) 19.9 34 (-) 90.8 (-) - (-) 16.8 47% 100,000CY - (-) - - (3) 0 (-) - (-) - 18% 100,000DE 29.4 (40) 24.8 110.8 (400) 75 (-) 17 (40) 39.3 25% UnlimitedES 11 (99) 1.3 56.4 (100) 9 (-) 19.3 (50) 2.5 24% 100,000FI - (4) - - (50) 0 (-) - (-) - 29% 50,000FR 8.3 (21) 3 134.2 (320) 0 (-) - (-) - 18% 70,000GR 3.2 (5) - 14.4 (30) 0 (-) 4.4 (8) - 18% 100,000IE 12.3 (10) 7 72.5 (485) 0 (-) 8 (90) - 319% UnlimitedIT 4.1 (12) - - (-) 0 (-) - (50) - 4% 103,291LU - (-) 2.5 2.5 (-) 4.5 (-) - (-) - 26% 100,000MT - (-) - - (-) 0 (-) - (-) - - 100,000NL 10.2 (20) 16.8 54.2 (200) 50 (-) - (-) 21.4 52% 100,000PT - (4) - 5.4 (16) 0 (-) - (-) - 12% 100,000SI - (-) - - (12) 0 (-) - (-) - 32% UnlimitedSK - (1) - - (3) 0 (-) - (-) - - Unlimited
Other EU 37.8 (79) 38.3 219.6 (448) 2.8 (10) - (-) 217.8 22% BG - (-) - - (-) 0 (-) - (-) - - 50,000CZ - (-) - - (-) 0 (-) - (-) - - 50,000DK 3.5 (13) 2.2 36.9 (-) 0 (-) - (-) - 23% UnlimitedEE - (-) - - (-) 0 (-) - (-) - - 50,000HU 0.1 (1) - - (-) 2.3 (5) - (-) - 7% 45,252LV - (-) 0.3 - (6) 0 (-) - (-) - 27% 50,000LT - (-) - - (-) 0 (-) - (-) - - 100,000PL - (5) - - (-) 0 (5) - (-) - 3% 50,000RO - (-) - - (-) 0 (-) - (-) - - 50,000SE 0.5 (5) - 25.4 (142) 0.5 (-) - (-) - 49% 47,465UK 33.7 (55) 35.8 157.2 (300) 0 (-) - (-) 217.8 25% 54,511
Other Europe - (10) - - (40) 0 (-) 41.2 (41) - 14% CH - (4) - - (-) 0 (-) 41.2 (41) - 13% 66,388NO - (6) - - (40) 0 (-) - (-) - 15% 227,273
Other 216.2 (580) 19.1 369.8 (1,066) 26.7 (534) 40 (1,148) 74.9 30%
20
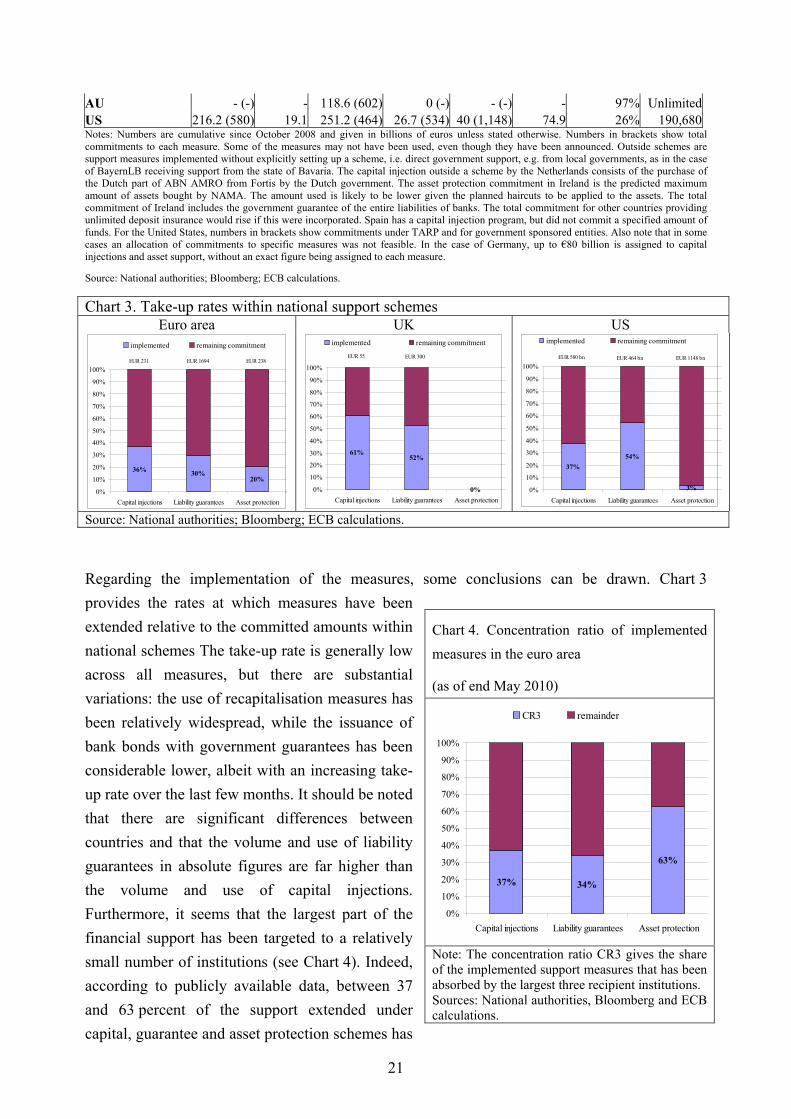
AU - (-) - 118.6 (602) 0 (-) - (-) - 97% UnlimitedUS 216.2 (580) 19.1 251.2 (464) 26.7 (534) 40 (1,148) 74.9 26% 190,680Notes: Numbers are cumulative since October 2008 and given in billions of euros unless stated otherwise. Numbers in brackets show total commitments to each measure. Some of the measures may not have been used, even though they have been announced. Outside schemes are support measures implemented without explicitly setting up a scheme, i.e. direct government support, e.g. from local governments, as in the case of BayernLB receiving support from the state of Bavaria. The capital injection outside a scheme by the Netherlands consists of the purchase of the Dutch part of ABN AMRO from Fortis by the Dutch government. The asset protection commitment in Ireland is the predicted maximum amount of assets bought by NAMA. The amount used is likely to be lower given the planned haircuts to be applied to the assets. The total commitment of Ireland includes the government guarantee of the entire liabilities of banks. The total commitment for other countries providing unlimited deposit insurance would rise if this were incorporated. Spain has a capital injection program, but did not commit a specified amount of funds. For the United States, numbers in brackets show commitments under TARP and for government sponsored entities. Also note that in some cases an allocation of commitments to specific measures was not feasible. In the case of Germany, up to €80 billion is assigned to capital injections and asset support, without an exact figure being assigned to each measure. Source: National authorities; Bloomberg; ECB calculations.
Chart 3. Take-up rates within national support schemes Euro area UK US
36% 30%20%
0%
10%
20%
30%
40%
50%
60%
70%
80%
90%
100%
Capital injections Liability guarantees Asset protection
implemented remaining commitment
EUR 231 EUR 1694 EUR 238
61%52%
0%0%
10%
20%
30%
40%
50%
60%
70%
80%
90%
100%
Capital injections Liability guarantees Asset protection
implemented remaining commitment
EUR 55 EUR 300
37%54%
3%0%
10%
20%
30%
40%
50%
60%
70%
80%
90%
100%
Capital injections Liability guarantees Asset protection
implemented remaining commitment
EUR 580 bn EUR 464 bn EUR 1148 bn
Source: National authorities; Bloomberg; ECB calculations.
Regarding the implementation of the measures, some conclusions can be drawn. Chart 3 provides the rates at which measures have been extended relative to the committed amounts within national schemes The take-up rate is generally low across all measures, but there are substantial variations: the use of recapitalisation measures has been relatively widespread, while the issuance of bank bonds with government guarantees has been considerable lower, albeit with an increasing take-up rate over the last few months. It should be noted that there are significant differences between countries and that the volume and use of liability guarantees in absolute figures are far higher than the volume and use of capital injections. Furthermore, it seems that the largest part of the financial support has been targeted to a relatively small number of institutions (see Chart 4). Indeed, according to publicly available data, between 37 and 63 percent of the support extended under capital, guarantee and asset protection schemes has
Chart 4. Concentration ratio of implemented measures in the euro area
(as of end May 2010)
37% 34%
63%
0%
10%
20%
30%
40%
50%
60%
70%
80%
90%
100%
Capital injections Liability guarantees Asset protection
CR3 remainder
Note: The concentration ratio CR3 gives the share of the implemented support measures that has been absorbed by the largest three recipient institutions. Sources: National authorities, Bloomberg and ECB calculations.
21
been absorbed by the largest three recipient institutions. In the case of each individual support measure, the three largest recipients account for 3% to 9% of total euro area banking assets.
The subsequent sections provide a more detailed description of the measures in the chronological order in which they have generally been adopted.25
Enhanced deposit insurance Deposit insurance schemes were among the first measures used to quell the impact of the
financial turmoil that intensified after the collapse of Lehman Brothers. In Europe, before the
crisis, EU legislation stipulated a minimum level of deposit insurance of EUR 20,000, with an
optional coinsurance element of 10%. However, as this deposit coverage proved insufficient to
calm depositor concerns, the limit was raised in October 2008 to a minimum of EUR 50,000,
which may rise to EUR 100,000 by the end of 2010.26 In addition, EU countries agreed to speed
up the repayment of guaranteed deposits in an effort to enhance the effectiveness of deposit
insurance.
One of the main events that led to the raising of the minimum level of deposit insurance was the
unilateral move by Ireland in September 2008 to provide a blanket guarantee for virtually all
bank liabilities (including retail, corporate, and interbank deposits).27 As shown in Table 1, this
blanket guarantee is sizeable as a percentage of GDP. This move raised concerns over a
competitive advantage for Irish banks.28 The Irish blanket guarantee, combined with the
experience of depositor runs on Northern Rock, the failed UK bank, led other countries to reform
their own deposit insurance schemes. In the UK, until October 2007 deposit insurance covered
100% of the first GBP 2,000 and 90% of the next GBP 33,000. The run on Northern Rock led
the UK government to guarantee the bank’s remaining deposits on concerns that these events
could also trigger runs on other banks. The experience of Northern Rock also played a role in the
move away from co-insurance. Table 1 shows that deposit insurance has been raised beyond
EUR 50,000 in the majority of countries and, in a number of cases, blanket guarantees have been
issued for retail deposits (e.g. Germany). In the case of the United States, deposit insurance has
25 As this paper focuses the order in which the different measures were generally adopted, it does not provide information on the dates at which specific schemes or individual measures were taken. Instead, the interested reader is referred to other papers that give details on the timing of support measures (e.g. Petrovic and Tutsch (2009). “National Rescue Measures in Response to the Current Financial Crisis”, ECB Legal Working Paper No. 8, July; XXX). Furthermore, the Fed provides a timeline on its website (http://www.newyorkfed.org/research/global_economy/IRCTimelinePublic.pdf). 26 Agreement on 7 October 2008 at the Ecofin meeting of EU ministers of finance: http://www.consilium.europa.eu/uedocs/cms_data/docs/pressdata/en/ecofin/103250.pdf 27 Liabilities covered include all retail and corporate deposits (to the extent not covered by existing deposit protection schemes in Ireland or any other jurisdiction); interbank deposits; senior unsecured debt; covered bonds; and dated subordinated debt (lower Tier 2). 28 Anecdotal evidence showed that depositors in the UK reacted to the increased coverage in Ireland by transferring money out of UK banks into the UK branches of Irish banks.
22
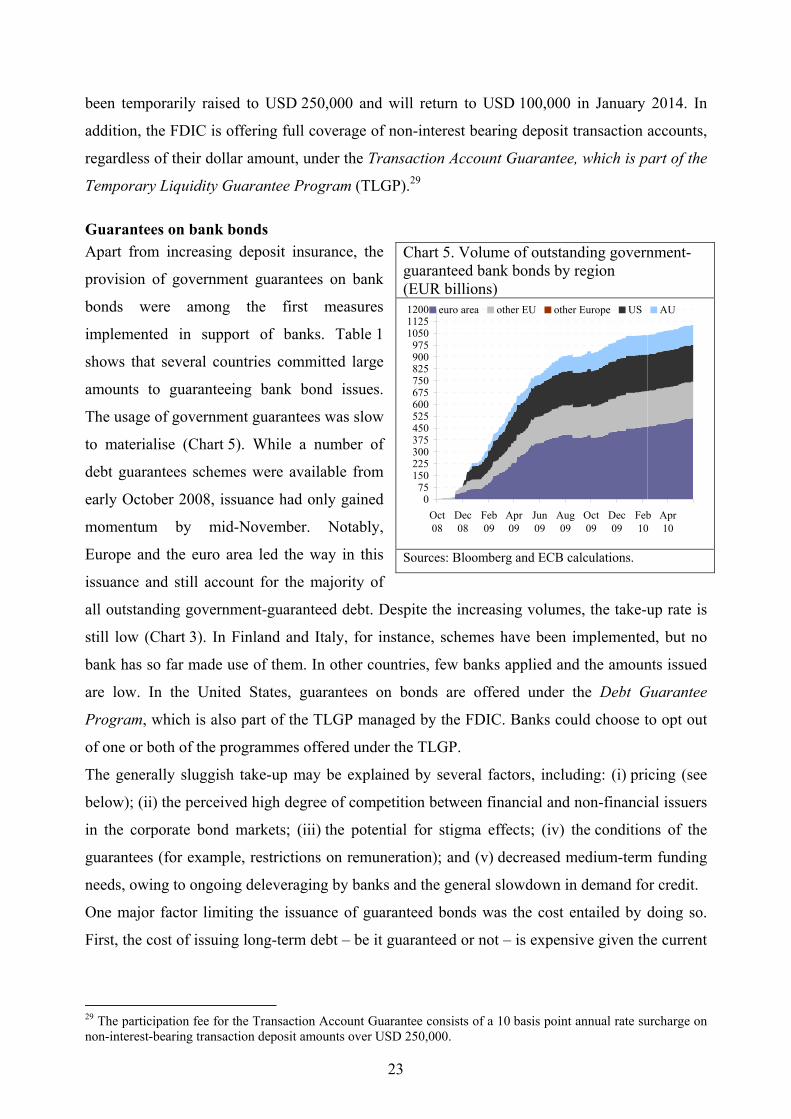
been temporarily raised to USD 250,000 and will return to USD 100,000 in January 2014. In
addition, the FDIC is offering full coverage of non-interest bearing deposit transaction accounts,
regardless of their dollar amount, under the Transaction Account Guarantee, which is part of the
Temporary Liquidity Guarantee Program (TLGP).29
Guarantees on bank bonds Apart from increasing deposit insurance, the
provision of government guarantees on bank
bonds were among the first measures
implemented in support of banks. Table 1
shows that several countries committed large
amounts to guaranteeing bank bond issues.
The usage of government guarantees was slow
to materialise (Chart 5). While a number of
debt guarantees schemes were available from
early October 2008, issuance had only gained
momentum by mid-November. Notably,
Europe and the euro area led the way in this
issuance and still account for the majority of
all outstanding government-guaranteed debt. Despite the increasing volumes, the take-up rate is
still low (Chart 3). In Finland and Italy, for instance, schemes have been implemented, but no
bank has so far made use of them. In other countries, few banks applied and the amounts issued
are low. In the United States, guarantees on bonds are offered under the Debt Guarantee
Program, which is also part of the TLGP managed by the FDIC. Banks could choose to opt out
of one or both of the programmes offered under the TLGP.
The generally sluggish take-up may be explained by several factors, including: (i) pricing (see
below); (ii) the perceived high degree of competition between financial and non-financial issuers
in the corporate bond markets; (iii) the potential for stigma effects; (iv) the conditions of the
guarantees (for example, restrictions on remuneration); and (v) decreased medium-term funding
needs, owing to ongoing deleveraging by banks and the general slowdown in demand for credit.
One major factor limiting the issuance of guaranteed bonds was the cost entailed by doing so.
First, the cost of issuing long-term debt – be it guaranteed or not – is expensive given the current
29 The participation fee for the Transaction Account Guarantee consists of a 10 basis point annual rate surcharge on non-interest-bearing transaction deposit amounts over USD 250,000.
Chart 5. Volume of outstanding government-guaranteed bank bonds by region (EUR billions)
075
150225300375450525600675750825900975
105011251200
Oct08
Dec08
Feb09
Apr09
Jun09
Aug09
Oct09
Dec09
Feb10
Apr10
euro area other EU other Europe US AU
Sources: Bloomberg and ECB calculations.
23
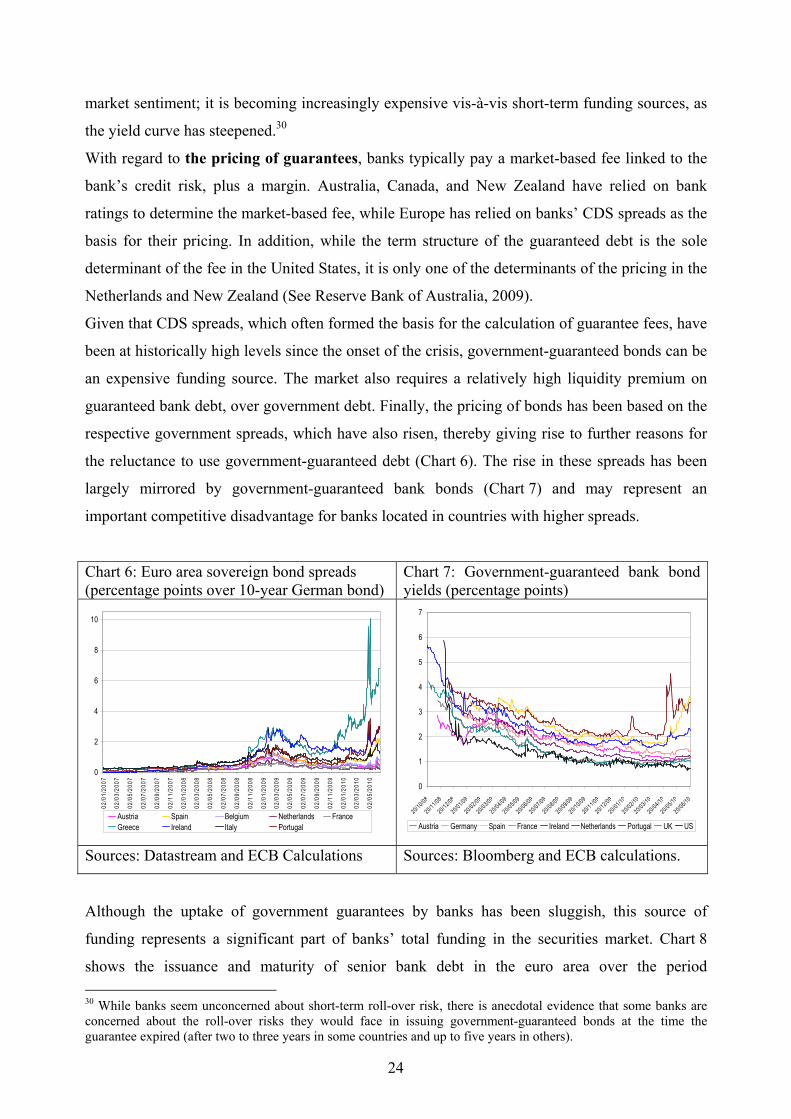
market sentiment; it is becoming increasingly expensive vis-à-vis short-term funding sources, as
the yield curve has steepened.30
With regard to the pricing of guarantees, banks typically pay a market-based fee linked to the
bank’s credit risk, plus a margin. Australia, Canada, and New Zealand have relied on bank
ratings to determine the market-based fee, while Europe has relied on banks’ CDS spreads as the
basis for their pricing. In addition, while the term structure of the guaranteed debt is the sole
determinant of the fee in the United States, it is only one of the determinants of the pricing in the
Netherlands and New Zealand (See Reserve Bank of Australia, 2009).
Given that CDS spreads, which often formed the basis for the calculation of guarantee fees, have
been at historically high levels since the onset of the crisis, government-guaranteed bonds can be
an expensive funding source. The market also requires a relatively high liquidity premium on
guaranteed bank debt, over government debt. Finally, the pricing of bonds has been based on the
respective government spreads, which have also risen, thereby giving rise to further reasons for
the reluctance to use government-guaranteed debt (Chart 6). The rise in these spreads has been
largely mirrored by government-guaranteed bank bonds (Chart 7) and may represent an
important competitive disadvantage for banks located in countries with higher spreads.
Chart 6: Euro area sovereign bond spreads (percentage points over 10-year German bond)
Chart 7: Government-guaranteed bank bond yields (percentage points)
0
2
4
6
8
10
02/0
1/20
07
02/0
3/20
07
02/0
5/20
07
02/0
7/20
07
02/0
9/20
07
02/1
1/20
07
02/0
1/20
08
02/0
3/20
08
02/0
5/20
08
02/0
7/20
08
02/0
9/20
08
02/1
1/20
08
02/0
1/20
09
02/0
3/20
09
02/0
5/20
09
02/0
7/20
09
02/0
9/20
09
02/1
1/20
09
02/0
1/20
10
02/0
3/20
10
02/0
5/20
10
Austria Spain Belgium Netherlands FranceGreece Ireland Italy Portugal
0
1
2
3
4
5
6
7
20/10/08
20/11/08
20/12/08
20/01/09
20/02/09
20/03/09
20/04/09
20/05/09
20/06/09
20/07/09
20/08/09
20/09/09
20/10/09
20/11/09
20/12/09
20/01/10
20/02/10
20/03/10
20/04/10
20/05/10
20/06/10
Austria Germany Spain France Ireland Netherlands Portugal UK US
Sources: Datastream and ECB Calculations Sources: Bloomberg and ECB calculations.
Although the uptake of government guarantees by banks has been sluggish, this source of
funding represents a significant part of banks’ total funding in the securities market. Chart 8
shows the issuance and maturity of senior bank debt in the euro area over the period 30 While banks seem unconcerned about short-term roll-over risk, there is anecdotal evidence that some banks are concerned about the roll-over risks they would face in issuing government-guaranteed bonds at the time the guarantee expired (after two to three years in some countries and up to five years in others).
24
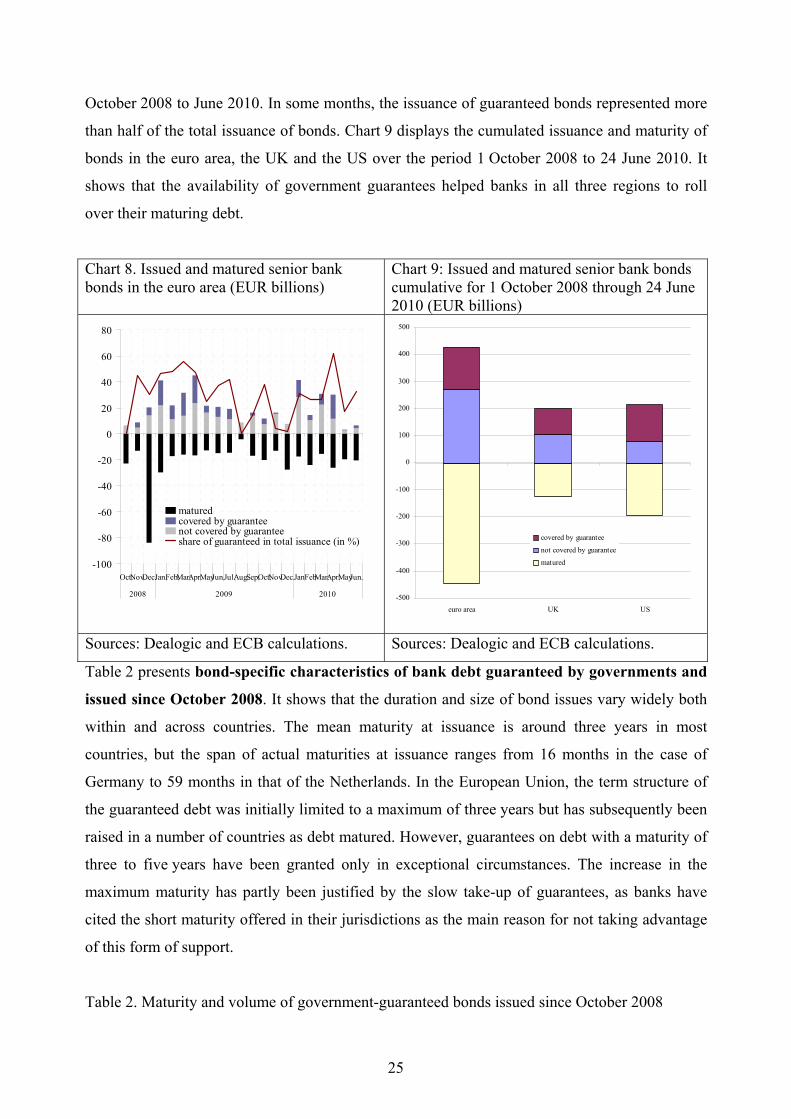
October 2008 to June 2010. In some months, the issuance of guaranteed bonds represented more
than half of the total issuance of bonds. Chart 9 displays the cumulated issuance and maturity of
bonds in the euro area, the UK and the US over the period 1 October 2008 to 24 June 2010. It
shows that the availability of government guarantees helped banks in all three regions to roll
over their maturing debt.
Chart 8. Issued and matured senior bank bonds in the euro area (EUR billions)
Chart 9: Issued and matured senior bank bonds cumulative for 1 October 2008 through 24 June 2010 (EUR billions)
-100
-80
-60
-40
-20
0
20
40
60
80
Oct.Nov.Dec.Jan.Feb.Mar.Apr.MayJun.Jul.Aug.Sep.Oct.Nov.Dec.JanFebMar.Apr.MayJun.
2008 2009 2010
maturedcovered by guaranteenot covered by guaranteeshare of guaranteed in total issuance (in %)
-500
-400
-300
-200
-100
0
100
200
300
400
500
euro area UK US
covered by guarantee
not covered by guarantee
matured
Sources: Dealogic and ECB calculations. Sources: Dealogic and ECB calculations.
Table 2 presents bond-specific characteristics of bank debt guaranteed by governments and
issued since October 2008. It shows that the duration and size of bond issues vary widely both
within and across countries. The mean maturity at issuance is around three years in most
countries, but the span of actual maturities at issuance ranges from 16 months in the case of
Germany to 59 months in that of the Netherlands. In the European Union, the term structure of
the guaranteed debt was initially limited to a maximum of three years but has subsequently been
raised in a number of countries as debt matured. However, guarantees on debt with a maturity of
three to five years have been granted only in exceptional circumstances. The increase in the
maximum maturity has partly been justified by the slow take-up of guarantees, as banks have
cited the short maturity offered in their jurisdictions as the main reason for not taking advantage
of this form of support.
Table 2. Maturity and volume of government-guaranteed bonds issued since October 2008
25
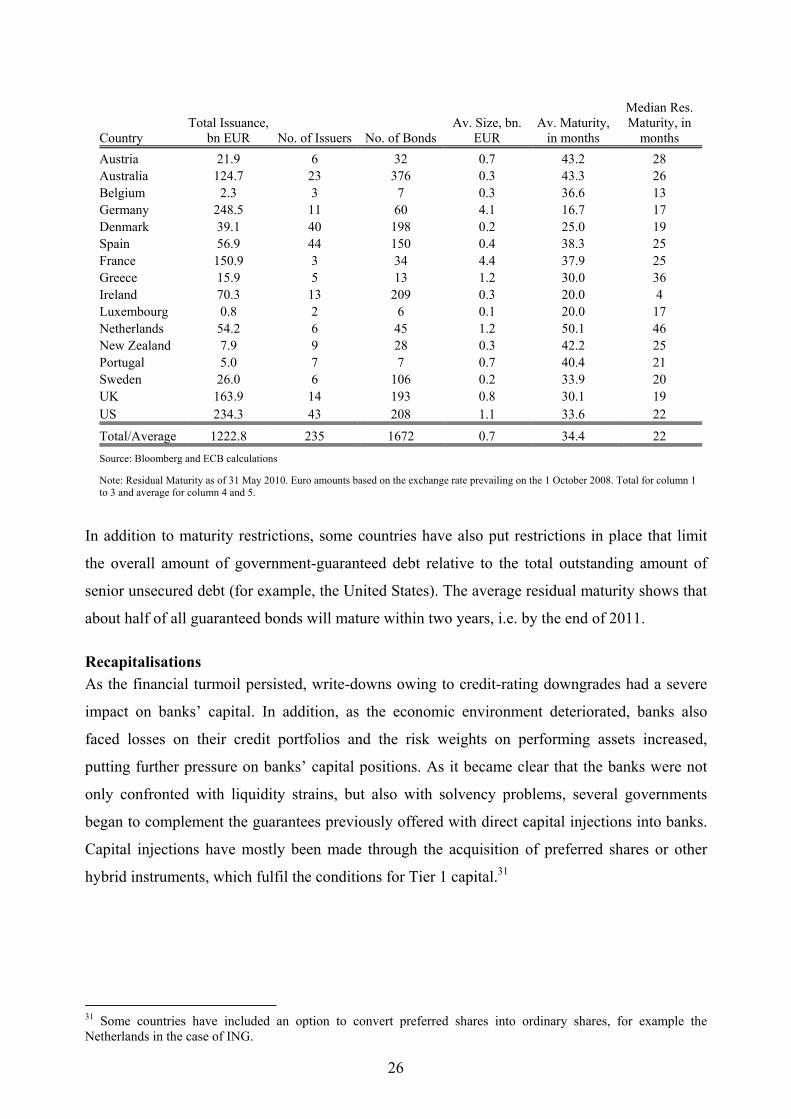
Country Total Issuance,
bn EUR No. of Issuers No. of Bonds Av. Size, bn.
EUR Av. Maturity,
in months
Median Res. Maturity, in
months Austria 21.9 6 32 0.7 43.2 28 Australia 124.7 23 376 0.3 43.3 26 Belgium 2.3 3 7 0.3 36.6 13 Germany 248.5 11 60 4.1 16.7 17 Denmark 39.1 40 198 0.2 25.0 19 Spain 56.9 44 150 0.4 38.3 25 France 150.9 3 34 4.4 37.9 25 Greece 15.9 5 13 1.2 30.0 36 Ireland 70.3 13 209 0.3 20.0 4 Luxembourg 0.8 2 6 0.1 20.0 17 Netherlands 54.2 6 45 1.2 50.1 46 New Zealand 7.9 9 28 0.3 42.2 25 Portugal 5.0 7 7 0.7 40.4 21 Sweden 26.0 6 106 0.2 33.9 20 UK 163.9 14 193 0.8 30.1 19 US 234.3 43 208 1.1 33.6 22
Total/Average 1222.8 235 1672 0.7 34.4 22 Source: Bloomberg and ECB calculations
Note: Residual Maturity as of 31 May 2010. Euro amounts based on the exchange rate prevailing on the 1 October 2008. Total for column 1 to 3 and average for column 4 and 5.
In addition to maturity restrictions, some countries have also put restrictions in place that limit
the overall amount of government-guaranteed debt relative to the total outstanding amount of
senior unsecured debt (for example, the United States). The average residual maturity shows that
about half of all guaranteed bonds will mature within two years, i.e. by the end of 2011.
Recapitalisations As the financial turmoil persisted, write-downs owing to credit-rating downgrades had a severe
impact on banks’ capital. In addition, as the economic environment deteriorated, banks also
faced losses on their credit portfolios and the risk weights on performing assets increased,
putting further pressure on banks’ capital positions. As it became clear that the banks were not
only confronted with liquidity strains, but also with solvency problems, several governments
began to complement the guarantees previously offered with direct capital injections into banks.
Capital injections have mostly been made through the acquisition of preferred shares or other
hybrid instruments, which fulfil the conditions for Tier 1 capital.31
31 Some countries have included an option to convert preferred shares into ordinary shares, for example the Netherlands in the case of ING.
26

The focus on preference shares as the main tool to inject capital has been primarily driven by the
objectives of bolstering the capital position of banks, while at the same time leaving bank
ownership in the private sector and ensuring the priority of public sector claims. These objectives
have been met, insofar as preference shares do not carry voting rights but do give their holders
priority over ordinary shareholders in the payment of dividends and during liquidation. With
regard to their inclusion in regulatory capital, only non-cumulative preferred stock can be
included as an element of Tier 1 capital (see Basel Committee on Banking Supervision, 2005).
Even if it can be counted as regulatory capital, concerns remain about whether raising capital
through preference shares truly amounts to de-leveraging, given that this form of capital does not
provide the same loss-absorbing feature as common equity.32 Also markets have increasingly
focused on higher quality capital definitions, such as tangible common equity, which exclude
preferred shares. This may have been one reason for the interest in converting preferred shares
into ordinary shares.33 Another reason is the high cost attached to preferred shares (see below).
Table 1 shows that countries with recapitalisation schemes have typically also implemented
guarantee schemes. While the take-up rate for recapitalisations is higher than for guarantees, it is
still relatively low. Capital injections have
been less common in the euro area than in
the United States. Chart 10 shows that the
total volume of US capital injections
amounted to EUR 287 billion at its peak in
June 2009, while recapitalisations reached
EUR 121 billion in the euro area. Within the
European Union, the UK government
injected the largest volume of capital, which
peaked at about EUR 40 billion. A further
important aspect is the varying level of
involvement in banks that received
capital injections. In a number of cases, banks became de facto nationalised, when governments
obtained majority stakes in them, or were nationalised outright. As a case in point, the German
government even organised a shareholder squeeze-out to take full control of Hypo Real Estate,
after having granted more than EUR 100 billion in guarantees to the bank.
32 In the words of the Royal Bank of Scotland CEO, “preference shares are just a disguised form of leverage”. 33 To strengthen its capital position, Citigroup converted USD 25 billion of preferred shares into common equity at the end of July 2009, thereby increasing the US government’s stake in the bank to 34%. Before that transaction took place, almost all of the non-government holders of preferred shares had agreed to convert their holdings into common equity.
Chart 10. Government capital injections since October 2008 (EUR billions)
0
75
150
225
300
375
450
525
Oct08
Dec08
Feb09
Apr09
Jun09
Aug09
Oct09
Dec09
Feb10
Apr10
euro area other EU other Europe US
Source: ECB
27
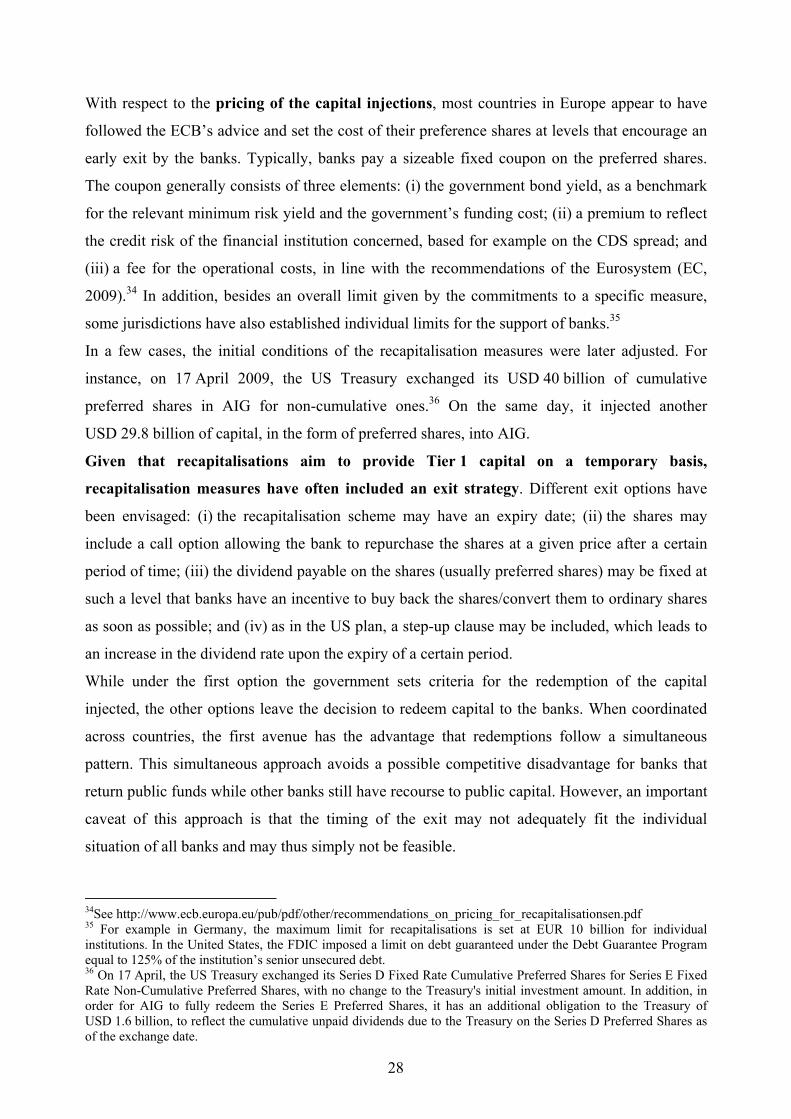
With respect to the pricing of the capital injections, most countries in Europe appear to have
followed the ECB’s advice and set the cost of their preference shares at levels that encourage an
early exit by the banks. Typically, banks pay a sizeable fixed coupon on the preferred shares.
The coupon generally consists of three elements: (i) the government bond yield, as a benchmark
for the relevant minimum risk yield and the government’s funding cost; (ii) a premium to reflect
the credit risk of the financial institution concerned, based for example on the CDS spread; and
(iii) a fee for the operational costs, in line with the recommendations of the Eurosystem (EC,
2009).34 In addition, besides an overall limit given by the commitments to a specific measure,
some jurisdictions have also established individual limits for the support of banks.35
In a few cases, the initial conditions of the recapitalisation measures were later adjusted. For
instance, on 17 April 2009, the US Treasury exchanged its USD 40 billion of cumulative
preferred shares in AIG for non-cumulative ones.36 On the same day, it injected another
USD 29.8 billion of capital, in the form of preferred shares, into AIG.
Given that recapitalisations aim to provide Tier 1 capital on a temporary basis,
recapitalisation measures have often included an exit strategy. Different exit options have
been envisaged: (i) the recapitalisation scheme may have an expiry date; (ii) the shares may
include a call option allowing the bank to repurchase the shares at a given price after a certain
period of time; (iii) the dividend payable on the shares (usually preferred shares) may be fixed at
such a level that banks have an incentive to buy back the shares/convert them to ordinary shares
as soon as possible; and (iv) as in the US plan, a step-up clause may be included, which leads to
an increase in the dividend rate upon the expiry of a certain period.
While under the first option the government sets criteria for the redemption of the capital
injected, the other options leave the decision to redeem capital to the banks. When coordinated
across countries, the first avenue has the advantage that redemptions follow a simultaneous
pattern. This simultaneous approach avoids a possible competitive disadvantage for banks that
return public funds while other banks still have recourse to public capital. However, an important
caveat of this approach is that the timing of the exit may not adequately fit the individual
situation of all banks and may thus simply not be feasible.
34See http://www.ecb.europa.eu/pub/pdf/other/recommendations_on_pricing_for_recapitalisationsen.pdf 35 For example in Germany, the maximum limit for recapitalisations is set at EUR 10 billion for individual institutions. In the United States, the FDIC imposed a limit on debt guaranteed under the Debt Guarantee Program equal to 125% of the institution’s senior unsecured debt. 36 On 17 April, the US Treasury exchanged its Series D Fixed Rate Cumulative Preferred Shares for Series E Fixed Rate Non-Cumulative Preferred Shares, with no change to the Treasury's initial investment amount. In addition, in order for AIG to fully redeem the Series E Preferred Shares, it has an additional obligation to the Treasury of USD 1.6 billion, to reflect the cumulative unpaid dividends due to the Treasury on the Series D Preferred Shares as of the exchange date.
28

The approach in the European Union is to provide banks with the incentive to return public funds
promptly. In addition, uniform exit arrangements have been a central consideration under the
EC’s approval process of government support measures to financial institutions. Therefore, the
EC stipulates that the pricing conditions should be set so that it is in the banks’ interest to
repay capital to the government as soon as the crisis abates while, at the same time, paying due
regard to the market situation of each institution. The key incentive is given by a sufficiently
high entry price level. In line with ECB recommendations, this price consists of several
components, among which bank-specific risk-based spreads figure prominently. The spreads are
calculated on the basis of a pre-turmoil average. In order to reflect the under-pricing of risk in
the pre-turmoil period, an add-on factor is included. This add-on factor and the risk-based
spread should largely reduce any competitive distortions. In addition, the pricing also takes
the level of subordination of the type of capital chosen into account. The calculation sets a
pricing corridor for preferred shares and other hybrid instruments with an average of 7%, and for
ordinary shares with an average of 9.3%. As a consequence of the pricing mechanism, the
competitive distortions caused by government capital injections can be expected to be very
limited. In fact, a decline in risk-based spreads below the level of the component used for the
pricing will make private funding cheaper when markets calm further. The pricing mechanism
thus already contains an in-built exit arrangement.
The EC also recommended step-up and redemption clauses to further boost incentives to
return government funds. Step-ups have been implemented through an increase over time in
the coupon payments on preferred shares. In the case of ING, the step-up has been linked to the
dividend payments on ordinary shares, which provides an incentive to retain profits, to bolster
capital and to repay government capital early. Redemption clauses take the form of a call option
on the debt, which permits the issuer to redeem the capital at any time. Overall, the exit
arrangements currently in place in the European Union aim to strike a balance between
providing incentives for an early exit and paying due regard to banks’ individual
circumstances (see Section 3.2.3 for a more detailed discussion).
Asset support The uncertainty about the value of some classes of assets held by banks may have resulted in a
reluctance to lend in the interbank market. The related write-downs subsequently ate into banks’
capital and prevented them from extending credit to the private sector. Therefore, cleaning up
balance sheets became a core part of the rescue efforts. However, the problem of pricing these
toxic assets correctly also made the task of removing them from balance sheets complex and
difficult. Hence, while it was also clear from previous banking crises that cleaning up balance
29
sheets was essential to speed up the recovery process (for example, the Asian crisis, referred to
in Lindgren et al., 1999), systematic asset support measures have only slowly become part of the
policy tool kit. In contrast, ad hoc asset support measures formed part of some of the earliest
rescue operations (for example, the Maiden Lane transaction for Bear Stearns and asset
guarantees provided to WestLB and SachsenLB).
In general, asset support schemes may either take the form of asset removal schemes (which
transfer the assets to a separate institution, such as a so-called bad bank) or asset insurance
schemes (which keep the assets on the banks’ balance sheet). Based on past experience, the
Eurosystem considered the specific criteria that determine which of these schemes is the
preferred option. Criteria in favour of the asset removal model include (i) a high degree of
uncertainty regarding the banks’ future asset quality; (ii) concentration of impaired assets in a
few institutions within the financial system; and (iii) circumstances in which a “clean break” for
the participating institutions could be deemed most appropriate, despite the higher upfront costs.
In contrast, criteria in favour of the asset insurance model are (i) a high incidence of hard-to-
value assets, such as asset-backed securities, among the impaired assets; and (ii) circumstances
in which consideration of the state of public finances would favour schemes with a cost profile
that puts less pressure on the government fiscal position in the short term.
However, the choice between an asset removal scheme and an asset insurance scheme is
extremely challenging in a situation where the quality of banks’ assets is likely to
deteriorate further. This uncertainty is probably one reason why many schemes combine
elements of both types and can thus be categorised as hybrid schemes. Such schemes often
involve asset transfers, financed by means of public sector guaranteed loans, and sophisticated
arrangements for risk-sharing between the governments and participating banks.
Some countries had implemented asset support measures even before the crisis intensified
in October 2008. The earliest steps in this direction were ad hoc measures forming part of
rescue restructurings. For instance, in the second quarter of 2008, the Federal Reserve System
facilitated the merger of JP Morgan Chase and Bear Stearns by providing a senior loan to a bad
bank LLC, Maiden Lane, to fund the purchase of a portfolio of mortgage-related securities,
residential and commercial mortgage loans, and associated hedges from Bear Stearns (see also
Appendix 1). Another example of an early ad hoc measure was the merger of Merrill Lynch and
Bank of America (BofA), when the US government agreed to share the losses that BofA might
incur on mortgage-related assets inherited from Merrill Lynch.37 However, following the release
37 It was agreed on 16 January 2009 that BofA would assume the first USD 10 billion of losses on a pool of USD 118 billion of toxic assets and that the United States government would assume the next USD 10 billion, as
30
of the results of the Supervisory Capital Assessment Program, the ring-fencing arrangement was
abandoned without having been implemented, and BofA paid an exit fee to the US authorities
involved in the support package (US Treasury, Fed, and FDIC) in September 2009. To deal with
its largest financial institution, the United States entered into a similar loss-sharing arrangement
with Citigroup under the Asset Guarantee Program, which is part of the TARP and targets
systemically important institutions.38
Recognising the need to offer asset relief to smaller banks too, on 23 March 2009 the US
Treasury – in conjunction with the FDIC and the Federal Reserve System - launched its Public-
Private Investment Program (PPIP).39 The PPIP is a bad-bank scheme, which allows banks to
move eligible toxic assets (loans and securities), or legacy assets as they are called in the United
States, into bank-specific funds. These funds are financed in such a way that the public shares
the risk and profits with private sector participants.40 The prices of the assets are determined in
auctions.41 As of 24 March 2010, the United States Treasury had spent a total of about
USD 30.4 billion on legacy securities under the PPIP, of which one third was an equity
investment and two thirds a debt investment.42 With regard to the legacy loans program, a pilot
sale was conducted in August 2009.
In Europe, the asset protection measures followed largely the same pattern as in the United
States. The back-up facility for ING discussed in Box 1 is an example of an asset protection
measure. well as 90% of all further losses, with Bank of America being responsible for the remaining 10% of such further losses. 38 Under this loss-sharing arrangement, Citigroup assumes the first USD 39.5 billion of losses on an asset pool of USD 301 billion, while the US Treasury assumes 90% of a second loss tranche of USD 5 billion and the FDIC 90% of the third loss tranche of USD 10 billion. Should even higher losses materialise, the Federal Reserve System would extend a non-recourse loan to cover the rest of the asset pool, with Citigroup being required to repay 10% of such losses to the Federal Reserve immediately. A summary of the terms of the loss sharing arrangement is available at http://www.citigroup.com/citi/press/2009/090116b.pdf?ieNocache=345. The fee for the loss coverage consists of USD 7.059 billion of 8% cumulative perpetual preferred stock (USD 4.034 billion corresponding to the Treasury and USD 3.025 billion to the FDIC) and a warrant to the Treasury to purchase 66,531,728 million shares of common stock at a strike price of USD 10.61 per share. 39 Using USD 75 to 100 billion of TARP capital and capital from private investors, the PPIP is intended to generate USD 500 billion in purchasing power to buy toxic assets, with the potential to expand to USD 1 trillion over time. The eligible assets of each bank that wishes to participate in the PPIP are moved into a bank-specific fund. 40 The US Treasury and private capital provide equity financing, and the FDIC provides a guarantee for debt issued by the Public-Private Investment Funds to fund the asset purchases. The Treasury provides 50% of the equity capital for each fund, but private managers retain control of asset management subject to rigorous oversight by the FDIC. To reduce the likelihood of the government overpaying for the assets, the price of the loans and securities purchased under the PPIP is established by private sector investors competing with one another. 41 One concern is that the banks selling assets are also able to bid for them. Hence, critics charge that the government’s public-private partnership – which provides generous loans to investors – is intended to help banks acquire, rather than sell, troubled securities and loans, using the leverage provided by the PPIP. The fear is that instead of helping price discovery, the PPIP could let banks use taxpayers’ money to make bids at above the current market prices for the assets. If those bids eventually turn out to have been too high and the cash flows never materialise, then the taxpayer will ultimately pay the bill. 42 The equity and debt investments may be incrementally funded. Hence, the number given represents the Treasury's maximum obligation.
31
Early examples of asset guarantees in Europe include two German Landesbanks. SachsenLB
received guarantees on a portfolio of securities of EUR 17.5 billion. A first loss tranche of up to
EUR 2.75 billion was guaranteed by the state of Saxonia and a second tranche of up to
EUR 6.4 billion by Landesbank Baden-Württemberg. This asset insurance measure contrasts
with the asset removal transaction under which WestLB transferred a portfolio of assets of
EUR 23 billion to an SPV in March 2008 and received EUR 5 billion from its owners, i.e.
savings banks and the state of North Rhine-Westphalia. The guarantees were extended by
another EUR 4 billion in June 2009.
Several different, more systematic approaches have been set up in Europe. For instance, the UK
authorities implemented an asset insurance scheme, participation in which depended on the
outcome of stress tests conducted by the Financial Supervisory Authority for the three largest
banks. While Barclays was allowed to opt out, the UK entered into loss sharing arrangements
with Royal Bank of Scotland (RBS) and Lloyds.43 However, Lloyds terminated the agreement
with the government before the arrangement could be implemented (see Section 3.2.3). On
14 April 2009, Ireland revealed its plans for a National Asset Management Agency (NAMA).
NAMA began acquiring assets from the five major Irish banks in March 2010. The book value of
the assets was EUR 16 billion, which were acquired at considerable discounts.44 NAMA plans to
purchase a total of EUR 81 billion of loans by the end of 2010. In contrast to the UK, the eligible
assets (land and development loans) are removed from the balance sheets of Ireland's major
banks.45
The German government revealed its plans for a bad-bank scheme in mid-May 2009, and the
Federal Parliament approved the measures on 2 July 2009. While the proposal foresees the
transfer of assets into bank-specific SPVs, it is a hybrid scheme, as banks are shielded from
losses only temporarily and ultimately have to bear all losses on the transferred assets (see Box 5
for further details). Besides this so-called SPV scheme, a consolidation scheme is also planned.
This second scheme differs insofar as banks can transfer entire business areas to a liquidating
43 Under the original agreement of February 2009, RBS and Lloyds agreed to put GBP 325 and 260 billion of assets into the schemes, respectively. The arrangements specified a first loss tranche of GBP 42 and 25 billion, respectively, which the banks themselves were to bear, the government agreeing to cover 90% of any further losses. In November 2009 Lloyds terminated the agreement before it could be implemented, while the terms of the agreement with RBS were adjusted (the first loss tranche was increased from GBP 42 to 60 billion and the asset pool was reduced from GBP 325 to 282 billion). 44 NAMA paid €8.5 billion for the loans, representing an average discount of 47%. 45 The assets will include both healthy and impaired loans, ranging from loans for undeveloped land to loans for residential and commercial developments. While many details are not yet known, some information on the scheme can be found at http://www.budget.gov.ie/2009SupApril09/en/downloads/Annex%20I%20-%20NAMA%20Frequently%20 Asked%20Questions.pdf
32
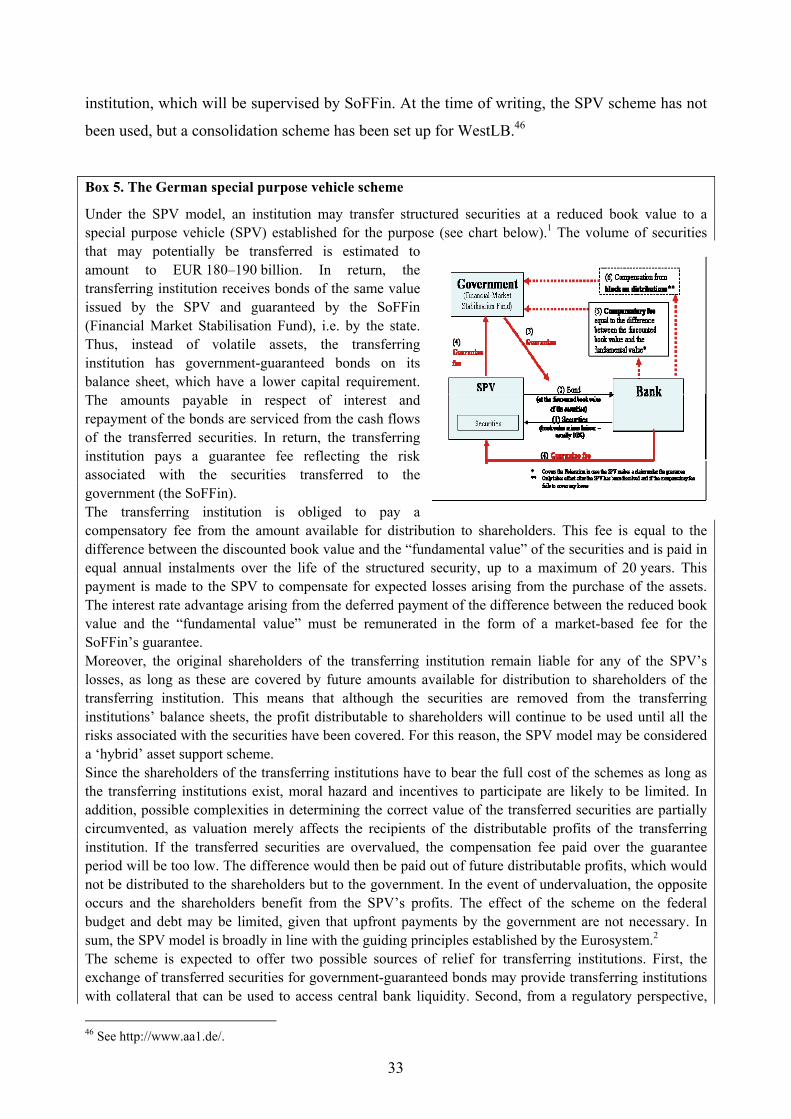
institution, which will be supervised by SoFFin. At the time of writing, the SPV scheme has not
been used, but a consolidation scheme has been set up for WestLB.46
Box 5. The German special purpose vehicle scheme
Under the SPV model, an institution may transfer structured securities at a reduced book value to a special purpose vehicle (SPV) established for the purpose (see chart below).1 The volume of securities that may potentially be transferred is estimated to amount to EUR 180–190 billion. In return, the transferring institution receives bonds of the same value issued by the SPV and guaranteed by the SoFFin (Financial Market Stabilisation Fund), i.e. by the state. Thus, instead of volatile assets, the transferring institution has government-guaranteed bonds on its balance sheet, which have a lower capital requirement. The amounts payable in respect of interest and repayment of the bonds are serviced from the cash flows of the transferred securities. In return, the transferring institution pays a guarantee fee reflecting the risk associated with the securities transferred to the government (the SoFFin). The transferring institution is obliged to pay a compensatory fee from the amount available for distribution to shareholders. This fee is equal to the difference between the discounted book value and the “fundamental value” of the securities and is paid in equal annual instalments over the life of the structured security, up to a maximum of 20 years. This payment is made to the SPV to compensate for expected losses arising from the purchase of the assets. The interest rate advantage arising from the deferred payment of the difference between the reduced book value and the “fundamental value” must be remunerated in the form of a market-based fee for the SoFFin’s guarantee. Moreover, the original shareholders of the transferring institution remain liable for any of the SPV’s losses, as long as these are covered by future amounts available for distribution to shareholders of the transferring institution. This means that although the securities are removed from the transferring institutions’ balance sheets, the profit distributable to shareholders will continue to be used until all the risks associated with the securities have been covered. For this reason, the SPV model may be considered a ‘hybrid’ asset support scheme. Since the shareholders of the transferring institutions have to bear the full cost of the schemes as long as the transferring institutions exist, moral hazard and incentives to participate are likely to be limited. In addition, possible complexities in determining the correct value of the transferred securities are partially circumvented, as valuation merely affects the recipients of the distributable profits of the transferring institution. If the transferred securities are overvalued, the compensation fee paid over the guarantee period will be too low. The difference would then be paid out of future distributable profits, which would not be distributed to the shareholders but to the government. In the event of undervaluation, the opposite occurs and the shareholders benefit from the SPV’s profits. The effect of the scheme on the federal budget and debt may be limited, given that upfront payments by the government are not necessary. In sum, the SPV model is broadly in line with the guiding principles established by the Eurosystem.2 The scheme is expected to offer two possible sources of relief for transferring institutions. First, the exchange of transferred securities for government-guaranteed bonds may provide transferring institutions with collateral that can be used to access central bank liquidity. Second, from a regulatory perspective,
46 See http://www.aa1.de/.
33
exchanging securities subject to high capital requirements for government-guaranteed bonds may free up capital. The provision of liquidity and the freeing up of capital would allow transferring institutions to continue their lending activity. Despite the 10% cap on the haircut, the risk is that some institutions may have limited incentives to participate in the scheme because of low capital buffers. However, this risk is limited by the condition that the transferring institution must maintain a core capital ratio of at least 7% and the haircut is only needed if the fundamental value is lower than the book value. In addition, potential new investors could be deterred from injecting capital into the transferring institution by the possibility of a future allocation of distributable profits to cover the SPV’s losses; however, this is mitigated by the ability of the transferring institutions to issue preferential shares which give new shareholders priority over the SoFFin’s claims. Since institutions are allowed to pay for potential losses by issuing shares to the SoFFin and this implies increased government involvement in the banking sector, the ECB considers that an assessment should be made of the extent of this additional public involvement and exit strategies formulated. Finally, in the event of the transferring institution’s insolvency and a loss on the SPV’s portfolio, the government would become responsible for losses on the guaranteed transferred securities. Consequently, the government has an incentive to avoid the insolvency of a transferring institution by providing further support measures. In this regard, the scheme may necessitate further public support measures. 1. This is the higher of 90% of the book value, as stated in the last audited annual accounts, or the “real economic value”. This haircut on the book value is subject to the condition that the transferring institution maintains a core capital ratio of at least 7%. 2. Guiding Principles for Bank Asset Support Schemes, issued on 25 February 2009 and available on the ECB’s website at www.ecb.europa.eu.
The features of asset removal schemes vary considerably across countries. Table 3 compares the
features of the US, German and Irish schemes. For instance, the eligible asset classes vary
widely from one scheme to another, as does the nature of participation, which is voluntary in
Germany and the United States, but mandatory in Ireland. Furthermore, the pricing mechanisms
differ: prices are established by auction in the United States, while they are determined by
auditors in Germany and Ireland.
The potential risks are high for the public, as the amounts committed to asset relief
measures are large (see Table 1). The United States and the United Kingdom have implemented
asset relief schemes under which they could face losses of about EUR 220 billion each. The
German and Irish schemes could cost the taxpayer EUR 190 billion and EUR 90 billion,
respectively, if fully implemented. These amounts account for a large part of the high
commitments, in terms of GDP, in these countries. However, these losses would only materialise
in the unlikely case that the underlying asset pools become worthless. If the assets retain part of
their value, the ensuing loss for the public will be smaller. Also, if the bank that benefits from the
asset relief measures also receives support in the form of capital and/or liability guarantees,
losses for the taxpayer would only materialise for one side of the balance sheet.
34
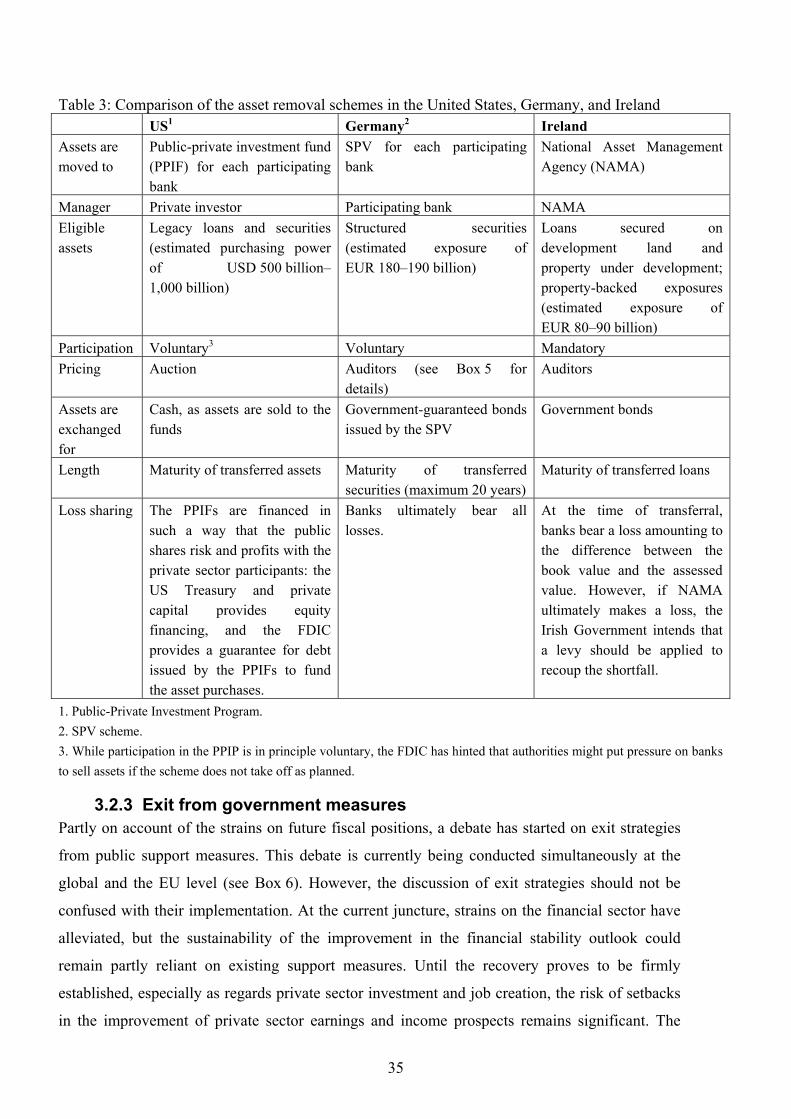
Table 3: Comparison of the asset removal schemes in the United States, Germany, and Ireland US1 Germany2 Ireland Assets are moved to
Public-private investment fund (PPIF) for each participating bank
SPV for each participating bank
National Asset Management Agency (NAMA)
Manager Private investor Participating bank NAMA Eligible assets
Legacy loans and securities (estimated purchasing power of USD 500 billion–1,000 billion)
Structured securities (estimated exposure of EUR 180–190 billion)
Loans secured on development land and property under development; property-backed exposures (estimated exposure of EUR 80–90 billion)
Participation Voluntary3 Voluntary Mandatory Pricing Auction Auditors (see Box 5 for
details) Auditors
Assets are exchanged for
Cash, as assets are sold to the funds
Government-guaranteed bonds issued by the SPV
Government bonds
Length Maturity of transferred assets Maturity of transferred securities (maximum 20 years)
Maturity of transferred loans
Loss sharing The PPIFs are financed in such a way that the public shares risk and profits with the private sector participants: the US Treasury and private capital provides equity financing, and the FDIC provides a guarantee for debt issued by the PPIFs to fund the asset purchases.
Banks ultimately bear all losses.
At the time of transferral, banks bear a loss amounting to the difference between the book value and the assessed value. However, if NAMA ultimately makes a loss, the Irish Government intends that a levy should be applied to recoup the shortfall.
1. Public-Private Investment Program. 2. SPV scheme. 3. While participation in the PPIP is in principle voluntary, the FDIC has hinted that authorities might put pressure on banks to sell assets if the scheme does not take off as planned.
3.2.3 Exit from government measures Partly on account of the strains on future fiscal positions, a debate has started on exit strategies
from public support measures. This debate is currently being conducted simultaneously at the
global and the EU level (see Box 6). However, the discussion of exit strategies should not be
confused with their implementation. At the current juncture, strains on the financial sector have
alleviated, but the sustainability of the improvement in the financial stability outlook could
remain partly reliant on existing support measures. Until the recovery proves to be firmly
established, especially as regards private sector investment and job creation, the risk of setbacks
in the improvement of private sector earnings and income prospects remains significant. The
35
possibility cannot be ruled out, therefore, of a premature or disorderly exit from the existing
public sector support measures triggering further financial instability. In particular, if the
sustainability of public finances were to be called into question before the recovery proves to be
self-sustaining, an adverse trade-off could emerge between further deterioration of public sector
finances and the potential for a renewed episode of financial instability. It should be added that
the progressive intensification of market concerns about sovereign credit risks within the euro
area in April and in early May 2010 also put pressure on the operating environment of banks. In
some countries, these developments led to an increase in government support rather than its
withdrawal.47 At the same time, there are also risks associated with late exits. These include the
risk of creating excessive strains on public finances, distorting competition and creating moral
hazard that comes with downside protection – including the possibility of encouraging excessive
risk-taking. However, a premature exit could also increase moral hazard concerns because of the
potential signal that the public is willing to share losses without benefiting from gains. The right
timing will thus be crucial for a successful exit. Exit strategies will also need to be coordinated,
preferably at the global level, in order to avoid negative cross-border spillover effects. However,
any exit could be complicated by the fact that a sub-set of institutions have become relatively
more reliant on support than others. To mitigate this problem, it would be useful if credible
alternative schemes to deal with such institutions, including asset support measures, were put in
place before any exit.
The following sub-sections focus on specific aspects related to individual measures.
Box 6. International coordination of exit At the global level, the FSB (as requested by G20 Leaders) compiled a note on exit strategies from financial system support measures to be used as a basis for discussion. The main elements of the note included the following:
• Improved market conditions have led to a decline in the usage of public support, thereby reducing the need for system-wide measures.
• Exits should (i) be pre-announced, flexible, transparent, and credible; (ii) be sustainable from a prudential perspective and not compromise the supply of credit; (iii) be market-based; and (iv) take into account potential cross-border impacts.
• The spectrum of coordination ranges from prior notification of plans (the weakest form of coordination), via discussion of the broad principles underpinning exit decisions, to the implementation of consistent frameworks. The potential benefits from coordination of exit decisions are highest for countries with significant cross-border spillovers. The optimum timing of exit will vary across countries given that the strength and robustness of national financial systems differ.
At the EU level, the debate is coordinated by the EFC/EC. While being very similar to the one at the global level, the debate has already advanced to more concrete questions. Given the highly integrated financial system in the European Union, there is agreement to coordinate exit among national authorities. However, this does not 47 As part of the economic stabilisation programme in Greece, a Financial Stability Fund will be established with the task to provide capital support to banks. In addition, the Greek government introduced a facility which guarantees up to EUR 15 billion of new loans with up to 3 years and up to EUR 8 billion of lending to banks of special zero coupon bonds of the Greek state (see IMF 2009d).
36
necessarily entail the synchronised implementation of exit. Furthermore, as regards sequencing, guarantee schemes should be phased out first, followed by recapitalisation measures and, finally, asset relief schemes. In particular, the pricing of debt guarantees are to be gradually tightened, as a way of providing incentives for exit. To this end, the European Commission in cooperation with the ECB prepared recommendations on this issue. Accordingly, the approval of the extension of a guarantee scheme beyond 30 June 2010 requires the fee for a government guarantee to be higher than under the pricing formula recommended by the ECB in October 2008.1 In general, there seems to be a preference for a market-based exit, with financial institutions deciding themselves when to withdraw from government support. 1. The recommendations are available at http://ec.europa.eu/competition/state_aid/studies_reports/phase_out_bank_guarantees.pdf.
Exit from enhanced deposit insurance In the European Union, the discussion on exit from deposit guarantees revolves around a
coordinated reform of deposit insurance schemes, which would in essence consist of an increase
in the insurance limits, but also faster payouts in the event of insolvency. Table 1 shows that
insurance ceilings have been raised and, in a number of countries, unlimited deposit insurance
has been granted. A specific deadline for ending unlimited deposit insurance has not been
discussed so far. With regard to the United States, the current deposit insurance limit of USD
250,000 per depositor will expire at the end of 2013 and will then be reduced to USD 100,000.
Exit from guarantees on bank bonds The potential for a market-based exit is built into schemes with a fixed price for the government
guarantee: improving market conditions raise the price of issuing government-guaranteed bonds
relative to non-guaranteed bonds. The market-based exit could be sped up by increasing the
current prices. To this end, in the EU, for the extension of a guarantee scheme beyond 30 June
2010 to be approved by the European Commission, the fee for a government guarantee is
required to be higher than under the pricing formula recommended by the ECB in October 2008.
Examining the data, it seems that euro area banks had already started to replace the issuance of
guaranteed bonds by the issuance of non-guaranteed ones, as the issuance of government-
guaranteed bonds declined significantly in summer and autumn 2009, while the issuance of non-
guaranteed bonds revived (see Chart 8). In 2010 however, the issuance of guaranteed bonds has
increased again owing to the renewed financial market tensions. Hence, it is too early to draw the
general conclusion that banks have started to regain access to funding markets: while some
banks may have started to regain access to funding markets, others may still face strong
challenges.
In October 2009, the largest issuer of government-guaranteed bonds, the French agency SFEF,
ceased issuing such bonds. Overall, EUR 80 billion of guaranteed bonds issued by SFEF are
currently outstanding. In the United States, the debt guarantee program was extended by six
37

months until the end of October 2009. At the time, the fees were raised for debt issued after 1
April 2009 and for debt with a maturity beyond 30 June 2012.48 This effectively, initiated the
exit from the debt guarantee program. The program has been succeeded by a six-month
emergency guarantee facility, which will expire at the end of April 2010. The fee for debt issued
under the emergency facility amounts to at least 300 basis points, but can be raised depending on
the risks associated with the issuing entity.
Exit from Recapitalisations From a broad perspective, there are two approaches for the exit from government
recapitalisations. First, the government sells its stake to the private market. This has occurred in
only two cases so far. The Swiss government sold its EUR 4 billion stake in UBS to institutional
investors in August 2009, and the US government sold part of the stocks acquired in Citigroup in
May 2010. Second, the bank repays the government. There are several alternative and typically
complementary options available to raise capital in order to return the government capital. The
main strategy, observed during the recent French initiatives (see below) but also during the first
European repayments by Lloyds TSB and ING, is to raise capital in private markets. This
strategy has been complemented by retaining earnings, the sale of business units, deleveraging,
and also by converting Tier 2-type capital of private investors into ordinary shares.
While the exit from guarantee schemes is currently being discussed, the exit from
recapitalisation has already started. Chart 12 shows the amount of capital repaid in Europe
and the United States. Clearly, US banks have led the way by returning capital as early as end of
March 2009. The total amount repaid so far by US banks is EUR 54 billion, which represents
16% of capital injected. Initially, mostly smaller US banks started repaying government capital.
Only after the outcome of the stress tests
undertaken by the US authorities did larger
banks receive permission to reimburse the
US Treasury, which explains the
repayment wave observed in June 2009.
48 See http://www.fdic.gov/regulations/resources/TLGP/faq.html
Chart 11: Capital repayment since October 2008
(EUR billions)
0
20
40
60
80
100
120
140
160
180
Oct08
Dec08
Feb09
Apr09
Jun09
Aug09
Oct09
Dec09
Feb10
Apr10
euro area other EU other Europe US
38
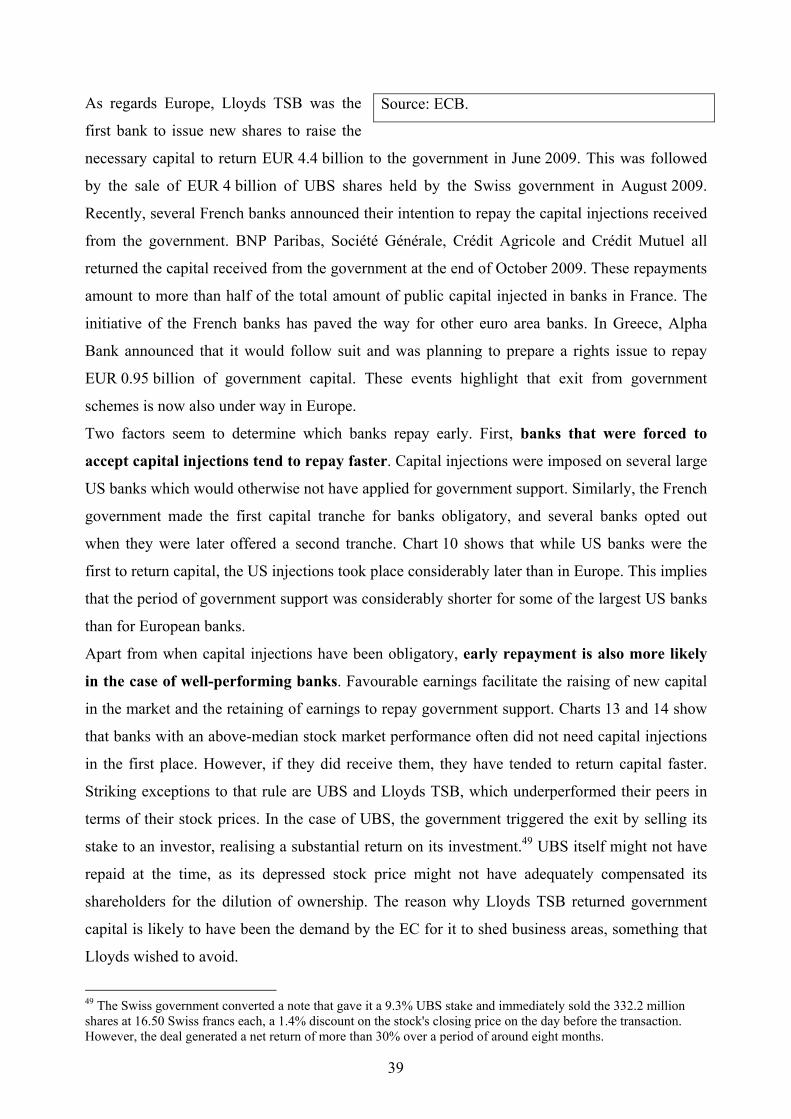
As regards Europe, Lloyds TSB was the
first bank to issue new shares to raise the
necessary capital to return EUR 4.4 billion to the government in June 2009. This was followed
by the sale of EUR 4 billion of UBS shares held by the Swiss government in August 2009.
Recently, several French banks announced their intention to repay the capital injections received
from the government. BNP Paribas, Société Générale, Crédit Agricole and Crédit Mutuel all
returned the capital received from the government at the end of October 2009. These repayments
amount to more than half of the total amount of public capital injected in banks in France. The
initiative of the French banks has paved the way for other euro area banks. In Greece, Alpha
Bank announced that it would follow suit and was planning to prepare a rights issue to repay
EUR 0.95 billion of government capital. These events highlight that exit from government
schemes is now also under way in Europe.
Two factors seem to determine which banks repay early. First, banks that were forced to
accept capital injections tend to repay faster. Capital injections were imposed on several large
US banks which would otherwise not have applied for government support. Similarly, the French
government made the first capital tranche for banks obligatory, and several banks opted out
when they were later offered a second tranche. Chart 10 shows that while US banks were the
first to return capital, the US injections took place considerably later than in Europe. This implies
that the period of government support was considerably shorter for some of the largest US banks
than for European banks.
Apart from when capital injections have been obligatory, early repayment is also more likely
in the case of well-performing banks. Favourable earnings facilitate the raising of new capital
in the market and the retaining of earnings to repay government support. Charts 13 and 14 show
that banks with an above-median stock market performance often did not need capital injections
in the first place. However, if they did receive them, they have tended to return capital faster.
Striking exceptions to that rule are UBS and Lloyds TSB, which underperformed their peers in
terms of their stock prices. In the case of UBS, the government triggered the exit by selling its
stake to an investor, realising a substantial return on its investment.49 UBS itself might not have
repaid at the time, as its depressed stock price might not have adequately compensated its
shareholders for the dilution of ownership. The reason why Lloyds TSB returned government
capital is likely to have been the demand by the EC for it to shed business areas, something that
Lloyds wished to avoid.
49 The Swiss government converted a note that gave it a 9.3% UBS stake and immediately sold the 332.2 million shares at 16.50 Swiss francs each, a 1.4% discount on the stock's closing price on the day before the transaction. However, the deal generated a net return of more than 30% over a period of around eight months.
Source: ECB.
39
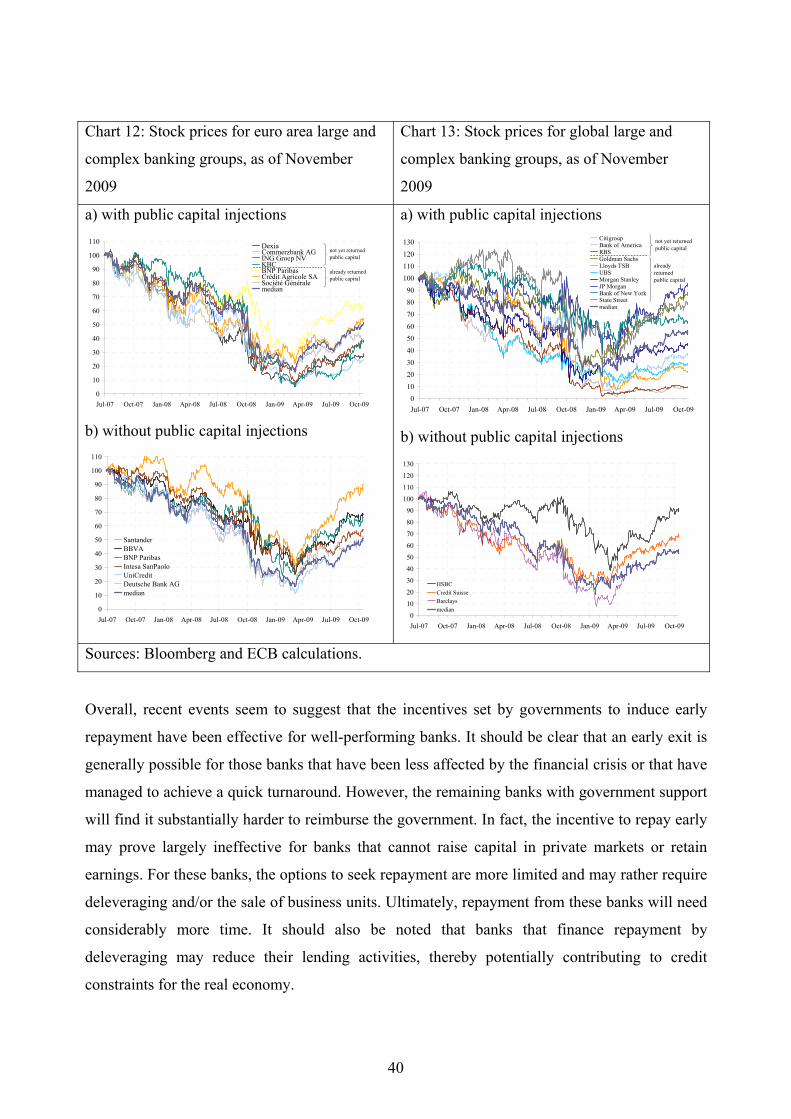
Chart 12: Stock prices for euro area large and
complex banking groups, as of November
2009
Chart 13: Stock prices for global large and
complex banking groups, as of November
2009
a) with public capital injections
0
10
20
30
40
50
60
70
80
90
100
110
Jul-07 Oct-07 Jan-08 Apr-08 Jul-08 Oct-08 Jan-09 Apr-09 Jul-09 Oct-09
DexiaCommerzbank AGING Groep NVKBCBNP ParibasCrédit Agricole SASociété Généralemedian
not yet returned public capital
already returned public capital
b) without public capital injections
0
10
20
30
40
50
60
70
80
90
100
110
Jul-07 Oct-07 Jan-08 Apr-08 Jul-08 Oct-08 Jan-09 Apr-09 Jul-09 Oct-09
SantanderBBVABNP ParibasIntesa SanPaoloUniCreditDeutsche Bank AGmedian
a) with public capital injections
0102030405060708090
100110120130
Jul-07 Oct-07 Jan-08 Apr-08 Jul-08 Oct-08 Jan-09 Apr-09 Jul-09 Oct-09
CitigroupBank of AmericaRBSGoldman SachsLloyds TSBUBSMorgan StanleyJP MorganBank of New YorkState Streetmedian
not yet returned public capital
already returned public capital
b) without public capital injections
0
10
20
30
40
50
60
70
80
90
100
110
120
130
Jul-07 Oct-07 Jan-08 Apr-08 Jul-08 Oct-08 Jan-09 Apr-09 Jul-09 Oct-09
HSBCCredit SuisseBarclaysmedian
Sources: Bloomberg and ECB calculations.
Overall, recent events seem to suggest that the incentives set by governments to induce early
repayment have been effective for well-performing banks. It should be clear that an early exit is
generally possible for those banks that have been less affected by the financial crisis or that have
managed to achieve a quick turnaround. However, the remaining banks with government support
will find it substantially harder to reimburse the government. In fact, the incentive to repay early
may prove largely ineffective for banks that cannot raise capital in private markets or retain
earnings. For these banks, the options to seek repayment are more limited and may rather require
deleveraging and/or the sale of business units. Ultimately, repayment from these banks will need
considerably more time. It should also be noted that banks that finance repayment by
deleveraging may reduce their lending activities, thereby potentially contributing to credit
constraints for the real economy.
40
In addition, the Swiss example shows that governments can also pursue exit proactively through
the sale of their stakes. However, this requires a sufficient increase in stock prices to protect the
taxpayers’ interest and markets that are capable of absorbing the large government stakes.
Exit from asset support Most of the asset support has been granted through ad hoc measures tailored to individual
institutions. Schemes are rare and have only been set up recently (Ireland, Germany, United
States). They normally specify an enrolment window during which eligible financial institutions
can sign up. After the enrolment window has passed, the scheme is closed and cannot be
accessed any more.
As asset support is granted for the life of the underlying assets, asset support measures are
generally self-liquidating. It should be noted, however, that owing to the long maturity of the
underlying assets, asset support measures will be in place for a considerable time in the future.
In principle, asset support measures can be terminated prior to the maturity of the underlying
assets. In the case of asset removal measures, the asset manager – be it a private investor (e.g.
under the PPIP in the United States) or a public agency (e.g. the NAMA in Ireland) – can sell the
assets when market prices improve. In the case of asset insurance measures, where the assets are
ring-fenced and stay on the financial institution’s balance sheet, the financial institution could
terminate the guarantee arrangement. An early exit of this kind has not been observed so far, as
the measures have only been recently introduced. What has been observed, however, is the
withdrawal by some banks from measures that have been announced, but not yet implemented.
In the United States, following the release of the results of the Supervisory Capital Assessment
Program, BofA announced that it did not plan to move forward with the asset insurance measure
agreed earlier with the US Treasury, the Fed, and the FDIC. Hence, the ring-fencing arrangement
was abandoned without having been implemented, and BofA paid an exit fee of USD 425 billion
to the authorities involved in September 2009 in return for the implicit protection already
provided since the announcement of the asset insurance agreement. In the UK, Lloyds exited in
November 2009 from its March 2009 agreement with the government to share losses on a
GBP 260 billion pool of assets as, owing to improved market conditions, it was able to raise
enough capital to cover the potential losses on its portfolio. Lloyds paid the government an exit
fee of GBP 2.5 billion.
In sum, exit from asset support is less complex than entry. However, it is not yet present in the
current policy debate, as the asset support measures have only recently been introduced or are
currently still being put in place.
41
4 Preliminary assessment of the measures adopted The unparalleled nature of the response to the financial crisis discussed so far makes an
assessment clearly desirable. Since the counterfactual is unobservable and the implementation
process is still ongoing, the effectiveness of the measures taken is difficult to judge with
precision at this stage. Acknowledging these limitations, this section nevertheless offers a
preliminary assessment of the effectiveness of the measures. This assessment is made with
reference to the objectives stated in the declaration of the emergency summit of euro area heads of
government in Paris on 12 October 2008, i.e. (i) safeguarding financial stability; (ii) promoting a
timely return to normal market conditions; (iii) restoring the provision of credit and lending to
the economy; (iv) restoring the long-term viability of the banking sector; and (v) containing the
impact on public finances and preserving taxpayers’ interests.
4.1 Safeguarding financial stability and promoting a timely return to normal market conditions
The measures were successful in averting a further escalation of the crisis in late 2008. Initial
empirical evidence suggests that government support measures have been effective in reducing
banks’ default risk, which is reflected by patterns in CDS spreads (see Bank for International
Settlements, 2009). More specifically, capital injections seem to have been more effective than
debt guarantees and asset purchases in reducing banks’ CDS spreads. However, the elevated
levels of interbank money market spreads and banks’ CDS spreads, as well as the depressed
level of bank stock prices reflect continued pessimistic investor sentiment towards the banking
sector (see Charts 15 and 16). While the positive developments in these indicators since March
2009 indicated a cautious return of confidence in the market, the increase in CDS spreads and
decrease in stock prices since April 2010 reflect the renewed financial market tensions owing to
sovereign risk concerns. Similarly, after the three-month euro and dollar LIBOR spreads over
market overnight interest rates, a measure of credit risk, had fallen to their lowest levels since the
collapse of Lehman Brothers in September 2008, they have slightly ticked up since April 2010
(see Chart 17).
Moreover, the financial rescue measures appear to have led to significant cross-border spillovers
(see International Monetary Fund, 2009c). Particularly after the default of Lehman Brothers,
policy announcements of support measures in the United States can be seen to have had a
positive effect on, inter alia, the euro area, once financial conditions had stabilised.
42
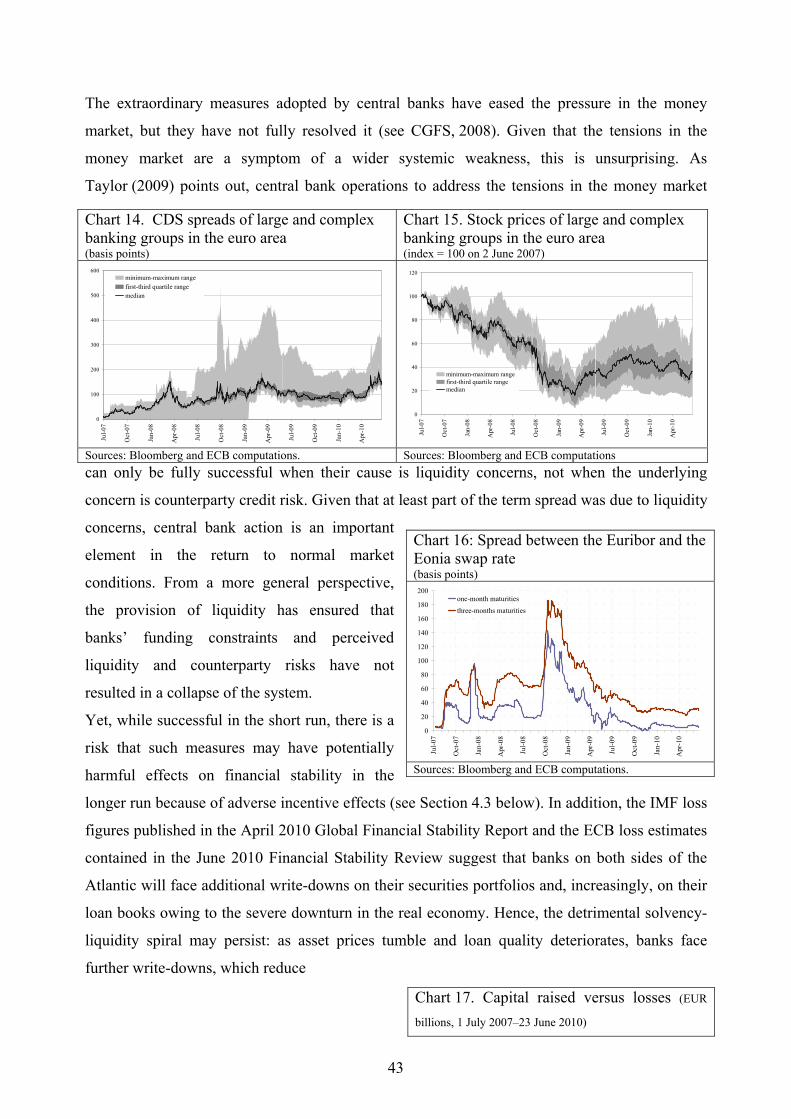
The extraordinary measures adopted by central banks have eased the pressure in the money
market, but they have not fully resolved it (see CGFS, 2008). Given that the tensions in the
money market are a symptom of a wider systemic weakness, this is unsurprising. As
Taylor (2009) points out, central bank operations to address the tensions in the money market
can only be fully successful when their cause is liquidity concerns, not when the underlying
concern is counterparty credit risk. Given that at least part of the term spread was due to liquidity
concerns, central bank action is an important
element in the return to normal market
conditions. From a more general perspective,
the provision of liquidity has ensured that
banks’ funding constraints and perceived
liquidity and counterparty risks have not
resulted in a collapse of the system.
Yet, while successful in the short run, there is a
risk that such measures may have potentially
harmful effects on financial stability in the
longer run because of adverse incentive effects (see Section 4.3 below). In addition, the IMF loss
figures published in the April 2010 Global Financial Stability Report and the ECB loss estimates
contained in the June 2010 Financial Stability Review suggest that banks on both sides of the
Atlantic will face additional write-downs on their securities portfolios and, increasingly, on their
loan books owing to the severe downturn in the real economy. Hence, the detrimental solvency-
liquidity spiral may persist: as asset prices tumble and loan quality deteriorates, banks face
further write-downs, which reduce
Chart 14. CDS spreads of large and complex banking groups in the euro area (basis points)
Chart 15. Stock prices of large and complex banking groups in the euro area (index = 100 on 2 June 2007)
0
100
200
300
400
500
600
Jul-0
7
Oct
-07
Jan-
08
Apr
-08
Jul-0
8
Oct
-08
Jan-
09
Apr
-09
Jul-0
9
Oct
-09
Jan-
10
Apr
-10
minimum-maximum rangefirst-third quartile rangemedian
0
20
40
60
80
100
120
Jul-0
7
Oct
-07
Jan-
08
Apr
-08
Jul-0
8
Oct
-08
Jan-
09
Apr
-09
Jul-0
9
Oct
-09
Jan-
10
Apr
-10
minimum-maximum rangefirst-third quartile rangemedian
Sources: Bloomberg and ECB computations. Sources: Bloomberg and ECB computations
Chart 16: Spread between the Euribor and the Eonia swap rate (basis points)
0
20
40
60
80
100
120
140
160
180
200
Jul-0
7
Oct
-07
Jan-
08
Apr
-08
Jul-0
8
Oct
-08
Jan-
09
Apr
-09
Jul-0
9
Oct
-09
Jan-
10
Apr
-10
one-month maturities
three-months maturities
Sources: Bloomberg and ECB computations.
Chart 17. Capital raised versus losses (EUR
billions, 1 July 2007–23 June 2010)
43
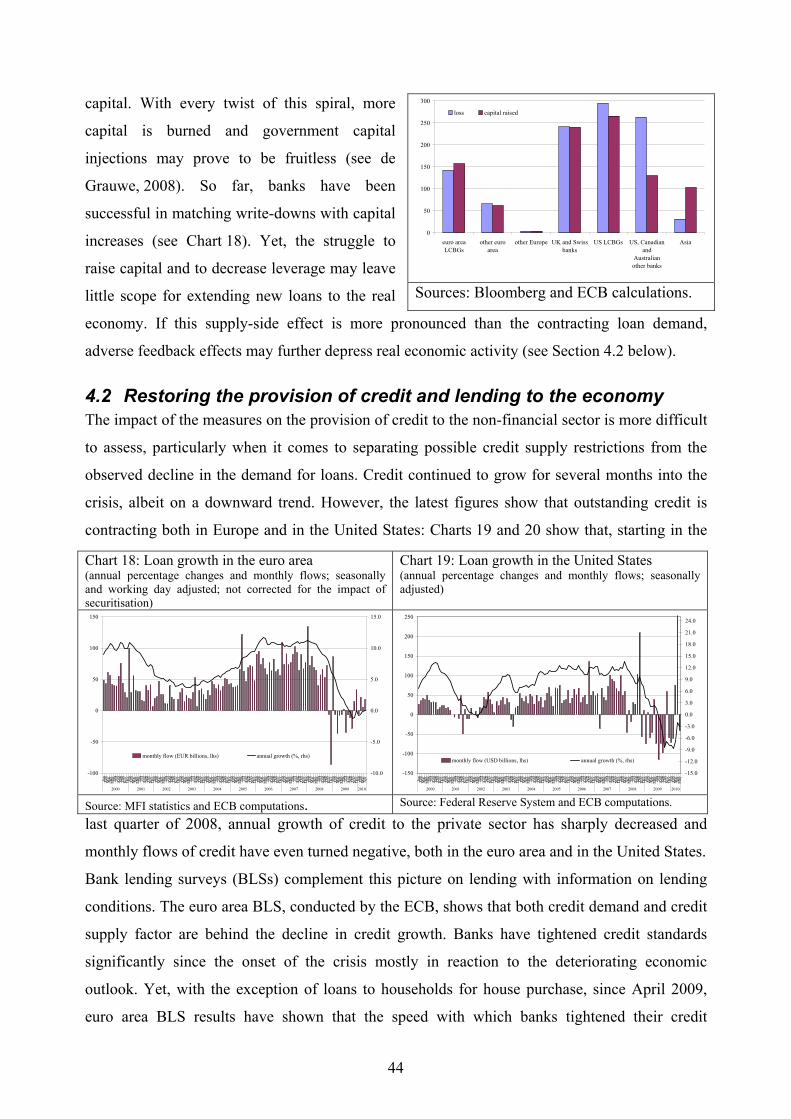
capital. With every twist of this spiral, more
capital is burned and government capital
injections may prove to be fruitless (see de
Grauwe, 2008). So far, banks have been
successful in matching write-downs with capital
increases (see Chart 18). Yet, the struggle to
raise capital and to decrease leverage may leave
little scope for extending new loans to the real
economy. If this supply-side effect is more pronounced than the contracting loan demand,
adverse feedback effects may further depress real economic activity (see Section 4.2 below).
4.2 Restoring the provision of credit and lending to the economy The impact of the measures on the provision of credit to the non-financial sector is more difficult
to assess, particularly when it comes to separating possible credit supply restrictions from the
observed decline in the demand for loans. Credit continued to grow for several months into the
crisis, albeit on a downward trend. However, the latest figures show that outstanding credit is
contracting both in Europe and in the United States: Charts 19 and 20 show that, starting in the
last quarter of 2008, annual growth of credit to the private sector has sharply decreased and
monthly flows of credit have even turned negative, both in the euro area and in the United States.
Bank lending surveys (BLSs) complement this picture on lending with information on lending
conditions. The euro area BLS, conducted by the ECB, shows that both credit demand and credit
supply factor are behind the decline in credit growth. Banks have tightened credit standards
significantly since the onset of the crisis mostly in reaction to the deteriorating economic
outlook. Yet, with the exception of loans to households for house purchase, since April 2009,
euro area BLS results have shown that the speed with which banks tightened their credit
0
50
100
150
200
250
300
euro areaLCBGs
other euroarea
other Europe UK and Swissbanks
US LCBGs US, Canadianand
Australianother banks
Asia
loss capital raised
Sources: Bloomberg and ECB calculations.
Chart 18: Loan growth in the euro area (annual percentage changes and monthly flows; seasonally and working day adjusted; not corrected for the impact of securitisation)
Chart 19: Loan growth in the United States (annual percentage changes and monthly flows; seasonally adjusted)
-100
-50
0
50
100
150
Jan
Feb
Mar
Apr
May Jun
Jul
Aug Sep
Oct
Nov Dec Jan
Feb
Mar
Apr
May Jun
Jul
Aug Sep
Oct
Nov Dec Jan
Feb
Mar
Apr
May Jun
Jul
Aug Sep
Oct
Nov Dec Jan
Feb
Mar
Apr
May Jun
Jul
Aug Sep
Oct
Nov Dec Jan
Feb
Mar
Apr
May Jun
Jul
Aug Sep
Oct
Nov Dec Jan
Feb
Mar
Apr
May Jun
Jul
Aug Sep
Oct
Nov Dec Jan
Feb
Mar
Apr
May Jun
Jul
Aug Sep
Oct
Nov Dec Jan
Feb
Mar
Apr
May Jun
Jul
Aug Sep
Oct
Nov Dec Jan
Feb
Mar
Apr
May Jun
Jul
Aug Sep
Oct
Nov Dec Jan
Feb
Mar
Apr
May Jun
Jul
Aug Sep
Oct
Nov Dec Jan
Feb
Mar
Apr
2000 2001 2002 2003 2004 2005 2006 2007 2008 2009 2010
-10.0
-5.0
0.0
5.0
10.0
15.0
monthly flow (EUR billions, lhs) annual growth (%, rhs)
-150
-100
-50
0
50
100
150
200
250
Jan
Feb
Mar
Apr
May Jun
Jul
Aug Sep
Oct
Nov Dec Jan
Feb
Mar
Apr
May Jun
Jul
Aug Sep
Oct
Nov Dec Jan
Feb
Mar
Apr
May Jun
Jul
Aug Sep
Oct
Nov Dec Jan
Feb
Mar
Apr
May Jun
Jul
Aug Sep
Oct
Nov Dec Jan
Feb
Mar
Apr
May Jun
Jul
Aug Sep
Oct
Nov Dec Jan
Feb
Mar
Apr
May Jun
Jul
Aug Sep
Oct
Nov Dec Jan
Feb
Mar
Apr
May Jun
Jul
Aug Sep
Oct
Nov Dec Jan
Feb
Mar
Apr
May Jun
Jul
Aug Sep
Oct
Nov Dec Jan
Feb
Mar
Apr
May Jun
Jul
Aug Sep
Oct
Nov Dec Jan
Feb
Mar
Apr
May Jun
Jul
Aug Sep
Oct
Nov Dec Jan
Feb
Mar
Apr
May
2000 2001 2002 2003 2004 2005 2006 2007 2008 2009 2010
-15.0
-12.0
-9.0
-6.0
-3.0
0.0
3.0
6.0
9.0
12.0
15.0
18.0
21.0
24.0
monthly flow (USD billions, lhs) annual growth (%, rhs)
Source: MFI statistics and ECB computations. Source: Federal Reserve System and ECB computations.
44
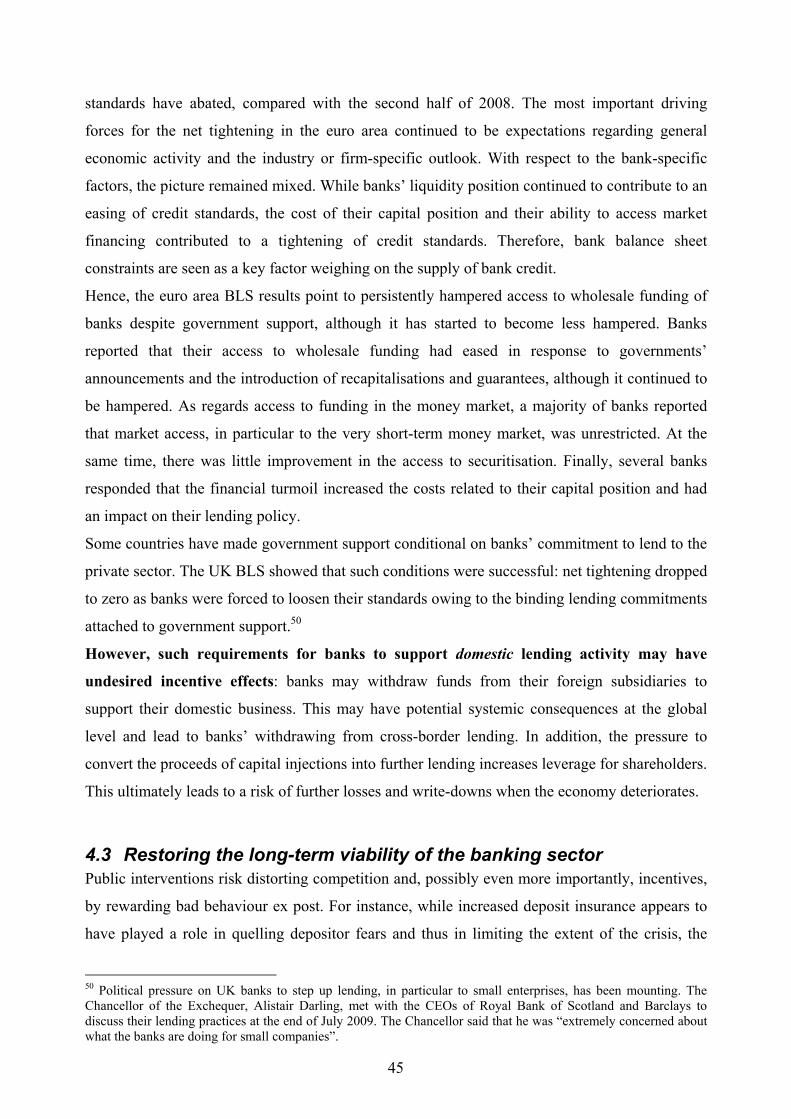
standards have abated, compared with the second half of 2008. The most important driving
forces for the net tightening in the euro area continued to be expectations regarding general
economic activity and the industry or firm-specific outlook. With respect to the bank-specific
factors, the picture remained mixed. While banks’ liquidity position continued to contribute to an
easing of credit standards, the cost of their capital position and their ability to access market
financing contributed to a tightening of credit standards. Therefore, bank balance sheet
constraints are seen as a key factor weighing on the supply of bank credit.
Hence, the euro area BLS results point to persistently hampered access to wholesale funding of
banks despite government support, although it has started to become less hampered. Banks
reported that their access to wholesale funding had eased in response to governments’
announcements and the introduction of recapitalisations and guarantees, although it continued to
be hampered. As regards access to funding in the money market, a majority of banks reported
that market access, in particular to the very short-term money market, was unrestricted. At the
same time, there was little improvement in the access to securitisation. Finally, several banks
responded that the financial turmoil increased the costs related to their capital position and had
an impact on their lending policy.
Some countries have made government support conditional on banks’ commitment to lend to the
private sector. The UK BLS showed that such conditions were successful: net tightening dropped
to zero as banks were forced to loosen their standards owing to the binding lending commitments
attached to government support.50
However, such requirements for banks to support domestic lending activity may have
undesired incentive effects: banks may withdraw funds from their foreign subsidiaries to
support their domestic business. This may have potential systemic consequences at the global
level and lead to banks’ withdrawing from cross-border lending. In addition, the pressure to
convert the proceeds of capital injections into further lending increases leverage for shareholders.
This ultimately leads to a risk of further losses and write-downs when the economy deteriorates.
4.3 Restoring the long-term viability of the banking sector Public interventions risk distorting competition and, possibly even more importantly, incentives,
by rewarding bad behaviour ex post. For instance, while increased deposit insurance appears to
have played a role in quelling depositor fears and thus in limiting the extent of the crisis, the
50 Political pressure on UK banks to step up lending, in particular to small enterprises, has been mounting. The Chancellor of the Exchequer, Alistair Darling, met with the CEOs of Royal Bank of Scotland and Barclays to discuss their lending practices at the end of July 2009. The Chancellor said that he was “extremely concerned about what the banks are doing for small companies”.
45

longer-term issues concerning deposit insurance and particularly blanket guarantees should not
be ignored. The literature has shown that more generous deposit insurance increases the
likelihood of future crises (see Barth et al., 2001 and Demirgüç-Kunt and Detragiache, 2000).
In order to contain moral hazard in the future, governments have therefore been careful to limit
public support to illiquid, but solvent and viable institutions. It must be stated, however, that
assessing the long-term viability of financial institutions during a systemic crisis is a complex
and difficult task and, in most cases, rapid decisions were required to avert the collapse of single
institutions which threatened the stability of the financial system as a whole.51 A further measure
that has been proposed to limit moral hazard is the replacement of the incumbent
management. This is also an issue in the ongoing crisis, given that the management of numerous
government-supported banks have remained in their positions.
Another critical issue that must be addressed to avoid repetition of the current crisis is the
regulation and supervision of large and complex financial institutions. A specific
characteristic of the ongoing crisis is that it is primarily a crisis of large financial institutions.
The systemic threat posed by such banks has made public support necessary to safeguard the
stability of the financial system. However, the order of magnitude of these measures, highlighted
in Table 1, points to a new challenge for ensuring financial stability. A number of banks have
already reached a size at which government support is no longer a viable option. The failure of
the Icelandic banks has shown that institutions can reach a size that overwhelms a government’s
support capabilities. As a consequence, declarations of no support in the future for such
institutions may lack credibility and concerns about a time inconsistency problem will become
more serious (see Kydland and Prescott, 1977). In order to address the moral hazard issues that
may arise, they need to be explicitly addressed. Current proposals in academic and policy circles
comprise a wide array of ideas that are potentially complementary. First, calls for capital and
liquidity surcharges for systemically relevant institutions have been voiced. Second, a further
proposal aims to limit the size of banks by restructuring large ones, in order to downsize them by
shedding non-viable business lines. Third, the need for an orderly mechanism to close and
wind down large banks and for enhanced early intervention has been recognised. More
specifically, this has become an issue in the United States, where the prompt corrective action
(PCA) mechanism could not be equally applied to large and complex financial intermediaries
without causing damage to the financial system. Fourth, measures to reduce the
51 In this vein, the IMF recommends in its April 2009 GFSR that supervisors who are in the process of evaluating the viability of banks look into a whole range of aspects, such as write-downs and available capital, funding structures, business plans and risk management processes, the appropriateness of compensation policies and the strength of management.
46
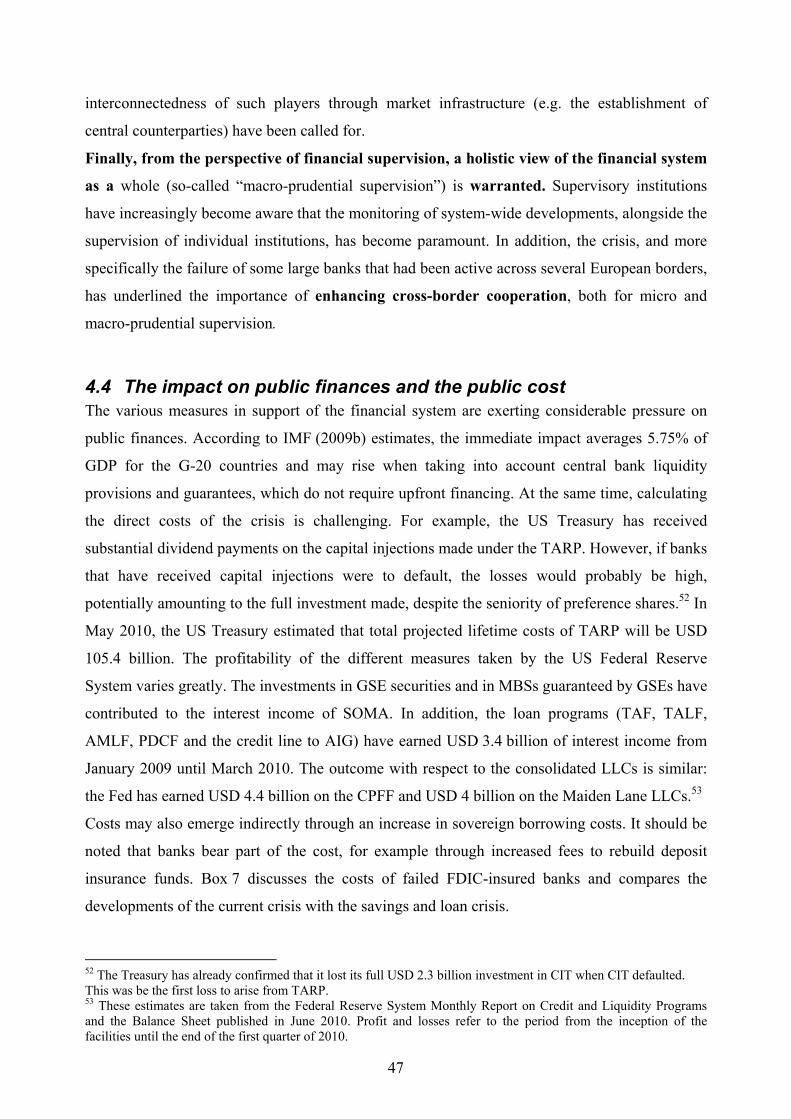
interconnectedness of such players through market infrastructure (e.g. the establishment of
central counterparties) have been called for.
Finally, from the perspective of financial supervision, a holistic view of the financial system
as a whole (so-called “macro-prudential supervision”) is warranted. Supervisory institutions
have increasingly become aware that the monitoring of system-wide developments, alongside the
supervision of individual institutions, has become paramount. In addition, the crisis, and more
specifically the failure of some large banks that had been active across several European borders,
has underlined the importance of enhancing cross-border cooperation, both for micro and
macro-prudential supervision.
4.4 The impact on public finances and the public cost The various measures in support of the financial system are exerting considerable pressure on
public finances. According to IMF (2009b) estimates, the immediate impact averages 5.75% of
GDP for the G-20 countries and may rise when taking into account central bank liquidity
provisions and guarantees, which do not require upfront financing. At the same time, calculating
the direct costs of the crisis is challenging. For example, the US Treasury has received
substantial dividend payments on the capital injections made under the TARP. However, if banks
that have received capital injections were to default, the losses would probably be high,
potentially amounting to the full investment made, despite the seniority of preference shares.52 In
May 2010, the US Treasury estimated that total projected lifetime costs of TARP will be USD
105.4 billion. The profitability of the different measures taken by the US Federal Reserve
System varies greatly. The investments in GSE securities and in MBSs guaranteed by GSEs have
contributed to the interest income of SOMA. In addition, the loan programs (TAF, TALF,
AMLF, PDCF and the credit line to AIG) have earned USD 3.4 billion of interest income from
January 2009 until March 2010. The outcome with respect to the consolidated LLCs is similar:
the Fed has earned USD 4.4 billion on the CPFF and USD 4 billion on the Maiden Lane LLCs.53
Costs may also emerge indirectly through an increase in sovereign borrowing costs. It should be
noted that banks bear part of the cost, for example through increased fees to rebuild deposit
insurance funds. Box 7 discusses the costs of failed FDIC-insured banks and compares the
developments of the current crisis with the savings and loan crisis.
52 The Treasury has already confirmed that it lost its full USD 2.3 billion investment in CIT when CIT defaulted. This was be the first loss to arise from TARP. 53 These estimates are taken from the Federal Reserve System Monthly Report on Credit and Liquidity Programs and the Balance Sheet published in June 2010. Profit and losses refer to the period from the inception of the facilities until the end of the first quarter of 2010.
47
48
The various measures taken to support the financial sector are expected to have a limited
direct impact on government deficits in the short to medium term. The impact on government
debt largely depends on the government borrowing that is required to finance the rescue
operations.54 Potential fiscal risks are sizeable for all countries that have established a guarantee
scheme, as it may negatively affect market perceptions of their creditworthiness. In addition, the
economic downturn and the sizeable fiscal packages adopted to counter the recession aggravate
the overall impact on public debt.55 Given the size of the commitments assumed during the
current crisis, the credibility of the guarantees may be called into question if governments
become unable or unwilling to pay (see Hoggarth and Reidhill, 2003). In fact, partly as a result
of the substantial government guarantee, rating agencies have downgraded a number of euro area
countries (e.g. Ireland).
54 Recapitalisations of banks and other financial institutions through purchases of new equity at market prices are recorded as financial transactions without any (immediate) impact on the government deficit/surplus. Recapitalisations, loans and asset purchases increase government debt if the government has to borrow to finance these operations. Government securities lent or swapped without cash collateral in temporary liquidity schemes are not counted as government debt; neither are government guarantees, which are contingent liabilities in national accounts. Interest and dividend payments, as well as fees received for securities lent and guarantees provided, improve the government budget balance. More details of the statistical recording of public interventions to support the financial sector are provided in Box 1 in A. van Riet (editor), “Euro area fiscal policies and the crisis”, ECB Occasional Paper No. 109, April 2010. 55 The support measures had adverse impacts on the public debt positions of a number of euro area countries. That said, for the euro area as a whole, the government support of financial sectors was not the most important source of enlarged fiscal imbalances. The main reason for the severe deterioration of public finances was the activation of automatic stabilisers – that is the loss of tax revenue and higher government expenditure outlays that ordinarily results from weaker economic activity – as a consequence of the marked contraction of economic activity that followed the collapse of Lehman Brothers. Because the structural fiscal imbalances of a number of euro area countries were sizeable before the financial crisis erupted, fiscal deficits in those countries expanded to very high levels. Added to this were the discretionary fiscal measures taken by many countries to stimulate their economies following the agreement in December 2008 of the European Economic Recovery Plan. This fiscal stimulus came close to matching the impact on deficits of automatic stabilisers. More information on the impact of the financial crisis on fiscal positions is provided in A. van Riet (editor), “Euro area fiscal policies and the crisis”, ECB Occasional Paper No. 109, April 2010.
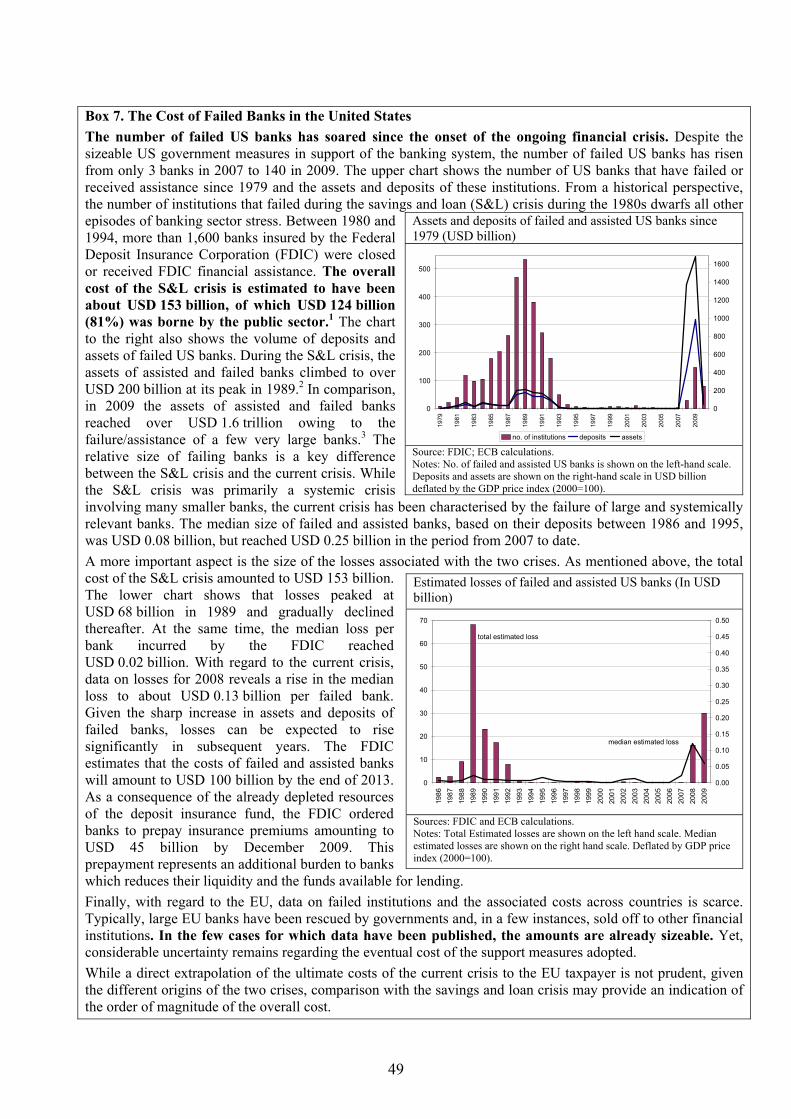
49
Box 7. The Cost of Failed Banks in the United States The number of failed US banks has soared since the onset of the ongoing financial crisis. Despite the sizeable US government measures in support of the banking system, the number of failed US banks has risen from only 3 banks in 2007 to 140 in 2009. The upper chart shows the number of US banks that have failed or received assistance since 1979 and the assets and deposits of these institutions. From a historical perspective, the number of institutions that failed during the savings and loan (S&L) crisis during the 1980s dwarfs all other episodes of banking sector stress. Between 1980 and 1994, more than 1,600 banks insured by the Federal Deposit Insurance Corporation (FDIC) were closed or received FDIC financial assistance. The overall cost of the S&L crisis is estimated to have been about USD 153 billion, of which USD 124 billion (81%) was borne by the public sector.1 The chart to the right also shows the volume of deposits and assets of failed US banks. During the S&L crisis, the assets of assisted and failed banks climbed to over USD 200 billion at its peak in 1989.2 In comparison, in 2009 the assets of assisted and failed banks reached over USD 1.6 trillion owing to the failure/assistance of a few very large banks.3 The relative size of failing banks is a key difference between the S&L crisis and the current crisis. While the S&L crisis was primarily a systemic crisis involving many smaller banks, the current crisis has been characterised by the failure of large and systemically relevant banks. The median size of failed and assisted banks, based on their deposits between 1986 and 1995, was USD 0.08 billion, but reached USD 0.25 billion in the period from 2007 to date. A more important aspect is the size of the losses associated with the two crises. As mentioned above, the total cost of the S&L crisis amounted to USD 153 billion. The lower chart shows that losses peaked at USD 68 billion in 1989 and gradually declined thereafter. At the same time, the median loss per bank incurred by the FDIC reached USD 0.02 billion. With regard to the current crisis, data on losses for 2008 reveals a rise in the median loss to about USD 0.13 billion per failed bank. Given the sharp increase in assets and deposits of failed banks, losses can be expected to rise significantly in subsequent years. The FDIC estimates that the costs of failed and assisted banks will amount to USD 100 billion by the end of 2013. As a consequence of the already depleted resources of the deposit insurance fund, the FDIC ordered banks to prepay insurance premiums amounting to USD 45 billion by December 2009. This prepayment represents an additional burden to banks which reduces their liquidity and the funds available for lending. Finally, with regard to the EU, data on failed institutions and the associated costs across countries is scarce. Typically, large EU banks have been rescued by governments and, in a few instances, sold off to other financial institutions. In the few cases for which data have been published, the amounts are already sizeable. Yet, considerable uncertainty remains regarding the eventual cost of the support measures adopted. While a direct extrapolation of the ultimate costs of the current crisis to the EU taxpayer is not prudent, given the different origins of the two crises, comparison with the savings and loan crisis may provide an indication of the order of magnitude of the overall cost.
Assets and deposits of failed and assisted US banks since 1979 (USD billion)
0
100
200
300
400
500
1979
1981
1983
1985
1987
1989
1991
1993
1995
1997
1999
2001
2003
2005
2007
2009
0
200
400
600
800
1000
1200
1400
1600
no. of institutions deposits assets
Source: FDIC; ECB calculations. Notes: No. of failed and assisted US banks is shown on the left-hand scale. Deposits and assets are shown on the right-hand scale in USD billion deflated by the GDP price index (2000=100).
Estimated losses of failed and assisted US banks (In USD billion)
0
10
20
30
40
50
60
70
1986
1987
1988
1989
1990
1991
1992
1993
1994
1995
1996
1997
1998
1999
2000
2001
2002
2003
2004
2005
2006
2007
2008
2009
0.00
0.05
0.10
0.15
0.20
0.25
0.30
0.35
0.40
0.45
0.50
total estimated loss
median estimated loss
Sources: FDIC and ECB calculations. Notes: Total Estimated losses are shown on the left hand scale. Median estimated losses are shown on the right hand scale. Deflated by GDP price index (2000=100).
50
5 Conclusion and outlook A key issue for the management of the crisis has been the extensive public support measures for
the financial sector. This paper gives a detailed description of the measures central banks and
governments have used in the EU and the United States. In addition, this paper presents a first
attempt to shed some light on the effectiveness of these measures.
As regards the measures used, the crisis responses in the United States have been largely
similar to those in the EU. First, they have employed broadly the same tools (government
guarantees, capital and liquidity injections and asset protection). Second, apart from their scope,
they have also been similar in size: the amounts committed by the US Treasury and the FDIC in
support of the financial sector represent 26% of GDP in the United States, which compares with
26% in the European Union and 28% in the euro area.56 Like the EU, the United States has relied
on a mix of ad hoc measures for individual institutions and schemes addressing the wider needs
of the financial system. Also, monetary policy actions and bank rescue measures have been
becoming more and more intertwined (examples of this being the asset purchase program in the
UK and the collateral requirements of the Eurosystem).
However, there are also important differences. For example, the Federal Reserve System has
been more expansive and has also targeted individual financial intermediaries, while the
Eurosystem’s actions have been limited to liquidity extension. A further key difference has been
the sizeable repayments of capital by US banks. This may be partly attributed to the fact that
capital injection was a requirement in the United States, while, in the EU, capital support has
typically been voluntary.
Within the EU, sizeable differences in crisis responses have emerged. These differences
partly reflect the magnitude of the problems faced by each banking system, the degree to which
the banking systems are exposed to bad assets and, potentially, budgetary restrictions, which
impose constraints on commitments. More specifically, a number of EU countries have set up
schemes to address the problems in the financial system, while many others have relied on ad
hoc measures for individual institutions. Given the wide range of approaches in the EU, the
United States naturally lies somewhere in between. A possible case in point is the widening of
56 These numbers exclude measures targeted at non-financial institutions and measures taken by the Federal Reserve System, the ECB, the BoE and other national central banks.
1. See T. Curry and L. Shibut (2000), “The Cost of the Savings and Loan Crisis: Truth and Consequences”, FDIC Banking Review Vol. 13, No.2. 2. Data on assets, deposits and losses are calculated in constant USD with base year 2000. A GDP price index was used to deflate the series. 3. The two largest banks involved were Citibank, which received assistance, and Washington Mutual.
51
deposit insurance to USD 250,000 in the United States, which appears high by EU standards, but
is dwarfed by the unlimited insurance granted by some EU countries.
Going forward, the crisis has raised considerable doubts as to the effectiveness of market
discipline (see de Grauwe, 2008) and underlined the need for reform of regulation and
supervision of the financial system. The reform process in both regions is ongoing. Efforts are
being directed at improving the existing regulatory rules, designing new supervisory tools and
enhancing the supervisory structure. With respect to the supervisory infrastructure, a key
initiative in the EU is the proposal for the establishment of a European Systemic Risk Board,
which will be an independent body responsible for conducting macro-prudential oversight of the
EU’s financial system as a whole and which will be supported analytically and logistically by the
ECB. With respect to improving the regulatory rules, a reform package is currently being
prepared by the Basel Committee on Banking Supervision as a cornerstone of the financial
regulatory reform. It aims at improving the quality, consistency and transparency of capital for
credit institutions as well as developing a framework for liquidity risk. These proposals will
improve the quality of capital, especially the so-called Tier-1 capital, which is of utmost
importance for loss-absorption on a going concern basis. Furthermore, a non-risk-based leverage
ratio will be introduced as a supplementary measure to the Basel II risk control framework, with
the objective to curb excessive balance sheet growth. In order to mitigate the inherent pro-
cyclical nature of financial activities, the Basel proposals also contain capital buffers and
forward-looking provisioning. Finally, the proposals also include a global minimum liquidity
risk requirements enabling credit institutions to withstand a short-term liquidity stress and ensure
longer-term stability.
In addition, policy-makers must find viable exit strategies from the support measures and
address the particular issues raised by systemically important banks. The financial crisis has
demonstrated the need to subject systemically important financial institutions to regulatory and
supervisory requirements, commensurate to the risks they pose to the financial system and the
real economy. One of the issues currently under debate is the introduction of additional
prudential measures, for instance through capital surcharges or contingent capital instruments,
liquidity surcharges, more intrusive supervision, and/or the introduction of bank levies. Finally,
the events have underlined the need for an efficient bank rescue mechanism. In particular, the
crisis involving Fortis and Dexia (Box 4), the Icelandic bank failures, and Lehman Brothers
highlight the need for further improvement of the cross-border rescue framework.57
57 In Europe, several international fora have started to look into these issues (including the EC, the Committee of European Banking Supervisors and the European Banking Committee).
References
Barth, J.R., G. Caprio and R. Levine (2001), “Regulation and Supervision: What Works Best?”,
World Bank Policy Research Paper No. 2725.
Basel Committee on Banking Supervision (2005), “Basel II: International Convergence of
Capital Measurement and Capital Standards: A Revised Framework”, November, Part II.
Bank for International Settlements (2009), “An Assessment of Financial Sector Rescue
Programmes”, BIS Papers No. 48.
Blanchard, O. (2008), “The Crisis: Basic Mechanisms, and Appropriate Policies”, MIT Working
Paper Series 09-01.
Committee on the Global Financial System (2008), “Central Bank Responses to the Financial
Turmoil”, CGFS Papers No. 31, July.
De Grauwe, P. (2008), “The Banking Crisis: Causes, Consequences and Remedies”, CEPS
Policy Brief No. 178, November.
Demirgüç-Kunt, A. and E. Detragiache (2002), “Does Deposit Insurance Increase Banking
System Instability? An Empirical Investigation”, Journal of Monetary Economics, Vol. 49,
pp.1373-1406.
European Central Bank (2008), “Financial Stability Review”, December.
European Central Bank (2009), “Governing council decisions on non-standard measures”,
Monthly Bulletin, June.
European Commission (2009), “The Recapitalisation of Financial Institutions in the Current
Financial Crisis: Limitation of Aid to the Minimum Necessary and Safeguards against undue
Distortions of Competition”, Official Journal of the European Union, C10/2, 15.01.2009.
Gorton, G. (2008), “The Subprime Panic”, NBER Working Paper 14398.
52
Hoggarth, G. and J. Reidhill (2003), “Resolution of banking crises: a review”, Bank of England
Financial Stability Review, December.
Lindgren, C.-J., T.J.T. Baliño, C. Enoch, A.-M. Gulde, M. Quintyn, and L. Teo (1999), “Financial Sector Crisis and Restructuring: Lessons from Asia”, IMF Occasional Paper No. 188.
International Monetary Fund (2009a), “Global Financial Stability Report”, April.
International Monetary Fund (2009b), “Fiscal Implications of the Global Economic and
Financial Crisis”, IMF Staff Position Note 13, June.
International Monetary Fund (2009c), “Global Financial Stability Report”, October.
International Monetary Fund (2009d), “Greece: Selected Issues”, IMF Country Report No.
09/245
Kydland, F. and E. Prescott (1977), “Rules Rather than Discretion: The Inconsistency of Optimal Plans”, Journal of Political Economy 85 (3), 473.
Petrovic, A. and R. Tutsch (2009), “National Rescue Measures in Response to the Current
Financial Crisis”, ECB Legal Working Paper No. 8, July.
Reserve Bank of Australia (2009), “Financial Stability Review”, March.
Taylor, J. (2009), “The Financial Crisis and the Policy Responses: An Empirical Analysis of
What Went Wrong”, NBER Working paper 14631
van Riet, A. (editor), “Euro area fiscal policies and the crisis”, ECB Occasional Paper No. 109,
April 2010.
53
Appendix 1. The support measures in the United States
This appendix describes the measures taken by the Treasury, the FDIC, and the Federal Reserve
System in response to the current financial crisis. With respect to the Fed, it describes the non-
standard measures in support of the financial sector. More specifically, the focus is on the
numerous facilities set up in support of specific institutions and market segments.
Description of measures
The crisis response of the US Administration consists of four large building blocks: (i) The
Treasury’s Troubled Asset Relief Program (TARP); (ii) The FDIC’s Temporary Liquidity
Guarantee Program; (iii) measures targeted at the Government Sponsored Entities, which are
administered by the Treasury and the Fed; and (iv) the Fed’s unconventional measures. Table 4
gives an overview of the various programs (including the committed and disbursed amounts),
which are described in more detail below.
TARP/Financial Stability Program
The Troubled Assets Relief Program (TARP) was established under the Emergency Economic
Stabilization Act of 3 October 2008 (EESA) with the specific goal of stabilizing the US financial
system and preventing a systemic collapse. TARP has a volume of USD 700 billion and is run by
the Treasury's new Office of Financial Stability. The measures taken under TARP encompass
capital injections, loans and asset guarantees and target both the financial and non-financial
sector. Originally, the mandate of TARP was to purchase or insure "troubled" assets of financial
institutions. This mandate, however, has been flexibly adjusted and extended as needs have
arisen. The scope was first extended in mid-October 2008 to allow for capital injections and in
November 2008 to allow for the support of the automobile industry. These amendments are
reflected in the establishment of several programs under TARP. Table 5 gives an overview of the
objectives of the programs. Some of these programs have stringent rules for participation, a
narrow choice of instruments and strict conditions (e.g. CPP and the Consumer and Business
Lending Initiative Investment Program implemented under TALF). Others have been designed to
provide the Treasury with a high degree of flexibility (e.g. AGP, TIP and SSFI), which has been
used to tailor their application to specific institutions. Under the umbrella of the Financial
Stability Plan, the Treasury’s new extended crisis management strategy, some of the programs
set up under TARP have been extended (e.g. the Consumer and Business Lending Initiative
Investment Program implemented under TALF) and new programs have been set up (e.g. CAP
and PPIP). Out of a total of USD 700 billion, USD 536 billion have so far been allocated to
54
specific programs and USD 384 billion have already been used, which makes the take-up rate
about 72%.58
FDIC measures
Starting on 14 October 2008, the Temporary Liquidity Guarantee Program (TLGP) has tried to
strengthen confidence and encourage liquidity in the banking system by (i) guaranteeing newly
issued senior unsecured debt of banks, thrifts, and certain holding companies (the Debt
Guarantee Program), and by providing full coverage of non-interest bearing deposit transaction
accounts, regardless of the dollar amount (the Transaction Account Guarantee Program
(TAGP)). Table 6 provides some details of these two programs. The FDIC has estimated that
about USD 700 billion of deposits in non-interest bearing transaction accounts have been
guaranteed which otherwise would not have been insured.59 Banks could choose to opt out of
one or both of the programmes. With regard to the Debt Guarantee Program, the basis for the
pricing of newly issued debt is linked to the maturity of the debt.60 The amount of debt
guaranteed by the FDIC is limited to 125% of the par or face value of senior unsecured debt
outstanding as of 30 September 2008 per bank. For banks with no senior unsecured debt
outstanding, a limit of 2% of total liabilities applies. Based on these limits, the FDIC estimated
that the total amount of guaranteed debt that can be issued is about USD 609 billion. The debt
guarantee program was extended by six months for senior unsecured debt issued after 1 April
2009 and before 31 October 2009 and maturing before the end of 2012. However, a phasing out
process has been initiated by raising the assessment fee in accordance with the time at which the
debt was issued and the maturity date. In addition, non-insured depository institutions were
charged a higher fee. On 20 October 2009 the FDIC established a limited, six-month emergency
guarantee facility upon expiration of the Debt Guarantee Program. Under this emergency
guarantee facility, financial entities can apply to the FDIC for permission to issue FDIC-
guaranteed debt during the period from 31 October 2009 to 30 April 2010. The fee for issuing
debt under the emergency facility will be at least 300 basis points, which the FDIC reserves the
right to increase on a case-by-case basis, depending upon the risks presented by the issuing
entity. Overall, about USD 305 billion of FDIC insured debt was outstanding as of 30 April
2010. With regard to the TAGP, the participation fee consists of a 10 basis point annual rate
surcharge on non-interest-bearing transaction deposit amounts over USD 250,000. The TAGP
58 See http://www.financialstability.gov/docs/May%202010%20105(a)%20Report_final.pdf. 59 See http://www.fdic.gov/regulations/resources/tlgp/index.html for more details. 60 Fees will be determined by the amount of FDIC-guaranteed debt, the maturity of the debt (expressed in years) and the annualized assessment rate, which increases with the maturity of the debt.
55
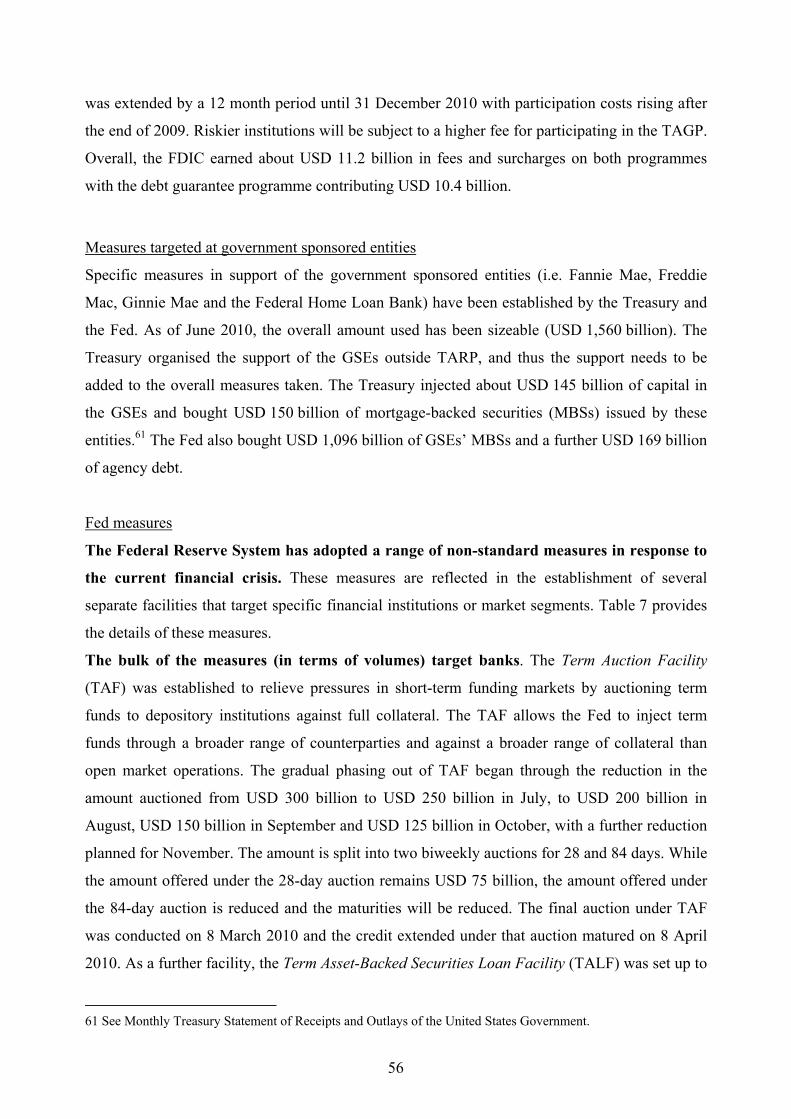
was extended by a 12 month period until 31 December 2010 with participation costs rising after
the end of 2009. Riskier institutions will be subject to a higher fee for participating in the TAGP.
Overall, the FDIC earned about USD 11.2 billion in fees and surcharges on both programmes
with the debt guarantee programme contributing USD 10.4 billion.
Measures targeted at government sponsored entities
Specific measures in support of the government sponsored entities (i.e. Fannie Mae, Freddie
Mac, Ginnie Mae and the Federal Home Loan Bank) have been established by the Treasury and
the Fed. As of June 2010, the overall amount used has been sizeable (USD 1,560 billion). The
Treasury organised the support of the GSEs outside TARP, and thus the support needs to be
added to the overall measures taken. The Treasury injected about USD 145 billion of capital in
the GSEs and bought USD 150 billion of mortgage-backed securities (MBSs) issued by these
entities.61 The Fed also bought USD 1,096 billion of GSEs’ MBSs and a further USD 169 billion
of agency debt.
Fed measures
The Federal Reserve System has adopted a range of non-standard measures in response to
the current financial crisis. These measures are reflected in the establishment of several
separate facilities that target specific financial institutions or market segments. Table 7 provides
the details of these measures.
The bulk of the measures (in terms of volumes) target banks. The Term Auction Facility
(TAF) was established to relieve pressures in short-term funding markets by auctioning term
funds to depository institutions against full collateral. The TAF allows the Fed to inject term
funds through a broader range of counterparties and against a broader range of collateral than
open market operations. The gradual phasing out of TAF began through the reduction in the
amount auctioned from USD 300 billion to USD 250 billion in July, to USD 200 billion in
August, USD 150 billion in September and USD 125 billion in October, with a further reduction
planned for November. The amount is split into two biweekly auctions for 28 and 84 days. While
the amount offered under the 28-day auction remains USD 75 billion, the amount offered under
the 84-day auction is reduced and the maturities will be reduced. The final auction under TAF
was conducted on 8 March 2010 and the credit extended under that auction matured on 8 April
2010. As a further facility, the Term Asset-Backed Securities Loan Facility (TALF) was set up to
61 See Monthly Treasury Statement of Receipts and Outlays of the United States Government.
56

help market participants meet the credit needs of households and small businesses by supporting
the issuance of asset-backed securities (ABSs). The more general objective is to make credit
available on more favourable terms by facilitating the issuance of ABSs and improving the
market conditions for ABSs. Eligible securities are collateralised by various types of loans such
as auto loans, student loans, credit card loans and commercial mortgage loans. Under TALF, the
Fed will lend up to USD 200 billion to an SPV which buys up ABSs, granting the borrowers one
and three-year loans and in exceptional cases loans for up to five years.62 The SPV is partially
funded through the US Treasury’s Troubled Assets Relief Program (TARP), which will purchase
USD 20 billion of subordinated debt in the SPV. TALF has been extended through 30 June 2010
for loans collateralized by newly issued CMBS and ceased making loans against all other types
of TALF-eligible newly issued and legacy ABS on 31 March 2010.
The Fed has also supported some financial institutions directly. The so-called Maiden Lane
transactions comprise three separate limited liability companies (LLCs) which acquired assets
from Bear Stearns and AIG.63 The Fed provided funding of USD 81.7 billion in the form of
senior loans to the LLCs. The duration of the loans is 10 years for the Bear Stearns’ facility and
6 years for the two AIG facilities.64 After the repayment of the loans, any remaining proceeds
from ML-I are paid to the Fed and, in the cases of ML-II and ML-III, shared between the Fed
and AIG. The transactions thus resemble a bad bank in which assets are transferred out of the
institutions’ balance sheets. In addition, the Fed made a lending facility available to AIG in
September 2008. The initial commitment under this facility was USD 85 billion secured by a
pledge of AIG’s assets. The commitment under this facility was reduced to USD 60 billion in
November as a result of a capital injection under TARP of USD 40 billion. In June 2009, AIG
agreed with the Fed to swap USD 25 billion of debt for equity which cut the amount of AIG’s
debt from USD 40 billion to USD 15 billion. More specifically, the transaction led to a reduction
in the maximum amount available under the lending facility from USD 60 billion to USD 35
billion in December 2009. Subsequent sales of business units by AIG further reduced the ceiling
of the credit facility to USD 34 billion as of May 2010. Finally, the Fed contributes to a ring-
62 The amount originally committed under TALF was USD 200 billion. An increase of up to USD 1,000 billion was under discussion in May 2009, but was ultimately dropped. 63 The two Maiden Lane transactions involving AIG differ as regards the asset pools acquired. Maiden Lane II involved the purchase of residential mortgage-backed securities and Maiden Lane III multi-sector collateralised debt obligations. 64 The interest rate for the senior loan to Maiden Lane I (ML-I) is based on the Primary Credit Rate while, in the other two cases, the interest rate is the one-month LIBOR plus 100 basis points.
57
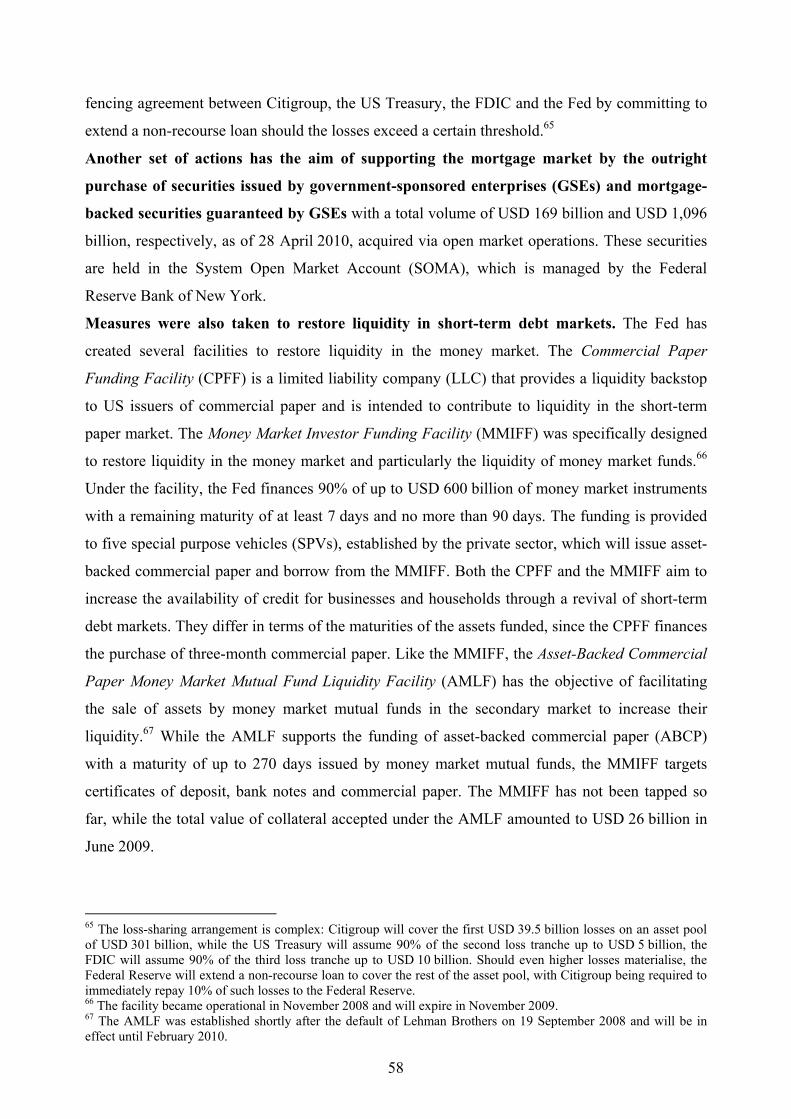
fencing agreement between Citigroup, the US Treasury, the FDIC and the Fed by committing to
extend a non-recourse loan should the losses exceed a certain threshold.65
Another set of actions has the aim of supporting the mortgage market by the outright
purchase of securities issued by government-sponsored enterprises (GSEs) and mortgage-
backed securities guaranteed by GSEs with a total volume of USD 169 billion and USD 1,096
billion, respectively, as of 28 April 2010, acquired via open market operations. These securities
are held in the System Open Market Account (SOMA), which is managed by the Federal
Reserve Bank of New York.
Measures were also taken to restore liquidity in short-term debt markets. The Fed has
created several facilities to restore liquidity in the money market. The Commercial Paper
Funding Facility (CPFF) is a limited liability company (LLC) that provides a liquidity backstop
to US issuers of commercial paper and is intended to contribute to liquidity in the short-term
paper market. The Money Market Investor Funding Facility (MMIFF) was specifically designed
to restore liquidity in the money market and particularly the liquidity of money market funds.66
Under the facility, the Fed finances 90% of up to USD 600 billion of money market instruments
with a remaining maturity of at least 7 days and no more than 90 days. The funding is provided
to five special purpose vehicles (SPVs), established by the private sector, which will issue asset-
backed commercial paper and borrow from the MMIFF. Both the CPFF and the MMIFF aim to
increase the availability of credit for businesses and households through a revival of short-term
debt markets. They differ in terms of the maturities of the assets funded, since the CPFF finances
the purchase of three-month commercial paper. Like the MMIFF, the Asset-Backed Commercial
Paper Money Market Mutual Fund Liquidity Facility (AMLF) has the objective of facilitating
the sale of assets by money market mutual funds in the secondary market to increase their
liquidity.67 While the AMLF supports the funding of asset-backed commercial paper (ABCP)
with a maturity of up to 270 days issued by money market mutual funds, the MMIFF targets
certificates of deposit, bank notes and commercial paper. The MMIFF has not been tapped so
far, while the total value of collateral accepted under the AMLF amounted to USD 26 billion in
June 2009.
65 The loss-sharing arrangement is complex: Citigroup will cover the first USD 39.5 billion losses on an asset pool of USD 301 billion, while the US Treasury will assume 90% of the second loss tranche up to USD 5 billion, the FDIC will assume 90% of the third loss tranche up to USD 10 billion. Should even higher losses materialise, the Federal Reserve will extend a non-recourse loan to cover the rest of the asset pool, with Citigroup being required to immediately repay 10% of such losses to the Federal Reserve. 66 The facility became operational in November 2008 and will expire in November 2009. 67 The AMLF was established shortly after the default of Lehman Brothers on 19 September 2008 and will be in effect until February 2010.
58

The latest measures, introduced in March 2009, were two facilities in support of primary
dealers: (i) the Term Securities Lending Facility (TSLF), an expansion of the Fed’s securities
lending program, under which the Fed lends up to USD 200 billion of Treasury securities to
primary dealers, secured for a month (rather than overnight, as in the existing program) by a
pledge of other securities; and (ii) the Primary Dealer Credit Facility (PDCF), which provides
overnight funding to primary dealers in exchange for a specified range of collateral, thereby
improving the ability of primary dealers to provide financing to participants in securitisation
markets.
59
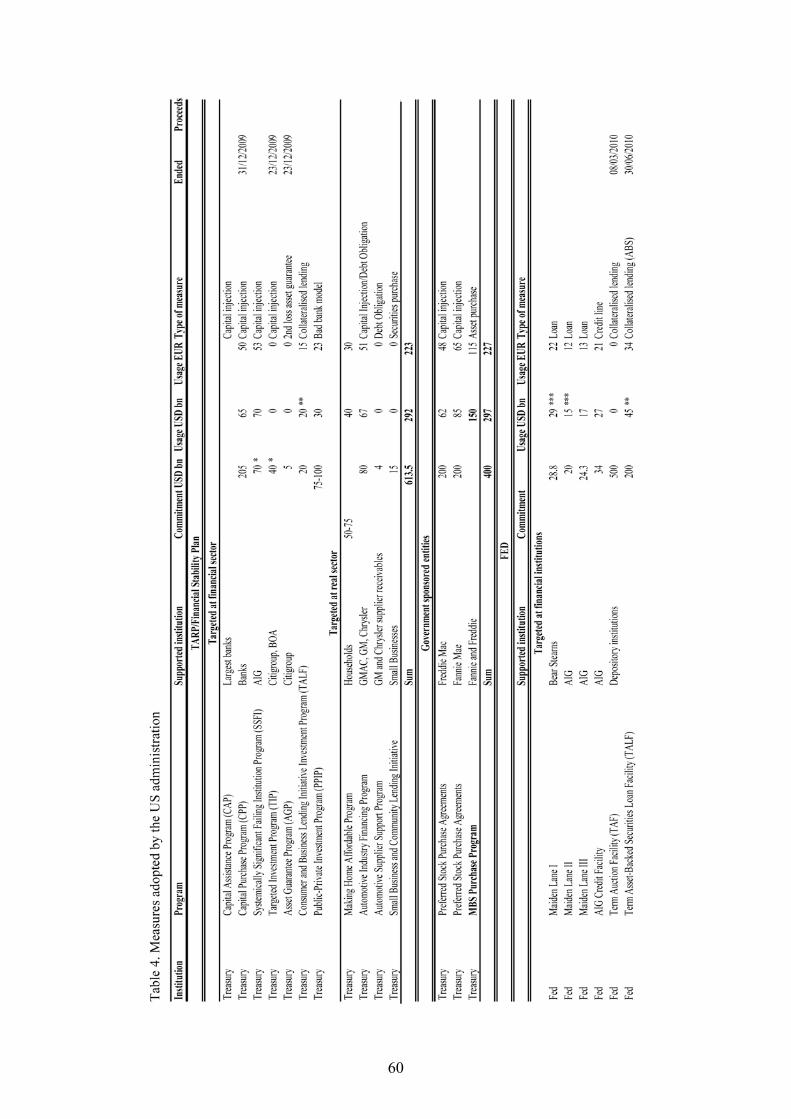
60
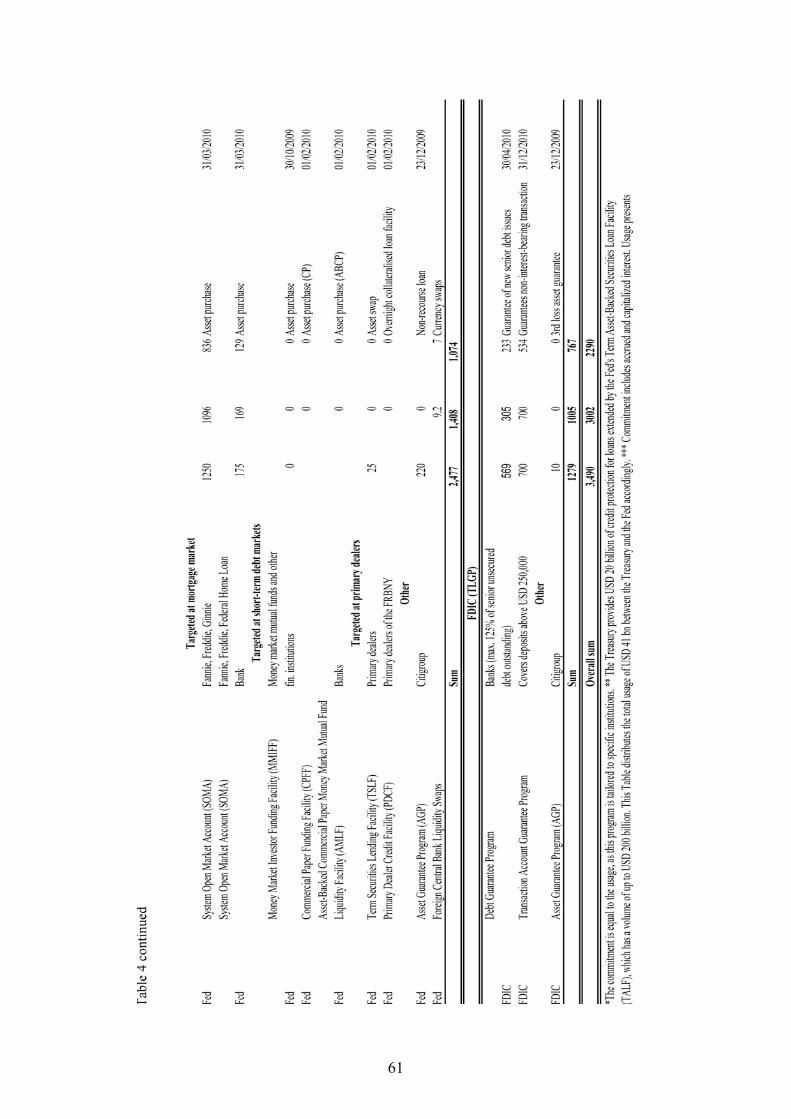
61
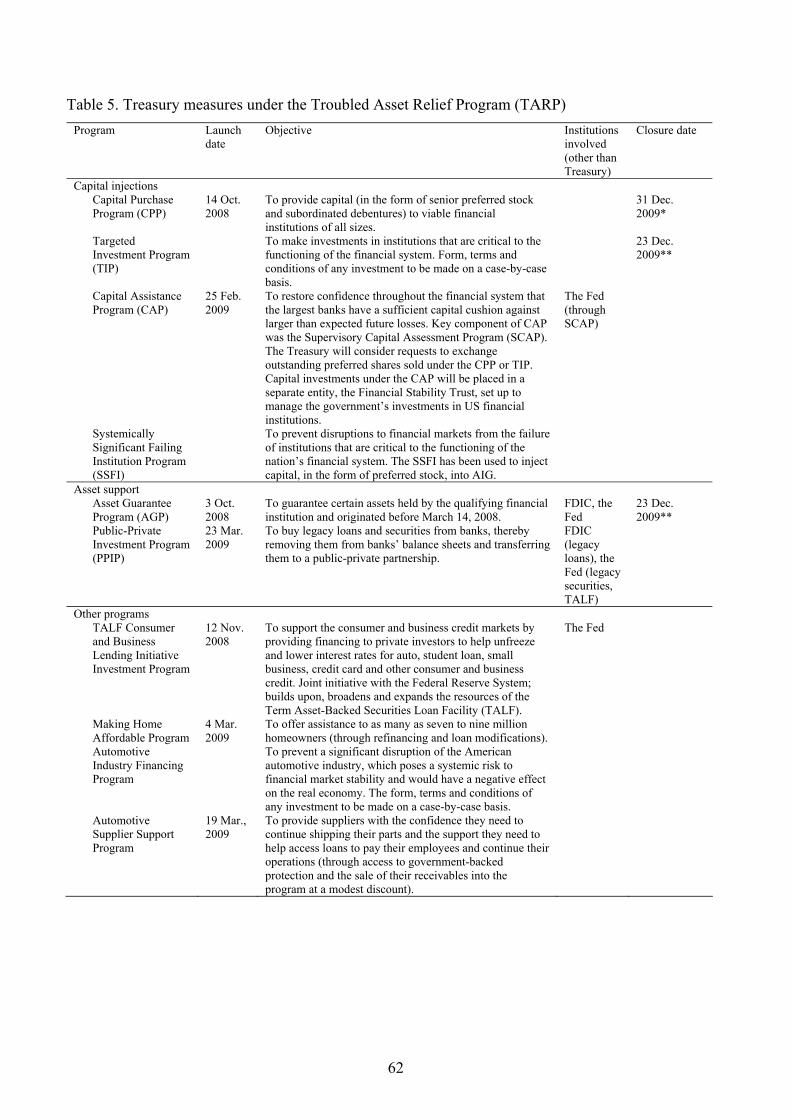
Table 5. Treasury measures under the Troubled Asset Relief Program (TARP) Program Launch
date Objective Institutions
involved (other than Treasury)
Closure date
Capital injections Capital Purchase Program (CPP)
14 Oct. 2008
To provide capital (in the form of senior preferred stock and subordinated debentures) to viable financial institutions of all sizes.
31 Dec. 2009*
Targeted Investment Program (TIP)
To make investments in institutions that are critical to the functioning of the financial system. Form, terms and conditions of any investment to be made on a case-by-case basis.
23 Dec. 2009**
Capital Assistance Program (CAP)
25 Feb. 2009
To restore confidence throughout the financial system that the largest banks have a sufficient capital cushion against larger than expected future losses. Key component of CAP was the Supervisory Capital Assessment Program (SCAP). The Treasury will consider requests to exchange outstanding preferred shares sold under the CPP or TIP. Capital investments under the CAP will be placed in a separate entity, the Financial Stability Trust, set up to manage the government’s investments in US financial institutions.
The Fed (through SCAP)
Systemically Significant Failing Institution Program (SSFI)
To prevent disruptions to financial markets from the failure of institutions that are critical to the functioning of the nation’s financial system. The SSFI has been used to inject capital, in the form of preferred stock, into AIG.
Asset support Asset Guarantee Program (AGP)
3 Oct. 2008
To guarantee certain assets held by the qualifying financial institution and originated before March 14, 2008.
FDIC, the Fed
23 Dec. 2009**
Public-Private Investment Program (PPIP)
23 Mar. 2009
To buy legacy loans and securities from banks, thereby removing them from banks’ balance sheets and transferring them to a public-private partnership.
FDIC (legacy loans), the Fed (legacy securities, TALF)
Other programs TALF Consumer and Business Lending Initiative Investment Program
12 Nov. 2008
To support the consumer and business credit markets by providing financing to private investors to help unfreeze and lower interest rates for auto, student loan, small business, credit card and other consumer and business credit. Joint initiative with the Federal Reserve System; builds upon, broadens and expands the resources of the Term Asset-Backed Securities Loan Facility (TALF).
The Fed
Making Home Affordable Program
4 Mar. 2009
To offer assistance to as many as seven to nine million homeowners (through refinancing and loan modifications).
Automotive Industry Financing Program
To prevent a significant disruption of the American automotive industry, which poses a systemic risk to financial market stability and would have a negative effect on the real economy. The form, terms and conditions of any investment to be made on a case-by-case basis.
Automotive Supplier Support Program
19 Mar., 2009
To provide suppliers with the confidence they need to continue shipping their parts and the support they need to help access loans to pay their employees and continue their operations (through access to government-backed protection and the sale of their receivables into the program at a modest discount).
62
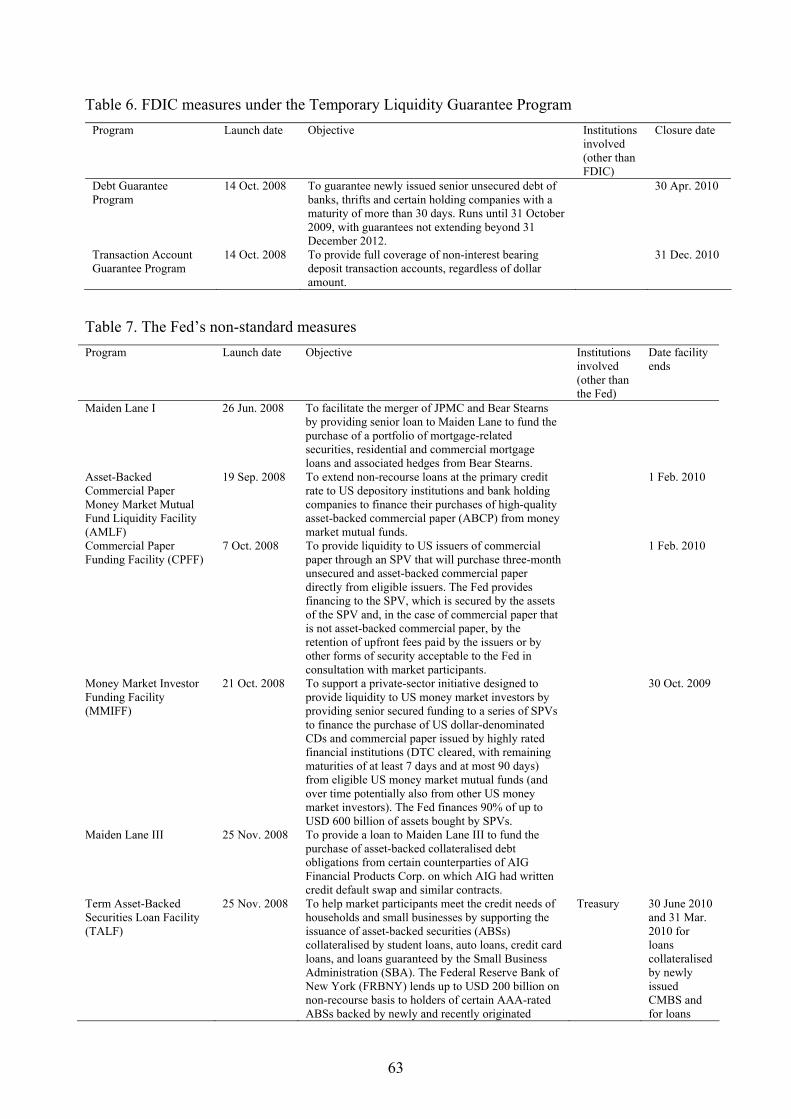
Table 6. FDIC measures under the Temporary Liquidity Guarantee Program Program Launch date Objective Institutions
involved (other than FDIC)
Closure date
Debt Guarantee Program
14 Oct. 2008 To guarantee newly issued senior unsecured debt of banks, thrifts and certain holding companies with a maturity of more than 30 days. Runs until 31 October 2009, with guarantees not extending beyond 31 December 2012.
30 Apr. 2010
Transaction Account Guarantee Program
14 Oct. 2008 To provide full coverage of non-interest bearing deposit transaction accounts, regardless of dollar amount.
31 Dec. 2010
Table 7. The Fed’s non-standard measures Program Launch date Objective Institutions
involved (other than the Fed)
Date facility ends
Maiden Lane I 26 Jun. 2008 To facilitate the merger of JPMC and Bear Stearns by providing senior loan to Maiden Lane to fund the purchase of a portfolio of mortgage-related securities, residential and commercial mortgage loans and associated hedges from Bear Stearns.
Asset-Backed Commercial Paper Money Market Mutual Fund Liquidity Facility (AMLF)
19 Sep. 2008 To extend non-recourse loans at the primary credit rate to US depository institutions and bank holding companies to finance their purchases of high-quality asset-backed commercial paper (ABCP) from money market mutual funds.
1 Feb. 2010
Commercial Paper Funding Facility (CPFF)
7 Oct. 2008 To provide liquidity to US issuers of commercial paper through an SPV that will purchase three-month unsecured and asset-backed commercial paper directly from eligible issuers. The Fed provides financing to the SPV, which is secured by the assets of the SPV and, in the case of commercial paper that is not asset-backed commercial paper, by the retention of upfront fees paid by the issuers or by other forms of security acceptable to the Fed in consultation with market participants.
1 Feb. 2010
Money Market Investor Funding Facility (MMIFF)
21 Oct. 2008 To support a private-sector initiative designed to provide liquidity to US money market investors by providing senior secured funding to a series of SPVs to finance the purchase of US dollar-denominated CDs and commercial paper issued by highly rated financial institutions (DTC cleared, with remaining maturities of at least 7 days and at most 90 days) from eligible US money market mutual funds (and over time potentially also from other US money market investors). The Fed finances 90% of up to USD 600 billion of assets bought by SPVs.
30 Oct. 2009
Maiden Lane III 25 Nov. 2008 To provide a loan to Maiden Lane III to fund the purchase of asset-backed collateralised debt obligations from certain counterparties of AIG Financial Products Corp. on which AIG had written credit default swap and similar contracts.
Term Asset-Backed Securities Loan Facility (TALF)
25 Nov. 2008 To help market participants meet the credit needs of households and small businesses by supporting the issuance of asset-backed securities (ABSs) collateralised by student loans, auto loans, credit card loans, and loans guaranteed by the Small Business Administration (SBA). The Federal Reserve Bank of New York (FRBNY) lends up to USD 200 billion on non-recourse basis to holders of certain AAA-rated ABSs backed by newly and recently originated
Treasury 30 June 2010 and 31 Mar. 2010 for loans collateralised by newly issued CMBS and for loans
63
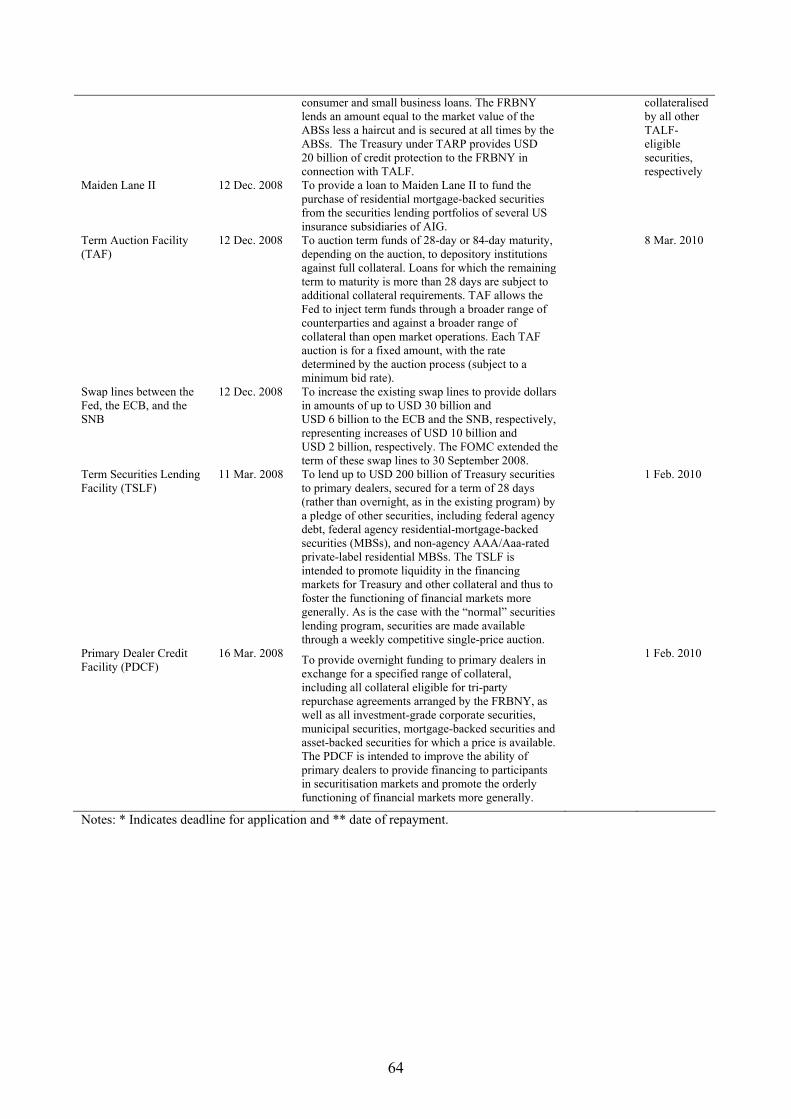
consumer and small business loans. The FRBNY lends an amount equal to the market value of the ABSs less a haircut and is secured at all times by the ABSs. The Treasury under TARP provides USD 20 billion of credit protection to the FRBNY in connection with TALF.
collateralised by all other TALF-eligible securities, respectively
Maiden Lane II 12 Dec. 2008 To provide a loan to Maiden Lane II to fund the purchase of residential mortgage-backed securities from the securities lending portfolios of several US insurance subsidiaries of AIG.
Term Auction Facility (TAF)
12 Dec. 2008 To auction term funds of 28-day or 84-day maturity, depending on the auction, to depository institutions against full collateral. Loans for which the remaining term to maturity is more than 28 days are subject to additional collateral requirements. TAF allows the Fed to inject term funds through a broader range of counterparties and against a broader range of collateral than open market operations. Each TAF auction is for a fixed amount, with the rate determined by the auction process (subject to a minimum bid rate).
8 Mar. 2010
Swap lines between the Fed, the ECB, and the SNB
12 Dec. 2008 To increase the existing swap lines to provide dollars in amounts of up to USD 30 billion and USD 6 billion to the ECB and the SNB, respectively, representing increases of USD 10 billion and USD 2 billion, respectively. The FOMC extended the term of these swap lines to 30 September 2008.
Term Securities Lending Facility (TSLF)
11 Mar. 2008 To lend up to USD 200 billion of Treasury securities to primary dealers, secured for a term of 28 days (rather than overnight, as in the existing program) by a pledge of other securities, including federal agency debt, federal agency residential-mortgage-backed securities (MBSs), and non-agency AAA/Aaa-rated private-label residential MBSs. The TSLF is intended to promote liquidity in the financing markets for Treasury and other collateral and thus to foster the functioning of financial markets more generally. As is the case with the “normal” securities lending program, securities are made available through a weekly competitive single-price auction.
1 Feb. 2010
Primary Dealer Credit Facility (PDCF)
16 Mar. 2008 To provide overnight funding to primary dealers in exchange for a specified range of collateral, including all collateral eligible for tri-party repurchase agreements arranged by the FRBNY, as well as all investment-grade corporate securities, municipal securities, mortgage-backed securities and asset-backed securities for which a price is available. The PDCF is intended to improve the ability of primary dealers to provide financing to participants in securitisation markets and promote the orderly functioning of financial markets more generally.
1 Feb. 2010
Notes: * Indicates deadline for application and ** date of repayment.
64
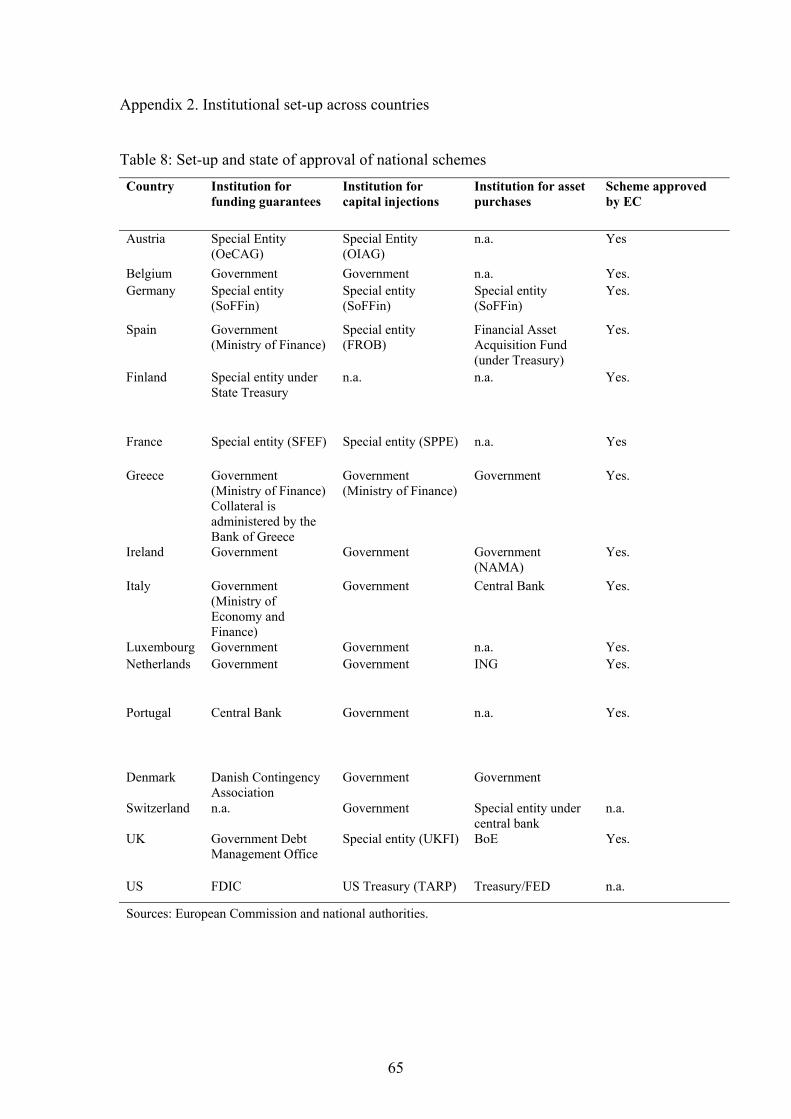
Appendix 2. Institutional set-up across countries
Table 8: Set-up and state of approval of national schemes Country Institution for
funding guarantees Institution for capital injections
Institution for asset purchases
Scheme approved by EC
Austria Special Entity (OeCAG)
Special Entity (OIAG)
n.a. Yes
Belgium Government Government n.a. Yes. Germany Special entity
(SoFFin) Special entity (SoFFin)
Special entity (SoFFin)
Yes.
Spain Government (Ministry of Finance)
Special entity (FROB)
Financial Asset Acquisition Fund (under Treasury)
Yes.
Finland Special entity under State Treasury
n.a. n.a. Yes.
France Special entity (SFEF) Special entity (SPPE) n.a. Yes
Greece Government (Ministry of Finance) Collateral is administered by the Bank of Greece
Government (Ministry of Finance)
Government Yes.
Ireland Government Government Government (NAMA)
Yes.
Italy Government (Ministry of Economy and Finance)
Government Central Bank Yes.
Luxembourg Government Government n.a. Yes. Netherlands Government Government ING Yes.
Portugal Central Bank Government n.a. Yes.
Denmark Danish Contingency Association
Government Government
Switzerland n.a. Government Special entity under central bank
n.a.
UK Government Debt Management Office
Special entity (UKFI) BoE Yes.
US FDIC US Treasury (TARP) Treasury/FED n.a.
Sources: European Commission and national authorities.
65
Appendix 3. Data collection methodology
This appendix describes the methodology employed when collecting the data for
Table 1.
Data sources. Public data sources are used (e.g. websites of government and financial institutions, Bloomberg for guaranteed bond issues, as well as newspaper articles). This information is reconciled with information that is being collected by the Fiscal Policies Division of the ECB’s Directorate General Economics and periodic follow-up cross-checking is also conducted with national authorities via the Working Group on Macro-prudential Analysis of the Banking Supervision Committee.
Cut-off date. Table 1 includes data on all support measures that have been taken by governments in response to the worsening of the crisis after the collapse of Lehman Brothers, specifically from 1 October 2008 onwards.
Classification. Support measures are classified according to three main categories: (i) guarantees for bank liabilities; (ii) recapitalisation measures; and (iii) measures to provide relief from legacy assets. Table 1 distinguishes between amounts that governments have committed themselves to provide (shown in brackets in the table) and amounts that have already been extended to financial institutions. The committed amounts are based on government announcements, while the extended amounts are those amounts that have been agreed between the government and the recipient financial institutions. Hence, the amounts that Table 1 shows as having been extended may not have actually been disbursed yet but can be expected to be disbursed. While our data sources do not allow us to distinguish between disbursed and announced amounts, for financial stability purposes, it does indeed make sense to already include announced, but not yet disbursed amounts, as announcements are informal commitments and markets are likely to react to the announcements rather than to the actual disbursement. Table 1 also shows the amounts committed and extended under national schemes and outside such schemes. For instance, in Germany, all amounts committed and extended by SoFFin are shown as within schemes, while the amounts committed and extended by the state governments to their local Landesbanken are shown as outside schemes. For the United States, “within scheme” includes all amounts related to the TARP and support of government sponsored entities. The total commitment in terms of GDP sums up to the commitments across the three categories. Exchange rates. For amounts committed or extended in currencies other that the
euro, historic exchange rates from October 2008 are used. This means that items are
included in Table 1 at the exchange rate that prevailed in October 2008. This
66
convention was adopted to ensure that commitments and disbursements do not change
over time as a result of exchange rate changes.

67
The following Discussion Papers have been published since 2009:
Series 1: Economic Studies
01 2009 Spillover effects of minimum wages Christoph Moser in a two-sector search model Nikolai Stähler 02 2009 Who is afraid of political risk? Multinational Iris Kesternich firms and their choice of capital structure Monika Schnitzer 03 2009 Pooling versus model selection for Vladimir Kuzin nowcasting with many predictors: Massimiliano Marcellino an application to German GDP Christian Schumacher 04 2009 Fiscal sustainability and Balassone, Cunha, Langenus policy implications for the euro area Manzke, Pavot, Prammer Tommasino 05 2009 Testing for structural breaks Jörg Breitung in dynamic factor models Sandra Eickmeier 06 2009 Price convergence in the EMU? Evidence from micro data Christoph Fischer 07 2009 MIDAS versus mixed-frequency VAR: V. Kuzin, M. Marcellino nowcasting GDP in the euro area C. Schumacher 08 2009 Time-dependent pricing and New Keynesian Phillips curve Fang Yao 09 2009 Knowledge sourcing: Tobias Schmidt legitimacy deficits for MNC subsidiaries? Wolfgang Sofka 10 2009 Factor forecasting using international targeted predictors: the case of German GDP Christian Schumacher
68
11 2009 Forecasting national activity using lots of international predictors: an application to Sandra Eickmeier New Zealand Tim Ng 12 2009 Opting out of the great inflation: Andreas Beyer, Vitor Gaspar German monetary policy after the Christina Gerberding breakdown of Bretton Woods Otmar Issing 13 2009 Financial intermediation and the role Stefan Reitz of price discrimination in a two-tier market Markus A. Schmidt, Mark P. Taylor 14 2009 Changes in import pricing behaviour: the case of Germany Kerstin Stahn 15 2009 Firm-specific productivity risk over the Ruediger Bachmann business cycle: facts and aggregate implications Christian Bayer 16 2009 The effects of knowledge management Uwe Cantner on innovative success – an empirical Kristin Joel analysis of German firms Tobias Schmidt 17 2009 The cross-section of firms over the business Ruediger Bachmann cycle: new facts and a DSGE exploration Christian Bayer 18 2009 Money and monetary policy transmission in the euro area: evidence from FAVAR- and VAR approaches Barno Blaes 19 2009 Does lowering dividend tax rates increase dividends repatriated? Evidence of intra-firm Christian Bellak cross-border dividend repatriation policies Markus Leibrecht by German multinational enterprises Michael Wild 20 2009 Export-supporting FDI Sebastian Krautheim
69
21 2009 Transmission of nominal exchange rate changes to export prices and trade flows Mathias Hoffmann and implications for exchange rate policy Oliver Holtemöller 22 2009 Do we really know that flexible exchange rates facilitate current account adjustment? Some new empirical evidence for CEE countries Sabine Herrmann 23 2009 More or less aggressive? Robust monetary Rafael Gerke policy in a New Keynesian model with Felix Hammermann financial distress Vivien Lewis 24 2009 The debt brake: business cycle and welfare con- Eric Mayer sequences of Germany’s new fiscal policy rule Nikolai Stähler 25 2009 Price discovery on traded inflation expectations: Alexander Schulz Does the financial crisis matter? Jelena Stapf 26 2009 Supply-side effects of strong energy price Thomas A. Knetsch hikes in German industry and transportation Alexander Molzahn 27 2009 Coin migration within the euro area Franz Seitz, Dietrich Stoyan Karl-Heinz Tödter 28 2009 Efficient estimation of forecast uncertainty based on recent forecast errors Malte Knüppel 29 2009 Financial constraints and the margins of FDI C. M. Buch, I. Kesternich A. Lipponer, M. Schnitzer 30 2009 Unemployment insurance and the business cycle: Stéphane Moyen Prolong benefit entitlements in bad times? Nikolai Stähler 31 2009 A solution to the problem of too many instruments in dynamic panel data GMM Jens Mehrhoff
70
32 2009 Are oil price forecasters finally right? Stefan Reitz Regressive expectations toward more Jan C. Rülke fundamental values of the oil price Georg Stadtmann 33 2009 Bank capital regulation, the lending channel and business cycles Longmei Zhang 34 2009 Deciding to peg the exchange rate in developing countries: the role of Philipp Harms private-sector debt Mathias Hoffmann 35 2009 Analyse der Übertragung US-amerikanischer Schocks auf Deutschland auf Basis eines FAVAR Sandra Eickmeier 36 2009 Choosing and using payment instruments: Ulf von Kalckreuth evidence from German microdata Tobias Schmidt, Helmut Stix 01 2010 Optimal monetary policy in a small open economy with financial frictions Rossana Merola 02 2010 Price, wage and employment response Bertola, Dabusinskas to shocks: evidence from the WDN survey Hoeberichts, Izquierdo, Kwapil Montornès, Radowski 03 2010 Exports versus FDI revisited: C. M. Buch, I. Kesternich Does finance matter? A. Lipponer, M. Schnitzer 04 2010 Heterogeneity in money holdings Ralph Setzer across euro area countries: Paul van den Noord the role of housing Guntram Wolff 05 2010 Loan supply in Germany U. Busch during the financial crises M. Scharnagl, J. Scheithauer
71
06 2010 Empirical simultaneous confidence Òscar Jordà, Malte Knüppel regions for path-forecasts Massimiliano Marcellino 07 2010 Monetary policy, housing booms Sandra Eickmeier and financial (im)balances Boris Hofmann 08 2010 On the nonlinear influence of Stefan Reitz Reserve Bank of Australia Jan C. Ruelke interventions on exchange rates Mark P. Taylor 09 2010 Banking and sovereign risk S. Gerlach in the euro area A. Schulz, G. B. Wolff 10 2010 Trend and cycle features in German residential investment before and after reunification Thomas A. Knetsch 11 2010 What can EMU countries’ sovereign bond spreads tell us about market perceptions of default probabilities Niko Dötz during the recent financial crisis? Christoph Fischer 12 2010 User costs of housing when households face Tobias Dümmler a credit constraint – evidence for Germany Stephan Kienle 13 2010 Extraordinary measures in extraordinary times – public measures in support of the financial Stéphanie Marie Stolz sector in the EU and the United States Michael Wedow
72
Series 2: Banking and Financial Studies 01 2009 Dominating estimators for the global Gabriel Frahm minimum variance portfolio Christoph Memmel 02 2009 Stress testing German banks in a Klaus Düllmann downturn in the automobile industry Martin Erdelmeier 03 2009 The effects of privatization and consolidation E. Fiorentino on bank productivity: comparative evidence A. De Vincenzo, F. Heid from Italy and Germany A. Karmann, M. Koetter 04 2009 Shocks at large banks and banking sector Sven Blank, Claudia M. Buch distress: the Banking Granular Residual Katja Neugebauer 05 2009 Why do savings banks transform sight deposits into illiquid assets less intensively Dorothee Holl than the regulation allows? Andrea Schertler 06 2009 Does banks’ size distort market prices? Manja Völz Evidence for too-big-to-fail in the CDS market Michael Wedow 07 2009 Time dynamic and hierarchical dependence Sandra Gaisser modelling of an aggregated portfolio of Christoph Memmel trading books – a multivariate nonparametric Rafael Schmidt approach Carsten Wehn 08 2009 Financial markets’ appetite for risk – and the challenge of assessing its evolution by risk appetite indicators Birgit Uhlenbrock 09 2009 Income diversification in the Ramona Busch German banking industry Thomas Kick 10 2009 The dark and the bright side of liquidity risks: evidence from open-end real estate funds in Falko Fecht Germany Michael Wedow

73
11 2009 Determinants for using visible reserves Bornemann, Homölle in German banks – an empirical study Hubensack, Kick, Pfingsten 12 2009 Margins of international banking: Claudia M. Buch Is there a productivity pecking order Cathérine Tahmee Koch in banking, too? Michael Koetter 13 2009 Systematic risk of CDOs and Alfred Hamerle, Thilo Liebig CDO arbitrage Hans-Jochen Schropp 14 2009 The dependency of the banks’ assets and Christoph Memmel liabilities: evidence from Germany Andrea Schertler 15 2009 What macroeconomic shocks affect the German banking system? Analysis in an Sven Blank integrated micro-macro model Jonas Dovern 01 2010 Deriving the term structure of banking Stefan Eichler crisis risk with a compound option Alexander Karmann approach: the case of Kazakhstan Dominik Maltritz 02 2010 Recovery determinants of distressed banks: Thomas Kick Regulators, market discipline, Michael Koetter or the environment? Tigran Poghosyan 03 2010 Purchase and redemption decisions of mutual Stephan Jank fund investors and the role of fund families Michael Wedow 04 2010 What drives portfolio investments of German banks in emerging capital markets? Christian Wildmann

74
Visiting researcher at the Deutsche Bundesbank
The Deutsche Bundesbank in Frankfurt is looking for a visiting researcher. Among others under certain conditions visiting researchers have access to a wide range of data in the Bundesbank. They include micro data on firms and banks not available in the public. Visitors should prepare a research project during their stay at the Bundesbank. Candidates must hold a PhD and be engaged in the field of either macroeconomics and monetary economics, financial markets or international economics. Proposed research projects should be from these fields. The visiting term will be from 3 to 6 months. Salary is commensurate with experience. Applicants are requested to send a CV, copies of recent papers, letters of reference and a proposal for a research project to: Deutsche Bundesbank Personalabteilung Wilhelm-Epstein-Str. 14 60431 Frankfurt GERMANY