An Analysis of Investment Funds and - EconStor
47
econstor Make Your Publications Visible. A Service of zbw Leibniz-Informationszentrum Wirtschaft Leibniz Information Centre for Economics Schröder, Michael Working Paper Socially Responsible Investments in Germany, Switzerland and the United States: An Analysis of Investment Funds and Indices ZEW Discussion Papers, No. 03-10 Provided in Cooperation with: ZEW - Zentrum für Europäische Wirtschaftsforschung / Center for European Economic Research Suggested Citation: Schröder, Michael (2003) : Socially Responsible Investments in Germany, Switzerland and the United States: An Analysis of Investment Funds and Indices, ZEW Discussion Papers, No. 03-10, Zentrum für Europäische Wirtschaftsforschung (ZEW), Mannheim This Version is available at: http://hdl.handle.net/10419/24813 Standard-Nutzungsbedingungen: Die Dokumente auf EconStor dürfen zu eigenen wissenschaftlichen Zwecken und zum Privatgebrauch gespeichert und kopiert werden. Sie dürfen die Dokumente nicht für öffentliche oder kommerzielle Zwecke vervielfältigen, öffentlich ausstellen, öffentlich zugänglich machen, vertreiben oder anderweitig nutzen. Sofern die Verfasser die Dokumente unter Open-Content-Lizenzen (insbesondere CC-Lizenzen) zur Verfügung gestellt haben sollten, gelten abweichend von diesen Nutzungsbedingungen die in der dort genannten Lizenz gewährten Nutzungsrechte. Terms of use: Documents in EconStor may be saved and copied for your personal and scholarly purposes. You are not to copy documents for public or commercial purposes, to exhibit the documents publicly, to make them publicly available on the internet, or to distribute or otherwise use the documents in public. If the documents have been made available under an Open Content Licence (especially Creative Commons Licences), you may exercise further usage rights as specified in the indicated licence. www.econstor.eu
Transcript of An Analysis of Investment Funds and - EconStor
econstorMake Your Publications Visible.
A Service of
zbwLeibniz-InformationszentrumWirtschaftLeibniz Information Centrefor Economics
Schröder, Michael
Working Paper
Socially Responsible Investments in Germany,Switzerland and the United States: An Analysis ofInvestment Funds and Indices
ZEW Discussion Papers, No. 03-10
Provided in Cooperation with:ZEW - Zentrum für Europäische Wirtschaftsforschung / Center forEuropean Economic Research
Suggested Citation: Schröder, Michael (2003) : Socially Responsible Investments in Germany,Switzerland and the United States: An Analysis of Investment Funds and Indices, ZEWDiscussion Papers, No. 03-10, Zentrum für Europäische Wirtschaftsforschung (ZEW),Mannheim
This Version is available at:http://hdl.handle.net/10419/24813
Standard-Nutzungsbedingungen:
Die Dokumente auf EconStor dürfen zu eigenen wissenschaftlichenZwecken und zum Privatgebrauch gespeichert und kopiert werden.
Sie dürfen die Dokumente nicht für öffentliche oder kommerzielleZwecke vervielfältigen, öffentlich ausstellen, öffentlich zugänglichmachen, vertreiben oder anderweitig nutzen.
Sofern die Verfasser die Dokumente unter Open-Content-Lizenzen(insbesondere CC-Lizenzen) zur Verfügung gestellt haben sollten,gelten abweichend von diesen Nutzungsbedingungen die in der dortgenannten Lizenz gewährten Nutzungsrechte.
Terms of use:
Documents in EconStor may be saved and copied for yourpersonal and scholarly purposes.
You are not to copy documents for public or commercialpurposes, to exhibit the documents publicly, to make thempublicly available on the internet, or to distribute or otherwiseuse the documents in public.
If the documents have been made available under an OpenContent Licence (especially Creative Commons Licences), youmay exercise further usage rights as specified in the indicatedlicence.
www.econstor.eu
ZEWZentrum für EuropäischeWirtschaftsforschung GmbH
C e n t r e f o r E u r o p e a nE c o n o m i c R e s e a r c h
Discussion Paper No. 03-10
Socially Responsible Investments in Germany, Switzerland
and the United States – An Analysis of Investment Funds and Indices –
Michael Schröder

Discussion Paper No. 03-10
Socially Responsible Investments in Germany, Switzerland
and the United States – An Analysis of Investment Funds and Indices –
Michael Schröder
Die Discussion Papers dienen einer möglichst schnellen Verbreitung von neueren Forschungsarbeiten des ZEW. Die Beiträge liegen in alleiniger Verantwortung
der Autoren und stellen nicht notwendigerweise die Meinung des ZEW dar.
Discussion Papers are intended to make results of ZEW research promptly available to other economists in order to encourage discussion and suggestions for revisions. The authors are solely
responsible for the contents which do not necessarily represent the opinion of the ZEW.
Download this ZEW Discussion Paper from our ftp server:
ftp://ftp.zew.de/pub/zew-docs/dp/dp0310.pdf

Non-Technical Summary
Socially responsible investment (SRI) funds are a special market segment of theasset management industry. Although this market segment is still relatively small itis fast growing in many countries. There is also an increasing number of banks, assetmanagement companies, investment advisors and rating agencies that are specialisedin this field of business. Therefore the economic performance of these specialisedinvestment funds is of interest to investors and investment companies. In our studywe investigate the performance of 16 German and Swiss funds and 30 U.S. fundsthat concentrate on socially responsible investing.
From the point of view of financial market theory it is interesting to examine ifsocially screened assets have on average the same performance than conventionalassets. As SRI investment funds use only a subset of the total investment universethey should have the same or a worse performance than conventional funds. Theperformance analysis of SRI investment funds tests the combined hypothesis of thequalities of the fund management and the performance of the underlying assets. Wethus enlarge the performance analysis by the investigation of 10 specialised SRIinices which represent the performance of socially screened assets only.
Thus, the aim of the study is twofold. First, the performance of SRI equityinvestment funds in the United States, Germany and Switzerland and well-knownSRI equity indices such as the Domini 400-index is analysed. Second, the risk-returncharacteristics are investigated in detail. As performance measure Jensen´s alpha isused. In addition to most of the earlier studies a broader set of benchmark assets isconsidered (blue chip stocks and small cap stocks). In the analysis of the investmentfunds possible distortions due to market timing strategies of the fund managementare taken into account and, in addition, the approach of Ferson and Schadt (1996) tomeasure conditional performance is used.
The review of the literature shows that SRI funds have on average a similarperformance than conventional funds. Many studies report a significant overweightof SRI funds in companies with a low market capitalisation (small cap stocks). Butthe results particularly of the early studies on SRI funds should be interpreted withsome caution as these studies have some shortcomings regarding the performancemeasure.
Those studies using a so called matching approach try to compare SRI funds andconventional funds grouped by important fund characteristics such as size, age andinvestment universe. Regarding the problems in the application of this approach itseems to be more appropriate to analyse the underlying assets directly. This can bedone by using SRI indices which are now available for different countries andregions.

The results of our performance analysis show that most of the German, Swiss andU.S. SRI investment funds do not significantly under-perform their benchmarks. Weeven found that 7 (= ca. 44%) of the German and Swiss funds exhibit a positive butinsignificant Jensen´s alpha. It is also interesting to note that the German and Swissfunds are significantly stronger tilted towards smaller companies than the U.S.funds. The results of the performance analysis for the SRI indices show that onlytwo of them clearly under-perform the conventional benchmark indices. But thereare also 3 SRI indices with a positive but insignificant alpha. Thus, the hypothesisthat the performance of SRI assets is not worse than those of conventional assets canbe rejected only for a few SRI indices. The analysis also reveals that most of the SRIindices have special index structures that deviate from their conventionalbenchmarks.
In addition we investigated the sensitivity of the returns of SRI funds and indices onimportant macroeconomic factors. Many German and Swiss funds show asignificant reaction to unexpected changes in the OECD industrial production, thelong-term U.S. interest rate and the U.S. dollar. In contrast, the factor sensitivities ofthe U.S. funds and the SRI indices are much less pronounced. Overall, the mostinfluential single factor is the external value of the U.S. dollar.
In the next step the specific portfolio weights regarding industrial sectors andinternational regions are estimated by so called investment style-regressions. Wefind two major results. First, the investment style analysis confirmed that SRI fundsand indices have a relatively high weight in small cap stocks and that German andSwiss funds are on average stronger tilted towards small cap stocks than U.S. funds.A second important result is that SRI funds and indices have a special structure.Most of them concentrate their investments in blue chip stocks in the two sectors“non-cyclical consumer goods” and “non-cyclical services”. There are only fewdifferences between German and Swiss funds and their U.S. counterparts: theGerman and Swiss funds invest more in utilities whereas the U.S. funds also preferthe sector “information technologies”. Another result is that most of the global fundsand indices concentrate their blue chip investments in European companies.
Overall, socially screened assets have no clear disadvantage concerning theirperformance compared to conventional assets. In addition, the analysis revealsspecific risk-return characteristics (or investment styles) so that SRI funds andindices as a group might be characterised as special investment vehicles that aredifferent from conventional assets.

Socially Responsible Investments in Germany,Switzerland and the United States
- An Analysis of Investment Funds and Indices -
Michael Schröder
Centre for European Economic Research (ZEW), Mannheim
March 2003
AbstractThe aim of this study is the analysis of so called socially responsible investments(SRI). First, the performance of SRI equity investment funds and equity indices isinvestigated using Jensen´s alpha as performance measure. The analysis considersmarket timing strategies of the fund management and takes publicly availableinformation into account (conditional performance). In the second part sensitivitiesregarding macroeconomic factors are estimated and the third part investigates theinvestment style of the SRI funds and indices. It is found that most of the SRI assetshave a similar performance than their benchmarks. Only a few funds and indicesexhibit a relatively poor performance. As SRI funds and indices seem to have somespecific risk-return characteristics (investment styles) that might be characterised asspecial investment vehicles different from conventional assets.
JEL-Classification: G11, G23, Q01, Q20Keywords: Socially responsible investing, performance measurement, investment style, investment funds
Acknowledgement:The study is part of the project “Umwelt- und Nachhaltigkeitstransparenz für Finanzmärkte” and isfinanced by the German ministry of education and research (BMBF). The project is chaired by theInstitut für Ökologie und Unternehmensführung at the European Business School (ebs) e.V. Ithank Paschen von Flotow, Erik Lüders and Andreas Ziegler for helpful comments andsuggestions and Lasma Strausa for valuable research assistance. All remaining errors andomissions are of course my own.
Corresponding address:Dr. Michael Schröder, Centre for European Economic Research (ZEW), P.O. Box 10 34 43,D-68034 Mannheim, GermanyPhone: + 621 1235 140, Fax: + 621 1235 223, E-mail: [email protected]

2
1 IntroductionInvestments based on social, ethical and environmental criteria have risensignificantly in the last decades. This is particularly true for the United States but alsofor Sweden, United Kingdom, the Netherlands and Switzerland. According to Bauer,Koedijk and Otten (2002) about 2.3% of total mutual fund assets in the United States,i.e. 153 bn US dollar, have been invested in 230 so called socially responsibleinvestment funds at the end of the year 2000. In other countries, e.g. Germany(0.04%) and France (0.01%) this market segment is still relatively small but themarket share is growing.
The development of socially responsible investing (SRI) in the United States has alsoattracted the interest of academic finance. The empirical analysis of SRI funds1 datesback as early as 1972 to a study of Moskowitz. Since then numerous studiesinvestigated if SRI funds can reach the same performance as not restricted investmentfunds. The results of many of these studies show that SRI funds do not under-performon average traditionally managed funds. This is an interesting result as SRI fundsonly use a subset of the full investment universe.
The aim of our study is twofold. First, the performance of SRI equity investmentfunds in the United States, Germany and Switzerland and well-known SRI equityindices such as the Domini 400-index is analysed. As performance measure we useJensen´s alpha. In addition to earlier studies a broader set of benchmark assets isconsidered (blue chip stocks and small cap stocks). Regarding the analysis of theinvestment funds possible distortions due to market timing are taken into account. Tomeasure conditional performance the approach of Ferson and Schadt (1996) is used.
The performance analysis of the SRI indices shows if the screening based on social,ethical and environmental criteria results in a better or worse outcome than traditionalinvestments that use the whole investment universe. The performance analysis of theSRI investment funds tests jointly the performance of the underlying assets and thequality of the fund management.
The second aim is to investigate the risk-return characteristics of SRI investmentfunds and indices. This is done by measuring the sensitivities against macroeconomicvariables such as oil price, inflation, interest rates and industrial growth. In additionan investments style analysis quantifies the strategy of the fund managementconcerning sectoral and regional diversification.
1 In the literature this market segment is named differently. In the United States the usual term is
“socially responsible investing” which is also used throughout this study. In the UK the termused most often used is “ethical investing” and in Germany the market segment is divided intoseveral segments such as “environmental funds”, “environment-technology funds”,“sustainability funds” and “socially responsible funds”.
3
The paper is organised as follows. In section 2 we give a comprehensive review ofthe major studies in this field of research and compare the different methods andresults. Section 3 describes the data i.e. the investment funds and indices underconsideration and gives a first look at the performance using Sharpe ratios. In section4 the performance of investment funds and indices is analysed. In section 5 thesensitivities of SRI fund and index returns regarding macroeconomic factors areinvestigated. This sheds light on specific risk characteristics of SRI investmentscompared to the benchmark indices. Section 6 analyses the investment styles of theSRI investment funds and indices. The aim is to conduct an external assessment ofthe specific structures of the funds and indices concerning the weightings ofindustrial sectors and international regions. Section 7 concludes. The appendixcontains all tables that are discussed in the text.
2 Review of the LiteratureThe aim of this literature survey is to describe the methods and major results ofearlier studies on performance measurement of investments in socially screenedequities.2 The review concentrates on studies on SRI investment funds and SRIindices. This serves as a starting point of our own analyses in the following sections.
The major question of the studies on the performance of SRI investment funds iswhether these funds perform better or worse than traditional investment funds thathave no restricted investment universe. SRI investment funds use a set of social,ethical and environmental criteria to select equities. These criteria are either used topick specific stocks out of the investment universe (positive criteria) or to deletespecific stocks (negative criteria). Positive criteria are for example low pollutionemissions, equal employment opportunities and good workplace conditions. Usualnegative criteria are the production of alcohol, tobacco, nuclear power and weapons.
From the point of view of portfolio theory a restricted investment universe shouldresult in a lower risk-adjusted return. Even a very smart SRI investment strategy canonly be as good as a traditional investment strategy because SRI investmentopportunities are a subset of the total investment universe. Therefore, a traditionalinvestment fund should always be able to use the same investment strategy as a SRIfund, but not vice versa.
2 Schäfer and Stederoth (2002) give a comprehensive overview on almost all international studies
that investigate the effects of SRI screening strategies on the performance of the investment.Concerning the studies included the survey of Schäfer and Stederoth has a much wider approachcompared to our review. But they concentrate primarily on the results of these studies and onlydescribe shortly the different methods used without looking deeper into the mechanisms andshortcomings of the different methods. In contrast our literature review concentrates on themethodological approaches and their strengths and weaknesses.

4
Luther, Matatko and Corner (1992) is the first study on the performance of SRIinvestment funds. The authors analyse 15 British ethical funds. They regress thereturns of the funds on a constant and a benchmark index. As benchmark indices theyuse either the Financial Times All Share index or the MSCI World index.3 Theconstant of this regression is known in the literature on performance measurement asJensen´s alpha. The authors also use the so called Sharpe ratio as a performancemeasure.4 They do not find clear evidence of out- or under-performance of the fundsrelative to the benchmark indices. Another result is that many SRI investment fundshave a relatively high portfolio weight in the segment of small companies. Inaddition, the authors find that the SRI funds in the UK are relatively dissimilar. Thedifferences of the funds concern the SRI investment criteria, the stock selectionstrategy and the international diversification. In a follow-up study Luther andMatatko (1994) confirm that the excess returns5 of SRI investment funds dependsignificantly on companies with a low market capitalisation (so called “small capstocks”). They conclude that a regression based on two benchmarks – a blue chip anda small cap index - is more appropriate for performance measurement. The empiricalresults show again no clear sign of out- or under-performance of the SRI funds.
Hamilton, Jo and Statman (1993) conduct a similar analysis for U.S. funds. Theyinvestigate 17 SRI funds using the simple regression of the excess returns on aconstant and the excess returns of a portfolio that consists of all stocks listed at theNew York Stock Exchange. Only one of the 17 funds has a significantly positiveestimate for Jensen´s alpha, whereas all other estimates are insignificant. In a secondstep the authors combine all SRI funds to one portfolio and form a second portfoliofrom the existing conventional investment funds. A comparison of the mean excessreturns of both portfolios shows no significant differences. This means that in theUnited States SRI funds performed on average as well as the conventional funds.
White (1995) investigates the performance of 6 U.S. and 5 German SRI investmentfunds for the period 1991-1993. He used the Sharpe ratio, Jensen´s alpha and theTreynor ratio6 as performance measures. The results show that the U.S. investmentfunds under-performed both the conventional benchmark (S&P 500-index) and theSRI benchmark index (Domini 400 Social-index). The results for the German fundsare also negative compared to the chosen benchmark index (DAX). A cleardisadvantage of this study is the very short time period.
3 MSCI is the abbreviation of Morgan Stanley Capital International Ltd.4 The Sharpe ratio is defined as the mean return of the investment minus a risk-free interest rate,
divided by the standard deviation of the returns.5 The excess return is equal to the return minus a risk-free interest rate.6 The Treynor ratio is equal to the mean return of the fund minus a risk-free interest rate, divided
by the systematic risk of the fund i.e. the sensitivity of the returns of the fund to the returns of abenchmark index.

5
A different approach is chosen by Sauer (1997). He analyses not SRI investmentfunds but a well-known SRI stock index, the Domini 400 Social-index (DSI). Sauertests if the performance of the DSI is different from the performance of the S&P 500-index and the CRSP Value Weighted Market-index.7 The time period used is January1986 to December 1994. Analysing an SRI index has the advantage (compared toinvestment funds) that the result is not distorted by transaction costs and the specificquality of the fund management. Both the SRI index and the benchmark index exhibitonly the performance of the underlying stocks. The results using Sharpe ratio andJensen´s alpha show no significant differences between the SRI index and theconventional benchmarks. The author concludes that a well diversified sociallyscreened portfolio (represented by the DSI) has no worse performance thanconventional indices that comprise a broader investment universe.
DiBartolomeo and Kurtz (1999) compare the Domini 400 Social-index and the S&P500-index for the period May 1990 to January 1999. They use a complex multi-factorregression model that includes not only a benchmark index but also 66 additionalfactors that decompose Jensen´s alpha.8 The authors measure a total outperformanceof the DSI relative to the S&P 500-index of 0.18% per month. They attribute 0.06%of this outperformance to a higher beta of the DSI i.e. a higher risk exposure to thebenchmark index. The remaining significant extra-return of 0.12% per month can befully explained by specific differences in the risk exposure between the DSI and theS&P 500-index. The authors attribute 0.10% to differences in the industrycomposition of the indices and 0.02% to differences in the fundamental portfoliocharacteristics e.g. the average company size and the level of financial leverage. Theauthors conclude that the out-performance of the DSI is not due to the effect of socialscreening but can be explained by the relative risk exposures of the DSI. In an earlierstudy DiBartolomeo and Kurtz (1996) they find for the period May 1990 - September1993 that the DSI also exhibits a relatively lower risk exposure to the oil price andthe U.S. industrial production.
A recent study Garz, Volk and Gilles (2002) investigates the Dow JonesSustainability Index (DJSI) for Europe. The index is constructed applying a socialscreening on the investment universe of the Dow Jones STOXX 600-index(DJStoxx). The authors find significant differences in the sector allocation and thecountry allocation between the two indices. But more important are the differencesdue to the selection of single stocks and so called “style factors” that characterise theinvestment style, for example company size, market beta, growth and value stocks,financial leverage, etc. Therefore, the study reveals that the analysed SRI indexexhibits significant differences in the relative risk exposure to the conventionalbenchmark index. Garz, Volk and Gilles in addition estimate Jensen´s alpha from athree-factor model that uses the same factors as Fama and French (1996). The first 7 CRSP is the abbreviation of Center for Research in Securities Prices.8 For a detailed description of the model the authors refer to Rosenberg (1974).
6
factor is the excess return of the DJStoxx-index whereas the other two factorsmeasure the risk exposures concerning the valuation (i.e. book value relative tomarket value) and the company size (i.e. low versus high market capitalisation),respectively. The authors show that the DJSI has a positive alpha at the 10%significance level and is tilted towards companies with high market capitalisation andhigh book-to-market value (= so called “value stocks”). They conclude that the DJSIhas no worse performance than the DJ STOXX 600-index and find even signs of anout-performance.
Statman (2000) investigates both the Domini 400 Social-index (DSI) and theperformance of 31 U.S. investment funds that apply a social screening. For the periodMay 1990 - September 1998 the DSI has a higher risk-adjusted return than the S&P500-index and the CRSP 1-10-index, a value-weighted index of all U.S. stocks. Thisresult is similar to the findings of DiBartolomeo and Kurtz (1999) and Sauer (1997).Most of the 31 SRI funds have a similar performance as the S&P 500-index and theDSI. There are only few funds with a significant under-performance (3 funds under-perform relative to the S&P 500 and 5 funds relative to the DSI). But as the fundreturns include transaction costs whereas the indices do not this results in anunderestimate of the true performance of the funds. To cope with this problemStatman compares the SRI funds also with conventional funds using a so calledmatching approach. He chooses two conventional investment funds for each SRI fundwith the objective to match the size of the SRI fund. As a large part of the transactioncosts of an investment fund is related to the size of the fund, the difference returnbetween the SRI fund and the average of the two conventional funds should be abetter measure of the performance of the underlying assets. Statman finds that theSRI funds exhibit a positive but not significant Jensen´s alpha relative to theconventional funds. Nevertheless, other fund characteristics such as a possible markettiming strategy of the fund management or the size of the companies in which thefund is invested are not controlled for. The approach of Statman could therefore stillresult in biased estimates of the out- or under-performance.
A matching approach is also applied by three other studies. Mallin, Saadouni andBriston (1995) compare 29 SRI funds with conventional funds from UK. They assignone conventional fund to each SRI fund by using the size and the age of the fund asmatching criteria and then compare Jensen´s alpha, Sharpe ratio and Treynor ratio foreach pair. The result shows that the performance of both types of British investmentfunds are very similar. But as the authors do not apply statistical tests for thedifferences in performance measures these are only approximate results.
Gregory, Matatko and Luther (1997) investigate 18 funds out of the 29 analysed byMallin et al. They use not only the two criteria of Mallin et al. for the matchingprocedure but consider also the area of investment and the type of the fund. Thus theassignment of the conventional fund to each SRI fund should be more precise.Gregory et al. estimate Jensen´s alpha using two benchmarks: a blue chip index
7
(Financial Times All Share index) and a small cap index. This gives a better estimateof Jensen´s alpha as most of the SRI funds are tilted towards companies with lowmarket capitalisation. The authors apply a statistical test to the differences in Jensen´salpha between the matched pairs of funds. Although the SRI funds have a slightlyworse performance the difference is not significant. But a cross-sectional analysisreveals further signs of an under-performance of the SRI funds.
Kreander, Gray, Power and Sinclair (2000). analyse 40 SRI funds from sevencountries using a matching approach. The countries included are Belgium (1),Germany (4), the Netherlands (2), Norway (2), Sweden (11), Switzerland (2) and theUK (18).9 The authors apply four criteria for the matching procedure: age, size,country and investment universe of the fund. Like most of the earlier studies they useJensen´s alpha, Sharpe ratio and Treynor ratio as performance measures. In theregression equation for Jensen´s alpha a measure for market timing is included.10 Asmarket timing of the fund management can significantly bias the estimation ofJensen´s alpha this is an important improvement compared to earlier studies. Thestatistical tests concerning the differences in the performance measures show that theSharpe and Treynor ratios of the conventional funds are slightly higher but notsignificant whereas the Jensen´s alpha of the SRI funds is higher but only at the 10%significance level. The authors conclude that SRI and conventional funds exhibit avery similar performance.
There are some shortcomings in the study of Kreander et al. The authors use theMSCI World index as benchmark. This choice may not be appropriate for all fundsbecause of different strategies concerning the regional diversification.11 The authors,in addition, do not use a small cap market index to cope with the small cap bias ofmost SRI funds. As the investment universe of the SRI funds is matched moreaccurately than in Gregory et al. this neglect might be of only minor importance. Butthe authors show in the appendix that the size difference between the SRI funds andthe assigned conventional fund is significant at the 10% level. Therefore theinterpretation of the results of Kreander et al. should be done with some caution.
The most recent study is Bauer, Koedijk and Otten (2002). They consider 32 British,16 German and 55 U.S. investment funds that apply a social screening. The authorscompare a portfolio of all SRI funds with a portfolio of all conventional funds of eachcountry.12 They mainly use the 4-factor model of Carhart (1997) in their
9 The number of SRI investment funds analysed for each country is given in brackets.10 The authors apply the approach of Henriksson and Merton (1981) which differentiates between
upward and downward movements of the market index.11 There are even funds in the sample which concentrate their investment only in their home-
country. For such funds the MSCI World index is probably only a poor benchmark.12 The funds are further divided into domestically and internationally investing funds.

8
investigation. The first three factors are those of the Fama-French model13 and thefourth factor captures the effect of momentum.14 Bauer et al. also use a conditionalversion of this model. Here they consider time-varying factor sensitivities where thetime variation depends on the influence of four pre-determined instruments.15 Theaim of this last approach is to include publicly available information which can beused by the fund management for dynamic investment strategies. A neglect of theseinfluences could result in biased estimates.
The main findings of Bauer et al. are: (1) German and U.S. SRI funds under-performboth their relevant indices and the conventional funds, whereas UK funds slightlyoutperform. But all these differences are not significant. (2) The SRI funds seem tohave investment styles that are different from the conventional funds. For example,the funds are tilted towards companies with a low book-to-market value (= growthstocks) and towards companies with a low market capitalisation. The latter result is aconfirmation of the findings of earlier studies.
The review of the literature on the performance of SRI investment funds has revealedsome interesting results. First of all, most of the studies agree that SRI funds have asimilar performance than conventional funds. This result is well founded and reliableas the studies use different methods (from very simple one-factor models to three-and four-factor models with time-varying coefficients), investigate different timeperiods and different countries. The hypothesis that SRI funds must have a worseperformance than conventional funds due to the restricted investment universe istherefore rejected. But the SRI funds also exhibit no out-performance.
Another important result is that SRI funds differ significantly in their investmentstrategy relative to conventional funds. The studies particularly find that SRI fundshave an overweight in companies with a low market capitalisation (small cap stocks).
The results particularly of the early studies on SRI funds should be interpreted withsome caution as these studies have shortcomings regarding the performance measure.For example only Kreander, Gray, Power and Sinclair (2000) consider market timingin their regression model and only Bauer, Koedijk and Otten (2002) apply aconditional model. The neglect of these two model characteristics can result in biasedestimates of the model parameters and thus also in misleading measures of out- orunder-performance.
13 See e.g. Fama and French (1996).14 The fourth factor is the return difference of a portfolio of past 1 month winners and a portfolio of
past 12 months losers.15 The instruments are the 1-month T-bill interest rate, the dividend yield on the market index, the
slope of the term structure of interest rates and the spread between the yields on corporate andgovernment bonds.

9
The studies using matching procedures suffer from an only insufficientapproximation of the fund characteristics. Particularly Statman (2000) and Mallin,Saadouni and Briston (1995) use a too small set of matching criteria. These twostudies can probably approximate the transaction costs of the funds quite well but thematched pairs of funds may still differ e. g. in their investment universe. To a smallerdegree this criticism also applies to Gregory, Matatko and Luther (1997) althoughthis study uses a more appropriate set of matching criteria. Only Kreander, Gray,Power and Sinclair (2000) also consider the investment universe in detail.
Regarding the problems in the application of the matching approach it seems to bemore appropriate to analyse the underlying assets directly. This can be done by usingSRI indices which are now available for different countries and regions forsufficiently long time periods. These indices measure the performance of assets thatare selected by SRI screening procedures and can therefore be used to test theperformance of SRI assets. The suppliers of the SRI indices as for example DowJones, Financial Times, Calvert and KLD16 use similar sets of social, ethical andenvironmental criteria which are comparable to the criteria applied by the SRIinvestment funds. The analysis of SRI indices instead of investment funds has theadditional advantage that common methodological problems like market timing andthe use of publicly available information as instruments for conditional estimationsare not necessary. Up to now only two indices – the Domini 400 Social index17 andthe Dow Jones Sustainability index for Europe18 – have been investigated in detail. Itis interesting to analyse again these two indices using the same method and to expandthis examination by the analysis of eight additional SRI indices that are available bynow.
3 Characteristics of the DataIn the following sections 4, 5 and 6 the performance and risk-return characteristics ofSRI investment funds and SRI indices are analysed. The study includes the major SRIinvestment funds from the United States, Germany and Switzerland. These are 30U.S. funds and 16 funds from Germany and Switzerland. In addition, 10 SRI indicesare investigated. The time series selected represent the most important and best-known SRI funds and indices which are part of earlier studies and publications of SRIorganisations.
The indices and funds comprise stocks that are selected applying social, ethical andenvironmental criteria. The SRI funds have a weighting of equities of at least 60%.Most of the analysed investment funds have an average equity weighting of morethan 80%-90% and invest only in equities or cash. The data are primarily collected 16 KLD is the abbreviation of KLD Research & Analytics, Inc.17 See particularly Sauer (1997), DiBartolomeo and Kurtz (1996) and Statman (2000).18 See Garz, Volk and Gilles (2002).

10
using the Thomson Financial Datastream database. Some of the indices (Domini 400Social, Calvin, Naturaktienindex) have been collected from the suppliers of theseindices.
The price data of the investment funds include all cash payments to the investor andall these distributions are reinvested in the fund. The prices are net of all managementfees and transaction costs. Load factors are not considered. The fund prices measuretherefore the net asset value of the funds. The SRI indices and all benchmark indicesare performance indices and include all cash payments (e.g. dividends) to theinvestor. The Naturaktienindex is a price index which only takes the stock prices intoaccount. The U.S. fund prices are calculated in U.S. dollar, whereas the prices of theGerman and Swiss funds are measured in German mark and euro (from 1/1/1999 on).
An important selection criterion for the SRI investment funds is the length of the timeseries. Only funds for which data are available before May 2000 have been chosen.The end date of the series is September 2002. The minimum length of the price seriesis therefore 30 months. For all calculations the full available price series have beenused, so that for most investment funds and indices the sample period is much longer.For the United States this selection criterion excludes only a few of the existing SRIfunds but for Germany and Switzerland more than 20 new established funds couldnot be included in the study. Many of these new funds have been launched during2001 so that their price series is too short to allow statistically sound inference.Nevertheless, some of the fund and index series used are also quite short and in thesecases the results may suffer from relatively imprecise estimates.
A major concern of many performance studies is the so called survivorship bias. Thiscauses an overestimation of the true performance regarding the universe ofinvestment funds if funds that have been closed in the past are not included in theinvestigation. Our sample of SRI investment funds seems to be free of a survivorshipbias as this field of business is still strongly growing in many countries with the resultthat older funds have not yet been closed to our knowledge.
But there could exist a survivorship bias regarding the indices as all indices areregularly restructured after some time. In this restructuring process the stocks whichhave delisted or exhibited a strong decrease in market capitalisation below a certainthreshold level are usually dropped. Therefore the SRI indices as well as thebenchmark indices may be affected by a survivorship bias.
The tables 1, 2 and 3 list all investment funds and indices included in the study, giveinformation regarding the region in which the fund invests and the first date forwhich prices are available by Thomson Financial Datastream. In column 6 of thesetables the specific social, ethical or environmental selection criteria of the funds arelisted. These SRI criteria are usually combined with financial criteria (such as theexpected profitability of the companies) in the stock selection process.
11
Table 1 shows the German and Swiss investment funds. All of these 16 funds apply aworld-wide diversification of their portfolio. This is in contrast to the U.S. funds(table 2) which in most cases concentrate on U.S. stocks. Only 4 of the U.S. fundsinvest internationally. Looking at the SRI investment criteria of the funds it seemsthat the U.S. investment funds are more homogeneous than their German and Swisscounterparts. The U.S. funds apply a broad set of positive and negative criteria.Almost all of these funds exclude companies which are engaged in businesses likeproduction of alcohol, gambling, nuclear energy, tobacco and military weapons.Many funds also consider criteria concerning the environment, workplace conditionsand discrimination of minorities. Amongst the German and Swiss SRI funds are alsofunds that concentrate only on environmental friendly products and technologies.Overall the U.S. funds have a much stronger emphasis on social and ethical criteria.
The tables 4a - c give a first overview of the mean returns and the performance of theSRI funds and indices. All returns in this study are logarithmic returns based onmonthly data. The performance is calculated using the Sharpe ratio (SR). The Sharperatio measures the return above the risk-free interest rate(= excess return) divided by the total risk of the investment:
(1) frSR
�
�
�
�
where � = mean logarithmic return, rf = logarithm of the risk-free interest rate (mean),� = standard deviation of the logarithmic returns. The risk-free interest rates are the1-month Fibor for German and Swiss funds and the 1-month U.S. interbank offeredrate for U.S. funds and the SRI indices. The Sharpe ratios of the funds and indices arecompared to the Sharpe ratio for the MSCI World index for the same period. Thecalculations use the full available data history of the SRI funds and indices.
Table 4a reveals that the majority of the German and Swiss funds have both a lowermean return compared to the MSCI index and also a lower Sharpe ratio. Only 4 fundsi.e. 25% have a Sharpe ratio above or equal to the MSCI index. For the U.S. funds thesituation is similar: only 9 out of 30 funds (= 30%) have at least a Sharpe ratio as theMSCI index. In contrast, 8 SRI indices (= 80%) performed better than the MSCIWorld index. This indicates that the underlying assets represented by the indicesseem to perform similar (or even better) than conventional assets, whereas theinvestment funds are in most cases not able to earn an extra-return whichcompensates the costs of the fund management. But these are only first results thatwill be analysed in depth in the next section.

12
4 Performance AnalysisThe performance of the SRI investment funds and indices is investigated usingdifferent regression approaches. The aim is to measure Jensen´s alpha i.e. the extra-return that is not explained by the risk exposures of the fund. The Jensen´s alpha ofthe SRI investment funds is estimated by three approaches.
The first approach uses two benchmark indices, a blue chip index and a small capindex. The second approach considers in addition market timing activities of the fundmanagement and the third approach expands the second approach by includinginstrumental variables for a conditional performance estimation.
A result of the earlier studies is that SRI funds are significantly tilted towardscompanies with a low market capitalisation.19 Therefore the investment universeshould not only include a market index for companies with high market capitalisationbut also a small cap equity index.20
Thus, the first model version for estimating the out- or underperformance is:
(2) (Version 1 - Funds) , 1 , 2 , ,i t i i B t i S t i tre re re� � � �� � � �
re denotes the excess return of either fund i or the benchmark indices (B = blue chipindex, S = small cap index), which is defined as:
(3) , , , 1x t x t f tre r r�
� � with x = i, B or S and
(4) , , , 1ln( ) ln( )x t x t x tr I I�
� � , , 1 t-1ln(1 risk-free interest rate /100) /12f tr�
� � and I = index level of either fund i or one of the benchmark indices.
The benchmark indices are selected in order to approximate the investment universeof the SRI funds and indices. For all globally investing funds the blue-chipbenchmark index is the MSCI World index and the small cap index is the world indexof Salomon Smith Barney which covers international companies with a marketcapitalisation below 500 mn U.S. dollar. The U.S. benchmarks are the Standard &Poor´s 500-index for the blue chip stocks and the Wilshire Small Cap 250 index ofthe small cap stocks. The i� measure if the SRI fund or index has an outperformance
19 See e.g. Luther and Matatko (1994), DiBartolomeo and Kurtz (1999) and Bauer, Koedijk and
Otten (2002).20 We do not use the so called Fama-French-factors as e.g. Bauer, Koedijk and Otten (2002) and
Garz, Volk and Gilles (2002) did. This is because the Fama-French-factors do not represent theprimitive assets that constitute the SRI funds and indices but they represent instead a specificstrategy of the portfolio management.

13
compared to a passive portfolio that consists of the two benchmark indices with theweights 1i� and 2i� .
If the fund management has market timing abilities model version 1 results in abiased estimation of Jensen´s alpha.21 To consider market timing in the regression weapply the usually used Treynor-Mazuy approach.22
(5) (Version 2 - Funds) 2 2
, 1 , 2 , 1 , 2 , ,( ) ( )i t i i B t i S t i B t i S t i tre re re re re� � � � � �� � � � � �
A positive � means that the fund manager is able to time the market, whereas anegative � shows that the manager invests less in upward markets and more indownward markets. This can be seen from the derivative of the SRI fund or indexreturns relative to the returns of the benchmark indices, e.g.,
, , 1 1 ,i t B t i i B tre re re� �� � � � . Equation (5) measures market timing abilities for bothbenchmark indices.
Model versions 1 and 2 give unconditional estimations of Jensen´s alpha. If the fundmanagement can forecast market movements by publicly available information thenthe sensitivities of the funds on the market returns should be time-varying. Thus,equations (2) and (5) can result in biased estimates of the performance due to aneglect of this time variation. In model version 3 we apply the approach of Fersonand Schadt (1996) and use instrumental variables that approximate changing marketconditions.
(6) (Version 3 - Funds) 2 2
, 1 , 2 , 1 , 2 ,( ) ( )i t i i B t i S t i B t i S tre re re re re� � � � �� � � � �
, 1 , , 1 , ,1( )J
jB j t B t jS j t S t i tjz re z re� � �
� ��
� � ��
The J instrumental variables zj,t-1 are predetermined from month (t-1). We use J=2instruments: the U.S. long-term interest rate and the U.S. term spread i.e. thedifference between the long-term and the short-term interest rate. The U.S. long-terminterest rate is a proxy for the global conditions on the bond markets and the termspread is a leading indicator for the business cycle. As usual the instrumentalvariables are the deviations of the original variables from their unconditional mean.If, for example, only 1B� is significant then the new reaction of ,i tre to changes in e.g.
,B tre is: , , 1 1 1, 1 1 ,( )i t B t i B t i B tre re z re� � ��
� � � � � and therefore systematically depends onthe value of the instrument 1, 1tz
�
in period (t-1).
21 See e.g. Admati and Ross (1985).22 See Treynor and Mazuy (1966).

14
As market timing and time-varying betas due to publicly available information areirrelevant for the performance measurement of the SRI indices two simplerapproaches are used for analysing these indices:
(7) (Version 1 - Indices) , 1 , ,i t i i B t i tre re� � �� � �
(8) (Version 2 - Indices) , 1 , 2 , ,i t i i B t i S t i tre re re� � � �� � � �
In equation (7) only a blue-chip benchmark index is used whereas version 2 alsoincludes a small cap index. As benchmark indices those indices are chosen that matchthe investment universe of the SRI indices.
For the Calvin index, the S&P 500 “Environmental Services” and the Domini 400Social index the Standard & Poor´s 500 is the blue-chip benchmark index. For theNaturaktienindex (NAX) and the Datastream world index “Environmental control”the MSCI World index is most appropriate. As the NAX is a price index here theMSCI World index is chosen as price index. The blue-chip benchmarks for theFTSE4Good-indexes are the FTSE All-World Developed, All-World Europe andLocal US index, respectively. The benchmarks for the Dow Jones Sustainabilityindices are the DJ STOXX 600-index for Europe and the DJ World-index. The smallcap indices used in equation (8) are the Salomon Smith Barney indices for Europeand World which cover companies with a market capitalisation below 500 mn U.S.dollar. For the United States the Wilshire Small Cap 250 index is taken.
All five equations ((2) and (5) to (8)) are estimated with ordinary least squares (OLS).The variance-covariance matrix of the residuals is corrected for autocorrelation andheteroskedasticity using the Newey-West approach.23 Some of the time series of theSRI fund or index returns are relatively short and thus statistical inference onparameters is relatively imprecise for these funds or indices.
The tables 5a - c show the estimates of Jensen´s alpha for the funds and the indices.Although for many funds the alphas are negative there are only a few significantestimates. Concerning the German and Swiss funds the Fürst Fugger Sustainabilityfund, the SAM Sustainability Index fund and the Oppenheim DJ Sustainability WorldIndex fund clearly under-perform (model version 3). All three funds have the DowJones Sustainability World index as benchmark. The Sun Life Ecological Portfolioalso exhibits a negative performance but only at the 10% significance level. Theresults also show that the analysis is often hampered by a short time period. Forexample, the SAM Sustainability Pioneer Fund exhibits a relatively poor performancecompared to the benchmarks (� = -2.373), but the estimate is neverthelessinsignificant.
23 See Newey and West (1987).

15
As investment fund returns bear the costs of the fund management it is most often thecase in empirical studies that the performance of investment funds is worse than thecorresponding benchmark. It is therefore a surprise that at least 3 out of 16 Germanand Swiss funds (model version 3) exhibit a positive though not significant alpha.The performance of the U.S. funds seems to be similar to their German and Swisscounterparts. Only one of the 30 funds has a positive but not significant alpha usingmodel version 3. But there are 7 funds that significantly under-perform theirbenchmarks.
The comparison between the performance of an investment fund and benchmarkindices tests a joint hypothesis: the first part of the hypothesis is the out- or under-performance of the underlying assets and the second part is the ability of the fundmanagement to create extra-returns higher than the costs of the fund. Therefore theresults of the tables 5a and 5b cannot reveal which of the two parts of the hypothesisis rejected.
A separate test of the performance of the underlying assets can be conducted bymeasuring Jensen´s alpha of the SRI indices. As table 5c shows that three of the 10indices clearly under-perform their benchmarks (model version 2). These are theCalvin index and the Europe-wide FTSE4Good-index. The Dow Jones SustainabilityWorld index (DJSI) also under-performs but only at the 10%-significance level.
In case of the DJSI World-index and the three FTSE4Good-indices the Jensen´s alphahave been calculated for two periods each: the full data sample and a shorter periodfrom the official start of the index on. The DJSI World-index, for example, isavailable from 1994 on but the DJSI index family has been launched not beforeJanuary 1999. This means that the DJSI World-index has been calculated back to1994. Therefore the test should also consider the shorter period as the index might bebiased upwards in the period from 1994 to 1998. In case of the FTSE4Good-indicesthe situation is similar: the official start of the indices is January 2001 but the indicesare available for much longer periods.
The results for Jensen´s alpha shows that in all these cases the estimate is smaller forthe period which begins at the date of the official start. But only in case of theFTSE4Good-index for Europe and the DJSI World-index this difference issignificant. Neverthelss, the results for the backward calculated index data has to beinterpreted cautiously. As a result we conclude that three SRI indices perform worsethan their benchmarks whereas the other seven indices exhibit no significantdeviation from the benchmark indices.
Our results for the Domini 400 Social-index are comparable to those of Sauer (1997)and DiBartolomeo and Kurtz (1999). They also find positive but not significantalphas which are of similar size than our estimates. But our estimations for the DJSI-index for Europe is partly at odds with those of Garz, Volk and Gilles (2002).
16
Whereas they found a positive and slightly significant alpha our results showinsignificant alphas. This difference is astonishing as they use the same time period.But although the benchmarks used by Garz, Volk and Gilles are comparable to oursthey are not identical. As the time period for the estimation is rather short and theestimated alpha of Garz, Volk and Gilles is only significant at the 10%-level thedifferent results need not be a contradiction.
The tables 6a – b show the influence of both the blue chip and the small capbenchmark indices, the market timing-abilities of the fund managers and the overallfit of the model (R2). The �-coefficients in the equations (5) and (6) quantify themarket timing concerning the blue chip and the small cap indices. If thesecoefficients are positive then the manager increases the market exposure when themarket index rises and becomes more prudent when the market index decreases. Theoutcomes of the regressions show instead that the managers of the German and SwissSRI funds have relatively bad timing abilities as many of them increase the marketexposure in a downturn and decrease it in an upswing: 9 from the 16 funds have atleast one significantly negative �-coefficient. Only two funds have the ability to timethe market: the Pictet Global Sector Water fund and the Fürst Fugger Sustainabilityfund. For the U.S. funds most of the �-coefficients are not significant, only 5 fundmanagers have negative and 3 positive timing capabilities. Overall the timing abilitiesof the U.S. fund managers can therefore be characterised as neutral.
Another result from the tables 6a and 6b is the significant and strong influence of thesmall cap indices on the returns of the German and Swiss SRI funds. For 11 of the 16funds the influence of the small cap index is even larger than the impact of the bluechip stocks. This is in sharp contrast to the U.S. funds as for most of these funds theinfluence of the blue chip index strongly dominates. Therefore, the U.S. funds aremuch less exposed to small company risk than the German and Swiss funds. This isalso a finding of Bauer, Koedijk and Otten (2002). The overall fit of the fund returnregressions is relatively good: the corrected R2 is in most cases higher than 50% forthe German and Swiss funds and at least for half of the U.S. funds.
The sensitivities of the SRI indices relative to the blue chip and small cap indices aremore different amongst each other. There are five indices for which the small capstocks play a major role but the others these sensitivities are either not significant oreven negative. In case of the FTSE4Good Europe-index the negative sign for the bluechip index is probably due to multi-collinearity. As the investment style-regressions(see section 6) show this index is in fact dominated by blue chip stocks. The overallfit of the regressions (R2) is relatively high in most cases. Only the two specialisedsectoral indices from Standard & Poor´s and Datastream exhibit a very low R2. Allother indices are relatively well explained by the two benchmark indices.
17
5 Factor SensitivitiesFor the assessment of the risk of SRI investment funds and indices it is interesting toanalyse the impact of important macroeconomic variables. For exampleDiBartolomeo and Kurtz (1996) have found that the Domini 400 Social-index reactedweaker than the S&P 500 index on changes in the oil price and the U.S. industrialproduction in the period 1990 to 1993.
For the investigation of the factor sensitivities the following approach is used:
(9) , 1 , 2 , ,i t i i B t i S t i t i tre re re UF� � � � �� � � � �
The excess returns (re) of the SRI fund or index are regressed on the excess returns ofa blue chip and a small cap benchmark index and in addition on a macroeconomicfactor. As financial market theory tells us that particularly the unexpected change of afactor should have an influence on market prices the original logarithmic differenceof the factor i.e. 1ln( ) ln( )t t tF Factor Factor
�
� � is filtered by an ARMA (2,1)-model.The ARMA-model is used to approximate the expected change of the factor. Theregressor UFt is equal to the residual of the ARMA equation (= unexpected change ofthe factor).
The �-coefficient in equation (9) indicates whether the unexpected change in thefactor has a significant effect on the return of the SRI funds or indices beyond theeffect of the factor on the benchmark indices. If � is positive the effect is strongerthan the effect on the benchmark indices whereas a negative value indicates a smallereffect. The tables 7a and 7b show all significant factor influences on the SRI funds.Only those �-coefficients with significance levels of 5% or below are displayed.
The factors chosen are the usual macroeconomic variables used in empirical tests ofthe Arbitrage Pricing Theory (see e.g. Chen, Roll and Ross (1986)).
1. U.S. short term interest rate (1-month interbank offered rate)2. U.S. long term interest rate (average)3. Slope of the term structure = factor 2 – factor 14. External value of the U.S. dollar (nominal, trade-weighted)5. Oil price6. Industrial production OECD7. Industrial production USA8. Producer prices OECD9. Producer prices USA10. Consumer prices OECD11. Consumer prices USA

18
A first look at the tables 7a and b reveals that the U.S. funds behave similar to theirbenchmark indices: for about half of these funds no factor coefficient is significant,whereas this is true for only 3 of the German and Swiss funds.
The German and Swiss funds react particularly to the following three macroeconomicfactors: the OECD industrial production, the long-term U.S. interest rate and theexternal value of the U.S. dollar. All of the significant �-coefficients are positive. Thereturns of most of the funds increase relative to their benchmarks with an(unexpected) rise in the OECD industrial production, an increase in the long-termU.S. interest rate and an appreciation of the U.S. dollar. The funds are therefore tiltedtowards pro-cyclical industrial sectors, stocks with a low interest rate sensitivity andcompanies which profit by a higher value of the U.S. dollar. The other factors playonly a negligible role, the producer and consumer prices even have no significantinfluence.
The U.S. fund returns show no distinct influence of macroeconomic factors. Thereare only three factors which are of some importance: the external value of the U.S.dollar, the U.S. industrial production and the U.S. consumer prices. The U.S. fundreturns are therefore much more in line with the behaviour of their benchmark indicesthan the German and Swiss funds.
Table 7c shows the results for the SRI indices. Most of the indices react at least toone of the macroeconomic factors, but it is difficult to find a clear pattern. The moreimportant influences stem from the external value of the U.S. dollar and the short-term U.S. interest rate. Less important are the oil price, the slope of the U.S. termstructure and the U.S. industrial production. In many cases the signs of the significant�-coefficients for the same factor differ among the SRI indices.
The returns of two SRI indices - the DJSI World-index and the Domini-index -decrease relative to their benchmarks when the oil price increases. This was alsofound by DiBartolomeo and Kurtz (1996) for the Domini 400 Social-index for theperiod 1990 to 1993. And this is still a characteristic of the structure of the Dominiindex.24
In sum, the examination of the reactions of SRI fund and index returns onmacroeconomic factors shows a clear difference between German and Swiss funds onthe one hand and U.S. funds on the other hand. Most of the German and Swiss fundsshow a significant impact of unexpected changes in the OECD industrial production,the long-term U.S. interest rate and the U.S. dollar. In contrast, the factor sensitivitiesof the U.S. funds but also the SRI indices are less pronounced. Overall, the most
24 DiBartolomeo and Kurtz explain this reaction by the relatively high weight of the Domini-index
in those sectors that are related to private consumption: A higher oil price reduces the disposableincome of the households and thus leads to a decrease in the demand for consumption goods.

19
influential single factor is the external value of the U.S. dollar. In most cases anappreciation of the dollar induces a relative increase of the fund returns. But besidesthis factor it is difficult to find any clear pattern for macroeconomic sensitivitiesamongst the two groups of funds and the SRI indices. The differences in themacroeconomic factor sensitivities are thus an indication of structural differences.
6 Investment Style AnalysisFrom an external point of view it is difficult to assess the concrete strategy of thefund management. SRI funds apply a set of positive and/or negative selection criteriain addition to conventional criteria such as the profitability of the companies. Someof the criteria like “sustainability” or “positive contribution to the society” aredifficult to interpret and overall the laid-down fund strategies leave a wide range forindependent asset allocation decisions of the fund managers. Therefore it is worth-wile to investigate the specific investment styles of the SRI funds. The investmentstyles are analysed by estimating the fund weights concerning industrial sectors andinternational regions. This is in contrast to the studies of Garz, Volk and Gilles(2002) and Bauer, Koedijk and Otten (2002) which define investment styles assensitivities to the Fama/French-factors.25
The basic equation for the investment style analysis is:26
(10) , , ,1
K
i t i ik k t i tk
r r� � ��
� � ��
Here ri,t denotes the return of the SRI fund or the SRI index and rk,t is the return of thek-th factor-index. Equation (10) uses K different factor-indexes. These are eithersectoral or regional stock indices. The equation is estimated under the restrictions thatthe �-coefficients are non-negative and sum to one. Therefore, the ��coefficients canbe interpreted as portfolio weights. This does not necessarily mean that the �-coefficients give the correct portfolio weights of the SRI funds and indices. Ingeneral, it may only be the case that the passive portfolios that consist of the factor-indices describe relatively well the risk-return characteristics of the returns on theleft-hand side.
The non-negativity constraint means that short-sales are not allowed. The �-coefficient measures the so called tracking error between the SRI fund or index andthe passive portfolio that consists of the factor-indices.
25 These are the excess market return, a factor measuring the valuation of the companies by the
book-to-market ratio and a factor measuring the size of the companies. Bauer et al. (2002)include a fourth factor which represents the influence of momentum strategies.
26 See e.g. Ter Horst, Nijman and de Roon (1998) and Gerard, Hillion and de Roon (2002).

20
In addition, so called spanning tests are conducted for the SRI indices. The aim is toinvestigate if adding the socially screened assets to the investment universerepresented by the factor-indices improves the efficient frontier. This is done byestimating equation (10) without constraints in the first step and then testing in asecond step if the two constraints - � equal to zero and the ��coefficients sum to one– are rejected. 27 If the constraints are rejected then the SRI index should be includedto the investment universe, otherwise the factor-index portfolio mimics the SRI indexand the index is spanned by the K factors.
The factor-indices used in equation (10) are the stock indices for the following 10industrial sectors:
1. Basic industries (chemicals, construction, forestry and paper, steel, ...)2. Cyclical consumer goods (automobiles, household goods and textiles, ...)3. Cyclical services (retailers, leisure/entertainment/hotels, media/photography,
transport, ...)4. Financials (banks, insurance, investment companies, real estate, ...)5. Information technology (information technology hardware, software and computer
services)6. Non-cyclical consumer goods (beverages, food, health, personal care products,
pharmaceuticals, ...)7. Non-cyclical services (food and drug retailers, telecom services)8. Resources (mining, oil and gas)9. Utilities (electricity, gas distribution, water)10. General industries (aerospace, electronic and electrical equipment, engineering
and machinery, ...)
The indices are constructed by Thomson Financial Datastream and are available forglobal, European and U.S. stocks. Therefore we can use those sectoral indices that fitbest to the regional investment universe of the SRI funds and indices. As the sectoralindices cover mainly the blue chip stocks it is necessary to use also a small cap indexas factor no. 11.
Table 8a shows the weights of the sectoral portfolio for German and Swiss funds. Formost of the funds the small caps have the highest weight. The average weight for thesmall caps is 42%. The small cap weight is clearly higher than those for U.S. stockswhich is approximately 32%. (table 8b). This is a confirmation of the results of theperformance regressions in section 4.
The weights for the industrial sectors no. 7 but also for no. 6 and 9 are particularlyhigh. Most of the German and Swiss funds are thus tilted towards non-cyclicalservices and consumer goods and have also a relatively high weight in utilities. It
27 See Huberman and Kandel (1986).
21
seems also that the funds have relatively similar strategies concerning their sectoraldiversification. All of them have a strong concentration in consumer goods andconsumer services and reduce their dependency from the business cycle by investingprimarily in non-cyclical stocks. This seems to be a contradiction to the relativestrong pro-cyclical influence of industrial production found in section 5. But thesectoral investment style regressions only measure the diversification of the share ofblue chip stocks whereas the small cap stocks might be invested primarily in othersectors. Another explanation is that small companies usually have a higher businesscycle risk and the high sensitivity to industrial production could be mainly caused bythe high share in small cap stocks.
The U.S. funds (table 8b) have similar strategies concerning the sectoraldiversification amongst each other and compared to the German and Swiss funds.They also concentrate their investments in the non-cyclical consumer goods andservices sectors. But they invest in addition significantly in information technology(sector no. 5) and 6 funds have a high portfolio weight in the sector “financials”. Incontrast to the German and Swiss funds the investment in utilities is lower. Butoverall the similarities between U.S., German and Swiss funds are remarkable.
The SRI indices are relatively dissimilar amongst each other. Many of them have arelatively high portfolio weight in sector no. 6 which is also one of the preferredsectors of the U.S., German and Swiss funds. The three FTSE4Good-indices revealrelatively high weights in the sectors “financials” and “information technology”,which are almost fully neglected by the other SRI indices. The share of blue chipstocks in the SRI indices is in most cases concentrated in only 2, 3 or 4 industrialsectors. This is a much stronger concentration than those of the investment funds.
The three FTSE4Good-indices are fully invested in blue chip stocks. This is in linewith the analysis of Hamid and Sandford (2002) who find a clear concentration instocks with a high market capitalisation. This should also be the case for the twoDJSI-indices. But our estimates in table 8c exhibit a very high weight of small capstocks. How can this contradiction be resolved? First of all, Garz, Volk and Gilles(2002) show that the DJSI Europe-index exhibits significant deviations in the countryallocation from the DJ Stoxx600-index and – still more important – is characterisedby a specific stock selection strategy. Thus it might be the case, that the globalsectoral indices of Datastream do not fit well to the specific structures of the DJSI-indices. Another reason might be a high correlation between the small cap index andthe 10 sectoral blue chip indices.28
The last column of table 8c gives the results of the spanning tests. For 6 of the 10indices the spanning hypothesis is rejected i.e. the efficient frontier constructed using 28 An experiment where the blue chip index (= DJ Stoxx600) was used instead of the small cap
index has given the expected corrected result: the blue chip index exhibited a weight of 100%and all sectoral indices together 0%.
22
the 10 factor-indices can be shifted upwards by including these SRI indices in theinvestment universe. But the result does not tell us if the SRI indices should have apositive or a negative weight in the optimal portfolio. The result simply means thatthe return-risk characteristics of the SRI indices are a valuable addition to thebenchmark indices. This is probably a consequence of the special structure of the SRIindices which is only partly captured by the factor-indices. For two of theFTSE4Good-indices, the DJSI World-index and the Datastream “EnvironmentalControl”-index spanning is not rejected and a passive portfolio formed by the 10benchmark indices can sufficiently well mimic the return characteristics of these SRIindices.
In addition to the investment style analysis using industrial sector stock indices thetables 9a-c show the results for the regional analysis. All SRI funds and indices whichdiversify world-wide are investigated using 3 regional stock indices from MSCI. Theregional indices are:
1. Europe (all European countries)2. North America (Canada, United States)3. Pacific region (Australia, Hong Kong, Japan, New Zealand, Singapur)
All three indices are value-weighted. As the regional indices concentrate on blue chipstocks in addition the world-wide small cap index (market capitalisation below 500mn U.S. dollar) from Salomon Smith Barney is used as factor no. 4. Table 9a showsthat the German and Swiss funds invest the blue chip share of their portfolio mainlyin European stocks. The Fürst Fugger fund and the Ecological Portfolio of Sun bothhave a high investment share in the pacific region and the SAM SustainabilityPioneer fund is highly invested in the United States. The four U.S. funds with aglobal diversification (table 9b) invest also primarily in Europe but have also arelatively high portfolio weight in the pacific region. Only the Global Equity fund ofCitizen concentrates the blue chip investments in the United States.
The picture for the four world-wide SRI indices (table 9c) is mixed. The globalFTSE4Good-index and the Environmental control-index of Datastream areconcentrated in U.S. blue chip stocks, whereas the other two indices have a largeshare of European stocks. The spanning tests (see column 7) shows that all fourindices are a valuable addition to the four benchmark indices. With the exception ofthe NAX the spanning hypothesis was not rejected for these indices using the sectoralfactor-indices (table 8c). Thus, these three indices are better explained by theindustrial sector-indices than by the regional indices.
There are two major results of this section. First, the regressions confirm that most ofthe SRI funds and also many of the indices have a relatively high weight in small capstocks. This is particularly true for the German and Swiss funds whereas the U.S.funds and the indices are not so strongly concentrated in small caps. Second, the SRI
23
funds and indices have a special structure. Most of the funds concentrate their bluechip investments in the sectors non-cyclical consumer goods and non-cyclicalservices. The German, Swiss and U.S. funds have a similar sectoral structure withonly few exceptions: the German and Swiss funds invest more in utilities whereas theU.S. funds also prefer the sector information technologies. The fund returns can bewell approximated by the sectoral benchmark indices which can be seen from thehigh values for the corrected R2. Another result is that most of the global funds investa relatively high share of their blue chip investments in Europe.
7 ConclusionsSocially responsible investment (SRI) funds are a special market segment of the assetmanagement industry. Although this market segment is still relatively small it is fastgrowing in many countries. There is also an increasing number of banks, assetmanagement companies, investment advisors and rating agencies that are specialisedin this field of business. Therefore the economic performance of these specialisedinvestment funds is of interest to the investors and the investment companies. In ourstudy we investigate the performance of 16 German and Swiss funds and 30 U.S.funds that concentrate on socially responsible investing.
From the point of view of financial market theory it is interesting to examine ifsocially screened assets have the same performance than conventional assets. As SRIinvestment funds use only a subset of the total investment universe they should havethe same or a worse performance than conventional funds. The performance analysisof SRI investment funds tests the combined hypothesis of the quality of the fundmanagement and the performance of the underlying assets. We thus enlarge theperformance analysis by the investigation of 10 specialised SRI indices whichrepresent the performance of socially screened assets only.
The review of the literature shows that SRI funds have, on average, a similarperformance than conventional funds. The studies use different methods – fromsimple one-factor models to three- and four-factor models with time-varyingcoefficients -, investigate funds of different countries and analyse different timeperiods. Therefore it is relatively reliable that the performance of SRI funds iscomparable to those of conventional funds. Many studies find a significantoverweight of SRI funds in companies with a low market capitalisation (small capstocks). But the results particularly of the early studies on SRI funds should beinterpreted with some caution as these studies have some shortcomings regarding theperformance measure. Regarding the results of earlier studies we use two benchmarkindices – a blue chip stock index and a small company stock index. The performanceof the funds is measured by regression approaches that consider both market timingabilities of the fund management and publicly available information (= conditionalperformance measure).

24
Those studies using a so called matching approach try to compare SRI funds andconventional funds grouped by important fund characteristics such as size, age andinvestment universe. Regarding the problems in the application of this approach itseems to be more appropriate to analyse the underlying assets directly. This can bedone by using SRI indices which are now available for different countries andregions. Most of these indices have a sufficiently long history and are thereforeapplicable to test the performance of assets that are selected by SRI screeningprocedures. Up to now only two indices – the Domini 400 Social index (e.g. Sauer(1997), DiBartolomeo and Kurtz (1996), Statman (2000)) and the Dow JonesSustainability index for Europe (Garz, Volk and Gilles (2002)) – have beeninvestigated in detail. In our study we expand this examination by the analysis ofeight additional SRI indices that are now available.
The results of the performance analysis show that most of the German, Swiss andU.S. SRI investment funds do not significantly under-perform their benchmarks. Adifference between the funds is that U.S. are more invested in blue chip stockswhereas the German and Swiss funds are strongly tilted towards smaller companies.The results of the performance analysis for the SRI indices shows that two indicesclearly under-perform their benchmarks - the Calvin-index and the Europe-wideFTSE4Good-index. The performance of the DJSI World-index is also negative (at the10% significance level) when the data sample starts at the official start date of theindex (Jan. 1999). But there are also 3 SRI indices with a positive (but insignificant)alpha. Overall, the hypothesis that the performance of SRI assets is not worse thanthose of conventional assets can only be rejected for a few SRI indices. The analysisalso reveals that most of the SRI indices have special index structures that deviatefrom the conventional benchmarks.
In addition we investigated the sensitivity of the returns of SRI funds and indices onimportant macroeconomic factors. Many German and Swiss funds show a significanteffect on unexpected changes in the OECD industrial production, the long-term U.S.interest rate and the U.S. dollar. In contrast, the factor sensitivities of the U.S. fundsand the SRI indices are much less pronounced. Overall, the most influential singlefactor is the external value of the U.S. dollar.
The estimation of specific portfolio weights concerning industrial sectors andinternational regions is conducted by so called investment style-regressions. We findtwo major results. First, the investment style analysis confirmed that SRI funds andsome of the indices have a relatively high weight in small cap stocks and that Germanand Swiss funds are on average stronger tilted towards small cap stocks than U.S.funds. A second important result is that SRI funds and indices have a specialstructure. They concentrate in most cases their blue chip investments in the twosectors “non-cyclical consumer goods” and “non-cyclical services”. There are onlyfew differences between German and Swiss funds and their U.S. counterparts: theGerman and Swiss funds invest more in utilities whereas the U.S. funds also prefer
25
the sector “information technologies”. Another result is that most of the global fundsand indices concentrate their blue chip investments in European companies.
To summarize, socially screened assets have no clear disadvantage concerning theirperformance compared to conventional assets In addition the analysis reveals specificrisk-return characteristics (or investment styles) so that SRI funds and indices as agroup might be characterised as special investment vehicles different fromconventional assets.
References
Admati, A.R. and S.A. Ross (1985), Measuring Investment Performance in a RationalExpectations Model, Journal of Business 58, 1-26.
Bauer, R., K. Koedijk and R. Otten (2002), International Evidence on Ethical MutualFund Performance and Investment Style, LIFE Working Paper No. 02.59,University of Maastricht.
Carhart, M. M. (1997), On Persistence in Mutual Fund Performance, Journal ofFinance 52, 57-82.
Chen, N., R. Roll and S. Ross (1986), Economic Forces and the Stock Market,Journal of Business 59, 383-404.
DiBartolomeo, D. and L. Kurtz (1996), Socially Screened Portfolios: An AttributionAnalysis of Relative Performance, Journal of Investing 5, No. 3, 35-41.
DiBartolomeo, D. and L. Kurtz (1999), Managing Risk Exposures of SociallyScreened Portfolios, Northfield Information Services, Boston,www.northinfo.com.
Fama, E. and K. French (1996), Multifactor Explanations of Asset PricingAnomalies, Journal of Finance 51, 55-84.
Ferson, W. E. and R. W. Schadt (1996), Measuring Fund Strategy and Performancein Changing Economic Conditions, Journal of Finance 51, 425-461.
Garz, H., C. Volk and M. Gilles (2002), More Gain than Pain - SRI: Sustain-abilityPays Off, WestLB Panmure, http://www.westlbpanmure.com/sri/pdf/sri_nov2002.pdf
Gregory, A., J. Matatko and R. Luther (1997), Ethical Unit Trust FinancialPerformance: Small Company Effects and Fund Size Effects, Journal ofBusiness Finance & Accounting 24, 705-725.
Hamid, N. and Y. Sandford (2002); Are SRI Indices responsible? Deutsche Bank,Pan-European Portfolio, Index & Futures Research, October 2002.
Hamilton, S., H. Jo and M. Statman (1993), Doing Well While Doing Good? TheInvestment Performance of Socially Responsible Mutual Funds, FinancialAnalysts Journal, November/December 1993, 62-66.

26
Huberman, G. and S. A. Kandel (1987), Mean-Variance Spanning, Journal of Finance42, 383-388.
Kreander, N., R. H. Gray, D. M. Power and C. D. Sinclair (2000), Evaluating thePerformance of Ethical and Non-Ethical Funds: A Matched Pair Analysis,Working Paper, University of Dundee Discussion Paper Acc/003.
Luther, R. and J. Matatko (1994), The Performance of Ethical Unit Trusts: Choosingan Appropriate Benchmark, British Accounting Review 26, 77-89.
Luther, R., J. Matatko and D. C. Corner (1992), The Investment Performance of UK“Ethical” Unit Trusts, Accounting Auditing & Accountability Journal 5, 57-70.
Mallin, C. A., B. Saadouni and R. J. Briston (1995), The Financial Performance ofEthical Investment Trusts, Journal of Business Finance & Accounting 22,483-496.
Moskowitz, M. (1972), Choosing Socially Responsible Stocks, Business and Society,vol. 1 (Spring), 71-75.
Newey, W.K. and K.D. West (1987), A Simple Positive Semi-DefiniteHeterskedasticity and Autocorrelation Consistent Covariance Matrix,Econometrica, vol. 55, 703-708.
Rosenberg, B. (1974), Extra Components of Covariance in Security Markets, Journalof Financial and Quantitative Analysis 9, 263-274.
Sauer, D. A. (1997), The Impact of Social-Responsibility Screens on InvestmentPerformance: Evidence from the Domini 400 Social Index and Domini EquityFund, Review of Financial Economics 6, 23-35.
Schäfer, H. and R. Stederoth (2002), Portfolioselektion und Anlagepolitik mittelsEthik-Filtern – ein Überblick zum Stand der empirischenKapitalmarktforschung, Kredit und Kapital, Heft 1/2002, 101-148.
Statman, M. (2000), Socially Responsible Mutual Funds, Financial Analysts Journal,May/June 2000, 30-39.
Ter Horst, J. R., T. E. Nijman and F. A. de Roon (1998), Style Analysis andPerformance Evaluation of Dutch Mutual Funds, CentER Discussion Paper9850.
Treynor, J. and F. Mazuy (1966), Can Mutual Funds Outguess the Market?, HarvardBusiness Review 45, 131-136.
White, M. A. (1995), The Performance of Environmental Mutual Funds in the UnitedStates and Germany: Is there Economic Hope for “Green” Investors?,Research in Corporate Social Performance and Policy, Supplement 1, 323-344.

27
App
endi
xTa
ble
1 –
Ger
man
and
Sw
iss E
quity
Fun
ds
Nam
eAb
brev
.Re
gion
Star
tD
ate1
Volu
me
(mn.
€)2
Port
folio
Cha
ract
eris
tics
Act
ives
t Lux
Eco
tech
Act
ives
tW
orld
11/9
034
.2En
viro
nmen
t frie
ndly
pro
duct
s or t
echn
olog
ies
CS
Fund
Glo
bal S
usta
inab
ility
CS
Fund
Wor
ld01
/99
95.4
Ecol
ogic
al a
nd so
cial
resp
onsi
ve in
vest
men
ts. N
egat
ive
crite
ria:
toba
cco,
arm
s, po
rnog
raph
y, g
ambl
ing,
nuc
lear
ene
rgy.
Focu
s GT
Um
wel
ttech
nolo
gie
Focu
sW
orld
12/9
050
.3En
viro
nmen
t frie
ndly
tech
nolo
gies
.Fü
rst F
ugge
r Sus
tain
abili
ty F
und
Fugg
erW
orld
04/0
0--
Inde
x fu
nd, B
ench
mar
k: D
ow Jo
nes S
usta
inab
ility
Gro
up W
orld
inde
xK
D F
onds
Öko
inve
stK
DW
orld
11/9
419
.4En
viro
nmen
t frie
ndly
pro
duct
s or t
echn
olog
ies.
Öko
visi
onÖ
kovi
Wor
ld05
/98
77.6
Ecol
ogic
al a
nd so
cial
crit
eria
. Neg
ativ
e cr
iteria
: arm
s, nu
clea
r ene
rgy,
soci
al/p
oliti
cal/r
acia
l dis
crim
inat
ion,
ani
mal
exp
erim
ents
.O
ppen
heim
Top
ic D
J Sus
tain
a-bi
lity
Wor
ld In
dex
Equi
ties
Opp
enW
orld
02/0
05.
3B
asis
: inv
estm
ent u
nive
rse
of th
e D
ow Jo
nes S
usta
inab
ility
Gro
upW
orld
inde
xPi
ctet
Glo
bal S
ecto
r Wat
er F
und
Pict
etW
orld
04/0
035
8.1
Con
cent
rate
s on
the
sect
ors “
wat
er”
and
“pre
vent
ion
of a
ir po
llutio
n”SA
M S
usta
inab
ility
Inde
x Fu
ndSa
m1
Wor
ld04
/00
39.6
Bas
is: i
nves
tmen
t uni
vers
e of
the
Dow
Jone
s Sus
tain
abili
ty G
roup
Wor
ld in
dex
SAM
Sus
tain
abili
ty P
ione
er F
und
Sam
2W
orld
04/0
011
.2Su
stai
nabi
lity.
Con
cent
rate
s on
smal
l and
mid
cap
sSE
B In
vest
Öko
lux
SEB
Wor
ld10
/92
33.3
Ethi
cal a
nd e
colo
gica
l crit
eria
. Neg
ativ
e cr
iteria
: arm
s, nu
clea
r ene
rgy,
bio-
gene
tics,
anim
al e
xper
imen
ts, a
ddic
tive
drug
s.A
XA
Wor
ld F
unds
II –
Glo
bal
Ethi
cal E
quiti
esA
XA
Wor
ld01
/97
4.6
Ecol
ogic
al a
nd so
cial
crit
eria
.
Sun
Life
Eco
logi
cal P
ortfo
lioSu
nW
orld
10/9
15.
0En
viro
nmen
t frie
ndly
pro
duct
s and
tech
nolo
gies
.Sw
issc
a G
reen
Inve
stSw
issc
aW
orld
12/9
8--
Ecol
ogic
al a
nd so
cial
crit
eria
. Neg
ativ
e cr
iteria
: arm
s, to
bacc
o, fo
ssil
fuel
s, nu
clea
r ene
rgy,
gen
etic
tech
nolo
gy, s
peci
al c
hem
ical
s, et
c.U
BS
Equi
ty F
und
Eco
Perf
orm
ance
UB
SW
orld
07/9
726
1.5
Ecol
ogic
al a
nd so
cial
crit
eria
. Neg
ativ
e cr
iteria
: arm
s, to
bacc
o, n
ucle
aren
ergy
, bio
-gen
etic
s.V
alue
Sar E
quity
SAR
Wor
ld07
/99
68.2
Sust
aina
bilit
y. N
egat
ive
crite
ria: t
obac
co, a
rms,
porn
ogra
phy,
nuc
lear
ener
gy, a
utom
obile
s, bi
o-ge
netic
s, sp
ecia
l che
mic
als.
Not
es: 1 S
tart
date
in th
e Th
omso
n Fi
nanc
ial D
atas
tream
dat
abas
e. 2 M
id-2
002.

28
Tabl
e 2
– U
S Eq
uity
Fun
ds
Nam
eAb
brev
.Re
gion
Star
tD
ate1
Volu
me2
(mn.
US$
)Po
rtfo
lio C
hara
cter
istic
s
Am
ana
Gro
wth
Fun
dA
man
a1U
S08
9517
.5Lo
ng-te
rm c
apita
l gro
wth
con
sist
ent w
ith Is
lam
ic p
rinci
ples
. Neg
ativ
e cr
iteria
:al
coho
l, ga
mbl
ing,
por
nogr
aphy
, non
-isla
mic
ban
ks, e
tc.
Am
ana
Inco
me
Fund
Am
ana2
US
0793
16.4
Like
Am
ana
Gro
wth
fund
, but
80%
inve
sted
in in
com
e-pr
oduc
ing
equi
ties.
Am
eric
an T
rust
Alle
gian
ceA
mer
icU
S12
/98
19.3
Soci
ally
resp
onsi
ble
inve
stm
ents
. Neg
ativ
e cr
iteria
: tob
acco
, alc
ohol
,ga
mbl
ing,
pha
rmac
eutic
al in
dust
ry.
Aqu
inas
Gro
wth
Fun
dA
quin
a1U
S03
/94
50.0
Follo
ws t
he C
atho
lic in
vest
men
t gui
delin
es. N
egat
ive
crite
ria: a
rms,
gend
eran
d ra
ce d
iscr
imin
atio
n, a
borti
on, c
ontra
cept
ion,
por
nogr
aphy
, tob
acco
,sw
eats
hop
labo
r, N
orth
ern
Irel
and,
etc
.A
quin
as In
com
e Fu
ndA
quin
a2U
S03
/94
36.0
Like
Aqu
inas
Gro
wth
fund
, but
inve
sts p
rimar
ily in
inco
me-
prod
ucin
g eq
uitie
s.A
riel G
row
th F
und
Arie
l1U
S01
/90
1132
.2Po
sitiv
e cr
iteria
: Env
ironm
ent,
dive
rsity
. Neg
ativ
e cr
iteria
: Tob
acco
, arm
s,nu
clea
r ene
rgy.
Inve
sts i
n m
ediu
m-s
ized
com
pani
es (m
arke
t cap
. bel
ow $
1.5
bn.).
Arie
l App
reci
atio
n Fu
ndA
riel2
US
08/9
013
84.7
Like
Arie
l Gro
wth
fund
, but
inve
sts i
n m
ediu
m-s
ized
com
pani
es w
ith m
arke
tca
p. b
etw
een
$1 b
n. a
nd $
10 b
n.C
alve
rt C
apita
lA
ccum
ulat
ion
Fund
Cal
vert1
US
11/9
58.
8In
vest
men
t acc
ordi
ng to
the
soci
al c
riter
ia o
f Cal
vert.
No
nega
tive
impa
ct o
nth
e en
viro
nmen
t, po
sitiv
e la
bor r
elat
ions
, pro
duct
ion
of h
ealth
y an
d us
eful
prod
ucts
. Neg
ativ
e cr
iteria
: nuc
lear
ene
rgy,
poo
r lab
or re
latio
ns, s
trong
envi
ronm
enta
l pol
lutio
n, a
rms,
toba
cco,
alc
ohol
, gam
blin
g, e
tc.
Cal
vert
New
Vis
ion
Smal
lC
ap F
und
Cal
vert2
US
02/9
810
8.9
Inve
stm
ent a
ccor
ding
to th
e so
cial
crit
eria
of C
alve
rt (s
ee a
bove
).
Cal
vert
Wor
ld V
alue
Inte
r-na
tiona
l Equ
ityFu
nd A
Cal
vert3
Wor
ld11
/92
129.
9In
vest
men
t acc
ordi
ng to
the
soci
al c
riter
ia o
f Cal
vert
(see
abo
ve).
Inve
stm
ent i
nth
e U
.S. <
5%
Citi
zens
Em
ergi
ngG
row
th F
und
Citi
zen1
US
06/9
416
7.0
Neg
ativ
e cr
iteria
: alc
ohol
, tob
acco
, arm
s, nu
clea
r ene
rgy,
gam
blin
g,un
nece
ssar
y an
imal
test
ing,
no
effe
ctiv
e m
anag
emen
t of e
nviro
nmen
tal
ress
ourc
es, n
o pr
omot
ion
of d
iver
sity
and
equ
al o
ppor
tuni
ty. I
nves
ts p
rimar
ilyin
med
ium
-cap
. com
pani
es.
Citi
zens
Glo
bal E
quity
Fund
Citi
zen2
Wor
ld06
/00
111.
0Se
e ab
ove.
Inve
sts i
n co
mpa
nies
of a
ll si
ze.
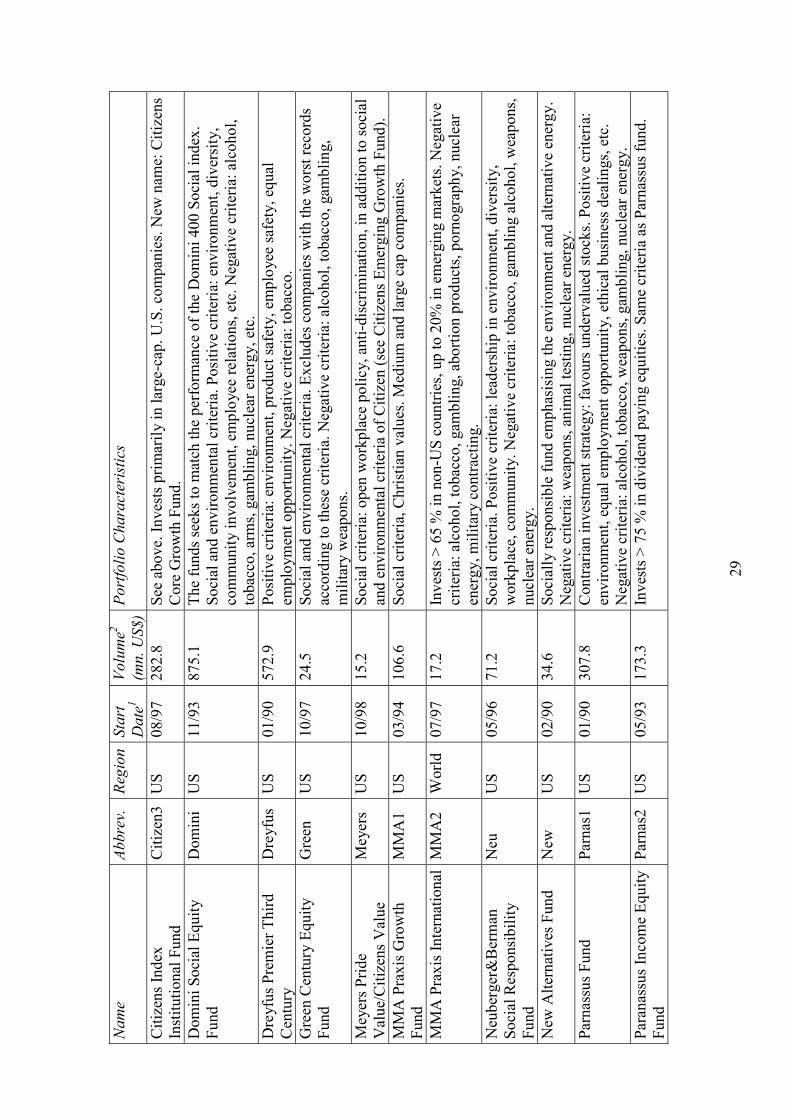
29
Nam
eAb
brev
.Re
gion
Star
tD
ate1
Volu
me2
(mn.
US$
)Po
rtfo
lio C
hara
cter
istic
s
Citi
zens
Inde
xIn
stitu
tiona
l Fun
dC
itize
n3U
S08
/97
282.
8Se
e ab
ove.
Inve
sts p
rimar
ily in
larg
e-ca
p. U
.S. c
ompa
nies
. New
nam
e: C
itize
nsC
ore
Gro
wth
Fun
d.D
omin
i Soc
ial E
quity
Fund
Dom
ini
US
11/9
387
5.1
The
fund
s see
ks to
mat
ch th
e pe
rfor
man
ce o
f the
Dom
ini 4
00 S
ocia
l ind
ex.
Soci
al a
nd e
nviro
nmen
tal c
riter
ia. P
ositi
ve c
riter
ia: e
nviro
nmen
t, di
vers
ity,
com
mun
ity in
volv
emen
t, em
ploy
ee re
latio
ns, e
tc. N
egat
ive
crite
ria: a
lcoh
ol,
toba
cco,
arm
s, ga
mbl
ing,
nuc
lear
ene
rgy,
etc
.D
reyf
us P
rem
ier T
hird
Cen
tury
Dre
yfus
US
01/9
057
2.9
Posi
tive
crite
ria: e
nviro
nmen
t, pr
oduc
t saf
ety,
em
ploy
ee sa
fety
, equ
alem
ploy
men
t opp
ortu
nity
. Neg
ativ
e cr
iteria
: tob
acco
.G
reen
Cen
tury
Equ
ityFu
ndG
reen
US
10/9
724
.5So
cial
and
env
ironm
enta
l crit
eria
. Exc
lude
s com
pani
es w
ith th
e w
orst
reco
rds
acco
rdin
g to
thes
e cr
iteria
. Neg
ativ
e cr
iteria
: alc
ohol
, tob
acco
, gam
blin
g,m
ilita
ry w
eapo
ns.
Mey
ers P
ride
Val
ue/C
itize
ns V
alue
Mey
ers
US
10/9
815
.2So
cial
crit
eria
: ope
n w
orkp
lace
pol
icy,
ant
i-dis
crim
inat
ion,
in a
dditi
on to
soci
alan
d en
viro
nmen
tal c
riter
ia o
f Citi
zen
(see
Citi
zens
Em
ergi
ng G
row
th F
und)
.M
MA
Pra
xis G
row
thFu
ndM
MA
1U
S03
/94
106.
6So
cial
crit
eria
, Chr
istia
n va
lues
. Med
ium
and
larg
e ca
p co
mpa
nies
.
MM
A P
raxi
s Int
erna
tiona
lM
MA
2W
orld
07/9
717
.2In
vest
s > 6
5 %
in n
on-U
S co
untri
es, u
p to
20%
in e
mer
ging
mar
kets
. Neg
ativ
ecr
iteria
: alc
ohol
, tob
acco
, gam
blin
g, a
borti
on p
rodu
cts,
porn
ogra
phy,
nuc
lear
ener
gy, m
ilita
ry c
ontra
ctin
g.N
eube
rger
&B
erm
anSo
cial
Res
pons
ibili
tyFu
nd
Neu
US
05/9
671
.2So
cial
crit
eria
. Pos
itive
crit
eria
: lea
ders
hip
in e
nviro
nmen
t, di
vers
ity,
wor
kpla
ce, c
omm
unity
. Neg
ativ
e cr
iteria
: tob
acco
, gam
blin
g al
coho
l, w
eapo
ns,
nucl
ear e
nerg
y.N
ew A
ltern
ativ
es F
und
New
US
02/9
034
.6So
cial
ly re
spon
sibl
e fu
nd e
mph
asis
ing
the
envi
ronm
ent a
nd a
ltern
ativ
e en
ergy
.N
egat
ive
crite
ria: w
eapo
ns, a
nim
al te
stin
g, n
ucle
ar e
nerg
y.Pa
rnas
sus F
und
Parn
as1
US
01/9
030
7.8
Con
traria
n in
vest
men
t stra
tegy
: fav
ours
und
erva
lued
stoc
ks. P
ositi
ve c
riter
ia:
envi
ronm
ent,
equa
l em
ploy
men
t opp
ortu
nity
, eth
ical
bus
ines
s dea
lings
, etc
.N
egat
ive
crite
ria: a
lcoh
ol, t
obac
co, w
eapo
ns, g
ambl
ing,
nuc
lear
ene
rgy.
Para
nass
us In
com
e Eq
uity
Fund
Parn
as2
US
05/9
317
3.3
Inve
sts >
75
% in
div
iden
d pa
ying
equ
ities
. Sam
e cr
iteria
as P
arna
ssus
fund
.
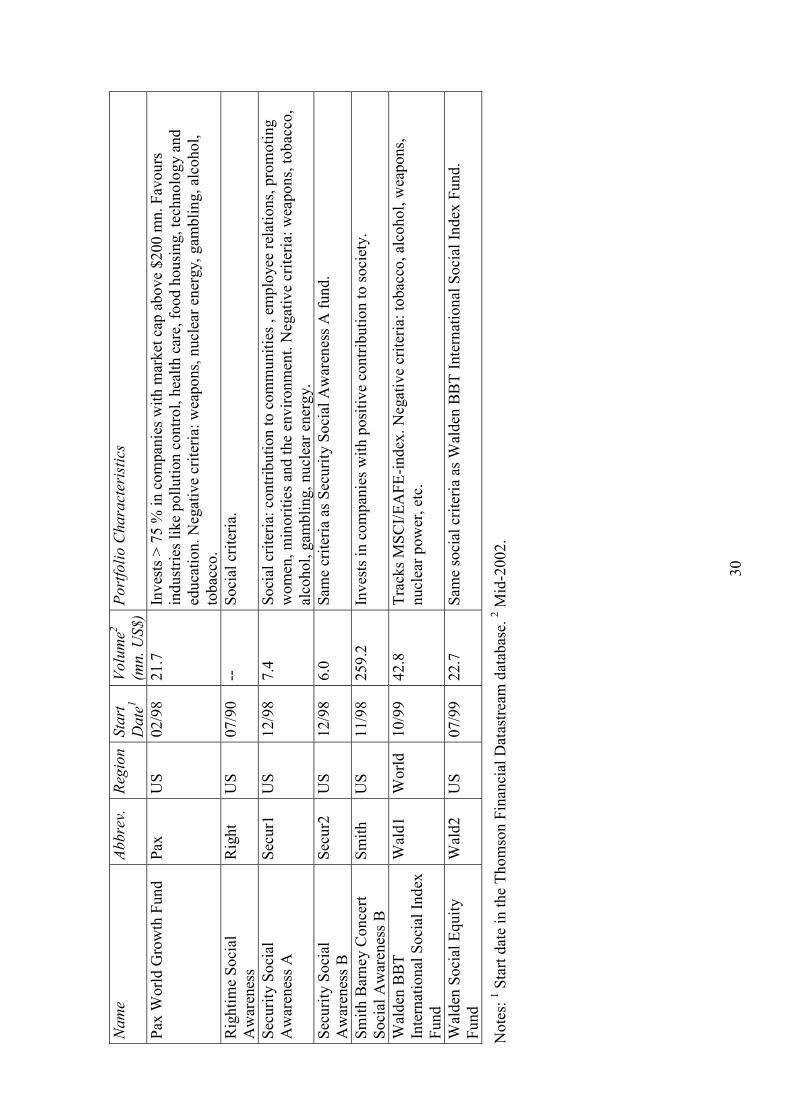
30
Nam
eAb
brev
.Re
gion
Star
tD
ate1
Volu
me2
(mn.
US$
)Po
rtfo
lio C
hara
cter
istic
s
Pax
Wor
ld G
row
th F
und
Pax
US
02/9
821
.7In
vest
s > 7
5 %
in c
ompa
nies
with
mar
ket c
ap a
bove
$20
0 m
n. F
avou
rsin
dust
ries l
ike
pollu
tion
cont
rol,
heal
th c
are,
food
hou
sing
, tec
hnol
ogy
and
educ
atio
n. N
egat
ive
crite
ria: w
eapo
ns, n
ucle
ar e
nerg
y, g
ambl
ing,
alc
ohol
,to
bacc
o.R
ight
ime
Soci
alA
war
enes
sR
ight
US
07/9
0--
Soci
al c
riter
ia.
Secu
rity
Soci
alA
war
enes
s ASe
cur1
US
12/9
87.
4So
cial
crit
eria
: con
tribu
tion
to c
omm
uniti
es ,
empl
oyee
rela
tions
, pro
mot
ing
wom
en, m
inor
ities
and
the
envi
ronm
ent.
Neg
ativ
e cr
iteria
: wea
pons
, tob
acco
,al
coho
l, ga
mbl
ing,
nuc
lear
ene
rgy.
Secu
rity
Soci
alA
war
enes
s BSe
cur2
US
12/9
86.
0Sa
me
crite
ria a
s Sec
urity
Soc
ial A
war
enes
s A fu
nd.
Smith
Bar
ney
Con
cert
Soci
al A
war
enes
s BSm
ithU
S11
/98
259.
2In
vest
s in
com
pani
es w
ith p
ositi
ve c
ontri
butio
n to
soci
ety.
Wal
den
BB
TIn
tern
atio
nal S
ocia
l Ind
exFu
nd
Wal
d1W
orld
10/9
942
.8Tr
acks
MSC
I/EA
FE-in
dex.
Neg
ativ
e cr
iteria
: tob
acco
, alc
ohol
, wea
pons
,nu
clea
r pow
er, e
tc.
Wal
den
Soci
al E
quity
Fund
Wal
d2U
S07
/99
22.7
Sam
e so
cial
crit
eria
as W
alde
n B
BT
Inte
rnat
iona
l Soc
ial I
ndex
Fun
d.
Not
es: 1 S
tart
date
in th
e Th
omso
n Fi
nanc
ial D
atas
tream
dat
abas
e. 2 M
id-2
002.

31
Tabl
e 3
– Eq
uity
Indi
ces
Nam
eAb
brev
.C
ompa
nyRe
gion
Star
tD
ate1
Cha
ract
eris
tics
Cal
vin
Cal
vC
alve
rtU
S06
/00
Con
sist
of l
arge
, US-
base
d so
cial
ly re
spon
sibl
e co
mpa
nies
. Pos
itive
crit
eria
:en
viro
nmen
t, w
orkp
lace
issu
es /
empl
oyee
rela
tions
, goo
d co
mm
unity
rela
tions
.N
egat
ive
crite
ria: w
eapo
ns, t
obac
co, a
lcoh
ol, g
ambl
ing,
por
nogr
aphy
. 637
com
pani
esin
Sep
t. 20
02. T
his n
umbe
r cha
nges
ove
r tim
e.FT
SE4G
ood
Euro
pe 5
0FT
1Fi
nanc
ial
Tim
esEU
02/9
9(0
1/20
01)
Soci
ally
resp
onsi
ble
inve
stm
ents
. Crit
eria
: env
ironm
enta
l sus
tain
abili
ty, p
ositi
vere
latio
nshi
ps w
ith st
akeh
olde
rs, u
nive
rsal
hum
an ri
ghts
. Sta
rting
uni
vers
e: F
TSE
Dev
elop
ed E
urop
e.FT
SE4G
ood
Glo
bal 1
00FT
2Fi
nanc
ial
Tim
esW
orld
08/9
6(0
1/20
01)
Sam
e cr
iteria
as F
TSE4
Goo
d Eu
rope
50.
Sta
rting
uni
vers
e: F
TSE
Dev
elop
ed in
dex.
FTSE
4Goo
dU
S 10
0FT
3Fi
nanc
ial
Tim
esU
S08
/96
(01/
2001
)Sa
me
crite
ria a
s FTS
E4G
ood
Euro
pe 5
0. S
tarti
ng u
nive
rse:
FTS
E D
evel
oped
inde
x fo
rU
SA.
Nat
urak
tien-
inde
x (N
AX
)N
AX
Öko
-In
vest
-V
erla
g
Wor
ld05
/97
Con
sist
s of 2
0 co
mpa
nies
. Env
ironm
enta
l, su
stai
nabi
lity
and
soci
al c
riter
ia. N
egat
ive
crite
ria: w
eapo
ns, d
iscr
imin
atio
n of
wom
en, n
ucle
ar e
nerg
y, to
bacc
o, e
tc.
S&P
500
Envi
ronm
ent
Serv
ices
S&P
Stan
dard
&Po
or´s
US
01/9
5Sp
ecia
l ind
ustri
al se
ctor
inde
x fo
r env
ironm
ent s
ervi
ces i
n th
e U
SA.
Wor
ld –
DS
Envi
ronm
enta
lC
ontro
l
DS
Thom
son
Fina
ncia
lD
atas
tream
Wor
ld01
/90
Spec
ial i
ndus
trial
sect
or in
dex
for e
nviro
nmen
tal c
ontro
l. W
orld
-wid
e co
vera
ge.
DJS
I Wor
ldD
JSI1
Dow
Jone
sW
orld
01/9
4(0
1/19
99)
Maj
or c
riter
ion:
Sus
tain
abilt
y. T
op 1
0 %
of s
usta
inab
le c
ompa
nies
in e
ach
of th
e D
JGI
indu
stry
gro
ups.
DJS
I Sto
xxD
JSI2
Dow
Jone
sEU
01/1
999
Maj
or c
riter
ion:
Sus
tain
abilt
y. T
op 1
0 %
of s
usta
inab
le c
ompa
nies
in e
ach
of th
e D
JST
OX
X 6
00 in
dust
ry g
roup
s.D
omin
i 400
Soci
al In
dex
DSI
KLD
Res
earc
h &
Ana
lytic
s
US
05/9
0So
cial
and
env
ironm
enta
l crit
eria
. E.g
. em
ploy
ee re
latio
ns, d
iver
sity
, env
ironm
ent
frie
ndly
pro
duct
s and
pro
duct
ion
met
hods
.
Not
es: 1 St
art d
ate
in th
e Th
omso
n Fi
nanc
ial D
atas
tream
dat
abas
e. F
igur
es in
bra
cket
s ind
icat
e th
e of
ficia
l lau
nch
date
of t
he in
dex.
Tho
se v
alue
s of
the
inde
x th
at a
re a
vaila
ble
in p
erio
ds b
efor
e th
e of
ficia
l sta
rt da
te h
ave
ther
efor
e be
en c
alcu
late
d ba
ckw
ards
.
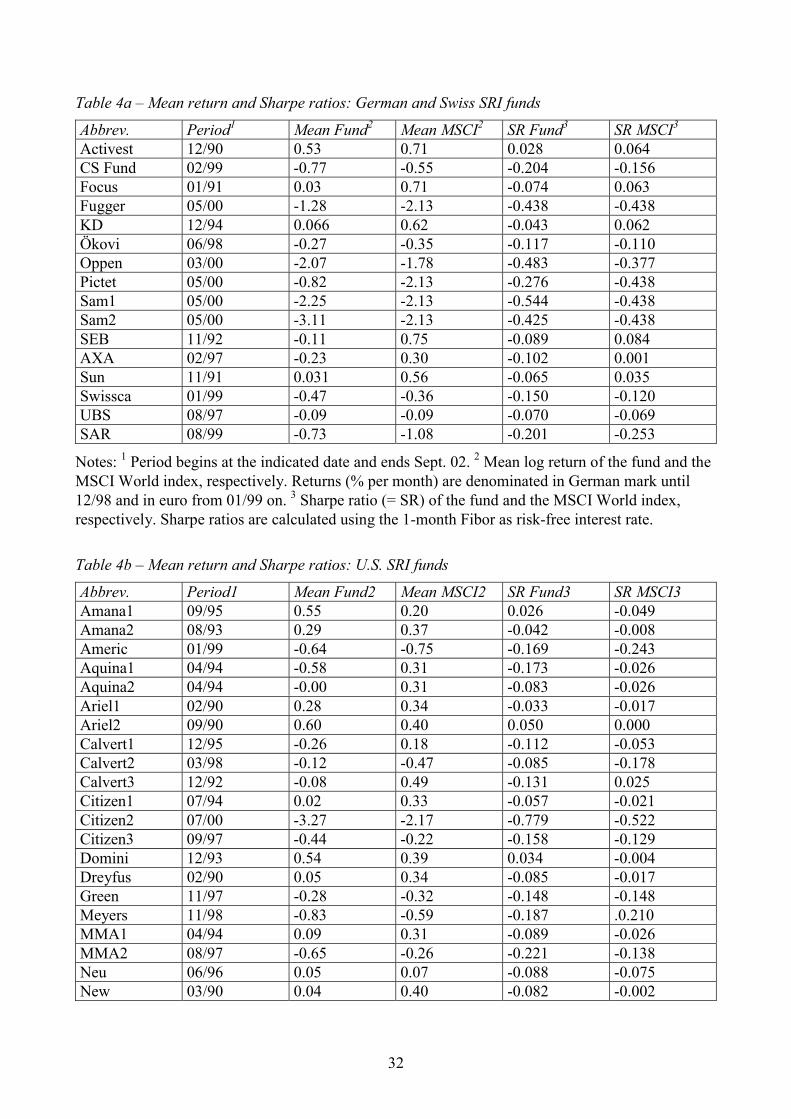
32
Table 4a – Mean return and Sharpe ratios: German and Swiss SRI funds
Abbrev. Period1 Mean Fund2 Mean MSCI2 SR Fund3 SR MSCI3
Activest 12/90 0.53 0.71 0.028 0.064CS Fund 02/99 -0.77 -0.55 -0.204 -0.156Focus 01/91 0.03 0.71 -0.074 0.063Fugger 05/00 -1.28 -2.13 -0.438 -0.438KD 12/94 0.066 0.62 -0.043 0.062Ökovi 06/98 -0.27 -0.35 -0.117 -0.110Oppen 03/00 -2.07 -1.78 -0.483 -0.377Pictet 05/00 -0.82 -2.13 -0.276 -0.438Sam1 05/00 -2.25 -2.13 -0.544 -0.438Sam2 05/00 -3.11 -2.13 -0.425 -0.438SEB 11/92 -0.11 0.75 -0.089 0.084AXA 02/97 -0.23 0.30 -0.102 0.001Sun 11/91 0.031 0.56 -0.065 0.035Swissca 01/99 -0.47 -0.36 -0.150 -0.120UBS 08/97 -0.09 -0.09 -0.070 -0.069SAR 08/99 -0.73 -1.08 -0.201 -0.253
Notes: 1 Period begins at the indicated date and ends Sept. 02. 2 Mean log return of the fund and theMSCI World index, respectively. Returns (% per month) are denominated in German mark until12/98 and in euro from 01/99 on. 3 Sharpe ratio (= SR) of the fund and the MSCI World index,respectively. Sharpe ratios are calculated using the 1-month Fibor as risk-free interest rate.
Table 4b – Mean return and Sharpe ratios: U.S. SRI funds
Abbrev. Period1 Mean Fund2 Mean MSCI2 SR Fund3 SR MSCI3Amana1 09/95 0.55 0.20 0.026 -0.049Amana2 08/93 0.29 0.37 -0.042 -0.008Americ 01/99 -0.64 -0.75 -0.169 -0.243Aquina1 04/94 -0.58 0.31 -0.173 -0.026Aquina2 04/94 -0.00 0.31 -0.083 -0.026Ariel1 02/90 0.28 0.34 -0.033 -0.017Ariel2 09/90 0.60 0.40 0.050 0.000Calvert1 12/95 -0.26 0.18 -0.112 -0.053Calvert2 03/98 -0.12 -0.47 -0.085 -0.178Calvert3 12/92 -0.08 0.49 -0.131 0.025Citizen1 07/94 0.02 0.33 -0.057 -0.021Citizen2 07/00 -3.27 -2.17 -0.779 -0.522Citizen3 09/97 -0.44 -0.22 -0.158 -0.129Domini 12/93 0.54 0.39 0.034 -0.004Dreyfus 02/90 0.05 0.34 -0.085 -0.017Green 11/97 -0.28 -0.32 -0.148 -0.148Meyers 11/98 -0.83 -0.59 -0.187 .0.210MMA1 04/94 0.09 0.31 -0.089 -0.026MMA2 08/97 -0.65 -0.26 -0.221 -0.138Neu 06/96 0.05 0.07 -0.088 -0.075New 03/90 0.04 0.40 -0.082 -0.002
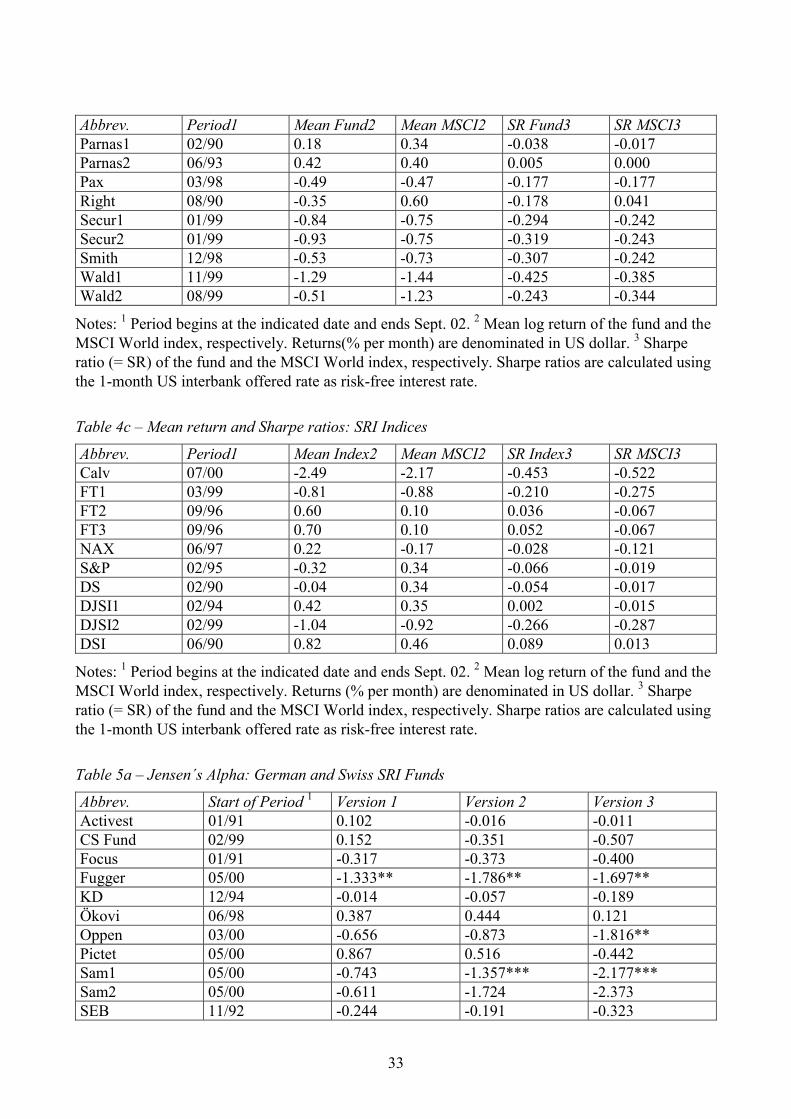
33
Abbrev. Period1 Mean Fund2 Mean MSCI2 SR Fund3 SR MSCI3Parnas1 02/90 0.18 0.34 -0.038 -0.017Parnas2 06/93 0.42 0.40 0.005 0.000Pax 03/98 -0.49 -0.47 -0.177 -0.177Right 08/90 -0.35 0.60 -0.178 0.041Secur1 01/99 -0.84 -0.75 -0.294 -0.242Secur2 01/99 -0.93 -0.75 -0.319 -0.243Smith 12/98 -0.53 -0.73 -0.307 -0.242Wald1 11/99 -1.29 -1.44 -0.425 -0.385Wald2 08/99 -0.51 -1.23 -0.243 -0.344
Notes: 1 Period begins at the indicated date and ends Sept. 02. 2 Mean log return of the fund and theMSCI World index, respectively. Returns(% per month) are denominated in US dollar. 3 Sharperatio (= SR) of the fund and the MSCI World index, respectively. Sharpe ratios are calculated usingthe 1-month US interbank offered rate as risk-free interest rate.
Table 4c – Mean return and Sharpe ratios: SRI Indices
Abbrev. Period1 Mean Index2 Mean MSCI2 SR Index3 SR MSCI3Calv 07/00 -2.49 -2.17 -0.453 -0.522FT1 03/99 -0.81 -0.88 -0.210 -0.275FT2 09/96 0.60 0.10 0.036 -0.067FT3 09/96 0.70 0.10 0.052 -0.067NAX 06/97 0.22 -0.17 -0.028 -0.121S&P 02/95 -0.32 0.34 -0.066 -0.019DS 02/90 -0.04 0.34 -0.054 -0.017DJSI1 02/94 0.42 0.35 0.002 -0.015DJSI2 02/99 -1.04 -0.92 -0.266 -0.287DSI 06/90 0.82 0.46 0.089 0.013
Notes: 1 Period begins at the indicated date and ends Sept. 02. 2 Mean log return of the fund and theMSCI World index, respectively. Returns (% per month) are denominated in US dollar. 3 Sharperatio (= SR) of the fund and the MSCI World index, respectively. Sharpe ratios are calculated usingthe 1-month US interbank offered rate as risk-free interest rate.
Table 5a – Jensen´s Alpha: German and Swiss SRI Funds
Abbrev. Start of Period 1 Version 1 Version 2 Version 3Activest 01/91 0.102 -0.016 -0.011CS Fund 02/99 0.152 -0.351 -0.507Focus 01/91 -0.317 -0.373 -0.400Fugger 05/00 -1.333** -1.786** -1.697**KD 12/94 -0.014 -0.057 -0.189Ökovi 06/98 0.387 0.444 0.121Oppen 03/00 -0.656 -0.873 -1.816**Pictet 05/00 0.867 0.516 -0.442Sam1 05/00 -0.743 -1.357*** -2.177***Sam2 05/00 -0.611 -1.724 -2.373SEB 11/92 -0.244 -0.191 -0.323
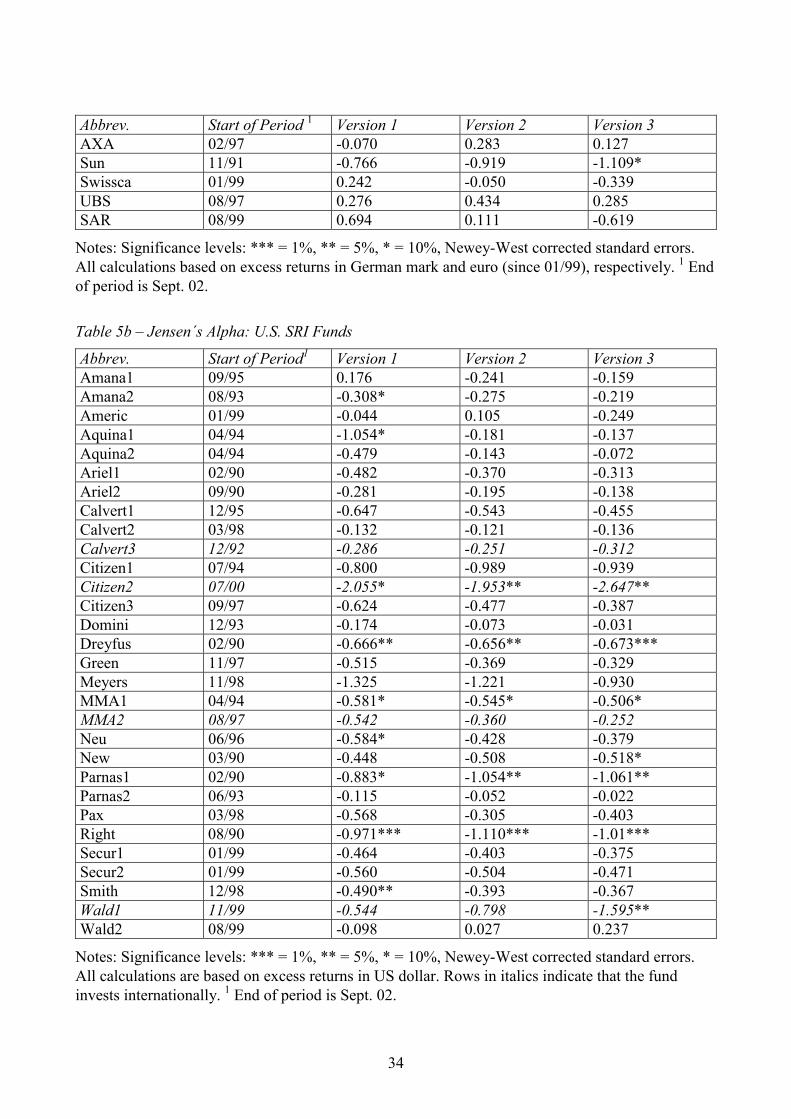
34
Abbrev. Start of Period 1 Version 1 Version 2 Version 3AXA 02/97 -0.070 0.283 0.127Sun 11/91 -0.766 -0.919 -1.109*Swissca 01/99 0.242 -0.050 -0.339UBS 08/97 0.276 0.434 0.285SAR 08/99 0.694 0.111 -0.619
Notes: Significance levels: *** = 1%, ** = 5%, * = 10%, Newey-West corrected standard errors.All calculations based on excess returns in German mark and euro (since 01/99), respectively. 1 Endof period is Sept. 02.
Table 5b – Jensen´s Alpha: U.S. SRI Funds
Abbrev. Start of Period1 Version 1 Version 2 Version 3Amana1 09/95 0.176 -0.241 -0.159Amana2 08/93 -0.308* -0.275 -0.219Americ 01/99 -0.044 0.105 -0.249Aquina1 04/94 -1.054* -0.181 -0.137Aquina2 04/94 -0.479 -0.143 -0.072Ariel1 02/90 -0.482 -0.370 -0.313Ariel2 09/90 -0.281 -0.195 -0.138Calvert1 12/95 -0.647 -0.543 -0.455Calvert2 03/98 -0.132 -0.121 -0.136Calvert3 12/92 -0.286 -0.251 -0.312Citizen1 07/94 -0.800 -0.989 -0.939Citizen2 07/00 -2.055* -1.953** -2.647**Citizen3 09/97 -0.624 -0.477 -0.387Domini 12/93 -0.174 -0.073 -0.031Dreyfus 02/90 -0.666** -0.656** -0.673***Green 11/97 -0.515 -0.369 -0.329Meyers 11/98 -1.325 -1.221 -0.930MMA1 04/94 -0.581* -0.545* -0.506*MMA2 08/97 -0.542 -0.360 -0.252Neu 06/96 -0.584* -0.428 -0.379New 03/90 -0.448 -0.508 -0.518*Parnas1 02/90 -0.883* -1.054** -1.061**Parnas2 06/93 -0.115 -0.052 -0.022Pax 03/98 -0.568 -0.305 -0.403Right 08/90 -0.971*** -1.110*** -1.01***Secur1 01/99 -0.464 -0.403 -0.375Secur2 01/99 -0.560 -0.504 -0.471Smith 12/98 -0.490** -0.393 -0.367Wald1 11/99 -0.544 -0.798 -1.595**Wald2 08/99 -0.098 0.027 0.237
Notes: Significance levels: *** = 1%, ** = 5%, * = 10%, Newey-West corrected standard errors.All calculations are based on excess returns in US dollar. Rows in italics indicate that the fundinvests internationally. 1 End of period is Sept. 02.

35
Table 5c – Jensen´s Alpha: SRI Indices
Abbrev. Start of Period1 Version 1 Version 2Calv 07/00 -1.922* -1.876***FT1 03/99 -1.258* (-2.889**)2 -1.047 (-2.165***)2
FT2 09/96 0.318 (-0.231)2 0.246 (-0.090)2
FT3 09/96 0.212 (-0.168)2 0.211 (-0.081)2
NAX 06/97 0.363 0.353S&P 02/95 -0.830 -0.839DS 02/90 -0.427 -0.422DJSI1 02/94 0.073 (-0.492)2 0.129 (-0.784*)2
DJSI2 02/99 -0.271 0.002DSI 06/90 0.276 0.224
Notes: Significance levels: *** = 1%, ** = 5%, * = 10%, Newey-West corrected standard errors.All calculations are based on excess returns in US dollar. 1 End of period is Sept. 02, 2 Results inbrackets: This period begins at the date of the start of the index family which is 01/2001 for theFTSE4Good-indices and 01/99 for the DJSI-indices. For the months before, these indices have beencalculated backwards.
Table 6a – Impact of Blue Chips, Small Caps and Timing Capabilities: German and Swiss SRIFunds (= Model Version 3)
Abbrev. Blue ChipIndex
BC IndexSquared
Small CapIndex
SC IndexSquared
R2
Activest 0.298*** -0.011** 0.379*** 0.005 0.586CS Fund 0.248** -0.004 0.445*** -0.010* 0.589Focus 0.299*** -0.014* 0.415*** 0.002 0.416Fugger 0.140 0.044*** 0.348*** -0.017 0.298KD 0.317*** -0.021*** 0.459*** 0.003 0.536Ökovi 0.162** -0.023*** 0.327*** -0.0008 0.494Oppen 0.430*** 0.004 0.286*** -0.009 0.609Pictet 0.009 0.261* -0.024** -0.011 0.475Sam1 0.292** 0.006 0.402*** -0.006 0.645Sam2 0.188 -0.014 0.677** 0.001 0.389SEB 0.261*** -0.022*** 0.465*** -0.0023 0.527AXA 0.284*** -0.017** 0.336*** -0.008* 0.541Sun 0.242*** 0.009 0.553*** 0.008 0.402Swissca 0.395*** 0.0006 0.339*** -0.013* 0.628UBS 0.416*** -0.016*** 0.378*** -0.002 0.692SAR 0.359*** -0.018 0.328*** 0.001 0.635
Notes: Significance levels: *** = 1%, ** = 5%, * = 10%, Newey-West corrected standard errors.All calculations are based on excess returns in German mark and euro (since 01/99), respectively.See also the notes of table 5a.

36
Table 6b – Impact of Blue Chips, Small Caps and Timing Capabilities: U.S. SRI Funds(= Model Version 3)
Abbrev. Blue ChipIndex
BC IndexSquared
Small CapIndex
SC IndexSquared
R2
Amana1 0.575*** -0.007 0.361*** 0.009*** 0.574Amana2 0.341*** 0.006 0.118*** -0.003 0.481Americ 0.662*** -0.002 0.300*** -0.008** 0.535Aquina1 0.225* 0.014 0.313** -0.036* 0.436Aquina2 0.635*** -0.005 -0.077 -0.011* 0.324Ariel1 0.517*** 0.011 0.026 -0.006 0.296Ariel2 0.511*** 0.016* 0.065 -0.004 0.395Calvert1 0.715*** -0.004 0.165* -0.005 0.471Calvert2 0.558*** 0.009 0.311*** -0.002 0.441Calvert3 0.289*** -0.015 0.326*** -0.002 0.450Citizen1 0.761*** 0.007 0.324*** 0.0016 0.415Citizen2 0.396** 0.019 0.186 -0.029 0.364Citizen3 0.792*** 0.008 0.133** -0.004 0.676Domini 0.683*** 0.006 0.094** -0.005* 0.746Dreyfus 0.676*** 0.000 0.159*** -0.001 0.604Green 0.725*** 0.010** 0.099* -0.004 0.731Meyers 0.762*** 0.030*** 0.254*** -0.005 0.452MMA1 0.529*** 0.005 0.109** -0.003 0.568MMA2 0.267*** -0.014 0.387*** -0.000 0.417Neu 0.578*** 0.009 0.095** -0.005 0.630New 0.364*** -0.009 0.334*** 0.000 0.397Parnas1 0.747*** 0.010 0.317*** 0.007 0.453Parnas2 0.431*** 0.000 0.034 -0.003 0.407Pax 0.630*** 0.011 0.217** -0.007* 0.640Right 0.524*** -0.009 -0.068 0.008 0.224Secur1 0.610*** -0.003 0.126** -0.003 0.642Secur2 0.606*** -0.003 0.124** -0.003 0.640Smith 0.502*** 0.003 0.083** -0.003 0.752Wald1 0.228*** 0.001 0.337*** -0.007 0.505Wald2 0.652*** 0.015 0.087 -0.004 0.603
Notes: Significance levels: *** = 1%, ** = 5%, * = 10%, Newey-West corrected standard errors.All calculations are based on excess returns in U.S. dollar. Rows in italics indicate that the fundinvests internationally. See also the notes of table 5b.

37
Table 6c – Impact of Blue Chips and Small Caps: SRI Indices(= Model Version 2)
Abbrev. Blue Chip Index Small Cap Index R2
Calv 0.007 0.554*** 0.467FT1 -0.377*** 0.827*** 0.341FT2 1.022*** -0.277*** 0.606FT3 0.917*** 0.055 0.738NAX 0.482*** 0.330** 0.391S&P 0.101 0.210 0.001DS 0.437*** -0.088 0.030DJSI1 0.425*** 0.474*** 0.549DJSI2 1.447*** -0.631*** 0.503DSI 0.158* 0.292*** 0.193
Notes: Significance levels: *** = 1%, ** = 5%, * = 10%, Newey-West corrected standard errors.All calculations are based on excess returns in US dollar. See also the notes of table 5c.
Table 7a – Factor Sensitivities: German and Swiss SRI Funds
Abbrev. Unexpected FactorActivest +4***CS Fund --Focus +4**Fugger +2**, +6***, +7**KD --Ökovi +6**Oppen +6**Pictet +2**, +4***, +6***Sam1 +2**, +3***Sam2 +2***+3***SEB +2**AXA +2**, +4**, +6***Sun --Swissca +6***, +7**UBS +1**, +4**, +6***SAR +1**, +5**, +6***
Notes: Significance levels: *** = 1%, ** = 5%, Newey-West corrected standard errors. Allcalculations are based on excess returns in German mark and euro (since 01/99), respectively.Example: +4*** e.g. means that factor no. 4 is significantly positive at the 1% level.
Table 7b – Factor Sensitivities: U.S. SRI Funds
Abbrev. Unexpected FactorAmana1 --Amana2 +7**Americ +7**Aquina1 --Aquina2 --Ariel1 +4**Ariel2 +4***, -8**, -11**
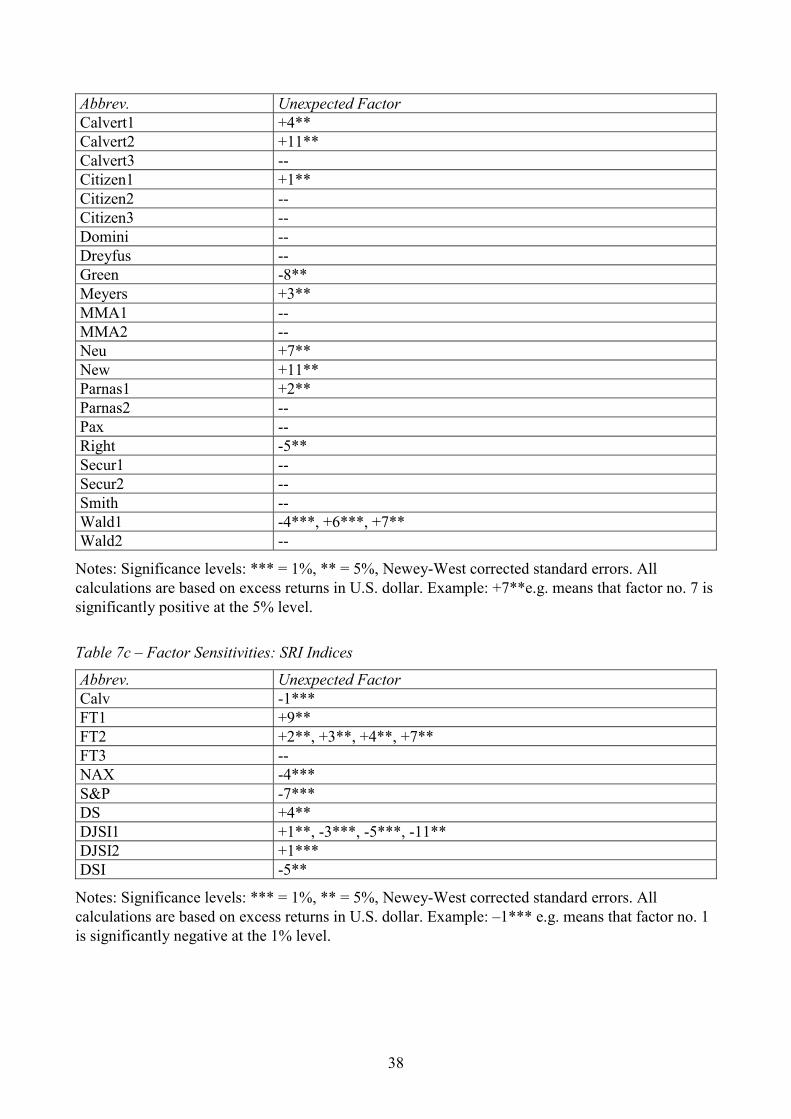
38
Abbrev. Unexpected FactorCalvert1 +4**Calvert2 +11**Calvert3 --Citizen1 +1**Citizen2 --Citizen3 --Domini --Dreyfus --Green -8**Meyers +3**MMA1 --MMA2 --Neu +7**New +11**Parnas1 +2**Parnas2 --Pax --Right -5**Secur1 --Secur2 --Smith --Wald1 -4***, +6***, +7**Wald2 --
Notes: Significance levels: *** = 1%, ** = 5%, Newey-West corrected standard errors. Allcalculations are based on excess returns in U.S. dollar. Example: +7**e.g. means that factor no. 7 issignificantly positive at the 5% level.
Table 7c – Factor Sensitivities: SRI Indices
Abbrev. Unexpected FactorCalv -1***FT1 +9**FT2 +2**, +3**, +4**, +7**FT3 --NAX -4***S&P -7***DS +4**DJSI1 +1**, -3***, -5***, -11**DJSI2 +1***DSI -5**
Notes: Significance levels: *** = 1%, ** = 5%, Newey-West corrected standard errors. Allcalculations are based on excess returns in U.S. dollar. Example: –1*** e.g. means that factor no. 1is significantly negative at the 1% level.

39
Tabl
e 8a
– In
vest
men
t Sty
le -
Sect
ors:
Ger
man
and
Sw
iss S
RI F
unds
Abbr
ev.
We1
We2
We3
We4
We5
We6
We7
We8
We9
We1
0SC
R2
Act
ives
t0
00
00.
0701
0.14
620.
1801
00.
2033
00.
4003
0.78
0C
S Fu
nd0
00
00.
0587
0.22
640.
1641
0.05
420
00.
4965
0.72
1Fo
cus
00
00
0.12
410
0.10
350
0.35
850
0.41
400.
556
Fugg
er0.
1402
00
00
0.12
870.
3146
00.
0528
00.
3637
0.48
4K
D0
00
00.
0845
0.09
800.
3104
00.
0605
00.
4466
0.74
3Ö
kovi
00
00
00.
0262
0.14
820
0.33
490.
1880
0.30
270.
731
Opp
en0
00
00.
0422
0.25
070.
2885
00
00.
4186
0.78
2Pi
ctet
0.12
100.
0190
00
00.
3642
0.07
710
0.06
410
0.35
470.
706
Sam
10
00
00.
0205
0.25
640.
2326
00
00.
4905
0.87
5Sa
m2
00
00
0.26
060
0.09
440
0.11
380
0.53
110.
787
SEB
00
00
0.08
350.
0963
0.27
490.
1026
00
0.44
260.
744
AX
A0
00
00.
0358
00.
1451
00.
2318
0.20
960.
3777
0.72
4Su
n0.
1876
00
00.
0358
0.03
170.
1639
0.12
750
0.45
350.
587
Swis
sca
00
00
0.01
520.
2357
0.31
650
0.05
610.
3706
0.83
6U
BS
00
00.
0524
0.05
040.
1673
0.25
680
0.02
760.
0118
0.43
370.
864
SAR
00
00
0.03
900.
1816
0.22
860
0.15
960.
3912
0.83
6
Not
es: C
olum
ns 2
to 1
1 sh
ow th
e w
eigh
tings
of t
he 1
0 se
ctor
al b
lue-
chip
indi
ces i
n th
e fa
ctor
-mim
icki
ng p
ortfo
lio. F
acto
r no.
11
is a
smal
l cap
inde
x(S
C).
All
retu
rns a
re c
alcu
late
d in
Ger
man
mar
k an
d eu
ro (s
ince
01/
99),
resp
ectiv
ely.
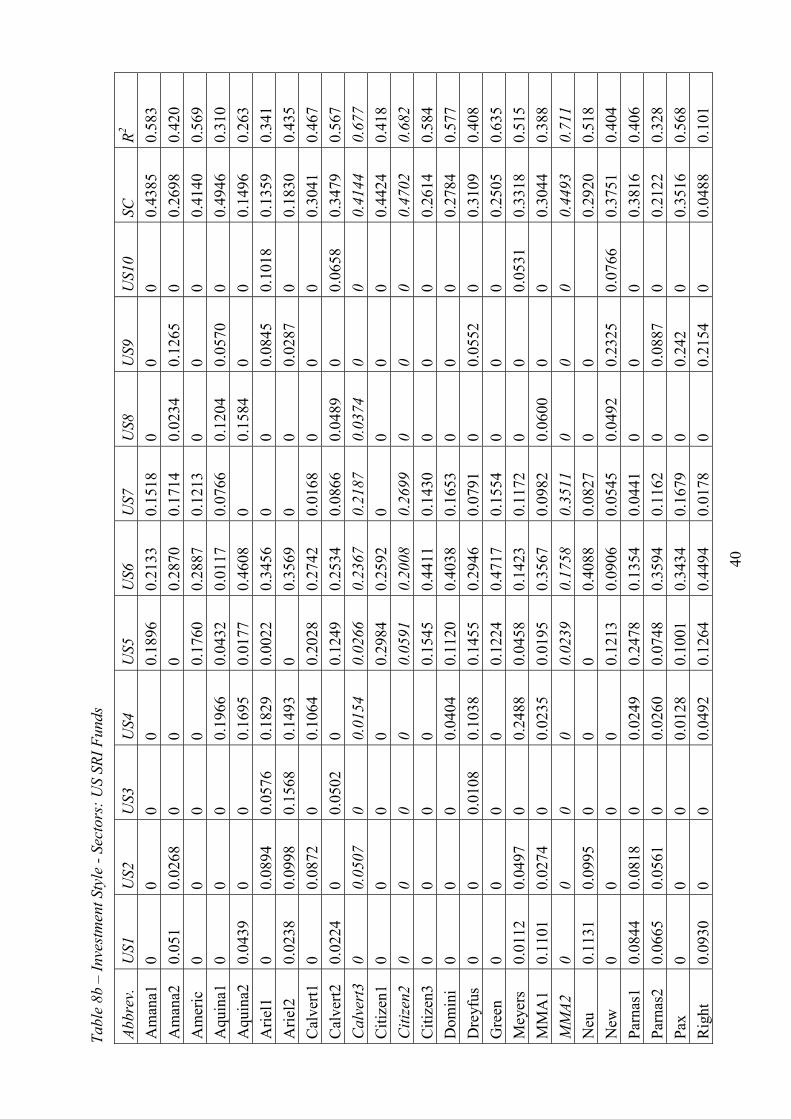
40
Tabl
e 8b
– In
vest
men
t Sty
le -
Sect
ors:
US
SRI F
unds
Abbr
ev.
US1
US2
US3
US4
US5
US6
US7
US8
US9
US1
0SC
R2
Am
ana1
00
00
0.18
960.
2133
0.15
180
00
0.43
850.
583
Am
ana2
0.05
10.
0268
00
00.
2870
0.17
140.
0234
0.12
650
0.26
980.
420
Am
eric
00
00
0.17
600.
2887
0.12
130
00
0.41
400.
569
Aqu
ina1
00
00.
1966
0.04
320.
0117
0.07
660.
1204
0.05
700
0.49
460.
310
Aqu
ina2
0.04
390
00.
1695
0.01
770.
4608
00.
1584
00
0.14
960.
263
Arie
l10
0.08
940.
0576
0.18
290.
0022
0.34
560
00.
0845
0.10
180.
1359
0.34
1A
riel2
0.02
380.
0998
0.15
680.
1493
00.
3569
00
0.02
870
0.18
300.
435
Cal
vert1
00.
0872
00.
1064
0.20
280.
2742
0.01
680
00
0.30
410.
467
Cal
vert2
0.02
240
0.05
020
0.12
490.
2534
0.08
660.
0489
00.
0658
0.34
790.
567
Cal
vert
30
0.05
070
0.01
540.
0266
0.23
670.
2187
0.03
740
00.
4144
0.67
7C
itize
n10
00
00.
2984
0.25
920
00
00.
4424
0.41
8C
itize
n20
00
00.
0591
0.20
080.
2699
00
00.
4702
0.68
2C
itize
n30
00
00.
1545
0.44
110.
1430
00
00.
2614
0.58
4D
omin
i0
00
0.04
040.
1120
0.40
380.
1653
00
00.
2784
0.57
7D
reyf
us0
00.
0108
0.10
380.
1455
0.29
460.
0791
00.
0552
00.
3109
0.40
8G
reen
00
00
0.12
240.
4717
0.15
540
00
0.25
050.
635
Mey
ers
0.01
120.
0497
00.
2488
0.04
580.
1423
0.11
720
00.
0531
0.33
180.
515
MM
A1
0.11
010.
0274
00.
0235
0.01
950.
3567
0.09
820.
0600
00
0.30
440.
388
MM
A20
00
00.
0239
0.17
580.
3511
00
00.
4493
0.71
1N
eu0.
1131
0.09
950
00
0.40
880.
0827
00
0.29
200.
518
New
00
00
0.12
130.
0906
0.05
450.
0492
0.23
250.
0766
0.37
510.
404
Parn
as1
0.08
440.
0818
00.
0249
0.24
780.
1354
0.04
410
00
0.38
160.
406
Parn
as2
0.06
650.
0561
00.
0260
0.07
480.
3594
0.11
620
0.08
870
0.21
220.
328
Pax
00
00.
0128
0.10
010.
3434
0.16
790
0.24
20
0.35
160.
568
Rig
ht0.
0930
00
0.04
920.
1264
0.44
940.
0178
00.
2154
00.
0488
0.10
1

41
Abbr
ev.
US1
US2
US3
US4
US5
US6
US7
US8
US9
US1
0SC
R2
Secu
r10
00
0.03
600.
0869
0.39
050.
1955
00
00.
2911
0.54
9Se
cur2
00
00.
0440
0.08
410.
3913
0.19
250
00
0.28
810.
550
Smith
0.02
970
00.
0839
0.03
650.
3991
0.18
050
00
0.27
050.
626
Wal
d10
00
00
0.22
150.
2750
00.
0986
00.
4049
0.69
8W
ald2
0.06
980
00.
0569
0.02
620.
3853
0.18
240
00
0.27
930.
510
Not
es: C
olum
ns 2
to 1
1 sh
ow th
e w
eigh
tings
of t
he 1
0 se
ctor
al in
dice
s in
the
fact
or-m
imic
king
por
tfolio
. Fac
tor n
o. 1
1 is
a sm
all c
ap-in
dex
(SC
). Th
e 4
row
s in
italic
s ind
icat
e fu
nds w
ith w
orld
-wid
e di
vers
ifica
tion,
all
othe
r fun
ds in
vest
onl
y in
the
Uni
ted
Stat
es. A
ll re
turn
s are
cal
cula
ted
in U
S do
llar.
Tabl
e 8c
– In
vest
men
t Sty
le -
Sect
ors:
SRI
Indi
ces
Abbr
ev.
S1S2
S3S4
S5S6
S7S8
S9S1
0SC
R2Sp
an.
Cal
v0
00
0.11
150
0.28
130
00
00.
6073
0.46
4R
ej. *
**FT
10
00
0.35
050.
1496
0.21
620.
0835
0.20
020
00
0.95
3R
ej.*
*FT
20
0.11
610
0.24
070.
1914
0.23
880.
2130
00
00
0.95
0N
ot re
j.FT
30.
0306
0.08
480.
1028
0.09
760.
2473
0.28
210.
1487
00
00
0.93
0N
ot re
j.N
AX0
00
00
00.
0559
0.04
440.
1714
00.
7284
0.33
2Re
j. *
S&P
0.23
030.
1156
00
00.
3120
00
00
0.34
200.
023
Rej
. **
DS
0.24
550
0.14
320
00.
4771
00.
1195
00
0.01
480.
163
Not
rej.
DJS
I10
00
00
0.13
700.
0572
00.
0536
00.
7521
0.49
3N
ot re
j.D
JSI2
0.0
00
00.
1309
00
0.14
360
0.72
550.
385
Rej
. ***
DSI
00
00
00.
1718
0.13
770
0.24
850
0.44
190.
135
Rej
. ***
Not
es: C
olum
ns 2
to 1
1 sh
ow th
e w
eigh
tings
of t
he 1
0 se
ctor
al in
dice
s in
the
fact
or-m
imic
king
por
tfolio
. Fac
tor n
o. 1
1 is
a sm
all c
ap-in
dex
(SC
).Th
e 4
row
s in
italic
s ind
icat
e in
dice
s with
a w
orld
-wid
e di
vers
ifica
tion,
the
2 ro
ws w
ith u
nder
lined
figu
res t
hose
whi
ch c
once
ntra
te o
n Eu
rope
anst
ocks
. The
oth
er 4
row
s are
U.S
. ind
ices
. The
last
col
umn
“Spa
n.”
indi
cate
s if t
he sp
anni
ng te
st is
reje
cted
at t
he si
gnifi
canc
e le
vels
:**
* =
1%, *
* =
5%, *
= 1
0% .
All
retu
rns a
re c
alcu
late
d in
U.S
. dol
lar.

42
Table 9a – Investment Style - Regions: German and Swiss SRI Funds
Abbrev. R1 R2 R3 SC R2
Activest 0.2737 0.2189 0.0735 0.4340 0.737CS Fund 0.5529 0 0.0685 0.3787 0.756Focus 0.3522 0.1957 0.0042 0.4479 0.517Fugger 0.3307 0 0.3699 0.2994 0.445KD 0.455 0.1377 0.0015 0.4053 0.685Ökovi 0.5504 0 0.1127 0.3369 0.667Oppen 0.6253 0.0963 0.0441 0.2343 0.892Pictet 0.6194 0.0537 0.0653 0.2616 0.556Sam1 0.5195 0.0906 0.0863 0.3036 0.885Sam2 0 0.4939 0.0490 0.4571 0.628SEB 0.3411 0.2480 0.0191 0.3918 0.705AXA 0.5585 0.0614 0.0032 0.3741 0.717Sun 0.0439 0.1414 0.3145 0.5000 0.549Swissca 0.5800 0.1654 0.0129 0.2420 0.893UBS 0.3870 0.222 0.0363 0.3552 0.885SAR 0.4258 0.1160 0.1064 0.3016 0.854
Notes: Columns 2 to 4 show the weightings of the 3 regional indices in the factor-mimickingportfolio. Factor no. 4 is a small cap-index (SC). All returns are calculated in German mark andeuro (since 01/99), respectively.
Table 9b – Investment Style - Regions: US SRI Funds (world-wide diversification)
Abbrev. R1 R2 R3 SC R2
Calvert3 0.4072 0.2089 0.1729 0.2110 0.510Citizen2 0.2739 0.5908 0.1282 0.0071 0.731MMA2 0.5878 0 0.1926 0.2196 0.538Wald1 0.7153 0 0.1979 0.0868 0.689
Notes: Columns 2 to 4 show the weightings of the 3 regional indices in the factor-mimickingportfolio. Factor no. 4 is a small cap-index (SC). All Returns are calculated in U.S. dollar.
Table 9c – Investment Style - Regions: Indices (world-wide diversification)
Abbrev. R1 R2 R3 SC R2 Span.FT2 0.2103 0.6030 0.1867 0 0.655 Rej. *NAX 0.2440 0 0 0.7560 0.337 Rej. ***DS 0.2328 0.6774 0 0.0898 0.1006 Rej. *DJSI1 0.2502 0.0178 0 0.7320 0.515 Rej. ***
Notes: Columns 2 to 4 show the weightings of the 3 regional indices in the factor-mimickingportfolio. Factor no. 4 is a small cap-index (SC). The last column “Span.” indicates if the spanningtest is rejected at the significance levels: *** = 1%, ** = 5%, * = 10% . All returns are calculated inU.S. dollar.