Extraction, separation and identification of compounds from...
43
IJISET - International Journal of Innovative Science, Engineering & Technology, Vol. 3 Issue 10, October 2016 ISSN (Online) 2348 – 7968 | Impact Factor (2015) - 4.332 www.ijiset.com 273 Extraction, separation and identification of compounds from leaves of Lycium schweinfurthii var.schweinfurthii (Solanaceae) Emad A. Ewais1, Mohamed M. Abd El-Maboud2, Mohammed H.Elhaw1 and Muhammad I. Haggag1* 1. Botany and Microbiology Department, Faculty of Science, Al-Azhar University, Nasr city, Cairo, Egypt 2. Ecology and Range Management Department, Desert Research Center, Cairo, Egypt ABSTRACT Aim of the present study was to identify some phenolic compounds isolated from the dried powder leaves of Lycium schweinfurthii var.schweinfurthii (Solanaceae family) collected from alkom alakhdar islet, alborolos lake in egypt. The investigation of phenolic compounds in L. schweinfurthii var. schweinfurthii leaves by different chromatographic methods of separation showed the presence of Naringrnin ,3-hydroxy-3\,4\ methoxy flavone, 7-hydroxy flavone, vitexin and Hisperitine-7-rutinoside. The structures of these flavonoids were characterized on the basis of their, UV, NMR and MS spectroscopic data. Key words: Lycium schweinfurthii ,Solanaceae, Flavonoids and Phytochemical. Introduction The Solanaceae, or nightshades are plant family contains about 94 genera (Hepper, 1998) and comprises more than 3000 species (Quattrocchi, 2000), herbs, shrubs or small trees. The chief centers of distribution are Central and South America, but it is generally distributed in tropical and temperate regions all over the world (Hepper, 1998; Quattrocchi, 2000). The nightshade family is certainly one of most economically important plant families as food (e.g. potato and tomato genus), medicine (e.g. Atropa Belladonna), ornaments (e.g. Physalis Alkekengi), and several noxious weeds (Siddiqi, 1978; Hickey and King, 1981; Hussein, 1985). The family contains a wide range of alkaloids which are of great taxonomic interest. Types of alkaloid recorded are tropane, alkaloidal amine indole, isoquinoline, purine, pyrazole, pyridine, pyrroli-dine, quinazolizidine, steroid alkaloids and glycoalkaloids. Other constituents include steroidal saponins, coumarins, flavones, carotenoids and anthraquinones (Evans, 2002). The genus of Lycium is one of the most important genera of family Solanaceae which has been the source of many active constituents. So we interest to choose Lycium schweinfurthii var. schweinfurthii which belongs to family Solanaceae. MATERIALS AND METHODS 1.Plant Material The fresh roots,stem,leaves and flowers were collected in February, 2014 from alkom alakhdar islet, alborolos lake in egypt . They were washed, air-dried at
Transcript of Extraction, separation and identification of compounds from...

IJISET - International Journal of Innovative Science, Engineering & Technology, Vol. 3 Issue 10, October 2016
ISSN (Online) 2348 – 7968 | Impact Factor (2015) - 4.332
www.ijiset.com
273
Extraction, separation and identification of compounds from leaves of Lycium schweinfurthii
var.schweinfurthii (Solanaceae) Emad A. Ewais1, Mohamed M. Abd El-Maboud2, Mohammed H.Elhaw1 and Muhammad I.
Haggag1* 1. Botany and Microbiology Department, Faculty of Science, Al-Azhar University, Nasr city, Cairo, Egypt 2. Ecology and Range Management Department, Desert Research Center, Cairo, Egypt
UABSTRACT Aim of the present study was to identify some phenolic compounds isolated from the dried powder leaves of Lycium schweinfurthii var.schweinfurthii (Solanaceae family) collected from alkom alakhdar islet, alborolos lake in egypt. The investigation of phenolic compounds in L. schweinfurthii var. schweinfurthii leaves by different chromatographic methods of separation showed the presence of
Naringrnin ,3-hydroxy-3\,4\ methoxy flavone,
7-hydroxy flavone, vitexin and Hisperitine-7-rutinoside. The structures of these flavonoids were characterized on the basis of their, UV, NMR and MS
spectroscopic data.
Key words: Lycium schweinfurthii ,Solanaceae, Flavonoids and Phytochemical.
UIntroduction
The Solanaceae, or nightshades are plant family contains about 94 genera (Hepper, 1998) and comprises more than 3000 species (Quattrocchi, 2000), herbs, shrubs or small trees. The chief centers of distribution are Central and South America, but it is generally distributed in tropical and temperate regions all over the world (Hepper, 1998; Quattrocchi, 2000). The nightshade family is certainly one of most economically important plant families as food (e.g. potato and tomato genus), medicine (e.g. Atropa Belladonna), ornaments (e.g. Physalis Alkekengi), and several noxious weeds (Siddiqi, 1978; Hickey and King, 1981; Hussein, 1985). The family contains a wide range of alkaloids which are of great taxonomic interest. Types of alkaloid recorded are tropane, alkaloidal amine indole, isoquinoline, purine, pyrazole, pyridine, pyrroli-dine, quinazolizidine, steroid alkaloids and glycoalkaloids. Other constituents include steroidal saponins, coumarins, flavones, carotenoids and anthraquinones (Evans, 2002). The genus of Lycium is one of the most important genera of family Solanaceae which has been the source of many active constituents. So we interest to choose Lycium schweinfurthii var. schweinfurthii which belongs to family Solanaceae. UMATERIALS AND METHODS
1.Plant Material The fresh roots,stem,leaves and flowers were collected in February, 2014
from alkom alakhdar islet, alborolos lake in egypt . They were washed, air-dried at
IJISET - International Journal of Innovative Science, Engineering & Technology, Vol. 3 Issue 10, October 2016
ISSN (Online) 2348 – 7968 | Impact Factor (2015) - 4.332
www.ijiset.com
274
lab. Temperature then dried in an oven at 50°C till constant weight, and finally ground to fine powder.
The taxonomic idendification of plant materials was confirmed by cairo univrisity herbarium. 2.Materials for Chromatography * Sheets of Whatman filter paper 1MM for paper chromatography (P.C.)
(Whatman Ltd. Maidstone, Kent, England). * Sheets of Whatman filter paper 3MM for paper chromatography (P.C.)
(Whatman Ltd. Maidstone, Kent, England). * Polyamide 6S (Riedel-De-Haen AG, Seelze Haen AG, SeelzeHanover,
Germany). * Sephadex LH-20 (Pharmacia, Uppsala, Sweden). Solvent Systems
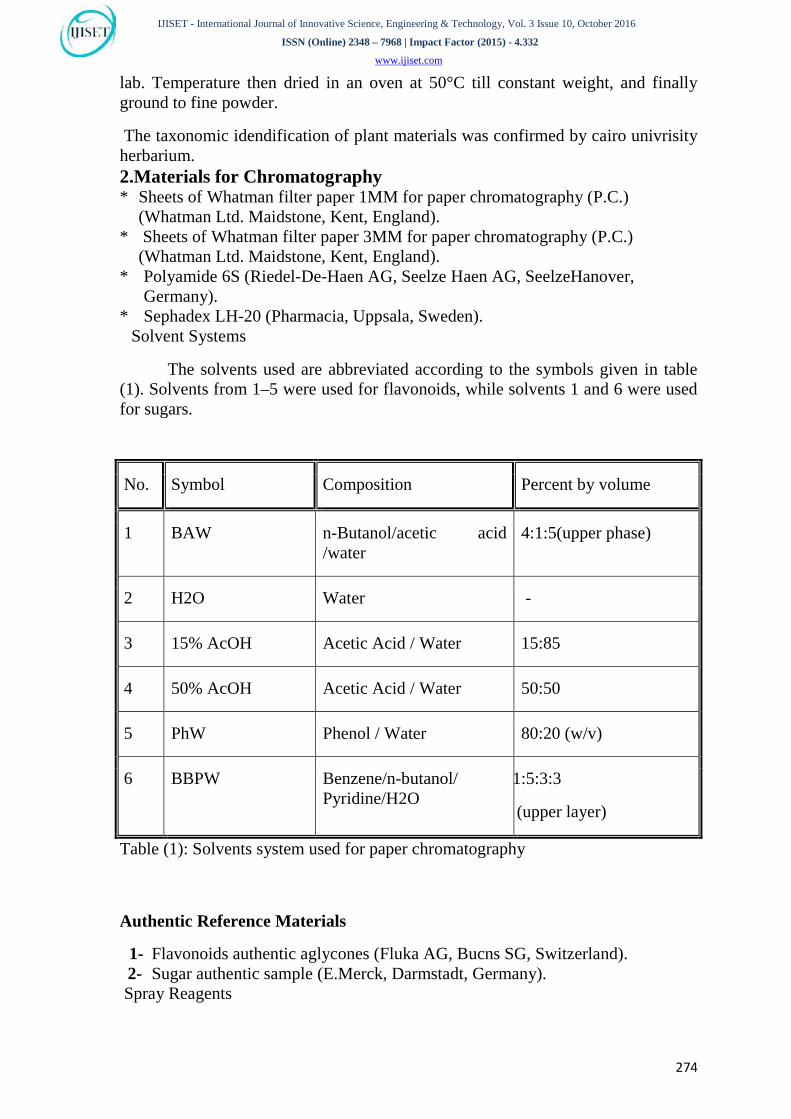
The solvents used are abbreviated according to the symbols given in table (1). Solvents from 1–5 were used for flavonoids, while solvents 1 and 6 were used for sugars.
Table (1): Solvents system used for paper chromatography
Authentic Reference Materials
1- Flavonoids authentic aglycones (Fluka AG, Bucns SG, Switzerland). 2- Sugar authentic sample (E.Merck, Darmstadt, Germany).
Spray Reagents
No. Symbol Composition Percent by volume
1 BAW n-Butanol/acetic acid /water
4:1:5(upper phase)
2 H2O Water -
3 15% AcOH Acetic Acid / Water 15:85
4 50% AcOH Acetic Acid / Water 50:50
5 PhW Phenol / Water 80:20 (w/v)
6 BBPW Benzene/n-butanol/ Pyridine/H2O
1:5:3:3
(upper layer)

IJISET - International Journal of Innovative Science, Engineering & Technology, Vol. 3 Issue 10, October 2016
ISSN (Online) 2348 – 7968 | Impact Factor (2015) - 4.332
www.ijiset.com
275
The presence of flavonoid compounds or sugars was revealed by spraying the developed chromatograms with one of the following reagents:
Specific Spraying Reagents for Phenolic and Flavonoids
1- Ferric chloride: (1% Ferric chloride solution in ethanol) The chromatograms were sprayed with FeCl3 then dried at 110°C for 10 min. and observed under UV light to note any changes in colour (Markham, 1982).
2- Aluminum chloride: (1% Aluminum chloride solution in methanol yields yellow - fluorescence colour in long wave UV light).
The chromatograms were sprayed with AlCl3, then dried at 110°C and observed under UV light to note any changes in colour (Markham, 1982).
Reagents for Ultra-Violet Spectroscopic Analysis of flavonoids (Mabry et al., 1970)
1- Sodium methoxide (NaOMe): Freshly cut metallic sodium (2.5g) was dissolved in 100 ml spectroscopic methanol.
2- Aluminum chloride (AlCl3): Anhydrous AlCl3 (5g) were added cautiously to spectroscopic methanol (100 ml) and filtration were carried out after 24 hours to use the filtrate.
3- Hydrochloric acid (HCl): 50 ml of concentrated HCl was mixed with 100 ml distilled water.
4- Sodium acetate (NaOAc): Anhydrous reagent grade NaOAc was melted and allowed to stand for about 10 min. The material was then powdered and stored in a dry bottle
5- Boric acid (H3BO3): Anhydrous powdered reagent grade H3BO3 was used.
3. Investigation of Flavonoids and Phenolic acids
3.1. Preparation of Flavonoidal Extract
One Kg Dry powder of Lycium schweinfurthii var. schweinfurthii leaves were extracted by using methyl alcohol 95% . The residue of the methanolic extract was washed with benzene to get ride of chlorophyll, then washed with successive selective organic solvents hexane, petroleum ether, ethyl acetate, chloroform, methanol 70% finally with water, where six main fractions were obtained; hexane fraction, petroleum ether fraction ethyl acetate fraction, chloroform fraction, methanol 70% fraction and water fraction.
Results of separation techniques clearly indicated that, the chloroform and methanol 70% fractions were the most rich by phenolic constituents most of them are of flavonoids nature.

IJISET - International Journal of Innovative Science, Engineering & Technology, Vol. 3 Issue 10, October 2016
ISSN (Online) 2348 – 7968 | Impact Factor (2015) - 4.332
www.ijiset.com
276
3.2. Chromatographic Investigation
3.2.1 Paper Chromatography
Two dimensional paper chromatography (TDPC) was carried out on Whatman (1MM) for comparative studies of leaves extracts under investigation using BAW for the first dimension, followed by 15% AcOH for the second dimension.
For separation and purification of mixture of the flavonoid compounds, the elution techniques on Whatman paper (3MM) were used. After the material under investigation was applied to the paper chromatography, the latter was run using solvent system No: 1-4 as outlined in table (1). All glass chromatographic tanks were used applying the descending techniques. The developed chromatograms were air – dried and examined before spraying under both visible and UV light (λmax= 366 and 245nm). The chromatograms were exposed to ammonia vapours for about 2-3 seconds and immediately re-examined the chromatograms to observe any possible changes that may eventually appear in colour or fluorescence under a long wave UV lamp.
3.2.2 Column Chromatography
The separation and identification of plant extracts were carried out by column chromatographic techniques (CC) (Markham, 1982). Polyamide and Sephadex columns (glass columns 130x9cm and 100x4.5cm) were used for the separation and purification of flavonoidal mixtures. Fractions produced from a large column often yielded simple mixtures of flavononids. Further separation on small column (glass columns 50x3cm and 30x2cm) or by paper chromatography, was carried out to obtain a pure flavonoid compound.
1- Polyamide Column Chromatography
Polyamide adsorbent of the caprolactam type (MN-polyamide SC 6, Macherey Nagel, Riedal-De-Haen Ag, Sellze-Hannover, Germany) was made into slurry with water and slowly poured into a glass column (130x9cm). Water was allowed to drip through the column to make sure that the adsorbent was firmly packed. The sample was dissolved in a minimum amount of the eluting solvent (water) and applied to the top of column, then elution initiated with addition of excess water. The polarity was changed by increasing the percentage of methanol gradually untill 100% methanol which employed to the final elution of the column. Fractions were further fractionated using elution techniques on paper chromatography (Mabry et al., 1970 and Markham & Mabry, 1975). Similar fractions were combined and tested for purity of their flavonoid compounds. This column was used for separation of the flavonoid compounds.
2- Sephadex Column Chromatography
Sephadex LH-20 (Pharmacia) column was used for the final purification of each individual flavonoid compounds before being subjected to chemical and

IJISET - International Journal of Innovative Science, Engineering & Technology, Vol. 3 Issue 10, October 2016
ISSN (Online) 2348 – 7968 | Impact Factor (2015) - 4.332
www.ijiset.com
277
spectral analysis (Johnston, et al., 1968). Sephadex adsorbent was soaked overnight in 100% methanol and then packed in a small column (2x50cm). Methanolic solution of a flavonoid was applied carefully on the top of the column and elution was carried out with 80% to 100% methanol, the non flavonoid impurities were eluted first and the migration of pure flavonoid was detected in UV light as dark purple or brown bands (Liu et al., 1989).
3.3. Identification Techniques of Flavonoids
The qualitative analysis of flavonoid glycosides involves three distinct methods:
1- Identification of the aglycone.
2- Identification of the sugar moiety.
3- Identification of the point of the sugar attachment.
This is usually carried out through both chemical and physical investigation as indicated below.
3.3.1. Chemical Analysis
Analysis to determine the nature of aglycones and sugars was carried out according to standard procedures performed by Mabry et al., (1970) and Harborne (1984).
3.3.1.a. Complete Acid Hydrolysis
Complete acid hydrolysis was carried out for 40-60 min. at 1000C using 5ml 2N-hydrochloric acid. The hydrolysate was then extracted with ethyl acetate, and the received extract was subjected to paper chromatographic investigation to detect the aglycones. The mother liquor was carefully neutralized, and then subject to paper chromatographic investigation to detect the sugars.
• Identification of the Aglycone
Identification of the aglycone moiety of flavonoid glycosides was based on direct co-chromatographic comparison with standard sample, UV spectroscopy followed by MS and NMR if needed.
• Identification of the Sugar
Sugars obtained by hydrolysis of the flavonoid glycosides were identified by paper chromatography. Chromatograms were developed in the upper phase of BBPW (Benzene, 1: n-butane, 5: pyridine, 3: water, 3) with a standard sugar mixture. The dried chromatograms were sprayed uniformaly with aniline phthalate. The dried chromatograms were heated at 1050C in an oven for about 10 min., and the colored sugar spots were observed at visible light. The Rf values of unknown sugars were compared directly with those of standard sugars.
IJISET - International Journal of Innovative Science, Engineering & Technology, Vol. 3 Issue 10, October 2016
ISSN (Online) 2348 – 7968 | Impact Factor (2015) - 4.332
www.ijiset.com
278
3.3.1.b. Enzymatic Hydrolysis
2mg of flavonoid glycosides were dissolved in 2 ml of 0.05N acetate buffer (pH 5) to which 1-2 mg of the appropriate enzyme for example, β-glucosidase was added. The mixture was incubated at 370C for 24 hours. Samples were taken after 5 hours and finally after 24 hours, and then chromatographed to test for any intermediates (Mabry et al., 1970).
3.3.2. Physical Analysis
Complete elucidation of the flavonoids should include physical methods such as ultraviolet (UV) and nuclear magnetic resonance (1H-NMR and 13C-NMR) measurements.
3.3.2.a. Ultraviolet Spectroscopic Analysis
Ultraviolet visible absorption spectroscopy is perhaps the most useful technique available for flavonoid structure analysis using UV- visible spectrophotometer (Shimadzu model UV-240 and 2401 PC). The technique is used to aid both identification of the oxygenation and glycosylation patterns (Mabry et al., 1970 and Markham, 1982). The flavonoid spectrum is usually determined in methanol using 2ml quartz cells. The spectrum typically consists of two absorption maxima at the ranges 240-285 nm (band II) and 300-550 nm (band I). The precise position and relative intensities of these maxima give valuable information on the nature of the flavonoid and its oxygenation pattern; the effects brought about by these changes are as follows:
1- Changes in the substitution of the A-ring tend to be reflected in the band II absorption while alternations in the substitution of the B-ring and C-ring tend to be more apparent from the band I absorption.
2- Additional oxygenation (especially hydroxylation) generally causes a shift of the appropriate band to longer wavelength, e.g. band I in 3,5,7,-tri OH flavone, 359 nm; 3,5,7,4\-tetra OH flavone, 367 nm; 3,5,7,3\,4\,-penta OH flavone, 370 nm and 3,5,7,3\,4\,5\-hexa OH flavone, 374 nm.
3- Methylation or glycosylation (especially of 3, 5, 7, and 4\ hydroxyls) causes band shifts to shorter wavelength. The nature of the sugar in glycosides is normally of no consequence.
4- Acetylation tends to nullify the effect of a phenolic hydroxyl group on the spectrum.
5- The presence of cinnamic acid as acyl function on a flavonoid can be detected by the presence of an absorption band at 320 nm in flavonoids that themselves lack significant absorption at this region (e.g. anthocyanins).
6- In flavones and flavonols, the presence of 3\, 4\-di-OH system is generally evidenced by a second peak (sometimes a shoulder) in band II.

IJISET - International Journal of Innovative Science, Engineering & Technology, Vol. 3 Issue 10, October 2016
ISSN (Online) 2348 – 7968 | Impact Factor (2015) - 4.332
www.ijiset.com
279
3.3.2.b. 1H-NMR spectroscopy
The NMR spectroscopy is a well - established method for structure elucidation of flavonoids (Mabry et al., 1970) using a Jeol Ex-500 spectroscopy; 500MHz (1NMR), 125 MHz (13C-NMR) or Joel JNM-EX 270 spectroscopy; 270 MHz (1H-NMR), 67.5 MHz (13C-NMR).
There are widely applied techniques for obtaining 1H-NMR spectra, using DMSO-d6 (hexa deutro dimethyl sulphoxide) as a solvent for the direct 1H-NMR analysis or conversion of the flavonoids to trimethylsilyl ether (TMS ether) derivatives.
1H-NMR spectra yield three sets of information: the integrals, the coupling pattern and the chemical shifts.
1- The integrals define the number of protons represented by each signal or group of signals.
2- The coupling patterns reflect the mutual arrangement of the coupling protons. In aromatic compounds the coupling constants are 7-9 Hz between ortho protons, 1-3 Hz between meta protons and less than 1 Hz between para protons. The Para coupling, however, is usually not resolved, but causes broadening of the single only which may in turn obscure a meta coupling.
3- The chemical shift of a proton indicates its chemical environment i.e. its position relative to any other part of the molecule. Chemical shift values are nowadays almost exclusively given parts per million (ppm) downfield from the TMS signal (Harborne, 1993). i.e. 1H-NMR analysis has been used to determine the aglycone part of the isolated flavone glycosides, to decide the number of sugars in the flavone O-glycosides, and the positions of the linkages of the sugar units in the falvone C-glycosides.
The great number of published 1H-NMR spectra of flavonoids simplified the chemical shift assignments of the protons in the aromatic region of the flavonoid (Table 2). It also helps to decide the number of sugar units in the flavonoid O-glycosides, since the chemical shifts of the anomeric protons are more downfield than the other sugar protons.
For structure elucidation of flavonoid C-glycoside, measurements have been made on both the TMS ether derivatives and on the parent flavonoid C-glycoside in DMSO-d6. The latter method had a few advantages, for example it is difficult to completely convert the flavone 6, 8-di-C-glycosides into the TMS ether derivatives (Mabry et al., 1970), and the same solvent could be used for both 1H and 13C-NMR spectroscopy. When only small amounts of a sample were available, the C-glycoside was dissolved in DMSO-d6 and submitted to 1H-NMR analysis followed by permethylation according to the mass spectroscopy analysis. By holding a high temperature (800C) when recording the 1H-NMR spectrum, the signal obtained from the absorbed water was minimal.
IJISET - International Journal of Innovative Science, Engineering & Technology, Vol. 3 Issue 10, October 2016
ISSN (Online) 2348 – 7968 | Impact Factor (2015) - 4.332
www.ijiset.com
280
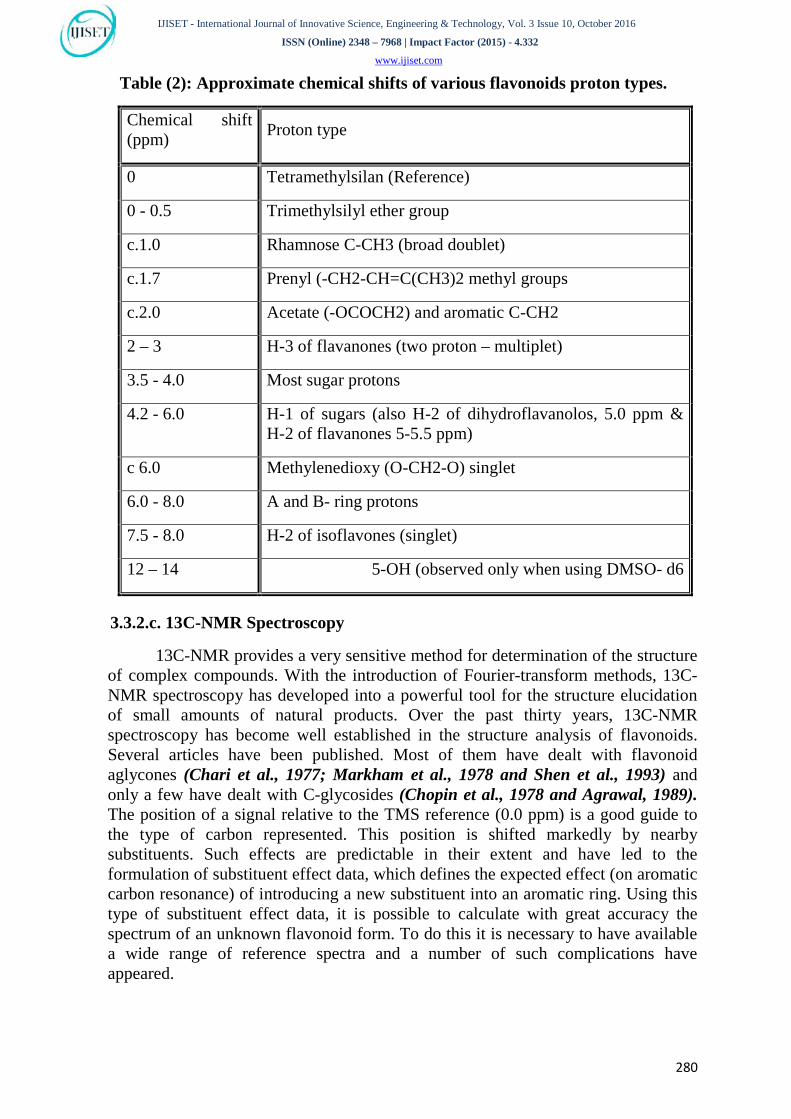
Table (2): Approximate chemical shifts of various flavonoids proton types.
Chemical shift (ppm) Proton type
0 Tetramethylsilan (Reference)
0 - 0.5 Trimethylsilyl ether group
c.1.0 Rhamnose C-CH3 (broad doublet)
c.1.7 Prenyl (-CH2-CH=C(CH3)2 methyl groups
c.2.0 Acetate (-OCOCH2) and aromatic C-CH2
2 – 3 H-3 of flavanones (two proton – multiplet)
3.5 - 4.0 Most sugar protons
4.2 - 6.0 H-1 of sugars (also H-2 of dihydroflavanolos, 5.0 ppm & H-2 of flavanones 5-5.5 ppm)
c 6.0 Methylenedioxy (O-CH2-O) singlet
6.0 - 8.0 A and B- ring protons
7.5 - 8.0 H-2 of isoflavones (singlet)
12 – 14 5-OH (observed only when using DMSO- d6
3.3.2.c. 13C-NMR Spectroscopy
13C-NMR provides a very sensitive method for determination of the structure of complex compounds. With the introduction of Fourier-transform methods, 13C-NMR spectroscopy has developed into a powerful tool for the structure elucidation of small amounts of natural products. Over the past thirty years, 13C-NMR spectroscopy has become well established in the structure analysis of flavonoids. Several articles have been published. Most of them have dealt with flavonoid aglycones (Chari et al., 1977; Markham et al., 1978 and Shen et al., 1993) and only a few have dealt with C-glycosides (Chopin et al., 1978 and Agrawal, 1989). The position of a signal relative to the TMS reference (0.0 ppm) is a good guide to the type of carbon represented. This position is shifted markedly by nearby substituents. Such effects are predictable in their extent and have led to the formulation of substituent effect data, which defines the expected effect (on aromatic carbon resonance) of introducing a new substituent into an aromatic ring. Using this type of substituent effect data, it is possible to calculate with great accuracy the spectrum of an unknown flavonoid form. To do this it is necessary to have available a wide range of reference spectra and a number of such complications have appeared.
IJISET - International Journal of Innovative Science, Engineering & Technology, Vol. 3 Issue 10, October 2016
ISSN (Online) 2348 – 7968 | Impact Factor (2015) - 4.332
www.ijiset.com
281
In general terms sugar-related substitution include shifts are as follows:
1- O-glycosylation of a flavonoid hydroxyl produces an upfield shift of up to 2 ppm in the signal of the adjacent flavonoid carbon and downfield shifts in the signal of the ortho and especially para related carbons (1-4 ppm).
2- C-glycosylation of a flavonoid aglycone causes a 10 ppm downfield shift of the signal of the glycosylated carbon, but leaves other signals relatively unaffected.
3- Glycosylation of sugar by glucose causes an 8 ppm downfield shift in the signal of the glycosylated carbon accompanied by a 1-3 ppm upfield shift in the signal of the adjacent carbons. Glycosylation by rhamnose causes smaller shifts (3-6 ppm downfield and 1-2 ppm upfield, respectively).
3.3.3. Mass Spectrometry
Mass spectral data provide structural information on flavonoids and are used to determine molecular masses and to establish the distribution of substituents between the A- and B- rings. A careful study of fragmentation patterns can also be of particular value in the determination of the nature and site of attachment of the sugars in O- and C- glycosides (Andersen & Markham, 2006). EI-MS, model Finnigan-Mat SSQ 7000 spectrometer and ESI-MS: LCQ Advantage Thermo Finnigan spectrometers were used.
UResults and discussions
1. Separation of Flavonoids and Phenolic acids
Flavonoids and phenolic compounds more concentrated in the plant leaves than in the other part which was cleared from the phytochemical study so that, these active constituents were separated from the leaves of Lycium schweinfurthii var. schweinfurthii . two compounds were separated from chloroform fraction and three compounds from methanol 70% fraction of the leaves .
Results of separation techniques clearly indicated that, the chloroform fraction and methanol 70% fraction were the most rich by phenolic constituents
Chloroform fraction when subjected to preparative paper chromatography (3MM) using system BAW (4:1:5) for 24 hours, gives two major bands. The bands were eluted separately with hot methanol / H2O (1:1v/v). to give (com1 & com2).
Fractionation of the methanol 70% extract on polyamide column using H2O/ethanol system revealed the presence of two main fractions containing flavonoids were collected from the column.
Fraction No.(1) : When fraction no.1 subjected to rechromatography on preparative paper
chromatography (3MM) using system AcOH 15 % for 8 hours gives one major band. The band was eluted with hot methanol / H2O (1:1v/v).to give (com3).
IJISET - International Journal of Innovative Science, Engineering & Technology, Vol. 3 Issue 10, October 2016
ISSN (Online) 2348 – 7968 | Impact Factor (2015) - 4.332
www.ijiset.com
282
Fraction No.(2) : When fraction no.2 subjected to preparative paper chromatography (3MM)
using system BAW (4:1:5) for 24 hours, gives two major bands. The bands were eluted separately with hot methanol / H2O (1:1v/v).to give (com4&com5).
1.1. Identification of com 1 Band no. 1 when eluted with hot methanol / H2O (1:1v/v)., dried under reduced pressure, purified on sephadex LH-20 column using methanol/water as described by Johnston et al., (1968) gave com 1. Two dimension paper chromatography of the pure compounds using system BAW (4: 1: 5) and AcOH-15% revealed the presence of one spot of flavonoid nature.
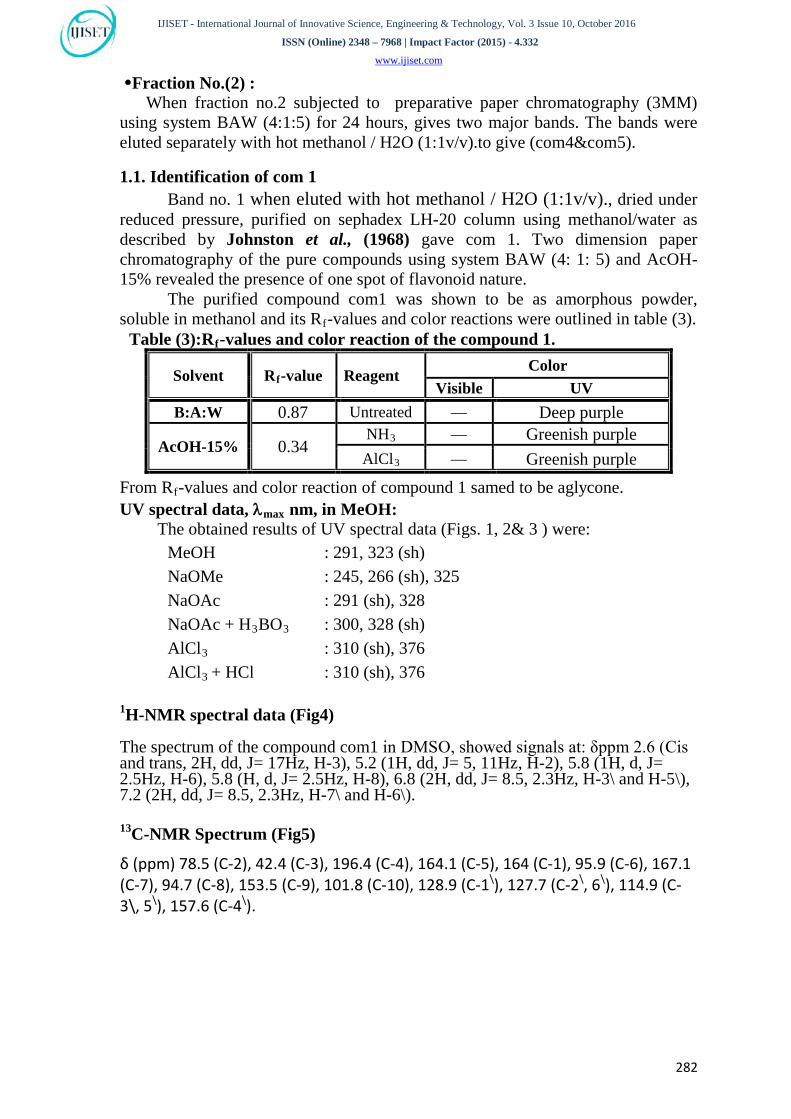
The purified compound com1 was shown to be as amorphous powder, soluble in methanol and its RRfR-values and color reactions were outlined in table (3).
Table (3):RRfR-values and color reaction of the compound 1.
Solvent RRfR-value Reagent Color Visible UV
B:A:W 0.87 Untreated — Deep purple
AcOH-15% 0.34 NHR3 — Greenish purple AlClR3 — Greenish purple
From RRfR-values and color reaction of compound 1 samed to be aglycone. UV spectral data, λRmaxR nm, in MeOH:
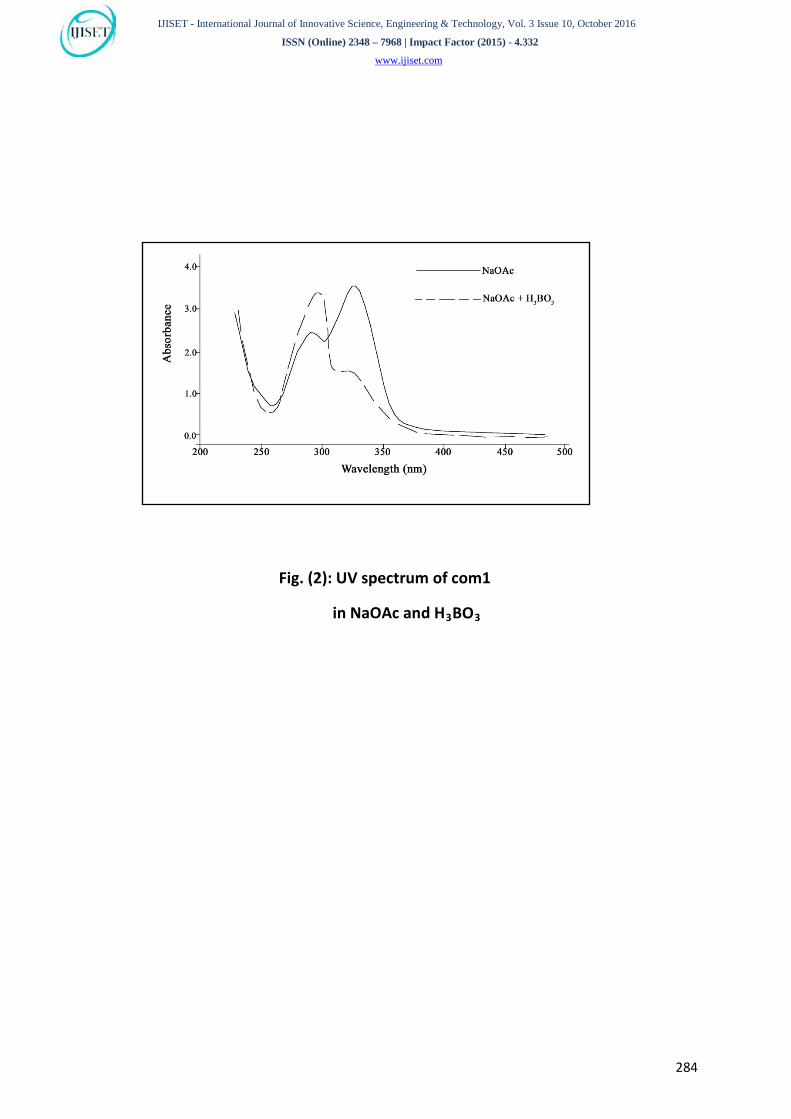
The obtained results of UV spectral data (Figs. 1, 2& 3 ) were: MeOH : 291, 323 (sh) NaOMe : 245, 266 (sh), 325 NaOAc : 291 (sh), 328 NaOAc + HR3RBOR3R : 300, 328 (sh) AlClR3 R : 310 (sh), 376 AlClR3 R+ HCl : 310 (sh), 376
P
1PH-NMR spectral data (Fig4)
The spectrum of the compound com1 in DMSO, showed signals at: δppm 2.6 (Cis and trans, 2H, dd, J= 17Hz, H-3), 5.2 (1H, dd, J= 5, 11Hz, H-2), 5.8 (1H, d, J= 2.5Hz, H-6), 5.8 (H, d, J= 2.5Hz, H-8), 6.8 (2H, dd, J= 8.5, 2.3Hz, H-3\ and H-5\), 7.2 (2H, dd, J= 8.5, 2.3Hz, H-7\ and H-6\). P
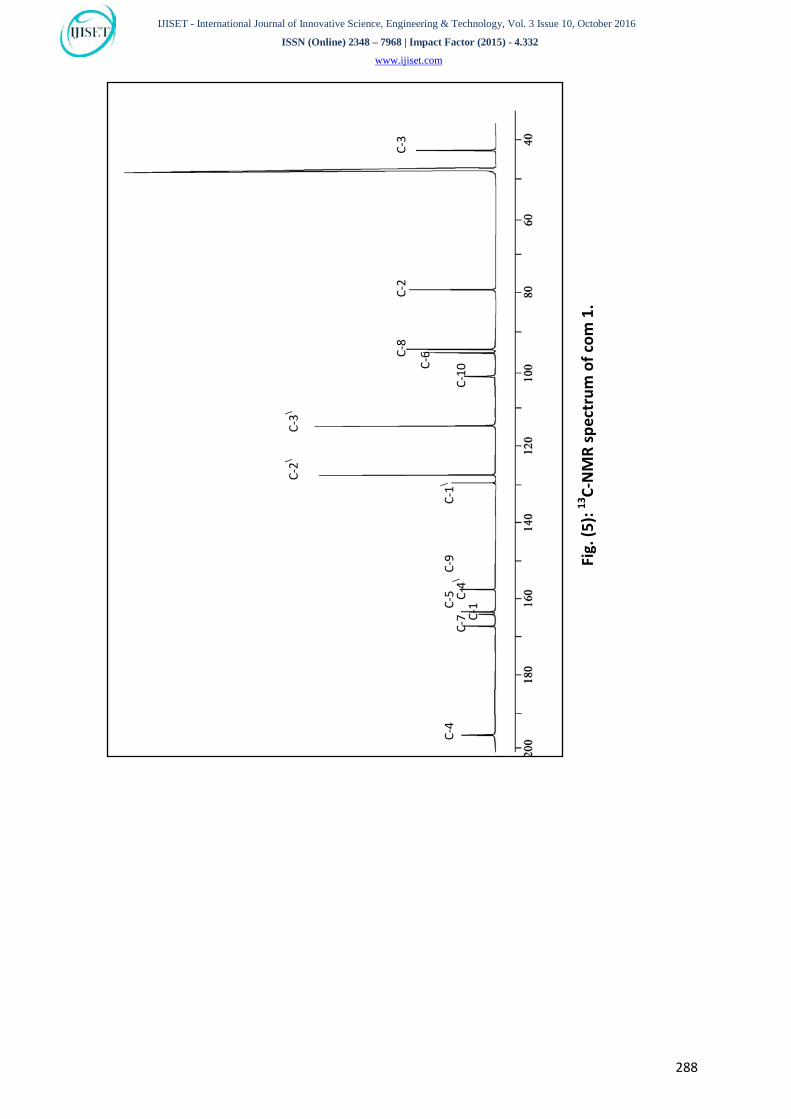
13PC-NMR Spectrum (Fig5)
δ (ppm) 78.5 (C-2), 42.4 (C-3), 196.4 (C-4), 164.1 (C-5), 164 (C-1), 95.9 (C-6), 167.1 (C-7), 94.7 (C-8), 153.5 (C-9), 101.8 (C-10), 128.9 (C-1 P
\P), 127.7 (C-2 P
\P, 6 P
\P), 114.9 (C-
3\, 5 P
\P), 157.6 (C-4 P
\P).

IJISET - International Journal of Innovative Science, Engineering & Technology, Vol. 3 Issue 10, October 2016
ISSN (Online) 2348 – 7968 | Impact Factor (2015) - 4.332
www.ijiset.com
283
Fig. (1): UV spectrum of com1
in MeOH and NaOMe
IJISET - International Journal of Innovative Science, Engineering & Technology, Vol. 3 Issue 10, October 2016
ISSN (Online) 2348 – 7968 | Impact Factor (2015) - 4.332
www.ijiset.com
284
Fig. (2): UV spectrum of com1
in NaOAc and HR3RBOR3R

IJISET - International Journal of Innovative Science, Engineering & Technology, Vol. 3 Issue 10, October 2016
ISSN (Online) 2348 – 7968 | Impact Factor (2015) - 4.332
www.ijiset.com
285
Fig. (3): UV spectrum of com1
in AlClR3R and HCl

IJISET - International Journal of Innovative Science, Engineering & Technology, Vol. 3 Issue 10, October 2016
ISSN (Online) 2348 – 7968 | Impact Factor (2015) - 4.332
www.ijiset.com
286
UV spectral data λRmaxR, nm of compound (1) in methanol gave a major absorption peak at λRmaxR 291 and a minor one at λRmax R323 (characteristic to dihydro flavones) (Figs. 1).
On addition of NaOMe it gave a bathochromic shift in the major absorption peak (+34nm) indicated the presence of free OH group at C-5 and C-4 P
\P.
On addition of NaOAc it gave a bathochromic shift in the major absorption peak (+37nm) pointed to the presence of free OH group at position 7, which not affected after addition of HR3RBOR3R indicating the absence of ortho dihydroxy group.
A bathochromic shift in the major (+19nm) with addition of AlCl3 which not affected by the addition of HCl, indicated the presence of free 5 hydroxyl
group and absence of ortho-dihydroxyl groups.
From data of 1H-NMR spectrum of the compound 1, the presence of one doublet of doublet signal at δ 5.2ppm (J= 5.11Hz) representing the proton at position 2. The presence of one doublet of doublet signal at δ 2.6ppm (J= 17Hz) representing proton at position 3. The presence of doublet signals at δ 6.8ppm (J= 8.5, 2.3Hz) representing protons at carbon 3\, 5\ and the presence of another 2 doublet of doublet signals at δ 7.2ppm representing protons at carpon 2\, 6\. The presence of 2 doublet signals at δ 5.8ppm (J= 2.5Hz) representing protons
at position 6 and 8. From the above data UV analysis, 1H-NMR and 13C-NMR spectrum
indicated that the compound 1 is 5,7,4\-trihydroxy-2,3-dihydro flavone (Naringrnin).
Naringrnin

IJISET - International Journal of Innovative Science, Engineering & Technology, Vol. 3 Issue 10, October 2016
ISSN (Online) 2348 – 7968 | Impact Factor (2015) - 4.332
www.ijiset.com
287
Fig.
(4):
1 H-N
MR
spec
trum
of c
om1.
IJISET - International Journal of Innovative Science, Engineering & Technology, Vol. 3 Issue 10, October 2016
ISSN (Online) 2348 – 7968 | Impact Factor (2015) - 4.332
www.ijiset.com
288
Fig.
(5):
13C-
NM
R sp
ectr
um o
f com
1.
C-4
C-
7
C-1
C-5
C-
4\
C-1\
C-2\
C-3\
C-6
C-10
C-8
C-
2
C-3
C-9
IJISET - International Journal of Innovative Science, Engineering & Technology, Vol. 3 Issue 10, October 2016
ISSN (Online) 2348 – 7968 | Impact Factor (2015) - 4.332
www.ijiset.com
289
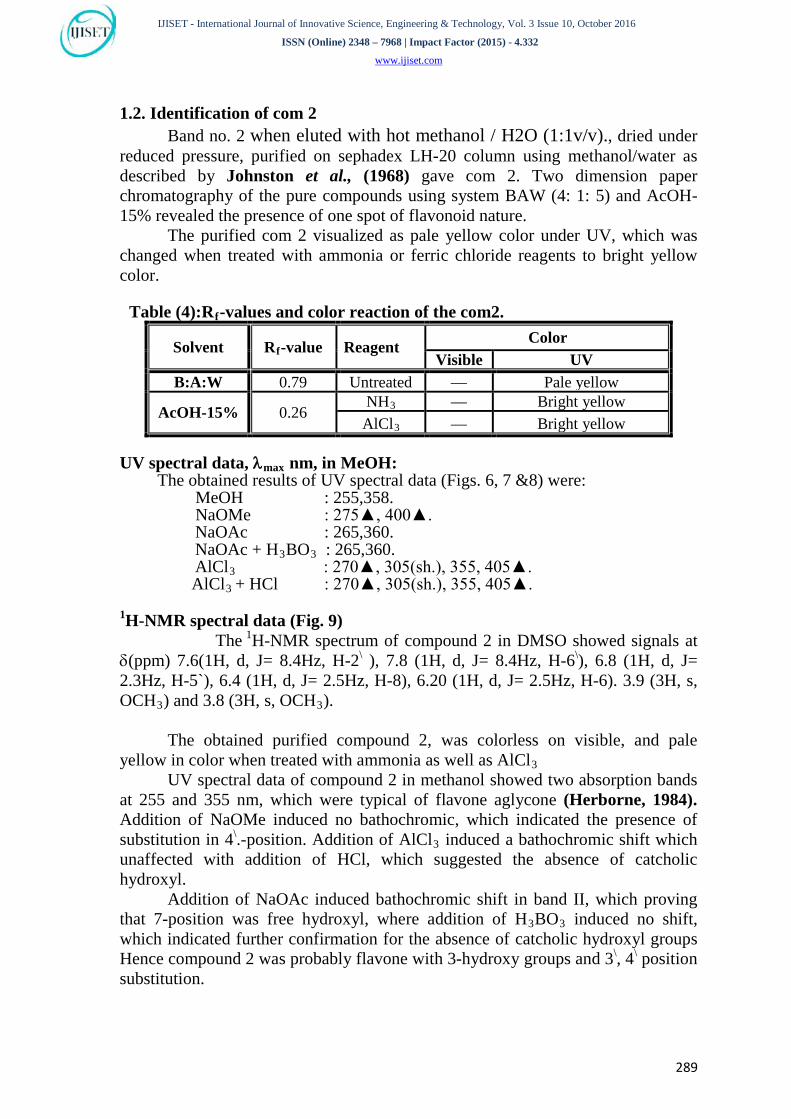
1.2. Identification of com 2 Band no. 2 when eluted with hot methanol / H2O (1:1v/v)., dried under reduced pressure, purified on sephadex LH-20 column using methanol/water as described by Johnston et al., (1968) gave com 2. Two dimension paper chromatography of the pure compounds using system BAW (4: 1: 5) and AcOH-15% revealed the presence of one spot of flavonoid nature.
The purified com 2 visualized as pale yellow color under UV, which was changed when treated with ammonia or ferric chloride reagents to bright yellow color.
Table (4):RRfR-values and color reaction of the com2.
Solvent RRfR-value Reagent Color Visible UV
B:A:W 0.79 Untreated — Pale yellow
AcOH-15% 0.26 NHR3 — Bright yellow AlClR3 — Bright yellow
UV spectral data, λRmaxR nm, in MeOH:
The obtained results of UV spectral data (Figs. 6, 7 &8) were: MeOH : 255,358. NaOMe : 275▲, 400▲. NaOAc : 265,360. NaOAc + HR3RBOR3 R: 265,360. AlClR3 R : 270▲, 305(sh.), 355, 405▲. AlClR3 R+ HCl : 270▲, 305(sh.), 355, 405▲.
P
1PH-NMR spectral data (Fig. 9)
The P
1PH-NMR spectrum of compound 2 in DMSO showed signals at
δ(ppm) 7.6(1H, d, J= 8.4Hz, H-2 P
\P ), 7.8 (1H, d, J= 8.4Hz, H-6 P
\P), 6.8 (1H, d, J=
2.3Hz, H-5`), 6.4 (1H, d, J= 2.5Hz, H-8), 6.20 (1H, d, J= 2.5Hz, H-6). 3.9 (3H, s, OCHR3R) and 3.8 (3H, s, OCHR3R).
The obtained purified compound 2, was colorless on visible, and pale
yellow in color when treated with ammonia as well as AlClR3 UV spectral data of compound 2 in methanol showed two absorption bands
at 255 and 355 nm, which were typical of flavone aglycone (Herborne, 1984). Addition of NaOMe induced no bathochromic, which indicated the presence of substitution in 4P
\P.-position. Addition of AlClR3R induced a bathochromic shift which
unaffected with addition of HCl, which suggested the absence of catcholic hydroxyl.
Addition of NaOAc induced bathochromic shift in band II, which proving that 7-position was free hydroxyl, where addition of HR3RBOR3R induced no shift, which indicated further confirmation for the absence of catcholic hydroxyl groups Hence compound 2 was probably flavone with 3-hydroxy groups and 3 P
\P, 4 P
\P position
substitution.

IJISET - International Journal of Innovative Science, Engineering & Technology, Vol. 3 Issue 10, October 2016
ISSN (Online) 2348 – 7968 | Impact Factor (2015) - 4.332
www.ijiset.com
290
The structure of compound 2 was further confirmed by P
1PH-NMR spectrum
of (Fig. 9), which showed signals at δ 7.8 (1H, d, J=8.5Hz, H-2 P
\P), 7.6 (1H, d,
J=8.5Hz, H-6 P
\P), 6.8 (1H, d, J=8.4Hz, H-5 P
\P), 6.4 (1H, d, J=2.5Hz, H-8), 6.2 (1H, d,
J=2.5Hz, H-6), 3.9 (3H, s, oCHR3R) and 3.8 (3H, s, oCHR3R).Thus from RRfR, Color reaction, UV, and P
1PH-NMR spectrum data compound 2 identifed as 3-hydroxy-
3P
\P,4P
\ Pmethoxy flavone
3-hydroxy-3P
\P,4P
\ Pmethoxy flavone

IJISET - International Journal of Innovative Science, Engineering & Technology, Vol. 3 Issue 10, October 2016
ISSN (Online) 2348 – 7968 | Impact Factor (2015) - 4.332
www.ijiset.com
291
Fig. (6): UV spectrum of com2 in MeOH and NaOMe

IJISET - International Journal of Innovative Science, Engineering & Technology, Vol. 3 Issue 10, October 2016
ISSN (Online) 2348 – 7968 | Impact Factor (2015) - 4.332
www.ijiset.com
292
Fig. (7): UV spectrum of com2 in NaOAc and HR3RBOR3
MeOH
NaOAc

IJISET - International Journal of Innovative Science, Engineering & Technology, Vol. 3 Issue 10, October 2016
ISSN (Online) 2348 – 7968 | Impact Factor (2015) - 4.332
www.ijiset.com
293
Fig. (8): UV spectrum of com2
in AlClR3R and HCl

IJISET - International Journal of Innovative Science, Engineering & Technology, Vol. 3 Issue 10, October 2016
ISSN (Online) 2348 – 7968 | Impact Factor (2015) - 4.332
www.ijiset.com
294
Fig (9):P
1PH-NMR spectrum of com2.
IJISET - International Journal of Innovative Science, Engineering & Technology, Vol. 3 Issue 10, October 2016
ISSN (Online) 2348 – 7968 | Impact Factor (2015) - 4.332
www.ijiset.com
295
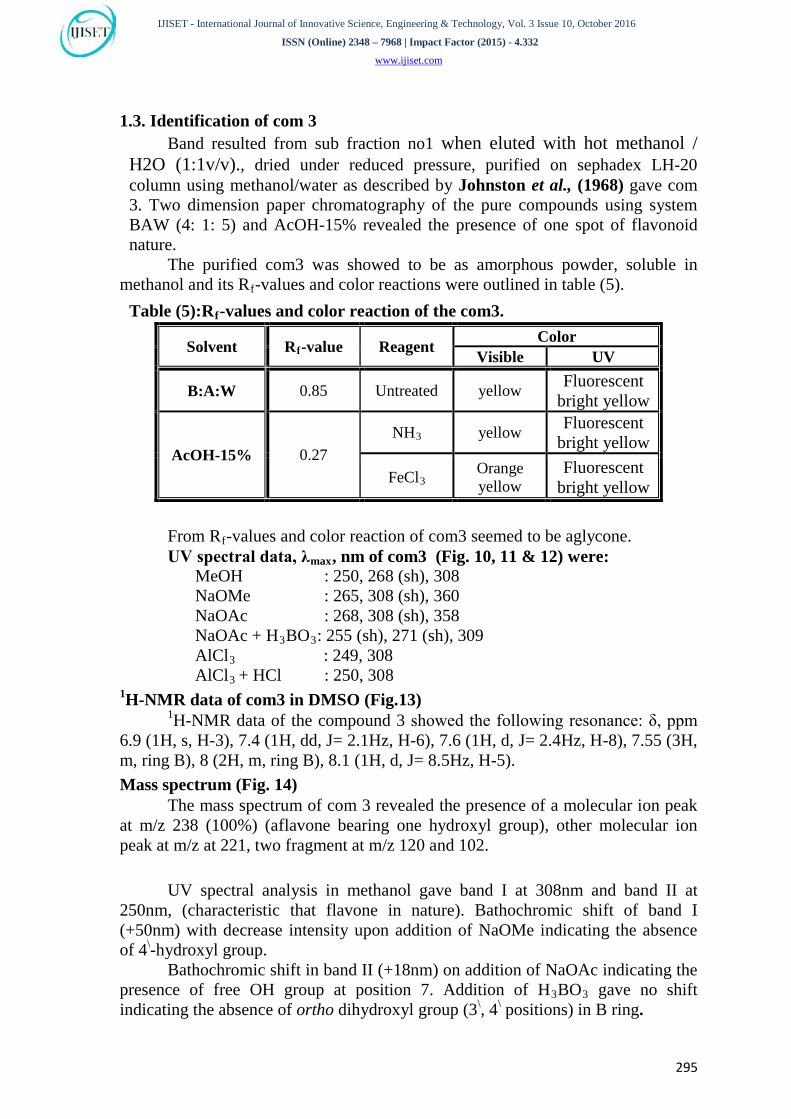
1.3. Identification of com 3 Band resulted from sub fraction no1 when eluted with hot methanol /
H2O (1:1v/v)., dried under reduced pressure, purified on sephadex LH-20 column using methanol/water as described by Johnston et al., (1968) gave com 3. Two dimension paper chromatography of the pure compounds using system BAW (4: 1: 5) and AcOH-15% revealed the presence of one spot of flavonoid nature.
The purified com3 was showed to be as amorphous powder, soluble in methanol and its RRfR-values and color reactions were outlined in table (5).
Table (5):RRfR-values and color reaction of the com3.
Solvent RRfR-value Reagent Color Visible UV
B:A:W 0.85 Untreated yellow Fluorescent bright yellow
AcOH-15% 0.27 NHR3 yellow Fluorescent
bright yellow
FeClR3 Orange yellow
Fluorescent bright yellow
From RRfR-values and color reaction of com3 seemed to be aglycone.
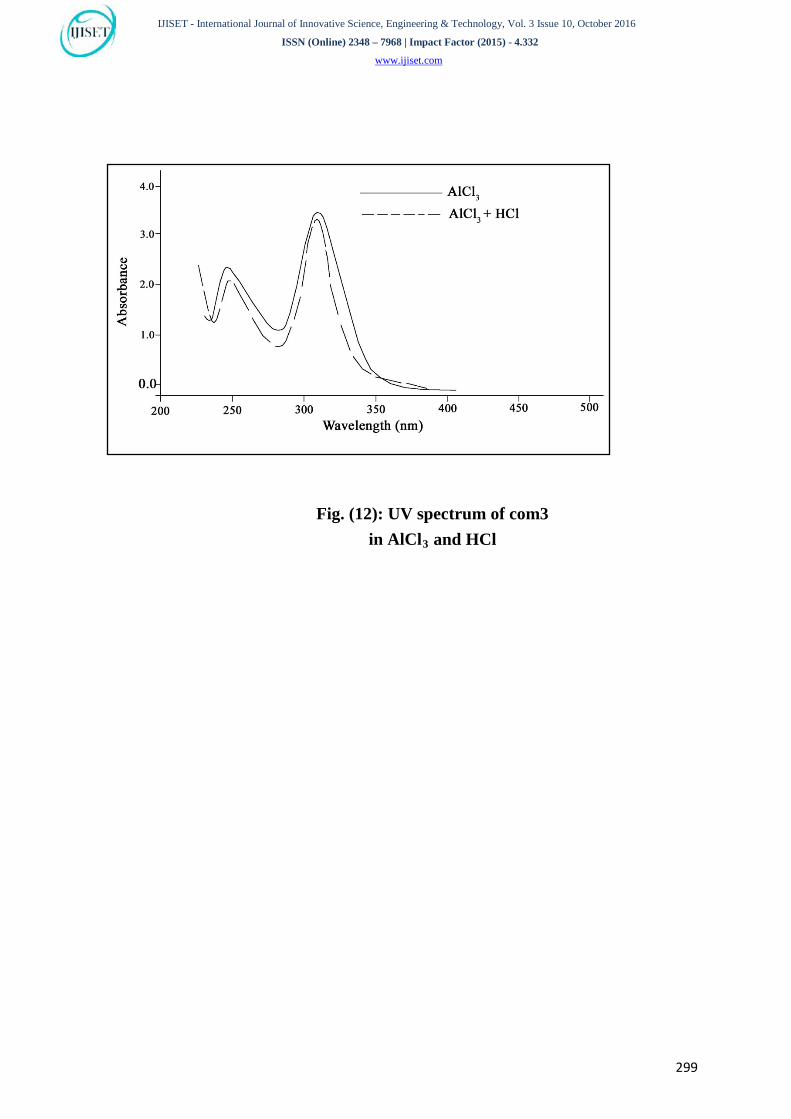
UV spectral data, λRmaxR, nm of com3 (Fig. 10, 11 & 12) were: MeOH : 250, 268 (sh), 308 NaOMe : 265, 308 (sh), 360 NaOAc : 268, 308 (sh), 358 NaOAc + HR3RBOR3R: 255 (sh), 271 (sh), 309 AlClR3 R : 249, 308 AlClR3 R+ HCl : 250, 308
P
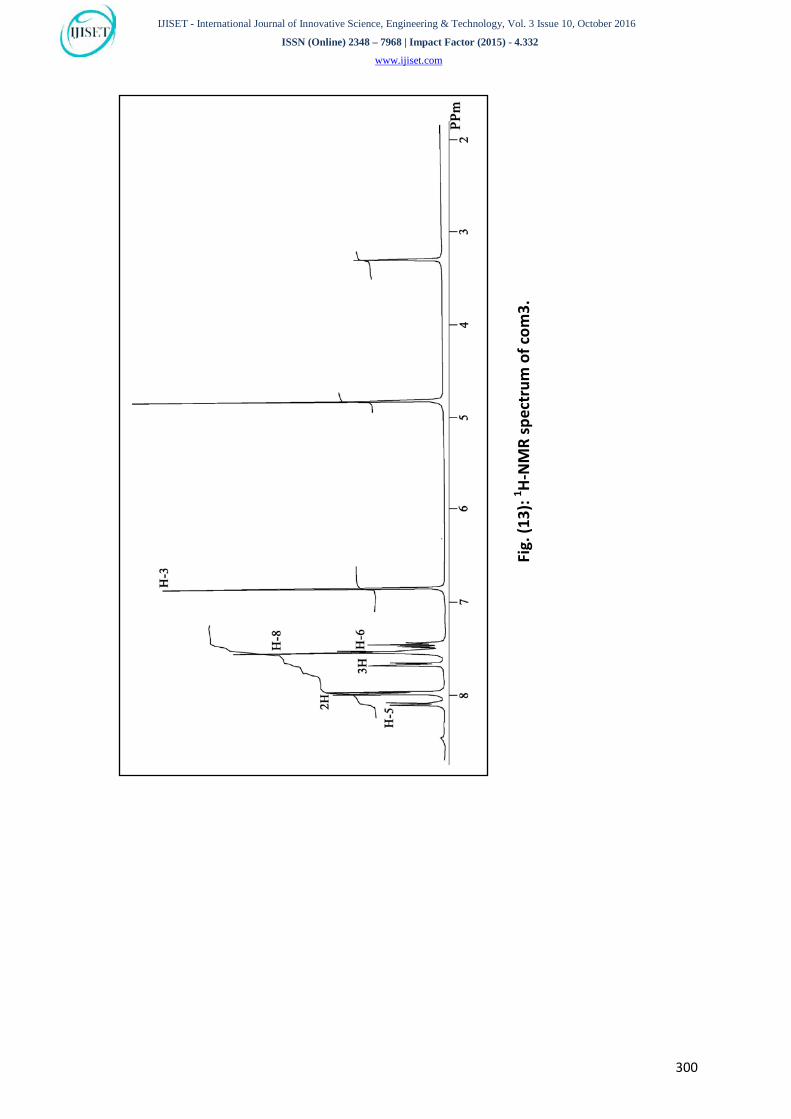
1PH-NMR data of com3 in DMSO (Fig.13)
P
1PH-NMR data of the compound 3 showed the following resonance: δ, ppm
6.9 (1H, s, H-3), 7.4 (1H, dd, J= 2.1Hz, H-6), 7.6 (1H, d, J= 2.4Hz, H-8), 7.55 (3H, m, ring B), 8 (2H, m, ring B), 8.1 (1H, d, J= 8.5Hz, H-5). Mass spectrum (Fig. 14) The mass spectrum of com 3 revealed the presence of a molecular ion peak at m/z 238 (100%) (aflavone bearing one hydroxyl group), other molecular ion peak at m/z at 221, two fragment at m/z 120 and 102.
UV spectral analysis in methanol gave band I at 308nm and band II at 250nm, (characteristic that flavone in nature). Bathochromic shift of band I (+50nm) with decrease intensity upon addition of NaOMe indicating the absence of 4 P
\P-hydroxyl group.
Bathochromic shift in band II (+18nm) on addition of NaOAc indicating the presence of free OH group at position 7. Addition of HR3RBOR3R gave no shift indicating the absence of ortho dihydroxyl group (3 P
\P, 4P
\P positions) in B ring.

IJISET - International Journal of Innovative Science, Engineering & Technology, Vol. 3 Issue 10, October 2016
ISSN (Online) 2348 – 7968 | Impact Factor (2015) - 4.332
www.ijiset.com
296
No shift occurring on addition of AlClR3R, which indicates the absence of free OH at position 5, also on addition of HCl gave no shift indicating the absence of ortho dihydroxyl group at B ring.
The structure of com 3was further confirmed by P
1PH-NMR spectrum of (Fig.
13), which showed The hydroxylation at C-7 indicated by the ortho-coupling between H-5 and H-6 and the meta-coupling between H-6 and H-8, thus H-5 and H-8 appeared as 2 doublet at δ 8.1 and 7.6, respectively. While H-6 appeared as a doublet of doublet at δ 7.4. The absence of free OH at CR4RP
\P was indicated by the
multiplet singlet at δ 7.55 and 8ppm for H-4 P
\P, 3 P
\P, 5P
\ Pand H-2 P
\P, H-6 P
\P respectively.
From the previous data the com3 was identified as 7-hydroxy flavone.
7-hydroxy flavone

IJISET - International Journal of Innovative Science, Engineering & Technology, Vol. 3 Issue 10, October 2016
ISSN (Online) 2348 – 7968 | Impact Factor (2015) - 4.332
www.ijiset.com
297
Fig. (10): UV spectrum of com3 in MeOH and NaOMe .

IJISET - International Journal of Innovative Science, Engineering & Technology, Vol. 3 Issue 10, October 2016
ISSN (Online) 2348 – 7968 | Impact Factor (2015) - 4.332
www.ijiset.com
298
Fig. (11): UV spectrum of com3 in NaOAc and HR3RBOR3
IJISET - International Journal of Innovative Science, Engineering & Technology, Vol. 3 Issue 10, October 2016
ISSN (Online) 2348 – 7968 | Impact Factor (2015) - 4.332
www.ijiset.com
299
Fig. (12): UV spectrum of com3 in AlClR3R and HCl
IJISET - International Journal of Innovative Science, Engineering & Technology, Vol. 3 Issue 10, October 2016
ISSN (Online) 2348 – 7968 | Impact Factor (2015) - 4.332
www.ijiset.com
300
Fig.
(13)
: 1 H-N
MR
spec
trum
of c
om3.

IJISET - International Journal of Innovative Science, Engineering & Technology, Vol. 3 Issue 10, October 2016
ISSN (Online) 2348 – 7968 | Impact Factor (2015) - 4.332
www.ijiset.com
301
Fig.
(14)
: Mas
s spec
trum
of c
om3.
IJISET - International Journal of Innovative Science, Engineering & Technology, Vol. 3 Issue 10, October 2016
ISSN (Online) 2348 – 7968 | Impact Factor (2015) - 4.332
www.ijiset.com
302
1.4. Identification of com 4 Band no 1 resulted from sub fraction no 2 when eluted with hot methanol
/ H2O (1:1v/v)., dried under reduced pressure, purified on sephadex LH-20 column using methanol/water as described by Johnston et al., (1968) gave com 4. Two dimension paper chromatography of the pure compounds using system BAW (4: 1: 5) and AcOH-15% revealed the presence of one spot of flavonoid nature.
The purified com 4 visualized as brown color under UV, which was changed when treated with ammonia to yellow color and unchanged when treated with ferric chloride reagents.
Table (6):RRfR-values and color reaction of the com4.
Solvent RRfR-value Reagent Color Visible UV
B:A:W 0.43 Untreated — Brown
AcOH-15% 0.29 NHR3 — yellow AlClR3 — Brown
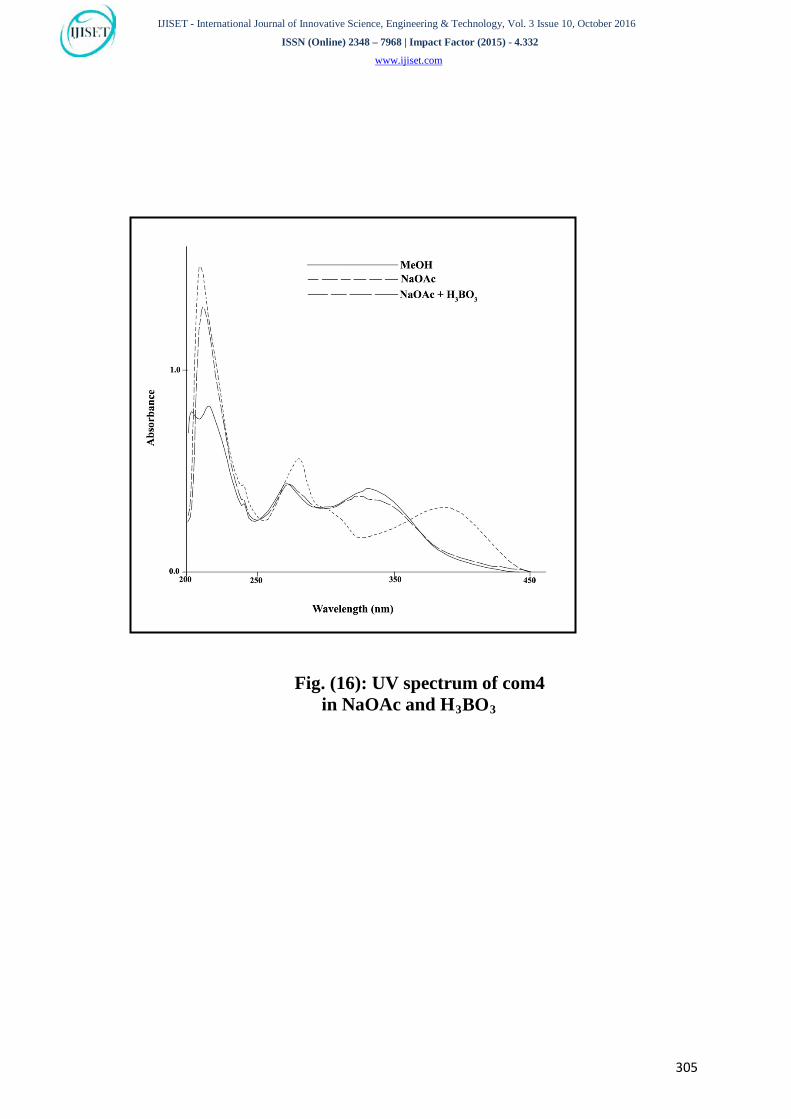
UV spectral data, λRmaxR nm, in MeOH (Figs. 15, 16 & 17)
The obtained results of UV spectral data were: MeOH : 273, 330. NaOMe : 285▲, 333(sh.), 400▲. NaOAc : 282▲, 305, 385▲. NaOAc + HR3RBOR3R : 272,330. AlClR3 R : 280▲, 305, 345▲, 385. AlClR3 R+ HCl : 280,305,345, 385.
P
1PH-NMR spectral data Fig (18)
The P
1PH-NMR spectrum of com 4 in DMSO showed signals at δ(ppm) 7.9(2H, d,
J= 8Hz, H-2 P
\P, H-6 P
\P), 6.9 (2H, d, J= 8Hz, H-3 P
\ Pand H-5`), 6.7(s, H-6) and 4.55(1H, d,
J= 8Hz, H-1 P
\\P glucose), 3.2-3.8(m, glucose proton).
The purified com4 appeared on paper chromatography as brown spot changed to yellow, when subjected to ammonia vapor under UV light. RRfR values and color reaction was within the range of C-glycoside.
The UV spectral data of com4 showed band I at 330 and band II at 273 nm. Which indicated that com 4 was flavone (Liu et al., 1989).
Addition of NaOMe induced bathocromic shift, which indicated that 4 P
\P-
position was free hydroxyl, while addition of AlClR3R induced bathocromic shift in band I, addition of HCl case no shift, which proved the absence of any catecholic hydroxyl groups.
Addition of NaOAc induced bathocromic shift for band II, which indicated that 7-position was free hydroxyl, while addition of HR3RBOR3R induced no positive shift for band I, which indicated the absence of any catecholic hydroxyl.

IJISET - International Journal of Innovative Science, Engineering & Technology, Vol. 3 Issue 10, October 2016
ISSN (Online) 2348 – 7968 | Impact Factor (2015) - 4.332
www.ijiset.com
303
Complete acid hydrolysis of com 4 using 2N HCl at 100ºC for 4hours, showed that com 4 resisted acid hydrolysis for 4 hours, and indicated that com4 is C-glycoside.
Further confirmation was achieved through P
1PH-NMR, which showed the
absence of H-8 signal proton and presence of anomeric sugar proton at δ4.55 ( P
1PH,
d, J=8Hz, H-1 P
\\P glucose) and remaining sugar protons multiple at δ3.1-3.9 (m,
glucose proton). From RRfR, UV data, acid hydrolysis and P
1PH-NMR spectral data of com4
confirmed that com4 was vitexin.
vitexin.

IJISET - International Journal of Innovative Science, Engineering & Technology, Vol. 3 Issue 10, October 2016
ISSN (Online) 2348 – 7968 | Impact Factor (2015) - 4.332
www.ijiset.com
304
Fig. (15): UV spectrum of com4 in MeOH and NaOMe
IJISET - International Journal of Innovative Science, Engineering & Technology, Vol. 3 Issue 10, October 2016
ISSN (Online) 2348 – 7968 | Impact Factor (2015) - 4.332
www.ijiset.com
305
Fig. (16): UV spectrum of com4 in NaOAc and HR3RBOR3

IJISET - International Journal of Innovative Science, Engineering & Technology, Vol. 3 Issue 10, October 2016
ISSN (Online) 2348 – 7968 | Impact Factor (2015) - 4.332
www.ijiset.com
306
Fig. (17): UV spectrum of com4 in AlClR3R and HCl

IJISET - International Journal of Innovative Science, Engineering & Technology, Vol. 3 Issue 10, October 2016
ISSN (Online) 2348 – 7968 | Impact Factor (2015) - 4.332
www.ijiset.com
307
Fig. (18): P
1PH-NMR spectrum of com4.

IJISET - International Journal of Innovative Science, Engineering & Technology, Vol. 3 Issue 10, October 2016
ISSN (Online) 2348 – 7968 | Impact Factor (2015) - 4.332
www.ijiset.com
308
1.5. Identification of com 5
Band no 2 resulted from sub fraction no 2 when eluted with hot methanol / H2O (1:1v/v)., dried under reduced pressure, purified on sephadex LH-20 column using methanol/water as described by Johnston et al., (1968) gave com 5. Two dimension paper chromatography of the pure compounds using system BAW (4: 1: 5) and AcOH-15% revealed the presence of one spot of flavonoid nature.
The purified com 5 visualized as Deep purple color under UV, which was changed when treated with ammonia to Yellowish green color and unchanged when treated with ferric chloride reagents.
Table (7):RRfR-values and color reaction of the com5.
Solvent RRfR-value Reagent Color Visible UV
B:A:W 0.50 Untreated — Deep purple
AcOH-15% 0.79 NHR3 — Yellowish
green FeClR3 --- Deep purple
Acid hydrolysis: Acid hydrolysis of com5by 0.1NHCl showed that rhamnose as sugar moiety detected by comparing its RRfR values with authentic pure sugars then acid hydrolysis by 0.2NHCl showed that aglycone and two sugar residues identified as glucose and ehamnose detected by comparing its RRfR-values with authentic pure sugars. This results which confirmed that the glucose moiety is directed to aglycone part and rhamnose is terminaly.
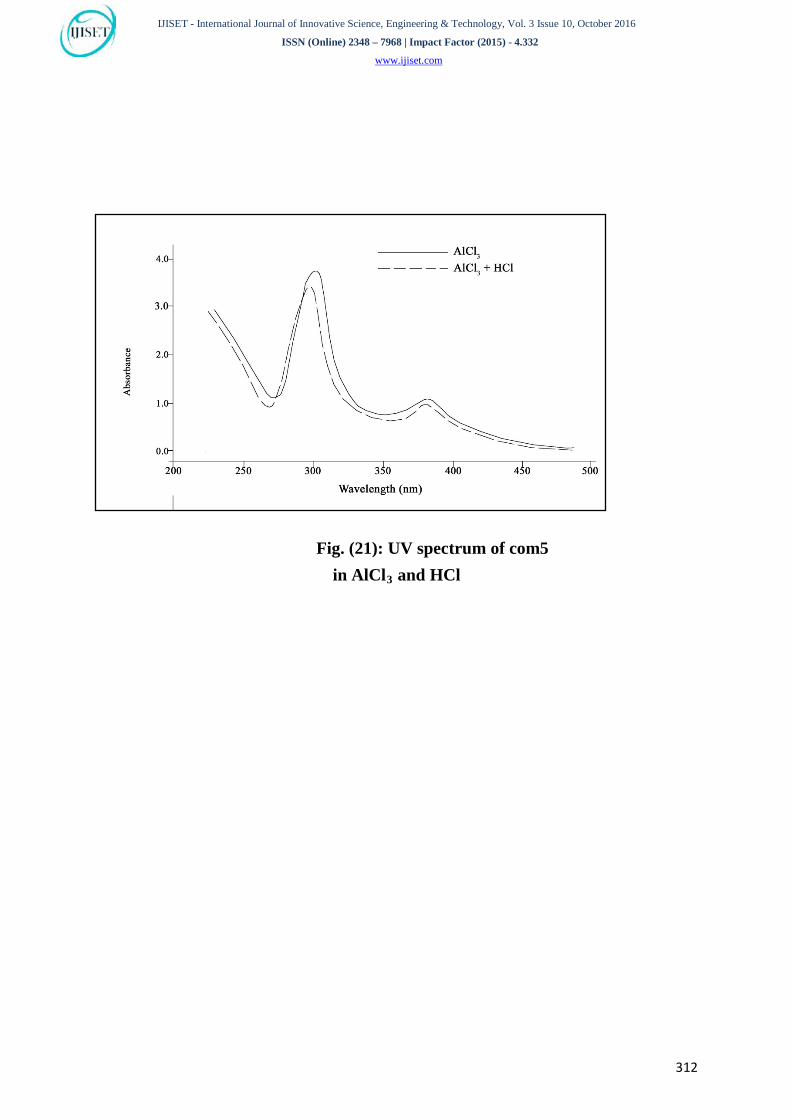
Enzymatic hydrolysis: Enzymatic hydrolysis with β-glycosidase gave negative result which confirmed that the glucose moiety is directly linked to aglycone part and rhamnose is terminaly. UV spectral data, λRmaxR, nm of com5 (Fig.19, 20 & 21) were: The obtained results of UV spectral data were:
MeOH : 286, 326 dec. NaOMe : 244 (sh), 284, 359 NaOAc : 283, 335 NaOAc + HR3RBOR3R: 283, 328 AlClR3 R : 308, 385 AlClR3 R+ HCl : 305, 383
P
1PH-NMR spectrum of com 5(Fig. 22)
The P
1PH-NMR spectrum of the com 5 in DMSO showed that, signals at δ ppm
1.08 (3H-, s, CHR3R of rhamnose), 3.8 (3H, s, methoxyl protons), 4.5(1H, d, J= 6.5HZ, protons of rhamnose), 5.07 (1H, d, J= 6.6Hz, protons of glucose), 5.3 (1H,

IJISET - International Journal of Innovative Science, Engineering & Technology, Vol. 3 Issue 10, October 2016
ISSN (Online) 2348 – 7968 | Impact Factor (2015) - 4.332
www.ijiset.com
309
s, H-2), 6.69 (1H, d, J= 3.4Hz, H-6), 6.7 (1H, d, J= 3.4Hz, H-8), 6.8 (1H, s, H-3), 7.1 (1H, d, J= 9Hz, H-5 P
\P), 7.45 (1H, d, J= 3.6Hz, H-6 P
\P), 7.5 (1H, s, J= 8.5Hz, H-2P
\P).
From UV spectral data of com 5 in methanol exhibit one major band II at
λRmaxR 286 and a minor one band I at λRmaxR 326 (Characteristic range of flavonones). No shift occured in band II on addition of NaOMe indicated the presence of
substituted OR group at position 4P
\P in β-ring.
No shift occured in band II on addition of NaOAc indicated the presence of substitution in position 7 which not affected by the addition of boric acid which indicating the absence of dihydroxyl group at β-ring. Bathochromic shift (+22) in band II with addition of AlClR3R which not affected by the addition of HCl indicating the presence of free hydroxyl group in position 5 and absence of ortho-dihydroxyl group.
From data of P
1PH-NMR spectrum presence of one s signal at δ 5.3ppm and δ
6.8ppm representing the proton at positions 2 and 3 respectively (Compound FR7R is flavonone).
The presence of 4 P
\P-methoxy group due to the presence of s signal at δ
7.5ppm representing protons at carbon 2 P
\P, doublet signals at δ 7.45ppm
representing protons at 5 P
\P and doublet signals representing protons at 6 P
\P.
The presence of 2 anomeric protons (Protons of glucose and protons for rhamnose) at 5.07ppm and 4.5ppm, also the presence of multiplet protons of disaccharide in the rejoin 3.2, 3.6ppm.
The 3 proton of methyl group characteristic to rhamnose which present at δ 3.8ppm where the glucose moiety directly attached to the aglycone. These is confirmed also from acid hydrolysis.
From the previous data the com5 was found to be hisperidine (hisperitine-7-rutinoside).
Hisperidine
Hisperitine-7-rutinoside

IJISET - International Journal of Innovative Science, Engineering & Technology, Vol. 3 Issue 10, October 2016
ISSN (Online) 2348 – 7968 | Impact Factor (2015) - 4.332
www.ijiset.com
310
Fig. (19): UV spectrum of com5 in MeOH and NaOMe

IJISET - International Journal of Innovative Science, Engineering & Technology, Vol. 3 Issue 10, October 2016
ISSN (Online) 2348 – 7968 | Impact Factor (2015) - 4.332
www.ijiset.com
311
Fig. (20): UV spectrum of com5 in NaOAc and HR3RBOR3R
IJISET - International Journal of Innovative Science, Engineering & Technology, Vol. 3 Issue 10, October 2016
ISSN (Online) 2348 – 7968 | Impact Factor (2015) - 4.332
www.ijiset.com
312
Fig. (21): UV spectrum of com5 in AlClR3R and HCl

IJISET - International Journal of Innovative Science, Engineering & Technology, Vol. 3 Issue 10, October 2016
ISSN (Online) 2348 – 7968 | Impact Factor (2015) - 4.332
www.ijiset.com
313
Fig. (15): P
1PH-NMR spectrum of compound FR1R.
Fig.
(22)
: 1 H-N
MR
spec
trum
of c
om5.
OCH
3

IJISET - International Journal of Innovative Science, Engineering & Technology, Vol. 3 Issue 10, October 2016
ISSN (Online) 2348 – 7968 | Impact Factor (2015) - 4.332
www.ijiset.com
314
Conclusion:
From the methanolic extract of Lycium schweinfurthii var. schweinfurthii leaves a five flavonoids were isolated and purified using different chromatographic techniques. These compounds were identified via spectroscopic tools:, UV,1H NMR,P
13PC-NMR and MS spectroscopy.
References Agrawal, P.K. (1989): In "Carbon–13NMR of Flavonoids"., Elsevier, Amsterdam,
Oxford, New York, Tokyo, PP. 291– 353.
Andersen, Q.M. and Markham, K.R. (2006): In "Flavonoids: Chemistry, Biochemistry and Applications", Boca Raton, FL: CRC press, pp: 53–82.
Brieskorn, C.H. and Klinger-Hand Polonius, W. (1961): Triterpenes and sterols in leaves of Salvia trioloba and Pyrus malus. Arch. Pharm., 294: 380-391.
Chari, V.M.; Wagner, H. and Neszmelyi, A. (1977): In "Farkas, L.; Gabor, M. and Kally, F. (Eds.). Flavonoids and Bioflavonoids".. Elsevier, Ireland. PP. 293–301.
Chopin, J.; Buillant, M.; Ramachandran Nair, A.G.; Ramesh, P. and Mabry T.J. (1978): New C-glycosyl flavones from Mollugo distica. Phytochemistry, 17: 299–300.
Evans, W. C. (2002) Trease and Evans pharmacognosy, 15th ed., W. B. Saunders, China
Harborne, J.B. (1984): In "Phytochemical Methods", Chapman and Hall. London, 287 pp.
Harborne, J.B. (1993): In "The Flavonoids–Advanced in Research Science", Chapman and Hall. London, pp. 565-588.
Hickey, MN. & King, C. (1981) 100 Families of Flowering Plants, Cambridge University Press, Cambridge.
Hussein, F. T. (1985) Medicinal Plants in Libya, Arab encyclopedia house, Tripoli..
Johnston, K.; Stern, D. and Waise, J. (1968): Chromatography, 33 & 359. Cited from Chemical studies on some plants related to families leguminosae and Umbelliferae. Mohamed T., (1993). Ph.D. Thesis, Fac. Sci. Cairo Univ.
Liu, Y. L.; Neuman, P.; Borbara, N.T. and Mabry, T.J. (1989): In "Techniques of Flavonoids Analysis". Academic press. New York. 1: 90–130.
IJISET - International Journal of Innovative Science, Engineering & Technology, Vol. 3 Issue 10, October 2016
ISSN (Online) 2348 – 7968 | Impact Factor (2015) - 4.332
www.ijiset.com
315
Mabry, T.J.; Markham, K.R. and Thomas, M.B. (1970). In "The Systematic Identification of Flavonoids." Springer-Verlag, New York, Heidlberg, Berlin, 354 pp.
Markham K.R.; Ternai B.; Stanley R.; Geiger H. and Mabry T.J. (1978): Carbon–13NMR studies of flavonoids. Ш: Naturally occurring flavonoid glycosides and their acylated derivatives. Tetrahedron, 34 (9): 1389–1397.
Markham, K.R. (1982): In "Techniques of Flavonoid Identification". Academic Press. New York, 113 pp.
Markham, K.R. and Mabry, T.J. (1975): Ultraviolet Visible and Proton Magnetic Resonance Spectroscopy of Flavonoids. In "Harborne J. B., Mabry T. J. and Mabry H., (Eds.)". The Flavonoids. Chapman and Hall, London PP: 45–77.
Quattrocchi, U. (2000). CRC World Dictionary of Plant Names. 4 R-Z. USA: Taylor and Francis. Page: 2058
Siddiqi, M. A. (1978) Flora of Libya . Al Faateh University, Tripoli. 62: 1