Calibration of Manning’s Friction Factor for Rivers in ... · IJISET - International Journal of...
12
IJISET - International Journal of Innovative Science, Engineering & Technology, Vol. 1 Issue 10, December 2014. www.ijiset.com ISSN 2348 – 7968 Calibration of Manning’s Friction Factor for Rivers in Iraq Using Hydraulic Model (Al-Kufa River as Case study) Luay Kadhim Hameed, Civil Engineering Dept./ University of Kufa Hayder Sami Mohammed, Structure and water resources Dept./University of Kufa Abstract An unsteady one dimensional mathematical model was calibrated for simulating the flow and estimating the water surface profiles for Al-Kufa River. The Hydraulic Model for the studied river was implemented and run by using the HEC-RAS (Version 4) software. The calibrations and verification processes of the model have been carried out by making use of the field measurements. Al- Kufa River was selected so that the numerical results can be compared with available measured flows and stages data. The appropriate value of Manning’s roughness coefficient (n) is chosen through the process of calibration; i.e., the value which reproduces observed data to an acceptable accuracy. In the present study, the HEC-RAS unsteady flow model is applied to Al-Kufa river (between Al-Kufa Barrage, and upstream Al-Kufa city) to predict the value of Manning’s coefficient through the calibration procedure. The data are taken for the period from (10 / February / 2014) to (26/ May / 2014) and divided equally into two sets; the first set is for calibration purpose; i.e., estimation of (n) and the rest for verification which is the process of testing the model with actual data to establish its predictive accuracy. It is found that the value of Manning's roughness coefficient (n) for Al-Kufa River which shows good agreement between observed and computed data is (0.032). 1- Introduction Al-Kufa River is strongly influenced by Al-Kufa barrage. The surrounding area, in length of about (20 km) downstream the river, is rural with many villages distributed at both sides of the river, as shown in Fig. (1). As the river passes mainly through alluvial plan, and the climate conditions are rather favorable, the land is predominantly agricultural. There are no detailed studies of hydrodynamics of the river. For that reason, the setting of the hydraulic river model was initiated. The roughness coefficient (n) in natural channels is difficult to determine in field. The Manning friction coefficient as a one-dimensional (1D) open channel flow parameter, various factors affecting the values of roughness coefficients as presented by (Chow, 1959). The friction slope may thus be seen as a very important parameter whose value must be chosen very carefully. Although conditions of unsteady flow simulation may require special treatment of the friction slope, most works in this area find the use of Manning's equation for steady uniform flow acceptable in this case (Chow et al.,1988). The typical 504
Transcript of Calibration of Manning’s Friction Factor for Rivers in ... · IJISET - International Journal of...

IJISET - International Journal of Innovative Science, Engineering & Technology, Vol. 1 Issue 10, December 2014.
www.ijiset.com
ISSN 2348 – 7968
Calibration of Manning’s Friction Factor for Rivers in Iraq Using Hydraulic Model (Al-Kufa River as Case study)
Luay Kadhim Hameed,
Civil Engineering Dept./ University of Kufa
Hayder Sami Mohammed, Structure and water resources Dept./University of Kufa
Abstract
An unsteady one dimensional mathematical model was calibrated for simulating the flow and estimating the water surface profiles for Al-Kufa River. The Hydraulic Model for the studied river was implemented and run by using the HEC-RAS (Version 4) software. The calibrations and verification processes of the model have been carried out by making use of the field measurements. Al-Kufa River was selected so that the numerical results can be compared with available measured flows and stages data. The appropriate value of Manning’s roughness coefficient (n) is chosen through the process of calibration; i.e., the value which reproduces observed data to an acceptable accuracy. In the present study, the HEC-RAS unsteady flow model is applied to Al-Kufa river (between Al-Kufa Barrage, and upstream Al-Kufa city) to predict the value of Manning’s coefficient through the calibration procedure. The data are taken for the period from (10 / February / 2014) to (26/ May / 2014) and divided equally into two sets; the first set is for calibration purpose; i.e., estimation of (n) and the rest for verification which is the process of testing the model with actual data to establish its predictive accuracy. It is found that the value of Manning's roughness coefficient (n) for Al-Kufa River which
shows good agreement between observed and computed data is (0.032).
1- Introduction
Al-Kufa River is strongly influenced by Al-Kufa barrage. The surrounding area, in length of about (20 km) downstream the river, is rural with many villages distributed at both sides of the river, as shown in Fig. (1). As the river passes mainly through alluvial plan, and the climate conditions are rather favorable, the land is predominantly agricultural. There are no detailed studies of hydrodynamics of the river. For that reason, the setting of the hydraulic river model was initiated. The roughness coefficient (n) in natural channels is difficult to determine in field. The Manning friction coefficient as a one-dimensional (1D) open channel flow parameter, various factors affecting the values of roughness coefficients as presented by (Chow, 1959). The friction slope may thus be seen as a very important parameter whose value must be chosen very carefully. Although conditions of unsteady flow simulation may require special treatment of the friction slope, most works in this area find the use of Manning's equation for steady uniform flow acceptable in this case (Chow et al.,1988). The typical
504

IJISET - International Journal of Innovative Science, Engineering & Technology, Vol. 1 Issue 10, December 2014.
www.ijiset.com
ISSN 2348 – 7968
value of (n) for natural irrigation channels is (0.025) (Fenton, 2002) and for earth channels ranges from (0.022 to 0.033) (Gupta, 2007). Past experience of flow in Iraqi natural rivers indicates that the value of Manning's (n) may vary between (0.025 and 0.034)
For the beginning, the HEC-RAS software is selected for numerical calculation. That software has long been used for one-dimensional river flow simulations (Kalaba, 2014). As professional software, and at the same time simple one-dimensional, the HEC-RAS should serve as a good tool for the hydraulic model setup
.
2- Description of the HEC-RAS Software
The Hydrologic Engineering Center River Analysis System (HEC-RAS) is a program developed by the US Army Corps of Engineers. (Stevenson et al, 2009). The HEC-RAS is numerical software for
hydrology calculations. It is widely used in one-dimensional water surface profile calculations in case of steady and unsteady river flow regimes. In addition, it contains components for one-dimensional sediment transport numerical calculations (HEC-RAS, 2010). Fig. (2) shows the main menu of HEC-RAS model.
Fig.(1): Al-Kufa river in Iraq
505

IJISET - International Journal of Innovative Science, Engineering & Technology, Vol. 1 Issue 10, December 2014.
www.ijiset.com
ISSN 2348 – 7968
3- HEC-RAS Data Requirements HEC-RAS requires several inputs, the most important of which are; channel geometry and an estimate of channel roughness. The channel geometry includes the definition of the profile of the river channel in the study reach. This is primarily achieved by a combination of surveyed cross sections
which longitudinally define the channel shape. The required concentration of cross sections differs from station to station and depends on site specific features such as longitudinal uniformity of cross sectional shape, channel linearity, degree of channel meander, longitudinal slope and uniformity of slope throughout the study reach. (Motlagh et al, 2013)
3-1- Geometric data
Geometric data in HEC-RAS consists of linking the river cross sections along the whole reach to create the schematic river system (20 cross section). The path of river reach is taken from topographic map loaded into the HEC-RAS geometric data editor. The reach starts downstream of the Al-Kufa barrage, and ends at Al-Kufa Bridge where the gauge station is found. Since the reach length is (20km, twenty initial cross-sections, were positioned at every (250 m). The distances between cross-sections were adjusted, first in order to achieve proper length. Before the interpolation to a
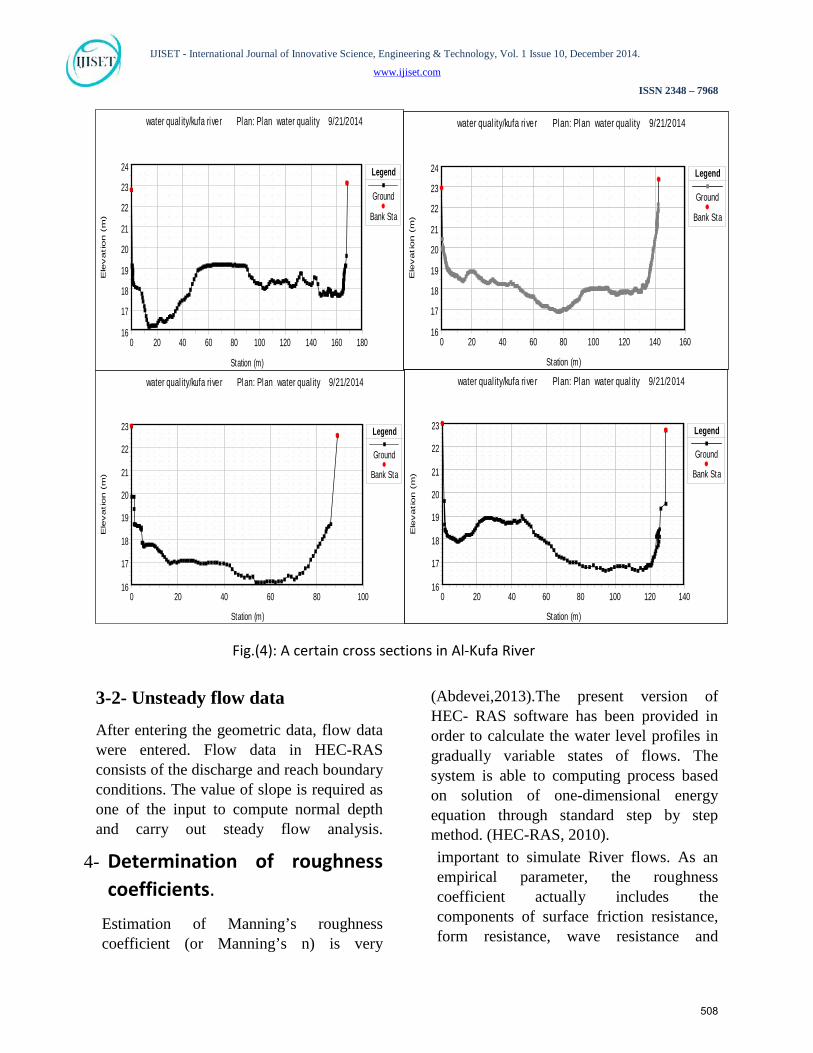
maximum distance of (250 m) additional cross-sections were added to all positions where it was necessary due to sudden change in flow geometry. The geometry of cross-sections used in calculations was based on extremely rough measurements and do not represent exact cross-sections of the river channel. More precise measurements remain to be carried out in the future. a schematic diagram of Al-Kufa system is drawn as shown in Fig.(3). A certain cross sections in Al-Kufa River is shown in Fig. (4)
Fig. (2): Main menu of HEC-RAS model
506

IJISET - International Journal of Innovative Science, Engineering & Technology, Vol. 1 Issue 10, December 2014.
www.ijiset.com
ISSN 2348 – 7968
Fig. 3: Schematic diagram of the Kufa River
507
IJISET - International Journal of Innovative Science, Engineering & Technology, Vol. 1 Issue 10, December 2014.
www.ijiset.com
ISSN 2348 – 7968
3-2- Unsteady flow data
After entering the geometric data, flow data were entered. Flow data in HEC-RAS consists of the discharge and reach boundary conditions. The value of slope is required as one of the input to compute normal depth and carry out steady flow analysis.
(Abdevei,2013).The present version of HEC- RAS software has been provided in order to calculate the water level profiles in gradually variable states of flows. The system is able to computing process based on solution of one-dimensional energy equation through standard step by step method. (HEC-RAS, 2010).
4- Determination of roughness coefficients.
Estimation of Manning’s roughness coefficient (or Manning’s n) is very
important to simulate River flows. As an empirical parameter, the roughness coefficient actually includes the components of surface friction resistance, form resistance, wave resistance and
0 20 40 60 80 100 120 140 160 18016
17
18
19
20
21
22
23
24
water qual ity/kufa river Plan: Plan water qual ity 9/21/2014
Station (m)
Ele
vation (
m)
Legend
Ground
Bank Sta
0 20 40 60 80 100 120 140 16016
17
18
19
20
21
22
23
24
water qual ity/kufa river Plan: Plan water qual ity 9/21/2014
Station (m)
Ele
vation (
m)
Legend
Ground
Bank Sta
0 20 40 60 80 10016
17
18
19
20
21
22
23
water qual ity/kufa river Plan: Plan water qual ity 9/21/2014
Station (m)
Ele
vation (
m)
Legend
Ground
Bank Sta
0 20 40 60 80 100 120 14016
17
18
19
20
21
22
23
water qual ity/kufa river Plan: Plan water qual ity 9/21/2014
Station (m)
Ele
vation (
m)
Legend
Ground
Bank Sta
Fig.(4): A certain cross sections in Al-Kufa River
508

IJISET - International Journal of Innovative Science, Engineering & Technology, Vol. 1 Issue 10, December 2014.
www.ijiset.com
ISSN 2348 – 7968
resistance due to flow unsteadiness (Ding and Wang, 2004). The roughness coefficient (n) in natural channels is difficult to determine in field. Various factors affecting the values of roughness coefficients were presented by Chow,
1959). In the present study, the data are taken for the period from (26March-26 May 2014) and divided equally into two sets; the first set is for calibration purpose; i.e., estimation of (n) and the rest for verification.
5- Results and discussion
The initial conditions are the discharge (Q) and stage (h) along Al-Kufa river at initial time computed using the computations of steady state flow using HEC-RAS model as shown in Figs.(5) and (6). The upstream boundary condition for unsteady flow model consists of the observed discharge and stage hydrographs, Fig. (7), at station (20) which was measured at daily intervals. Fig. (8) shows the (XYZ) plot for Al-Kufa River. Friction slope for the normal depth at station (1) as shown in Fig. (9) is used as the downstream boundary condition. In this unsteady flow simulation model, the assumed values of Manning’s roughness
coefficient (n) for Al-Kufa River range between (0.025 and 0.038). The weighting parameter (θ) is applied to the finite difference approximations when solving the unsteady flow equations. A practical limit is from (0.6) to (1). The default value of (θ) in HEC-RAS unsteady flow model is (0.95). The larger value of (θ) should be used to insure greater stability (HEC, 2009). Previous studies on unsteady flow simulation (direct routing) indicate that the value of weighting factor (θ) that gives a stable and accurate solution appears to be (0.95).
Fread et al (1998) reported that by using larger time step (Δt ) and (θ) approaching unity, the implicit finite difference equation becomes more stable. The results of the unsteady hydraulic model show that the values of (n) in the range (0.025-0.034) give the closet agreement between the observed and computed hydrographs. Consequently, a good agreement is obtained with a value of (n=0.032). In the present study, the data is taken during the period from (10 / February / 2014) to (26/ May / 2014) and for calibration purpose, i.e., evaluation of (n), and the rest for verification which is the process of examining the model with actual data to achieve its predictive precision.
In this simulation model, the proposed values of Manning roughness coefficient (n) range between (0.025-0.034). Results of the model for the estimated values of water surface elevation to different values of (n) were compared with observed water surface measured at profiles for sections (7,6,5,4,3,2,1) with discharges of(50, 70,90, 100,130, 160 m3/sec) as shown in Fig.(10). Results of the unsteady model with these values of (n) and specified values of (θ=0.95) and (Δt=1 day) are compared with observed discharge and stage hydrographs measured at station (1) and station (20) as shown in Figs.(11), (12).
509

IJISET - International Journal of Innovative Science, Engineering & Technology, Vol. 1 Issue 10, December 2014.
www.ijiset.com
ISSN 2348 – 7968
40
45
50
55
60
0 5 10 15 20 25
Disc
harg
e(m
3/se
c)
Distance (Km)
Initial discharge along Al-Kufa River
Fig.(5): Discharge profile as initial condition
18.5
19
19.5
20
20.5
21
21.5
22
0 5 10 15 20 25
Stag
e (m
)
Distance (Km)
Initial…
Fig. (6): Stage profile as initial condition
510

IJISET - International Journal of Innovative Science, Engineering & Technology, Vol. 1 Issue 10, December 2014.
www.ijiset.com
ISSN 2348 – 7968
0 2 4 6 8 1020.6
20.8
21.0
21.2
21.4
21.6
21.8
22.0
40
60
80
100
120
140River: kufa Reach: 1 RS: 8
Simulation Time (days)
Stage
(m3/s
)
Flow
Legend
Stage
Flow
8
7.66666*
7.33333*
7
6.8*
6.6*
6.4*
6.2*
6
5.8*
5.6*
5.4*
5.2*
5
4.66666*
4.33333*4
3.75* 3.5*
3.25* 3
2.75* 2.5*
2.25*
2
w ater quality/kufa river Plan: Plan w ater quality 9/21/2014
Legend
WS Max WS
Ground
Bank Sta
Ground
Fig(7): The upstream boundary condition for unsteady flow model consists of the observed discharge and stage hydrographs
Fig.(8):(XYZ) plot for Al-Kufa river
0 1000 2000 3000 4000 5000 600016
17
18
19
20
21
22
w ater quality/kufa river Plan: Plan water quality 9/21/2014
Main Channel Distance (m)
Ele
vatio
n (m
)
Le gen d
EG M ax WS
EG 21 SE P20 13 240 0
W S 2 1SE P20 13 240
W S M ax WS
EG 20 SE P20 13 240 0
W S 2 0SE P20 13 240
EG 19 SE P20 13 240 0
W S 1 9SE P20 13 240
EG 18 SE P20 13 240 0
W S 1 8SE P20 13 240
EG 17 SE P20 13 240 0
W S 1 7SE P20 13 240
EG 16 SE P20 13 240 0
W S 1 6SE P20 13 240
EG 15 SE P20 13 240 0
W S 1 5SE P20 13 240
EG 14 SE P20 13 240 0
W S 1 4SE P20 13 240
EG 13 SE P20 13 240 0
W S 1 3SE P20 13 240
Cr i t 2 1SE P20 13 240
Cr i t M ax WS
Cr i t 2 0SE P20 13 240
Cr i t 1 9SE P20 13 240
Cr i t 1 8SE P20 13 240
Cr i t 1 7SE P20 13 240
Cr i t 1 6SE P20 13 240
Cr i t 1 5SE P20 13 240
Cr i t 1 4SE P20 13 240
Cr i t 1 3SE P20 13 240
Gr oun d
kuf a 1
Fig. (9): The downstream boundary condition
511

IJISET - International Journal of Innovative Science, Engineering & Technology, Vol. 1 Issue 10, December 2014.
www.ijiset.com
ISSN 2348 – 7968
The results of the unsteady flow HEC-RAS model show that the values of (n) in the range (0.028-0.032) give the closest agreement between the observed and
computed hydrographs. Consequently, a good agreement is obtained with a value of (n=0.032).
0
20
40
60
80
100
120
140
160
180
0 10 20 30 40 50 60
Disc
harg
e(m
3/se
c)
Time (Days)
Observed dischargecomputed discharge (n=0.29)Computed discharge(n=0.025)Discharge (n=0.032)
18.5
19
19.5
20
20.5
21
21.5
22
22.5
23
0 10 20 30 40 50 60
Stag
e (m
)
Time (days)
Observed stageComputed stage(n=0.03)Computed Stage(n=0.034)
Fig. (10): computed and observed stage profiles
Fig. (11): Computed and observed discharge for different values of (n)
Fig. (12): Computed and observed stage for different values of (n)
512

IJISET - International Journal of Innovative Science, Engineering & Technology, Vol. 1 Issue 10, December 2014.
www.ijiset.com
ISSN 2348 – 7968
6- Statistical test of the calibration results
A statistical test is used to compare the calculated results with the respective observed ones. The test is the root-mean-square (R.M.S.) test. Table (3) shows the statistical test of the calibration results; the
root mean-square (R.M.S.) values. These values are the results of the comparison between the observed and computed hydrographs: that of the stage at station no. (20) and of the discharge at station no.(1). As listed in Table (1), the values [Δt =1 day; n=0.034] provide the smallest (R.M.S.) value.
Table 1. Statistical test of the calibration results
Station
No.
Δt
n
∑R.M.S.
(Stage)
∑R.M.S.
(Discharge)
20
(Upstream
boundary)
1 day
0.028 0.0.88
* 0.029 0.079
0.03 0.0733
0.031 0.069
0.032 0.061
1
Downstream
boundary
1day
0.028
**
2.114
0.029 3.321
0.03 3.374
0.031 3.991
0.032 1.963
* The discharge used as upstream boundary condition ** The stage used as downstream boundary condition
513

IJISET - International Journal of Innovative Science, Engineering & Technology, Vol. 1 Issue 10, December 2014.
www.ijiset.com
ISSN 2348 – 7968
Model verification, which is an essential test for any simulation model, is achieved by applying it to the second set of data from the period (26March-26 May 2014) using the parameter (n=0.032) derived from the calibration runs. The verification process of the unsteady flow model has been achieved by making a comparison between the observed and computed hydrographs: that of the stage at [station no. (1)] and that of the discharge at [station no. (20)]. These locations have been chosen because there
are measurements at other locations on Al-Kufa River that would suffice. Results of the verification process show that the (n) value of (0.032) reasonably produces hydrographs closer to the observed ones as shown in Fig.(13). Stage hydrograph results at station no. (1) of Al-Kufa river are as shown in Table (2). Analysis of results shows that the (n) value of (0.032) reasonably produces hydrographs closer to the observed ones and this indicates that the model is acceptable.
Table 2. Statistical test of the verification results of the observed and Computed hydrographs (n=0.032)
7- Conclusions Unsteady flow HEC-RAS model is developed for the upper reach of Al-Kufa River to predict the value of Manning’s (n) through calibration procedure. The first geometric data were collected, the basic hydraulic model for the starting reach was
constructed, the results obtained from simulations are in good agreement with the measured data The appropriate value of Manning’s (n) is (0.032), since it gives reasonable agreement between computed and observed hydrographs.
Date For stage hydrograph
at station no.(8)
ΣR.M.S. 26March-26 May 2014 0.093
18.519
19.520
20.521
21.522
0 5 10 15 20 25 30 35
Stag
e (m
)
Time (days)
Observed dischargeComputed Stage(n=0.032)"
Fig. (13): Computed and observed stage (n=0.032)
514

IJISET - International Journal of Innovative Science, Engineering & Technology, Vol. 1 Issue 10, December 2014.
www.ijiset.com
ISSN 2348 – 7968
. Notation Q: Discharge; h: Stage; n: Manning’s roughness coefficient; θ :Weighting factor; Δt: Time interval; Δx: Distance interval. References Abdevei, S. (2013).” Simulation Hydraulic Of Karoun River In Iran With Purpose Indicate Capacity Changes Of River Flow With HEC-RAS Model”. International Research Journal of Applied and Basic Sciences.
Chow, V.T. 1959. Open-channel hydraulics. McGraw-Hill, New York.
Chow, V. T., Maidment, D. and Mays, L.W. 1988. Applied hydrology. McGraw-Hill, New York.
Ding, Y. and Wang, S. Y. 2004. Identification of Manning’s roughness coefficient in channel network using adjoint analysis. National Center for Computational Hydroscience and Engineering, University of Mississippi, USA.
Fenton, J. D. 2002. The application of numerical methods and mathematics to hydrography. Proc.11P
thP Australasian
Hydrographic Conference, 3-6 July, Sydney.
Fread, D.L. and Lewis, J.M. (1998). NWS FLDWAV model. Hydrologic Research Laboratory. Office of Hydrology, National Weather Service (NWS), NOAA.
Gupta, B.L. 2007. Water resources systems and management. 2nd edition.ISBN:81-8014-106-3,Standard Publishers, Delhi. www. Engineering books. co. in
HEC (Hydrologic Engineering Center). 2009. One dimensional unsteady flow through a full network of open channels.
User's manual, U.S. Army Corps of Engineers, Davis, CA. (31TUhttp://www.hec.usace.armyU31T. mil/software/hec-ras/hecrasdownload.html).
KalaBaa,D. Ivana, I. and. Cikara,D,(2014).” The inital analysis of the river IBAR Temperature downstream of the lake GAZIVODE. aFaculty of Mechanical Engineering, University of Pristina, Kosovska Mitrovica, Serbia.
Motlagh,M.,B. , Hassanpourm F. and Tabatabaei, S, M.(2013).” Flood Management of Sistan River using Levee”. Department of Water Engineering, Faculty of Soil and Water, University of Zabol, Zabol, Iran.
Stevenson, D. (2009).”1-D HEC-RAS Model and Sensitivity Analysis for St. Clair River from 1971 – 2007”. International Joint Commission International Upper Great Lakes Study 234 Laurier Ave. W, 22nd Floor Ottawa, ON, K1P 6K6.
515