

EXTRACTING THE MOST FROM URBAN DATA: … Yazici.pdf · EXTRACTING THE MOST FROM URBAN DATA:...
19
EXTRACTING THE MOST FROM URBAN DATA: MULTI-PERSPECTIVE ANALYSIS OF NYC TAXI TRIPS Anil Yazici, Ph.D. Assistant Professor, Civil Engineering, Stony Brook University, NY Ground Transportation Technology Symposium: Big Data and Innovative Solutions for Safe, Efficient and Sustainable Mobility November 19 th 2014
Transcript of EXTRACTING THE MOST FROM URBAN DATA: … Yazici.pdf · EXTRACTING THE MOST FROM URBAN DATA:...
EXTRACTING THE MOST FROM URBAN DATA:MULTI-PERSPECTIVE ANALYSIS OF NYC TAXI TRIPS
Anil Yazici, Ph.D.Assistant Professor, Civil Engineering, Stony Brook University, NY
Ground Transportation Technology Symposium: Big Data and Innovative Solutions for Safe, Efficient and Sustainable Mobility
November 19th 2014
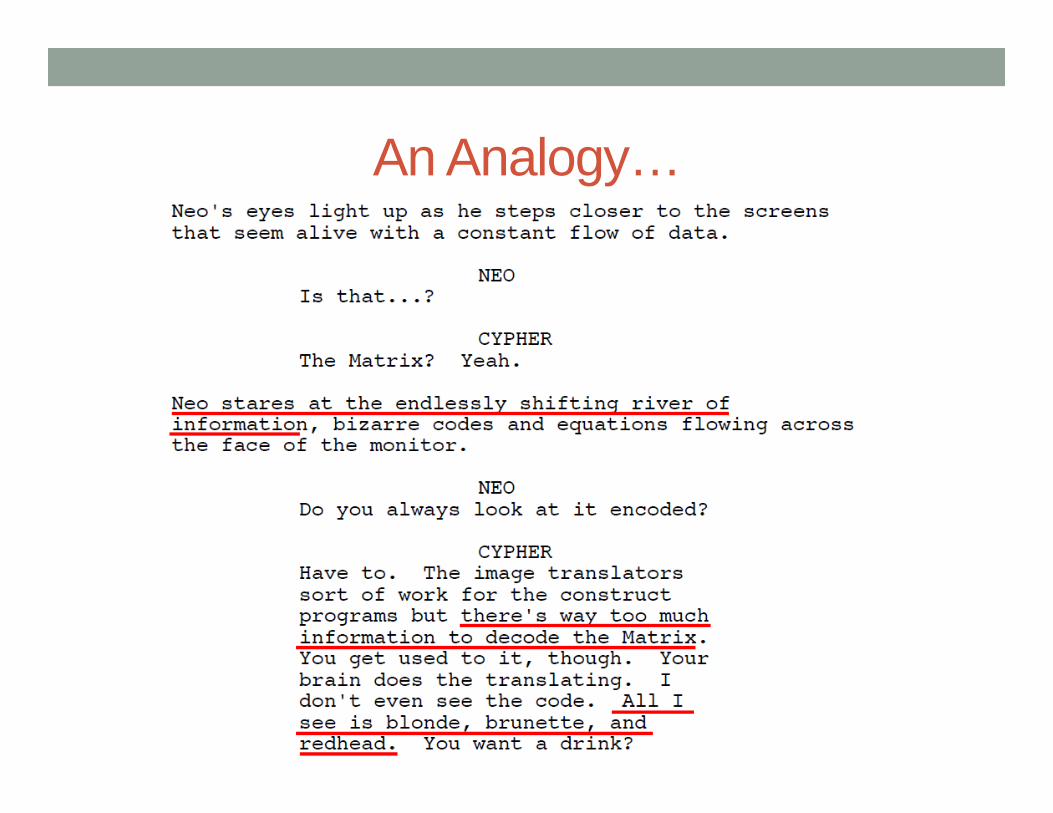
An Analogy…
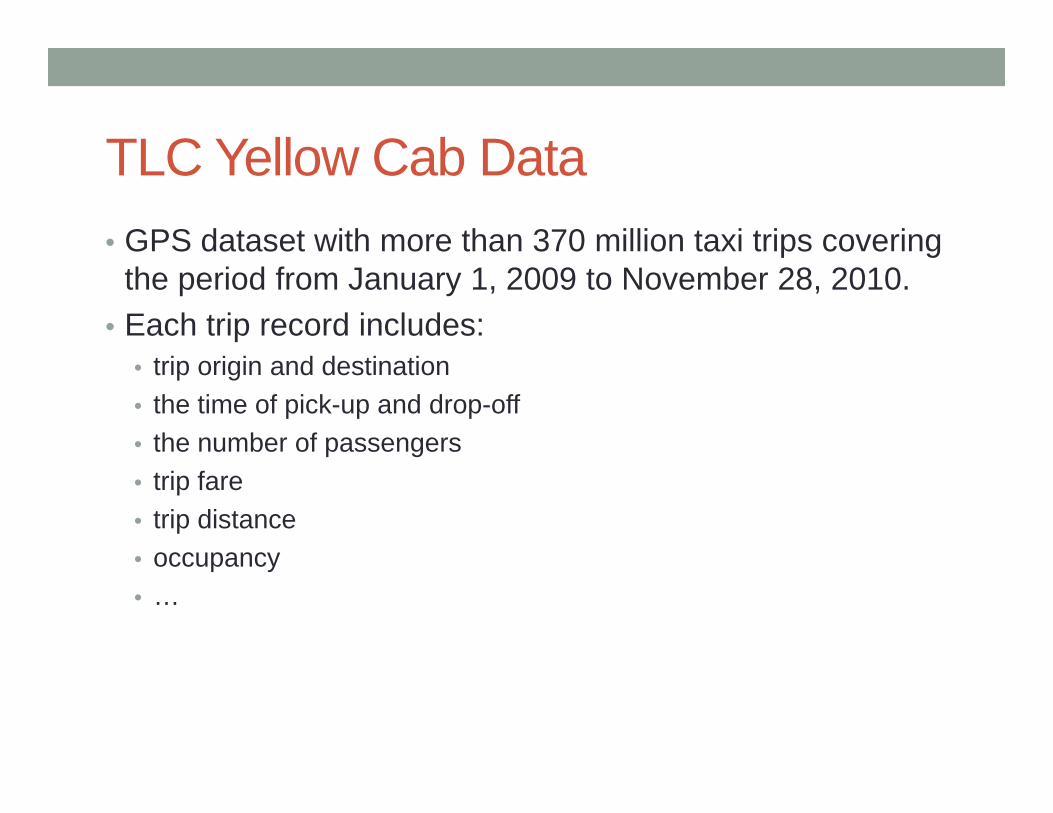
TLC Yellow Cab Data• GPS dataset with more than 370 million taxi trips covering
the period from January 1, 2009 to November 28, 2010. • Each trip record includes:
• trip origin and destination• the time of pick-up and drop-off • the number of passengers • trip fare • trip distance • occupancy• …

How to make sense of taxi data?• Taxi as a taxi Taxi industry, a multi billion $ business
• Taxis as probe vehicles travel time patterns
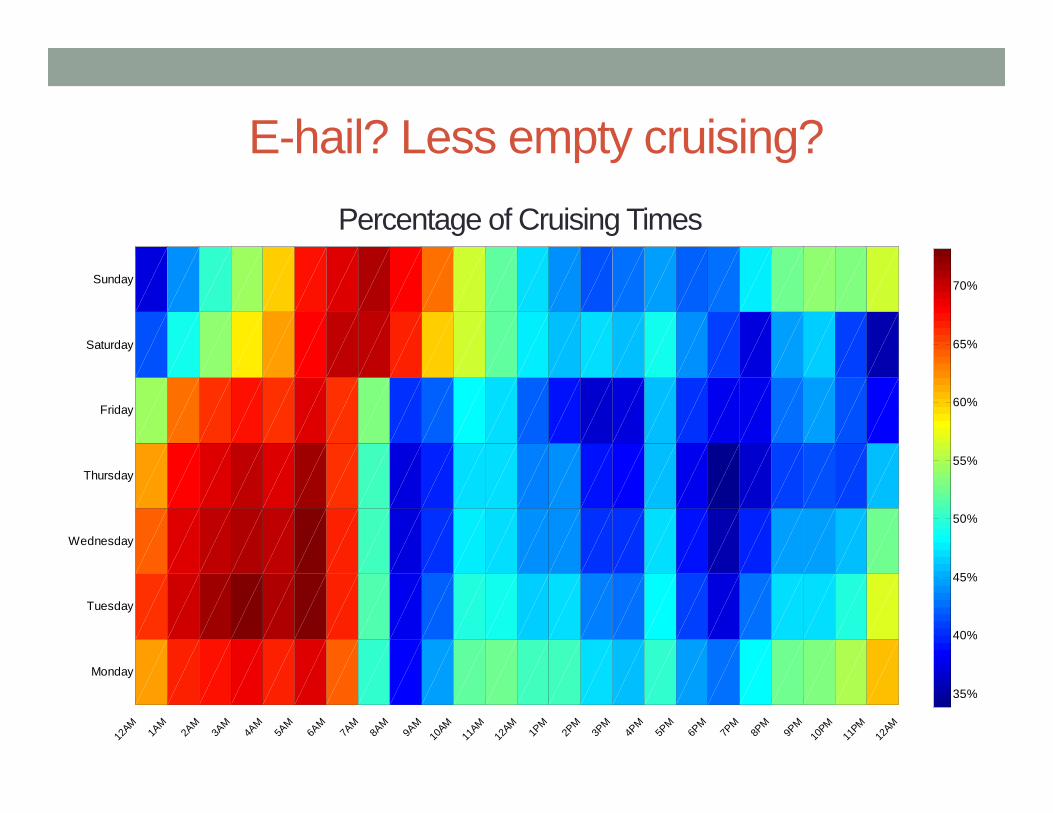
E-hail? Less empty cruising?
Monday
Tuesday
Wednesday
Thursday
Friday
Saturday
Sunday
12AM
1AM
2AM
3AM
4AM
5AM
6AM
7AM
8AM
9AM
10AM
11AM
12AM
1PM
2PM
3PM
4PM
5PM
6PM
7PM
8PM
9PM
10PM
11PM
12AM
35%
40%
45%
50%
55%
60%
65%
70%
Percentage of Cruising Times

Cruising for Passenger Under Different Weather Conditions
0
10
20
30
40
50
60
70
80
12AM-1AM
1AM-2AM2AM-3AM3AM-4AM4AM-5AM5AM-6AM6AM-7AM7AM-8AM8AM-9AM9AM-10AM10A
M-11AM
11AM-12P
M12P
M-1PM1PM-2PM2PM-3PM3PM-4PM4PM-5PM5PM-6PM6PM-7PM7PM-8PM8PM-9PM9PM-10PM10P
M-11PM
11PM-12A
MP
ER
CE
NTA
GE
OF
CR
UIS
ING
TIM
E
CRUISING TIME PERCENTAGE PER DRIVER
Clear Light Rain Moderate Rain Heavy Rain
Taxi Shortage at the Airports• In New York City (NYC), taxis carry 35% and 23% of all
airport bound passengers to LaGuardia (LGA) and John F. Kennedy airports respectively
• Long passenger queues for taxis at JFK• Airport accessibility may affect travelers’ airport decision
among competing airports in a region would be a problem for airlines using a particular airport as a hub
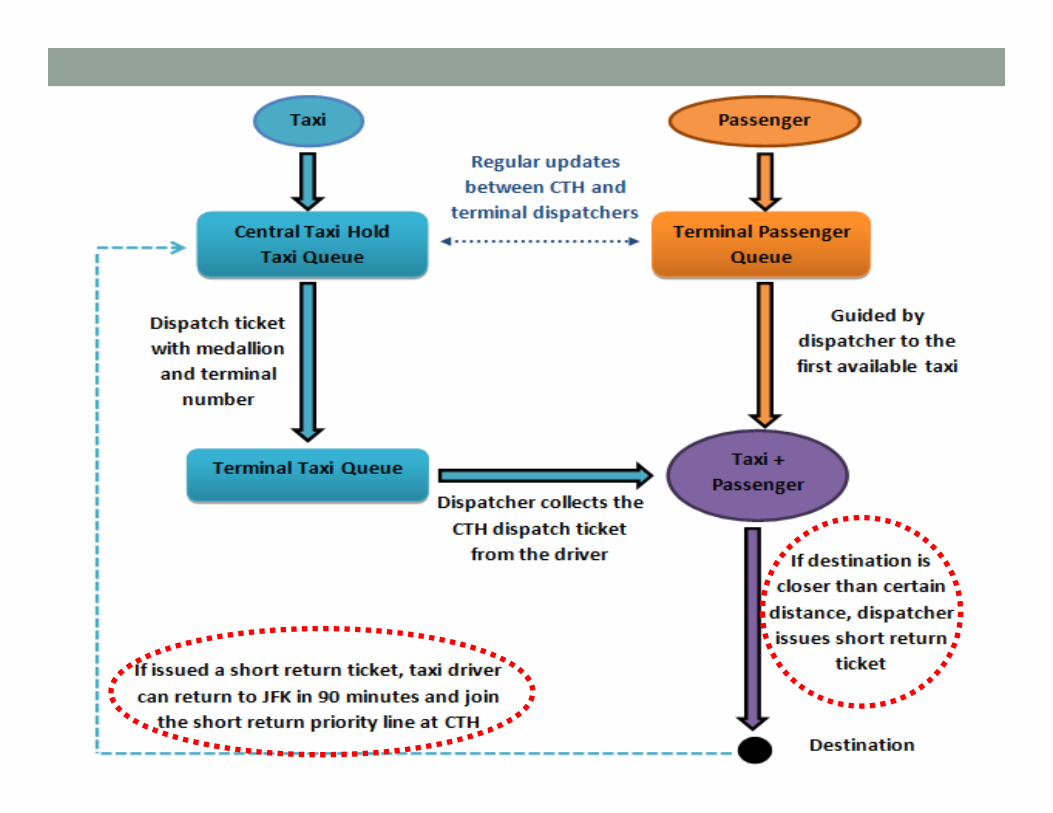
Taxi Operations at JFK
Taxi Driver Airport Pick-up Decision Model• Decision: To go or not to go to JFK for passenger pick-up
• Decision is made at the end of each trip, i.e. dropping off a passenger
• Binary variable Appropriate for logistic regression
POSSIBLE POLICIES FOR IMPROVED AIRPORT GROUND ACCESS
• Time-of-Day, Day-of-Week, Location, Weather affect the probability of airport pick up Not much to suggest
• Still good to know the drivers’ decision mechanism• We know the condition during which the drivers are less likely to go
JFK Incentives?
• Fare increase?• Impact of fare increase is found to be very marginal• Instead of fare increase, efficient dispatching can achieve more
• Drivers with short return ticket are ~43 times more likely to make airport pickups • More short return tickets? But how?
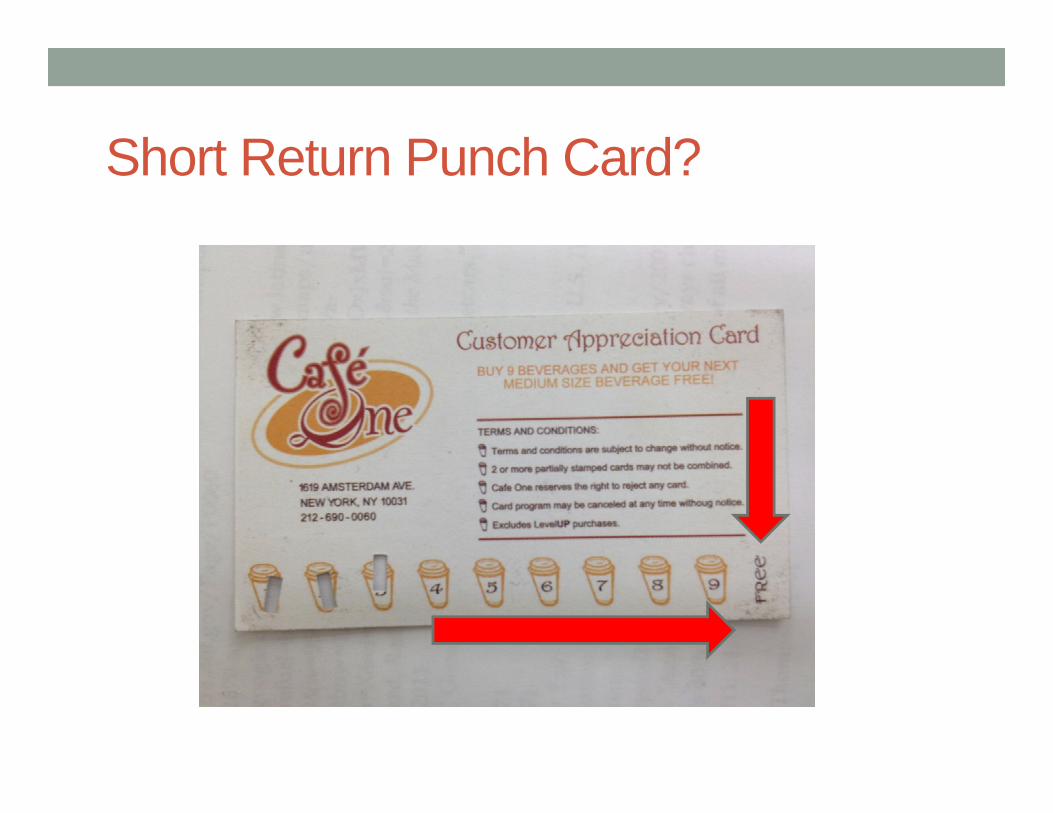
Short Return Punch Card?
Taxis as Probe Vehicles: Travel Time, Congestion, Delay…
• Value of travel time (VOT), Value of travel time reliability (VOR) Toll pricing, congestion pricing Economic evaluation of transport projects
• Actual vs. Perceived travel time Objective vs. Subjective travel time Travel decisions; time, mode…
Taxi GPS data with almost 400 million records provides good basis for objective travel times

Travel Time Patterns in NYC
MondayTuesday
WednesdayThursday
FridaySaturday
SundayCOV OF AVERAGE TRAVEL TIMES
12AM1A
M2A
M3A
M4A
M5A
M6A
M7A
M8A
M9A
M10
AM11
AM12
AM1P
M2P
M3P
M4P
M5P
M6P
M7P
M8P
M9P
M10
PM11
PM12
AM
0.50.550.6
MondayTuesday
WednesdayThursday
FridaySaturday
SundayACTUAL AVERAGE TRAVEL TIMES
12AM1A
M2A
M3A
M4A
M5A
M6A
M7A
M8A
M9A
M10
AM11
AM12
AM1P
M2P
M3P
M4P
M5P
M6P
M7P
M8P
M9P
M10
PM11
PM12
AM
4
6
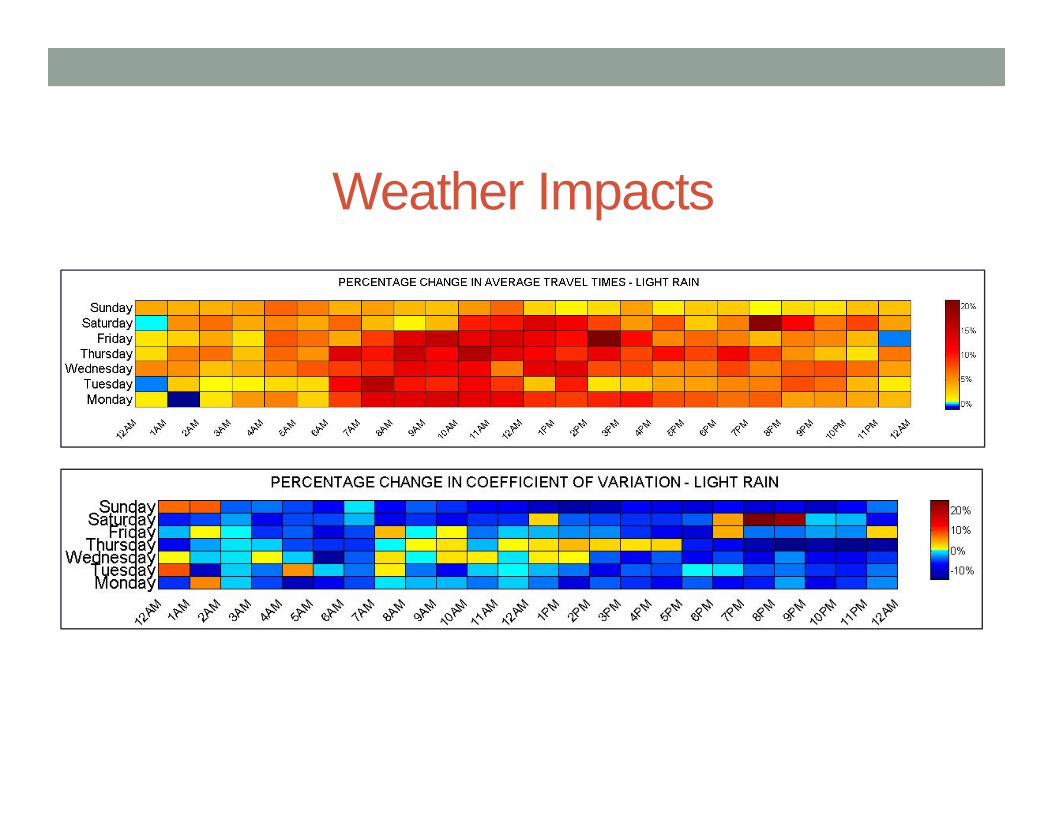
Weather Impacts
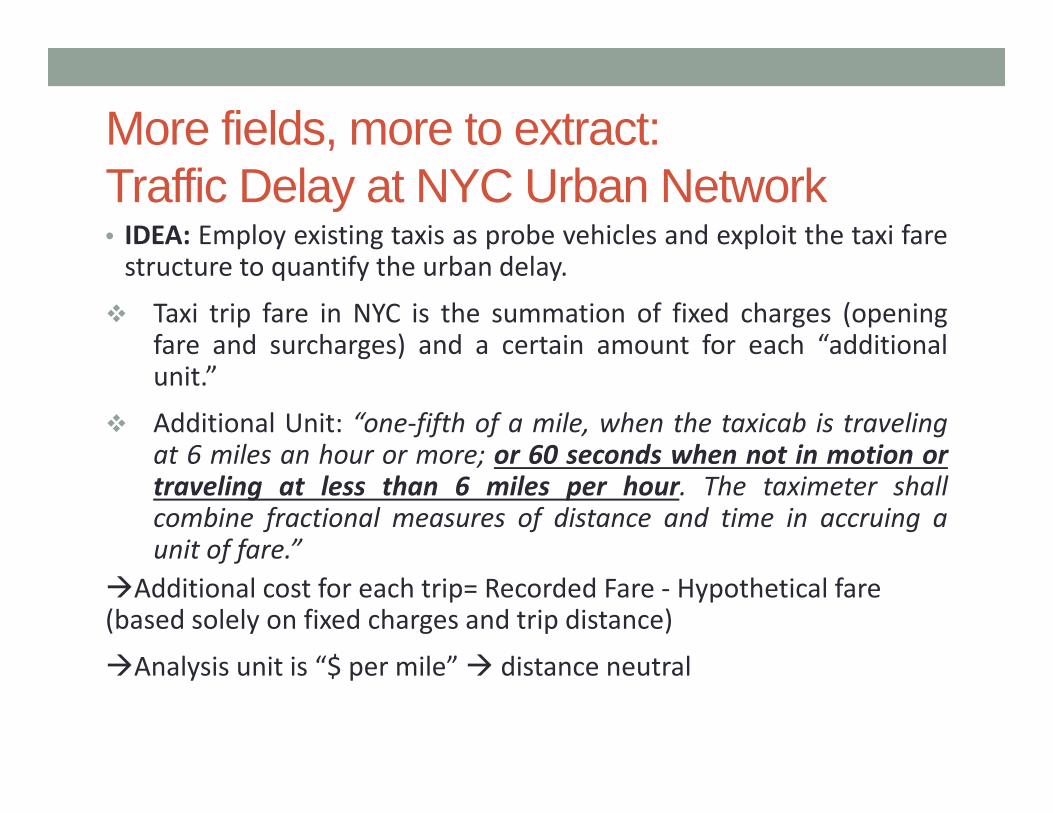
More fields, more to extract: Traffic Delay at NYC Urban Network• IDEA: Employ existing taxis as probe vehicles and exploit the taxi farestructure to quantify the urban delay.
Taxi trip fare in NYC is the summation of fixed charges (openingfare and surcharges) and a certain amount for each “additionalunit.”
Additional Unit: “one‐fifth of a mile, when the taxicab is travelingat 6 miles an hour or more; or 60 seconds when not in motion ortraveling at less than 6 miles per hour. The taximeter shallcombine fractional measures of distance and time in accruing aunit of fare.”
Additional cost for each trip= Recorded Fare ‐ Hypothetical fare (based solely on fixed charges and trip distance)
Analysis unit is “$ per mile” distance neutral
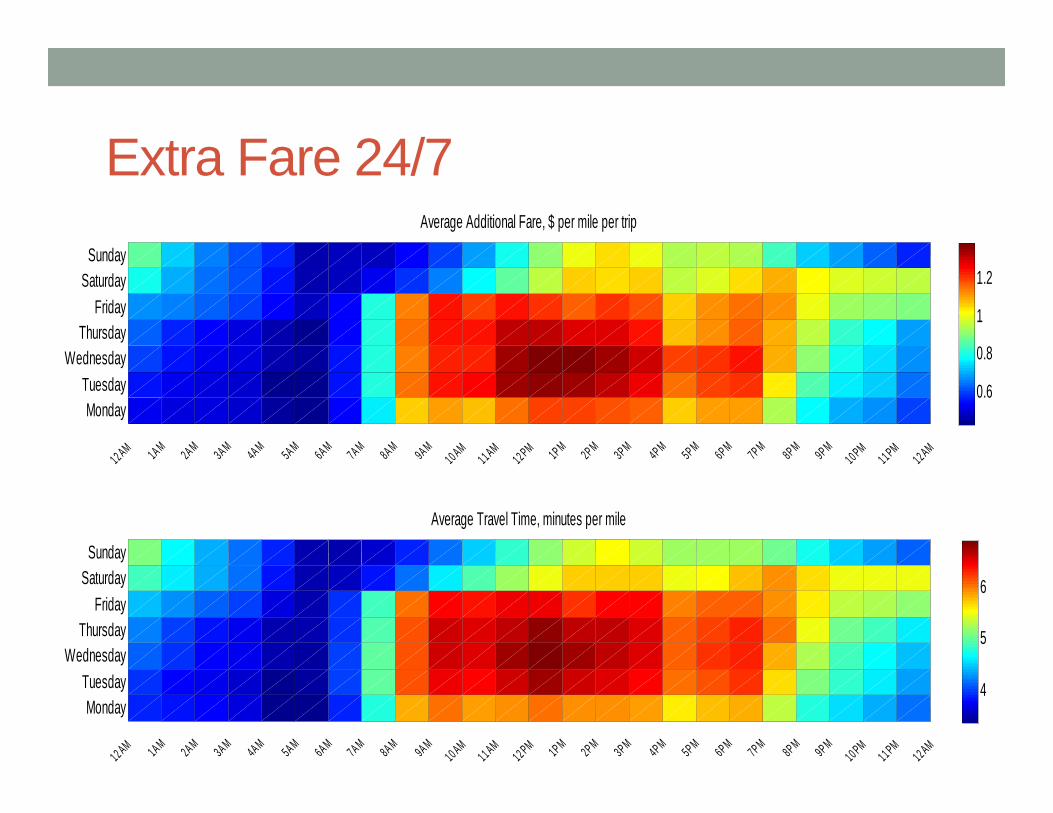
Extra Fare 24/7
MondayTuesday
WednesdayThursday
FridaySaturday
Sunday
12AM 1AM 2AM 3AM 4AM 5AM 6AM 7AM 8AM 9AM
10 AM
11AM
12PM 1PM 2PM 3PM 4PM 5PM 6PM 7PM 8PM 9PM
10PM
11PM
12AM
Average Additional Fare, $ per mile per trip
MondayTuesday
WednesdayThursday
FridaySaturday
Sunday
12AM 1AM 2AM 3AM 4AM 5AM 6AM 7AM 8AM 9AM
10 AM
11AM
12PM 1PM 2PM 3PM 4PM 5PM 6PM 7PM 8PM 9PM
10PM
11PM
12AM
Average Travel Time, minutes per mile
0.6
0.8
1
1.2
4
5
6
Causes of Delay Assumption: Additional fare between 5AM-6AM ≈ signal delay
only
Literature: Peak-hour signal delay ≈ 1.57 x off-peak signal delay
Recurrent congestion delay = Additional fare under clear weather – signal delay
Weather related delay = Total additional fare under rain - Additional fare under clear weather
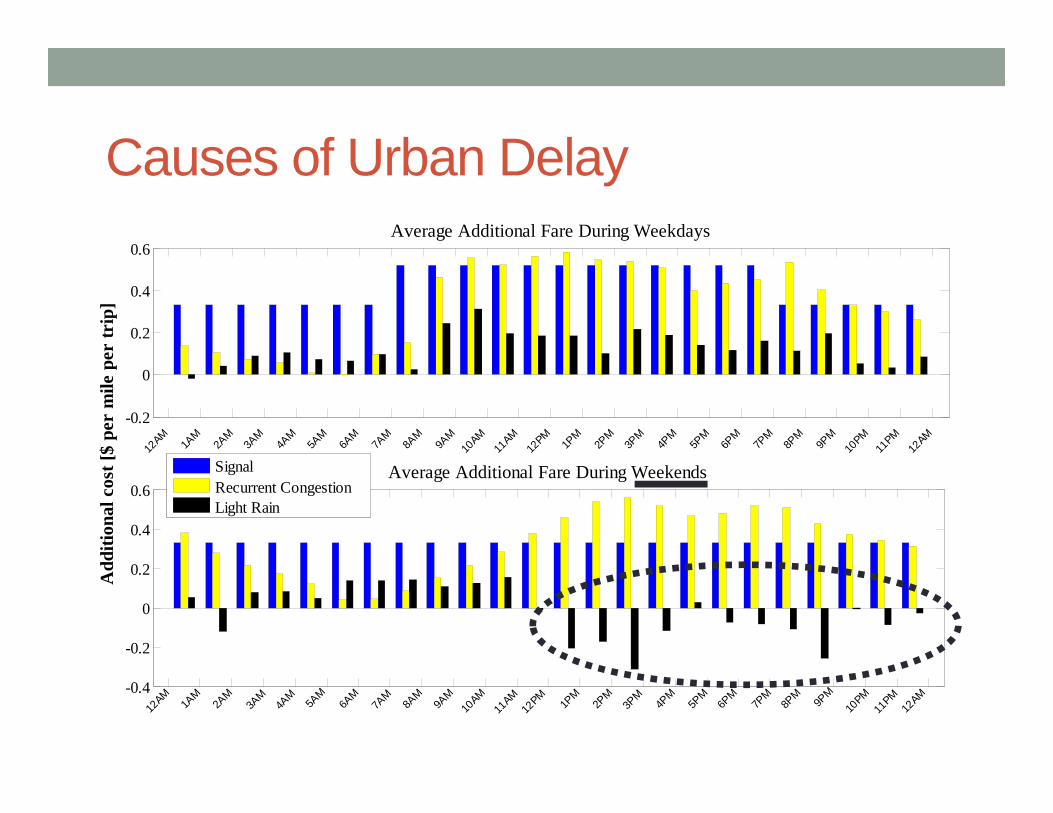
Causes of Urban Delay
-0.2
0
0.2
0.4
0.6
12AM
1AM
2AM
3AM
4AM
5AM
6AM
7AM
8AM
9AM
10AM
11AM
12PM
1PM
2PM
3PM
4PM
5PM
6PM
7PM
8PM
9PM
10PM
11PM
12AM
Average Additional Fare During Weekdays
-0.4
-0.2
0
0.2
0.4
0.6
12AM
1AM
2AM
3AM
4AM
5AM
6AM
7AM
8AM
9AM
10AM
11AM
12PM
1PM
2PM
3PM
4PM
5PM
6PM
7PM
8PM
9PM
10PM
11PM
12AM
Add
ition
al c
ost [
$ pe
r m
ile p
er tr
ip]
Average Additional Fare During WeekendsSignal
Recurrent CongestionLight Rain