Singular Value Decomposition A = (orthogonal) (diagonal) (orthogonal) 8)
EXTRACTING ORTHOGONAL BUILDING OBJECTS IN URBAN AREAS FROM HIGH RESOLUTION STEREO SATELLITE IMAGE PAIRS
Thomas Kraußa, Peter Reinartza, Uwe Stillab
a German Aerospace Center (DLR), Remote Sensing Technology Institute PO Box 1116, 82230 Weßling, Germany
b Technische Universität München, Arcisstr. 21, 80290 München, Germany [email protected]
Commission III, WG III/4
KEY WORDS: VHR data, stereo images, digital surface models, classification, urban modeling, building extraction ABSTRACT: Since the number of urban residents is rapidly increasing, especially in developing countries, relatively cheap and fast methods for modeling and mapping such cities are required. Besides the creation and updating of maps from sprawling cities three dimensional models are useful for simulation, monitoring and planning in case of catastrophic events like flooding, tsunamis or earthquakes. With the availability of very high resolution (VHR) stereo satellite data investigations of large urban areas regarding their three-dimensional shape can be performed fast and relatively cheap in comparison to aerial photography – especially for cities in developing countries. Most of the methods actually used for the generation of city models depend on a large amount of interactive work and mostly also on additional information like building footprints and so on. A method for a fully automatic derivation of relatively coarse and simple models of urban structure is therefore of great use. In this paper one approach for such an automatic modeling and a processing chain is sketched and the method used for the modeling of buildings is described.
1 INTRODUCTION
Urban areas all around the world – especially in developing countries – grow rapidly. So more and more 3D models of large city areas are needed for planning and monitoring purposes. For the usage in developing countries such models should be relatively cheap and can be relatively simple. This can be achieved by a fully automatically generation from very high resolution (VHR) satellite image stereo pairs from satellites like Ikonos, QuickBird or the upcoming WorldView series [DigitalGlobe, 2007].
Starting with a stereo scene – a very high resolution satellite image pair – it is possible to generate in a first step a high resolution digital surface model (DSM) by suitable stereo evaluation of the image pair ([Lehner and Gill, 1992], [Krauß et al., 2005], [Hirschmüller, 2005]). Since the ground resolution of the satellites is in the range of one meter the resolution of the surface model is rather coarse in comparison to surface models from airborne camera or lidar data.
Furthermore there exists no additional data in rapidly growing cities. So the proposed automatic process is often limited to only one single stereo image pair. From this only source of information all needed parameters for the generation of a – in a first step coarse – city model have to be extracted.
After the generation of the DSM a digital terrain model (DTM) can be derived from the surface model giving the ground plane (without buildings/trees etc.). Using the high resolution DSM and the satellite images also a true orthophoto can be calculated. Since the satellite data contain four channels (blue, green, red, near infrared) a simple classification based on the orthophoto can be accomplished. This classification uses only a mask of high objects derived from the DSM and DTM and a vegetation
mask calculated from the NDVI of the orthophoto [Krauß et al., 2007].
From this classification all high, non-vegetation objects can be extracted and modeled as described in this paper.
Currently already many approaches exist for city modeling. But these methods are mostly based on cadastral data, aerial images, aerial and terrestrial laser scanner data, terrestrial photographs and more information since the aim of these methods are near photorealistic city models in industrial countries. These models integrate data from several of these sources in often intense manual work for the urban models [CyberCity, 2007, 3D Geo, 2007].
In this paper one part of this processing chain – the automatic extraction of buildings – is described. Many approaches exist which use high resolution airborne lidar data or digital image data. A method often used is the calculation of tensors of inertia and their eigenvectors as main axes of a building. This and a search for maximum diameters of objects and rectangular deviations for describing building outlines as described in [Müller, Zaum, 2005] work only well for convex buildings. A better top-down approach is the recursive rectangle approximation as shown by [Gross, U. et al., 2005]. But in this paper a bottom-up approach for the building outline extraction will be described.
In the approach described here rather simple urban 3D models are generated only from one stereo satellite image pair. Such images are provided at the moment, e.g., by Space Imaging (Ikonos, [SpaceImaging/GeoEye, 2007]) with a ground resolution of about 1 meter panchromatic and 4 m multispectral or in the near future, e.g. by WorldView I (2007) and II (2008), offering half-meter panchromatic and 1.4 to 1.8 m multispectral resolution ([DigitalGlobe, 2007]).
In: Stilla U et al (Eds) PIA07. International Archives of Photogrammetry, Remote Sensing and Spatial Information Sciences, 36 (3/W49B)¯¯¯¯¯¯¯¯¯¯¯¯¯¯¯¯¯¯¯¯¯¯¯¯¯¯¯¯¯¯¯¯¯¯¯¯¯¯¯¯¯¯¯¯¯¯¯¯¯¯¯¯¯¯¯¯¯¯¯¯¯¯¯¯¯¯¯¯¯¯¯¯¯¯¯¯¯¯¯¯¯¯¯¯¯¯¯¯¯¯¯¯¯¯¯¯¯¯¯¯¯¯¯¯¯¯¯¯¯
77
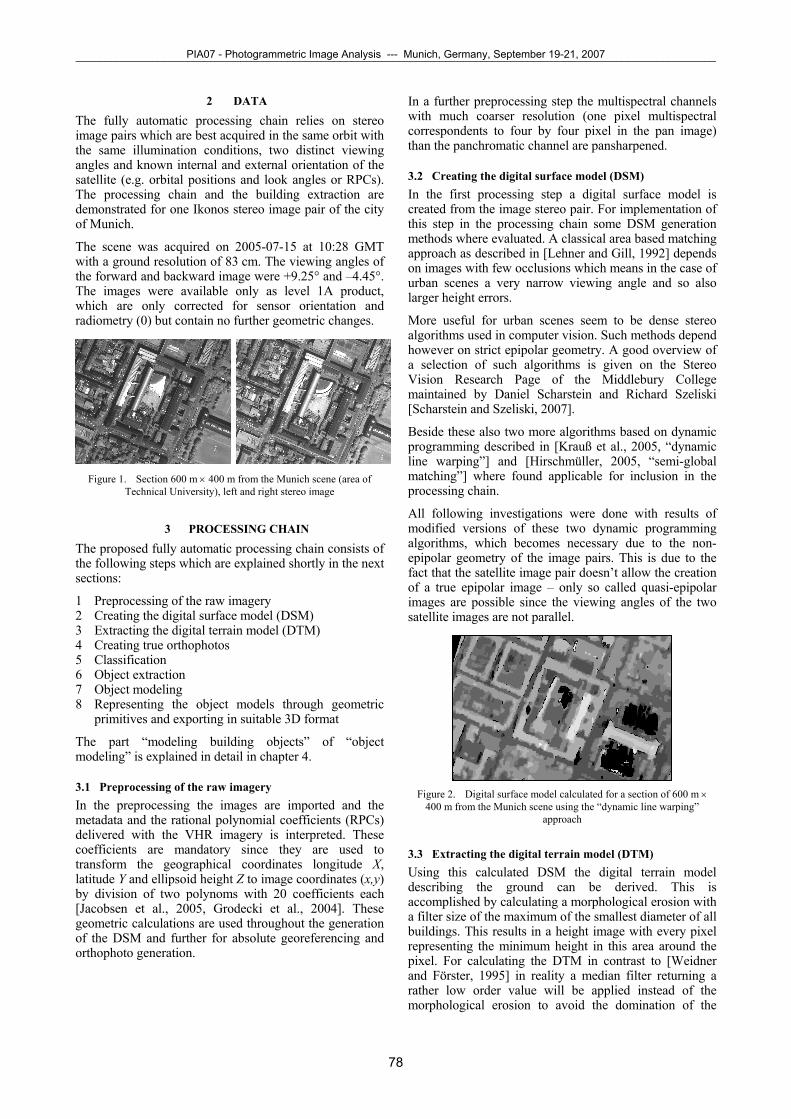
2 DATA
The fully automatic processing chain relies on stereo image pairs which are best acquired in the same orbit with the same illumination conditions, two distinct viewing angles and known internal and external orientation of the satellite (e.g. orbital positions and look angles or RPCs). The processing chain and the building extraction are demonstrated for one Ikonos stereo image pair of the city of Munich.
The scene was acquired on 2005-07-15 at 10:28 GMT with a ground resolution of 83 cm. The viewing angles of the forward and backward image were +9.25° and –4.45°. The images were available only as level 1A product, which are only corrected for sensor orientation and radiometry (0) but contain no further geometric changes.
Figure 1. Section 600 m × 400 m from the Munich scene (area of
Technical University), left and right stereo image
3 PROCESSING CHAIN
The proposed fully automatic processing chain consists of the following steps which are explained shortly in the next sections:
1 Preprocessing of the raw imagery 2 Creating the digital surface model (DSM) 3 Extracting the digital terrain model (DTM) 4 Creating true orthophotos 5 Classification 6 Object extraction 7 Object modeling 8 Representing the object models through geometric
primitives and exporting in suitable 3D format
The part “modeling building objects” of “object modeling” is explained in detail in chapter 4.
3.1 Preprocessing of the raw imagery In the preprocessing the images are imported and the metadata and the rational polynomial coefficients (RPCs) delivered with the VHR imagery is interpreted. These coefficients are mandatory since they are used to transform the geographical coordinates longitude X, latitude Y and ellipsoid height Z to image coordinates (x,y) by division of two polynoms with 20 coefficients each [Jacobsen et al., 2005, Grodecki et al., 2004]. These geometric calculations are used throughout the generation of the DSM and further for absolute georeferencing and orthophoto generation.
In a further preprocessing step the multispectral channels with much coarser resolution (one pixel multispectral correspondents to four by four pixel in the pan image) than the panchromatic channel are pansharpened.
3.2 Creating the digital surface model (DSM) In the first processing step a digital surface model is created from the image stereo pair. For implementation of this step in the processing chain some DSM generation methods where evaluated. A classical area based matching approach as described in [Lehner and Gill, 1992] depends on images with few occlusions which means in the case of urban scenes a very narrow viewing angle and so also larger height errors.
More useful for urban scenes seem to be dense stereo algorithms used in computer vision. Such methods depend however on strict epipolar geometry. A good overview of a selection of such algorithms is given on the Stereo Vision Research Page of the Middlebury College maintained by Daniel Scharstein and Richard Szeliski [Scharstein and Szeliski, 2007].
Beside these also two more algorithms based on dynamic programming described in [Krauß et al., 2005, “dynamic line warping”] and [Hirschmüller, 2005, “semi-global matching”] where found applicable for inclusion in the processing chain.
All following investigations were done with results of modified versions of these two dynamic programming algorithms, which becomes necessary due to the non-epipolar geometry of the image pairs. This is due to the fact that the satellite image pair doesn’t allow the creation of a true epipolar image – only so called quasi-epipolar images are possible since the viewing angles of the two satellite images are not parallel.
Figure 2. Digital surface model calculated for a section of 600 m ×
400 m from the Munich scene using the “dynamic line warping” approach
3.3 Extracting the digital terrain model (DTM) Using this calculated DSM the digital terrain model describing the ground can be derived. This is accomplished by calculating a morphological erosion with a filter size of the maximum of the smallest diameter of all buildings. This results in a height image with every pixel representing the minimum height in this area around the pixel. For calculating the DTM in contrast to [Weidner and Förster, 1995] in reality a median filter returning a rather low order value will be applied instead of the morphological erosion to avoid the domination of the
PIA07 - Photogrammetric Image Analysis --- Munich, Germany, September 19-21, 2007¯¯¯¯¯¯¯¯¯¯¯¯¯¯¯¯¯¯¯¯¯¯¯¯¯¯¯¯¯¯¯¯¯¯¯¯¯¯¯¯¯¯¯¯¯¯¯¯¯¯¯¯¯¯¯¯¯¯¯¯¯¯¯¯¯¯¯¯¯¯¯¯¯¯¯¯¯¯¯¯¯¯¯¯¯¯¯¯¯¯¯¯¯¯¯¯¯¯¯¯¯¯¯¯¯¯¯¯¯
78
generated DTM by single outliers from the calculated DSM. After filtering an averaging using the same filter size is applied to obtain a smoother DTM. In the Munich example parts above the DTM are reduced to a flat plane on street level
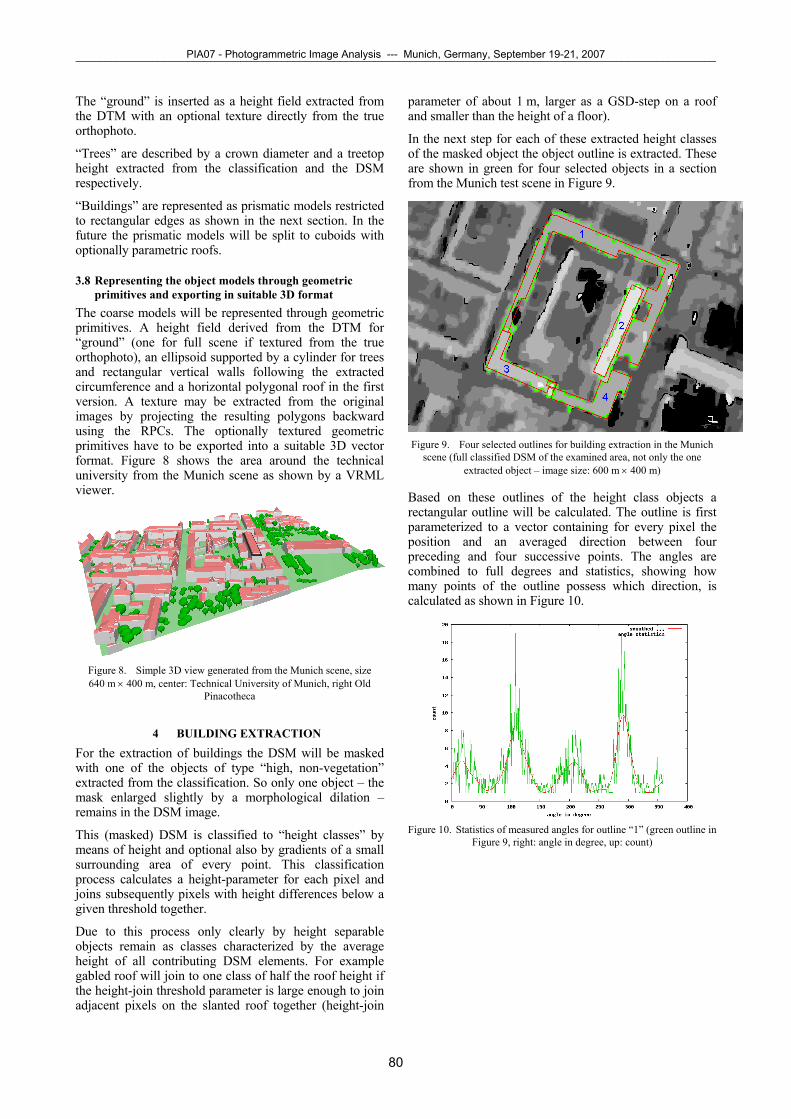
3.4 Creating true orthophotos Thanks to the rather dense DSM, the RPCs from the original imagery and the pansharpened multi-spectral stereo images it is possible to derive true orthophotos.
Figure 3. Pan sharpened orthophoto based on the left stereo image and
the DSM from the Munich scene
3.5 Classification Calculating the difference image between DSM and DTM and applying a threshold of “high” (about 4 m) gives the so called “high objects mask” as shown in Figure 4.
Figure 4. High objects mask calculated from the DSM and the derived
DTM applying a height threshold of 4 m (section 600 m × 400 m)
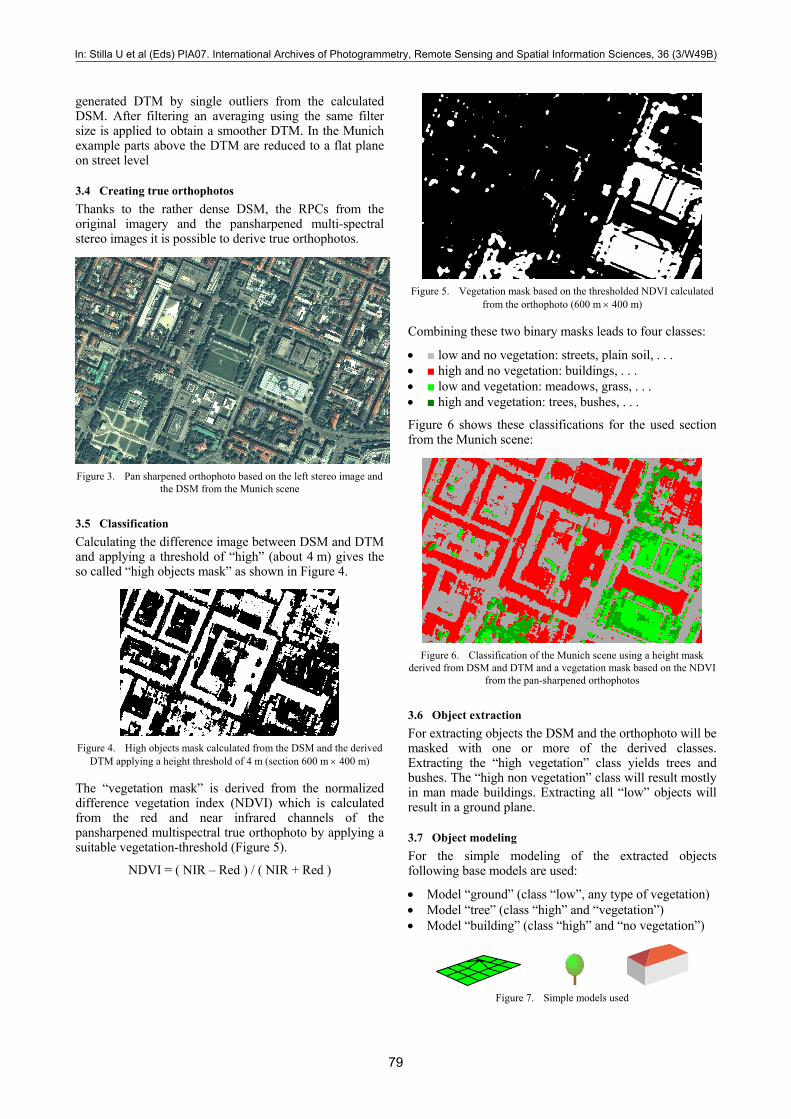
The “vegetation mask” is derived from the normalized difference vegetation index (NDVI) which is calculated from the red and near infrared channels of the pansharpened multispectral true orthophoto by applying a suitable vegetation-threshold (Figure 5).
NDVI = ( NIR – Red ) / ( NIR + Red )
Figure 5. Vegetation mask based on the thresholded NDVI calculated
from the orthophoto (600 m × 400 m)
Combining these two binary masks leads to four classes:
• ■ low and no vegetation: streets, plain soil, . . . • ■ high and no vegetation: buildings, . . . • ■ low and vegetation: meadows, grass, . . . • ■ high and vegetation: trees, bushes, . . .
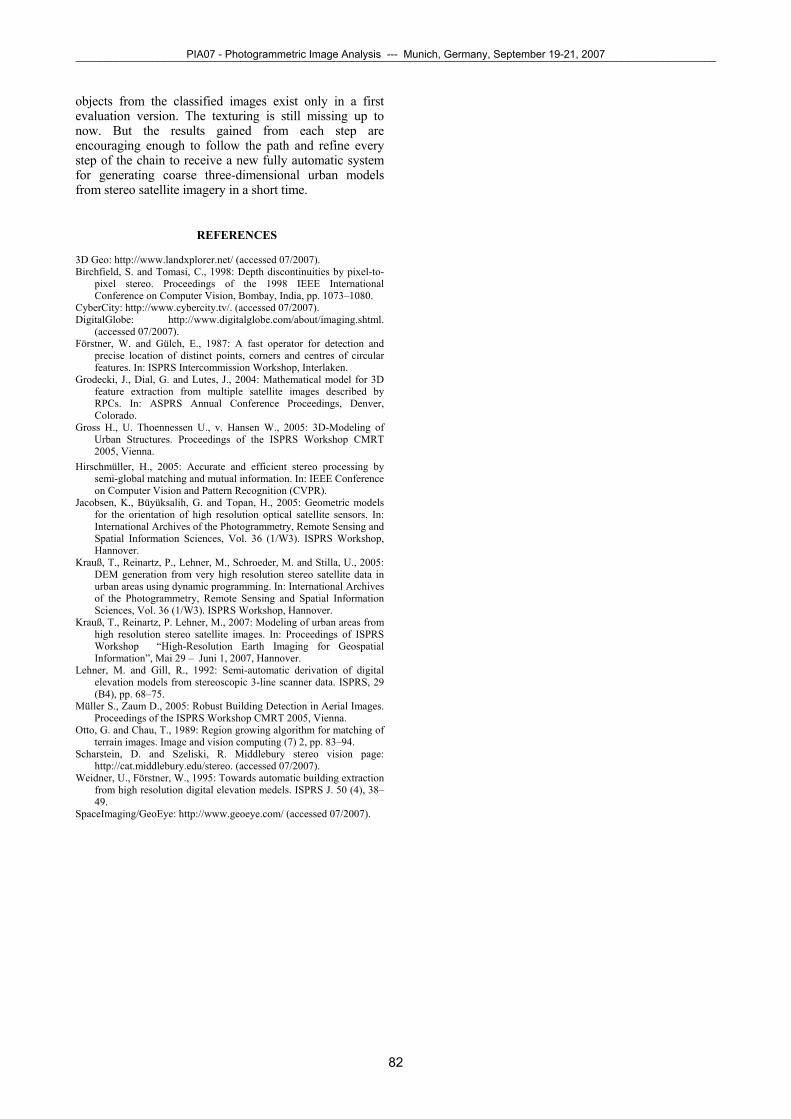
Figure 6 shows these classifications for the used section from the Munich scene:
Figure 6. Classification of the Munich scene using a height mask
derived from DSM and DTM and a vegetation mask based on the NDVI from the pan-sharpened orthophotos
3.6 Object extraction For extracting objects the DSM and the orthophoto will be masked with one or more of the derived classes. Extracting the “high vegetation” class yields trees and bushes. The “high non vegetation” class will result mostly in man made buildings. Extracting all “low” objects will result in a ground plane.
3.7 Object modeling For the simple modeling of the extracted objects following base models are used:
• Model “ground” (class “low”, any type of vegetation) • Model “tree” (class “high” and “vegetation”) • Model “building” (class “high” and “no vegetation”)
Figure 7. Simple models used
In: Stilla U et al (Eds) PIA07. International Archives of Photogrammetry, Remote Sensing and Spatial Information Sciences, 36 (3/W49B)¯¯¯¯¯¯¯¯¯¯¯¯¯¯¯¯¯¯¯¯¯¯¯¯¯¯¯¯¯¯¯¯¯¯¯¯¯¯¯¯¯¯¯¯¯¯¯¯¯¯¯¯¯¯¯¯¯¯¯¯¯¯¯¯¯¯¯¯¯¯¯¯¯¯¯¯¯¯¯¯¯¯¯¯¯¯¯¯¯¯¯¯¯¯¯¯¯¯¯¯¯¯¯¯¯¯¯¯¯
79
The “ground” is inserted as a height field extracted from the DTM with an optional texture directly from the true orthophoto.
“Trees” are described by a crown diameter and a treetop height extracted from the classification and the DSM respectively.
“Buildings” are represented as prismatic models restricted to rectangular edges as shown in the next section. In the future the prismatic models will be split to cuboids with optionally parametric roofs.
3.8 Representing the object models through geometric primitives and exporting in suitable 3D format
The coarse models will be represented through geometric primitives. A height field derived from the DTM for “ground” (one for full scene if textured from the true orthophoto), an ellipsoid supported by a cylinder for trees and rectangular vertical walls following the extracted circumference and a horizontal polygonal roof in the first version. A texture may be extracted from the original images by projecting the resulting polygons backward using the RPCs. The optionally textured geometric primitives have to be exported into a suitable 3D vector format. Figure 8 shows the area around the technical university from the Munich scene as shown by a VRML viewer.
Figure 8. Simple 3D view generated from the Munich scene, size 640 m × 400 m, center: Technical University of Munich, right Old
Pinacotheca
4 BUILDING EXTRACTION
For the extraction of buildings the DSM will be masked with one of the objects of type “high, non-vegetation” extracted from the classification. So only one object – the mask enlarged slightly by a morphological dilation – remains in the DSM image.
This (masked) DSM is classified to “height classes” by means of height and optional also by gradients of a small surrounding area of every point. This classification process calculates a height-parameter for each pixel and joins subsequently pixels with height differences below a given threshold together.
Due to this process only clearly by height separable objects remain as classes characterized by the average height of all contributing DSM elements. For example gabled roof will join to one class of half the roof height if the height-join threshold parameter is large enough to join adjacent pixels on the slanted roof together (height-join
parameter of about 1 m, larger as a GSD-step on a roof and smaller than the height of a floor).
In the next step for each of these extracted height classes of the masked object the object outline is extracted. These are shown in green for four selected objects in a section from the Munich test scene in Figure 9.
Figure 9. Four selected outlines for building extraction in the Munich
scene (full classified DSM of the examined area, not only the one extracted object – image size: 600 m × 400 m)
Based on these outlines of the height class objects a rectangular outline will be calculated. The outline is first parameterized to a vector containing for every pixel the position and an averaged direction between four preceding and four successive points. The angles are combined to full degrees and statistics, showing how many points of the outline possess which direction, is calculated as shown in Figure 10.
Figure 10. Statistics of measured angles for outline “1” (green outline in
Figure 9, right: angle in degree, up: count)
PIA07 - Photogrammetric Image Analysis --- Munich, Germany, September 19-21, 2007¯¯¯¯¯¯¯¯¯¯¯¯¯¯¯¯¯¯¯¯¯¯¯¯¯¯¯¯¯¯¯¯¯¯¯¯¯¯¯¯¯¯¯¯¯¯¯¯¯¯¯¯¯¯¯¯¯¯¯¯¯¯¯¯¯¯¯¯¯¯¯¯¯¯¯¯¯¯¯¯¯¯¯¯¯¯¯¯¯¯¯¯¯¯¯¯¯¯¯¯¯¯¯¯¯¯¯¯¯
80
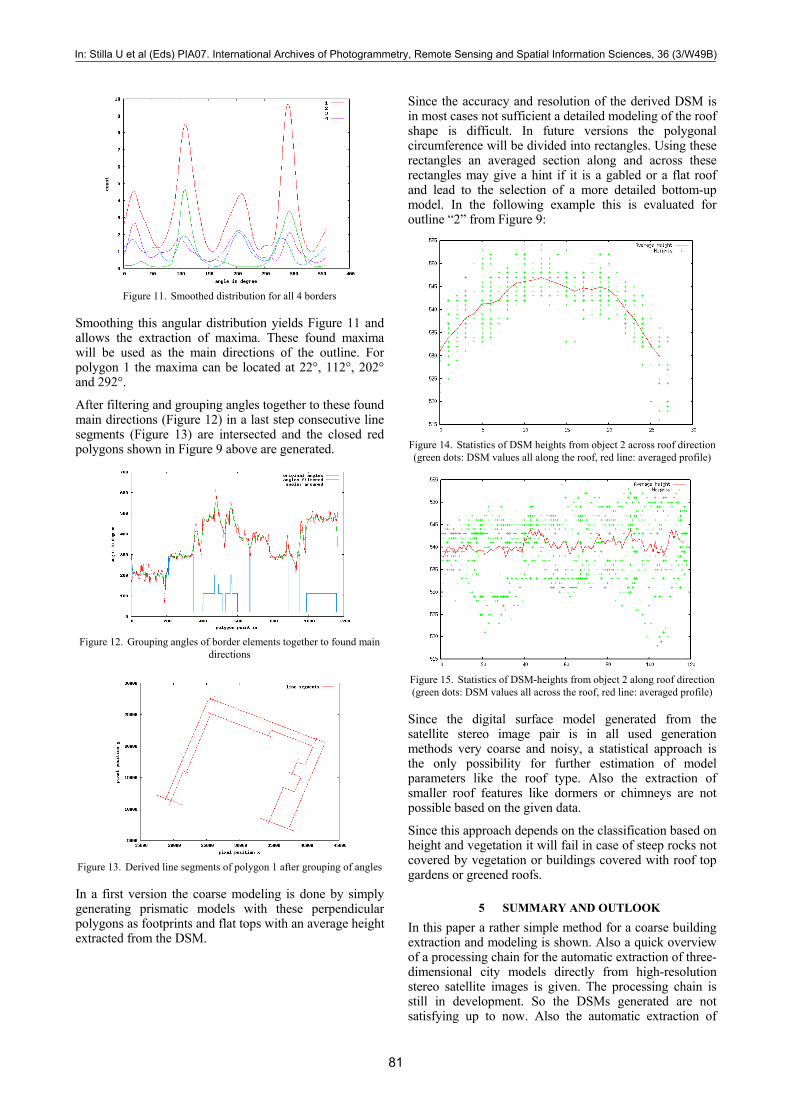
Figure 11. Smoothed distribution for all 4 borders
Smoothing this angular distribution yields Figure 11 and allows the extraction of maxima. These found maxima will be used as the main directions of the outline. For polygon 1 the maxima can be located at 22°, 112°, 202° and 292°.
After filtering and grouping angles together to these found main directions (Figure 12) in a last step consecutive line segments (Figure 13) are intersected and the closed red polygons shown in Figure 9 above are generated.
Figure 12. Grouping angles of border elements together to found main
directions
Figure 13. Derived line segments of polygon 1 after grouping of angles
In a first version the coarse modeling is done by simply generating prismatic models with these perpendicular polygons as footprints and flat tops with an average height extracted from the DSM.
Since the accuracy and resolution of the derived DSM is in most cases not sufficient a detailed modeling of the roof shape is difficult. In future versions the polygonal circumference will be divided into rectangles. Using these rectangles an averaged section along and across these rectangles may give a hint if it is a gabled or a flat roof and lead to the selection of a more detailed bottom-up model. In the following example this is evaluated for outline “2” from Figure 9:
Figure 14. Statistics of DSM heights from object 2 across roof direction (green dots: DSM values all along the roof, red line: averaged profile)
Figure 15. Statistics of DSM-heights from object 2 along roof direction (green dots: DSM values all across the roof, red line: averaged profile)
Since the digital surface model generated from the satellite stereo image pair is in all used generation methods very coarse and noisy, a statistical approach is the only possibility for further estimation of model parameters like the roof type. Also the extraction of smaller roof features like dormers or chimneys are not possible based on the given data.
Since this approach depends on the classification based on height and vegetation it will fail in case of steep rocks not covered by vegetation or buildings covered with roof top gardens or greened roofs.
5 SUMMARY AND OUTLOOK
In this paper a rather simple method for a coarse building extraction and modeling is shown. Also a quick overview of a processing chain for the automatic extraction of three-dimensional city models directly from high-resolution stereo satellite images is given. The processing chain is still in development. So the DSMs generated are not satisfying up to now. Also the automatic extraction of
In: Stilla U et al (Eds) PIA07. International Archives of Photogrammetry, Remote Sensing and Spatial Information Sciences, 36 (3/W49B)¯¯¯¯¯¯¯¯¯¯¯¯¯¯¯¯¯¯¯¯¯¯¯¯¯¯¯¯¯¯¯¯¯¯¯¯¯¯¯¯¯¯¯¯¯¯¯¯¯¯¯¯¯¯¯¯¯¯¯¯¯¯¯¯¯¯¯¯¯¯¯¯¯¯¯¯¯¯¯¯¯¯¯¯¯¯¯¯¯¯¯¯¯¯¯¯¯¯¯¯¯¯¯¯¯¯¯¯¯
81
objects from the classified images exist only in a first evaluation version. The texturing is still missing up to now. But the results gained from each step are encouraging enough to follow the path and refine every step of the chain to receive a new fully automatic system for generating coarse three-dimensional urban models from stereo satellite imagery in a short time.
REFERENCES
3D Geo: http://www.landxplorer.net/ (accessed 07/2007). Birchfield, S. and Tomasi, C., 1998: Depth discontinuities by pixel-to-
pixel stereo. Proceedings of the 1998 IEEE International Conference on Computer Vision, Bombay, India, pp. 1073–1080.
CyberCity: http://www.cybercity.tv/. (accessed 07/2007). DigitalGlobe: http://www.digitalglobe.com/about/imaging.shtml.
(accessed 07/2007). Förstner, W. and Gülch, E., 1987: A fast operator for detection and
precise location of distinct points, corners and centres of circular features. In: ISPRS Intercommission Workshop, Interlaken.
Grodecki, J., Dial, G. and Lutes, J., 2004: Mathematical model for 3D feature extraction from multiple satellite images described by RPCs. In: ASPRS Annual Conference Proceedings, Denver, Colorado.
Gross H., U. Thoennessen U., v. Hansen W., 2005: 3D-Modeling of Urban Structures. Proceedings of the ISPRS Workshop CMRT 2005, Vienna.
Hirschmüller, H., 2005: Accurate and efficient stereo processing by semi-global matching and mutual information. In: IEEE Conference on Computer Vision and Pattern Recognition (CVPR).
Jacobsen, K., Büyüksalih, G. and Topan, H., 2005: Geometric models for the orientation of high resolution optical satellite sensors. In: International Archives of the Photogrammetry, Remote Sensing and Spatial Information Sciences, Vol. 36 (1/W3). ISPRS Workshop, Hannover.
Krauß, T., Reinartz, P., Lehner, M., Schroeder, M. and Stilla, U., 2005: DEM generation from very high resolution stereo satellite data in urban areas using dynamic programming. In: International Archives of the Photogrammetry, Remote Sensing and Spatial Information Sciences, Vol. 36 (1/W3). ISPRS Workshop, Hannover.
Krauß, T., Reinartz, P. Lehner, M., 2007: Modeling of urban areas from high resolution stereo satellite images. In: Proceedings of ISPRS Workshop “High-Resolution Earth Imaging for Geospatial Information”, Mai 29 – Juni 1, 2007, Hannover.
Lehner, M. and Gill, R., 1992: Semi-automatic derivation of digital elevation models from stereoscopic 3-line scanner data. ISPRS, 29 (B4), pp. 68–75.
Müller S., Zaum D., 2005: Robust Building Detection in Aerial Images. Proceedings of the ISPRS Workshop CMRT 2005, Vienna.
Otto, G. and Chau, T., 1989: Region growing algorithm for matching of terrain images. Image and vision computing (7) 2, pp. 83–94.
Scharstein, D. and Szeliski, R. Middlebury stereo vision page: http://cat.middlebury.edu/stereo. (accessed 07/2007).
Weidner, U., Förstner, W., 1995: Towards automatic building extraction from high resolution digital elevation medels. ISPRS J. 50 (4), 38–49.
SpaceImaging/GeoEye: http://www.geoeye.com/ (accessed 07/2007).
PIA07 - Photogrammetric Image Analysis --- Munich, Germany, September 19-21, 2007¯¯¯¯¯¯¯¯¯¯¯¯¯¯¯¯¯¯¯¯¯¯¯¯¯¯¯¯¯¯¯¯¯¯¯¯¯¯¯¯¯¯¯¯¯¯¯¯¯¯¯¯¯¯¯¯¯¯¯¯¯¯¯¯¯¯¯¯¯¯¯¯¯¯¯¯¯¯¯¯¯¯¯¯¯¯¯¯¯¯¯¯¯¯¯¯¯¯¯¯¯¯¯¯¯¯¯¯¯
82