EXTERNAL SECTOR - Central Bank of Armenia SECTOR EXPORT AND IMPORT OF GOODS Item ... Spain 933 1835...
15
10 EXTERNAL SECTOR EXPORT AND IMPORT OF GOODS Item January - October 2017 (million US dollars) January - October 2017 over January - October 2016 (%) January - November 2017 (million US dollars) January - November 2017 over January - November 2016 (%) Exports (FOB) 1804.1 123.4 2013.8 123.5 Imports (CIF) 3314.6 127.1 3770.4 128.0 Trade deficit 1510.5 131.7 1756.6 133.5 TOTAL MONEY TRANSFERS OF INDIVIDUALS SENT TO AND RECEIVED FROM ABROAD THROUGH COMMERCIAL BANKS OF RA thousand US dollars thousand US dollars Country 2017 November January – November Inflow Outflow Net inflow Inflow Outflow Net inflow Russian Federation 91634 26727 64907 944697 336522 608176 USA 15337 27932 -12596 160048 164596 -4547 Ukraine 837 1027 -190 8114 12109 -3995 Kazakhstan 12688 200 12489 44811 2408 42404 Germany 3013 2538 475 35106 26944 8162 Spain 933 1835 -902 8903 18373 -9470 France 2846 1197 1649 23390 13830 9560 UAE 2812 2009 803 24470 19087 5384 China 666 5737 -5071 4119 58180 -54061 Turkey 109 931 -822 1225 8930 -7705 Other countries 32933 25228 7704 306644 248601 58043 Total 163808 95362 68446 1561528 909579 651949 Country 2016 November January – November Inflow Outflow Net inflow Inflow Outflow Net inflow Russian Federation 75057 24982 50075 802780 305464 497316 USA 16353 9294 7059 157205 76072 81133 Ukraine 772 1314 -541 8370 9719 -1349 Kazakhstan 2453 354 2098 17177 4139 13038 Germany 2531 1461 1070 48122 21980 26142 Spain 733 1228 -495 8009 11353 -3343 France 2986 1454 1532 27368 13159 14209 UAE 1973 1901 72 17108 20864 -3756 China 316 5409 -5093 2283 50227 -47943 Turkey 144 900 -756 2283 7197 -4914 Other countries 20314 18520 1794 230603 187782 42821 Total 123632 66817 56814 1321311 707956 613354
-
Upload
dangkhuong -
Category
Documents
-
view
218 -
download
0
Transcript of EXTERNAL SECTOR - Central Bank of Armenia SECTOR EXPORT AND IMPORT OF GOODS Item ... Spain 933 1835...

10
EXTERNAL SECTOR
EXPORT AND IMPORT OF GOODS
Item January - October 2017
(million US dollars) January - October 2017 over January - October 2016 (%)
January - November 2017 (million US dollars)
January - November 2017 over January - November 2016 (%)
Exports (FOB) 1804.1 123.4 2013.8 123.5
Imports (CIF) 3314.6 127.1 3770.4 128.0
Trade deficit 1510.5 131.7 1756.6 133.5
TOTAL MONEY TRANSFERS OF INDIVIDUALS SENT TO AND RECEIVED FROM
ABROAD THROUGH COMMERCIAL BANKS OF RA
thousand US dollars
thousand US dollars
Country
2017
November January – November
Inflow Outflow Net inflow Inflow Outflow Net inflow
Russian Federation 91634 26727 64907 944697 336522 608176
USA 15337 27932 -12596 160048 164596 -4547
Ukraine 837 1027 -190 8114 12109 -3995
Kazakhstan 12688 200 12489 44811 2408 42404
Germany 3013 2538 475 35106 26944 8162
Spain 933 1835 -902 8903 18373 -9470
France 2846 1197 1649 23390 13830 9560
UAE 2812 2009 803 24470 19087 5384
China 666 5737 -5071 4119 58180 -54061
Turkey 109 931 -822 1225 8930 -7705
Other countries 32933 25228 7704 306644 248601 58043
Total 163808 95362 68446 1561528 909579 651949
Country
2016
November January – November
Inflow Outflow Net inflow Inflow Outflow Net inflow
Russian Federation 75057 24982 50075 802780 305464 497316
USA 16353 9294 7059 157205 76072 81133
Ukraine 772 1314 -541 8370 9719 -1349
Kazakhstan 2453 354 2098 17177 4139 13038
Germany 2531 1461 1070 48122 21980 26142
Spain 733 1228 -495 8009 11353 -3343
France 2986 1454 1532 27368 13159 14209
UAE 1973 1901 72 17108 20864 -3756
China 316 5409 -5093 2283 50227 -47943
Turkey 144 900 -756 2283 7197 -4914
Other countries 20314 18520 1794 230603 187782 42821
Total 123632 66817 56814 1321311 707956 613354
NOVEMBER 2017 11
TOTAL MONEY TRANSFERS OF INDIVIDUALS SENT TO AND RECEIVED FROM
ABROAD THROUGH COMMERCIAL BANKS OF RA
million drams
million drams
Country
2017
November January – November
Inflow Outflow Net inflow Inflow Outflow Net inflow
Russian Federation 44478 12973 31506 455297 162362 292935
USA 7443 13552 -6108 77233 79500 -2267
Ukraine 406 499 -93 3913 5840 -1927
Kazakhstan 6147 97 6050 21625 1163 20462
Germany 1463 1232 230 16934 12996 3938
Spain 453 890 -437 4298 8859 -4561
France 1381 581 801 11290 6671 4619
UAE 1364 975 389 11784 9205 2580
China 324 2785 -2462 1988 28049 -26061
Turkey 53 452 -399 591 4307 -3716
Other countries 15994 12236 3758 147984 119844 28140
Total 79505 46271 33234 752937 438795 314141
Country
2016
November January – November
Inflow Outflow Net inflow Inflow Outflow Net inflow
Russian Federation 35900 11954 23946 384467 146767 237700
USA 7826 4447 3380 75463 36519 38944
Ukraine 370 628 -258 4015 4661 -645
Kazakhstan 1173 169 1004 8229 1988 6241
Germany 1210 699 512 23310 10553 12757
Spain 351 588 -237 3847 5449 -1602
France 1430 696 734 13130 6315 6815
UAE 943 910 33 8234 10020 -1787
China 151 2588 -2437 1095 24064 -22968
Turkey 69 431 -362 1098 3453 -2355
Other countries 9719 8851 869 110538 90076 20462
Total 59143 31960 27182 633426 339864 293562
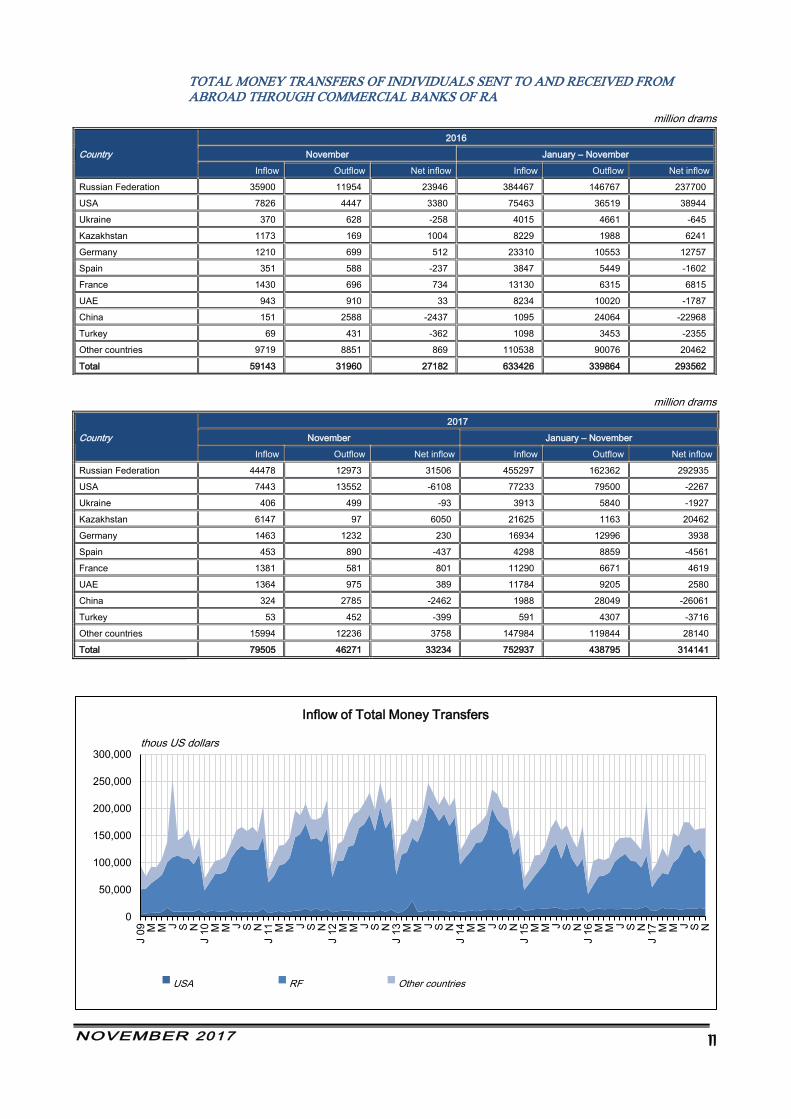
0
50,000
100,000
150,000
200,000
250,000
300,000
J 0
9 M M J S NJ 1
0 M M J S NJ 1
1 M M J S NJ 1
2 M M J S NJ 1
3 M M J S NJ 1
4 M M J S NJ 1
5 M M J S NJ 1
6 M M J S NJ 1
7 M M J S NInflow of Total Money Transfers
USA RF Other countries
thous US dollars
12
MONEY TRANSFER INFLOW BY BALANCE OF PAYMENTS
million US dollars
Indicators 2016 2017
Q I Q II Q III Q IV Annual Q I Q II Q III
Remittances to RA 207.1 306.1 374.9 442.0 1330.1 240.2 335.8 418.9
Net wages of employees1 67.9 134.6 180.3 204.2 586.9 77.9 146.2 200.2
Wages of employees2 87.4 173.4 232.2 262.9 755.8 100.4 188.2 257.8
Net income from work performed by seasonal workers, specified as services3 13.5 26.9 36.0 40.7 117.1 15.5 29.2 39.9
Income from work performed by seasonal workers, specified as services 17.4 34.6 46.3 52.4 150.8 20.0 37.5 51.4
Personal transfers 123.8 141.6 152.4 190.9 608.7 142.2 154.6 170.0
Capital transfers 2.0 3.0 6.2 6.3 17.5 4.6 5.8 8.8
1 Net wages / income is wage, paid to seasonal workers/ income less income tax, expenses for transportation and other spendings in foreign country. 2 Data do not include other additional calculations of balance of payments, in particular, wages of resident employees, working in enclave areas of the RA. 3 A part of income of seasonal workers working in foreign countries is specified as export of services instead of wages, due to the absence of empoyer-employee relationship. Estimation is based on the results of surveys since 2011.
REAL AND NOMINAL EFFECTIVE EXCHANGE RATE (INDEX) 1,2,3,4
2016 J F M A M J J A S O N D
Real effective exchange rate (1997=100) 151.2 146.3 143.9 140.5 139.8 139.4 136.9 136.0 136.5 136.9 140.8 141.4
Nominal effective exchange rate (1997=100) 273.5 269.3 267.1 263.0 264.0 264.9 266.6 266.4 268.1 268.9 274.5 274.2
2017 J F M A M J J A S O N D
Real effective exchange rate (1997=100) 143.1 139.6 138.3 137.6 136.2 134.2 131.4 129.6 128.2 129.8 132.6
Nominal effective exchange rate (1997=100) 271.5 268.5 268.1 265.4 263.8 263.0 263.9 261.0 259.0 261.0 261.8
1 Series were revised in May 2014 due to the change of the base year for the partner countries CPI from 2005=100 to 2010=100 2 12 partner countries data are included in the calculation, excluding data on humanitarian aid, trade of natural gas, oil and diamond, 2007-2011 weights, 1997=100. 3 Data presented are the CBA estimation and are subject to periodic review. 4 Growth means appreciation.
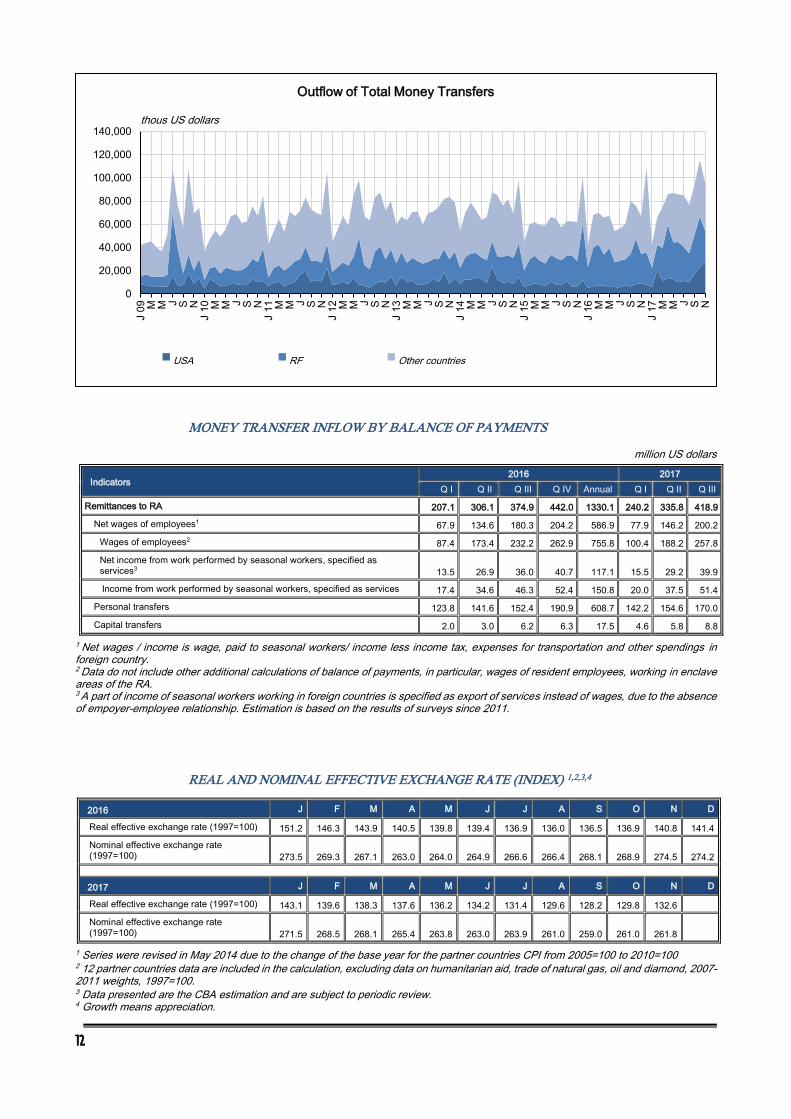
0
20,000
40,000
60,000
80,000
100,000
120,000
140,000J 0
9 M M J S NJ 1
0 M M J S NJ 1
1 M M J S NJ 1
2 M M J S NJ 1
3 M M J S NJ 1
4 M M J S NJ 1
5 M M J S NJ 1
6 M M J S NJ 1
7 M M J S N
Outflow of Total Money Transfers
USA RF Other countries
thous US dollars

NOVEMBER 2017 13
BALANCE OF PAYMENTS (according to “Guide to Balance of Payments”, 6-th edition)1 ,2
million US dollars
Indicators 2016 2017
Q I Q II Q III Q IV Annual Q I Q II Q III
1 2 3 4 5 6 7 8 9
1. CURRENT ACCOUNT -115.9 -42.2 59.6 -139.6 -238.1 -88.0 40.2 3.5
Credit 996.5 1201.7 1528.5 1507.5 5234.3 1193.9 1536.5 1846.0
Debit 1112.4 1243.9 1468.9 1647.1 5472.4 1281.8 1496.4 1842.5
GOODS AND SERVICES -166.9 -202.1 -204.3 -442.4 -1015.8 -201.8 -296.8 -309.7
Credit 713.9 801.1 1047.6 937.7 3500.4 843.9 994.1 1290.9
Debit 880.8 1003.3 1251.9 1380.1 4516.2 1045.7 1290.9 1600.6
GOODS -176.3 -196.4 -216.0 -355.6 -944.4 -220.1 -296.4 -331.1
Credit 398.2 464.7 505.3 522.5 1890.7 471.3 579.5 654.0
Debit 574.5 661.0 721.4 878.1 2835.1 691.4 875.8 985.1
General merchandise on a balance of payments basis -198.1 -222.8 -255.6 -379.5 -1056.1 -239.3 -325.8 -345.6
Credit 374.8 435.1 460.6 489.0 1759.5 433.4 541.8 622.5
Debit 573.0 657.9 716.3 868.5 2815.6 672.7 867.6 968.1
Of which Re-exports (credit) 24.0 29.9 36.0 35.4 125.2 34.5 26.6 2.5
Net exports of goods under merchanting (credit) - - - - - - - -
Nonmonetary gold 21.8 26.4 39.6 23.9 111.7 19.2 29.4 14.5
Credit 23.4 29.6 44.7 33.5 131.2 37.9 37.7 31.5
Debit 1.6 3.2 5.1 9.6 19.5 18.7 8.3 17.1
SERVICES 9.4 -5.8 11.8 -86.8 -71.4 18.3 -0.4 21.4
Credit 315.7 336.5 542.3 415.2 1609.7 372.6 414.6 636.9
Debit 306.3 342.3 530.6 502.0 1681.1 354.3 415.0 615.5
Manufacturing services on physical inputs owned by others 0.9 0.8 1.8 2.3 5.8 1.8 1.4 1.9
Credit 0.9 0.8 1.8 2.3 5.8 1.8 1.4 1.9
Debit - - - - - - - -
Goods for processing in reporting economy – Goods returned (CR), Goods received (DR) 0.9 0.8 1.8 2.3 5.8 1.8 1.4 1.9
Credit 17.2 20.0 25.9 23.5 86.6 21.1 23.0 15.2
Debit 16.4 19.2 24.1 21.2 80.8 19.2 21.6 13.3
Goods for processing abroad - Goods sent (CR), Goods returned (DR) - - - - - - - -
Credit - - - - - - - -
Debit - - - - - - - -
Maintenance and repair services n.i.e. -0.2 -0.2 -0.3 -0.2 -0.9 -0.4 -0.4 -0.2
Credit 0.4 0.5 0.5 0.5 2.0 0.4 0.5 0.5
Debit 0.6 0.7 0.8 0.8 2.9 0.8 0.9 0.8
Transport -38.2 -35.7 -48.1 -57.1 -179.1 -42.2 -46.7 -49.4
Credit 38.0 45.4 52.8 52.5 188.7 45.1 57.8 65.5
Debit 76.2 81.1 100.9 109.5 367.8 87.3 104.6 114.9
Passenger -7.9 -7.3 -8.3 -8.7 -32.3 -6.9 -7.3 -10.3
Credit 3.2 5.4 6.4 4.8 19.8 3.2 5.4 6.5
Debit 11.1 12.7 14.7 13.5 52.1 10.1 12.7 16.8
Freight -29.6 -27.4 -40.5 -48.8 -146.3 -34.2 -39.9 -40.0
Credit 31.6 37.0 41.2 43.0 152.7 38.8 47.0 52.0
Debit 61.1 64.4 81.7 91.8 299.0 73.0 86.9 92.0
Other -0.6 -1.0 0.7 0.5 -0.4 -1.0 0.4 0.9
Credit 3.3 3.0 5.2 4.7 16.3 3.1 5.4 7.0
Debit 3.9 4.0 4.5 4.3 16.7 4.2 5.0 6.2
Sea transport -9.5 -10.9 -11.9 -13.8 -46.1 -11.3 -14.2 -15.1
Credit - - - - - - - -
Debit 9.5 10.9 11.9 13.8 46.1 11.3 14.2 15.1
Air transport -9.6 -11.0 -20.9 -14.5 -56.0 -10.0 -12.0 -16.2
Credit 5.5 7.2 10.5 9.8 33.0 6.8 10.7 12.8
Debit 15.2 18.2 31.4 24.2 89.0 16.9 22.7 29.0
Other modes of transport -18.9 -13.8 -15.4 -28.7 -76.8 -20.9 -20.5 -18.0
Credit 32.4 38.1 42.2 42.7 155.4 38.2 47.1 52.7
Debit 51.4 51.9 57.6 71.4 232.2 59.0 67.6 70.7

14
1 2 3 4 5 6 7 8 9
Postal and courier services -0.0 -0.0 -0.0 -0.0 -0.2 0.0 0.0 0.0
Credit 0.1 0.1 0.1 0.1 0.2 0.1 0.1 0.1
Debit 0.1 0.1 0.1 0.1 0.4 0.1 0.1 0.1
Travel 11.1 -13.5 -4.7 -92.5 -99.5 6.5 -14.2 -19.1
Credit 190.7 184.6 362.8 229.5 967.7 219.5 234.3 418.6
Debit 179.6 198.1 367.5 322.0 1067.2 213.0 248.5 437.8
Business -17.9 -25.4 -34.1 -31.2 -108.5 -21.9 -28.6 -40.5
Credit 21.7 22.4 43.4 30.9 118.4 23.2 26.4 46.5
Debit 39.6 47.7 77.4 62.1 226.9 45.1 55.1 87.0
Personal 29.1 11.9 29.4 -61.3 9.1 28.4 14.4 21.4
Credit 169.0 162.2 319.5 198.7 849.3 196.3 207.8 372.1
Debit 139.9 150.3 290.1 259.9 840.3 167.9 193.4 350.8
Construction 18.3 25.7 41.4 43.7 129.1 29.1 37.7 58.9
Credit 22.3 33.4 44.3 49.6 149.6 30.0 38.3 59.5
Debit 4.0 7.7 2.9 5.9 20.5 0.9 0.6 0.6
Insurance and pension services -4.2 -5.7 -6.1 -7.5 -23.5 -5.9 -6.7 -6.8
Credit 4.4 5.1 5.4 5.7 20.6 5.0 6.4 7.5
Debit 8.6 10.8 11.5 13.2 44.1 10.9 13.1 14.3
Financial services -2.6 -3.6 -1.6 -3.6 -11.5 -1.1 -2.1 -1.5
Credit 1.3 1.5 1.5 1.8 6.1 1.4 1.8 2.3
Debit 4.0 5.1 3.2 5.5 17.6 2.5 3.9 3.8
Telecommunications, computer, and information services 32.4 35.8 39.6 41.7 149.4 43.6 42.5 46.2
Credit 37.9 41.5 46.9 46.8 173.1 48.8 49.5 53.7
Debit 5.5 5.7 7.3 5.1 23.6 5.2 6.9 7.5
Other business services -11.6 -13.2 -13.4 -13.3 -51.5 -15.7 -15.7 -11.6
Credit 8.5 10.7 12.6 13.5 45.3 9.0 11.1 13.4
Debit 20.1 24.0 26.0 26.8 96.8 24.7 26.9 25.0
Personal, cultural, and recreational services 0.4 2.9 3.2 3.0 9.6 0.5 3.0 3.2
Credit 3.3 4.6 5.1 5.8 18.7 3.3 4.7 5.1
Debit 2.8 1.7 1.9 2.7 9.2 2.8 1.7 2.0
Government goods and services n.i.e. 3.0 1.0 0.1 -3.3 0.7 2.0 0.8 -0.1
Credit 8.0 8.4 8.5 7.2 32.1 8.2 8.8 8.8
Debit 5.0 7.4 8.4 10.5 31.4 6.2 7.9 8.9
PRIMARY INCOME -63.3 30.7 122.1 134.8 224.2 -15.9 136.7 170.8
Credit 102.5 192.7 253.0 302.9 851.0 147.3 251.3 313.4
Debit 165.8 161.9 130.9 168.1 626.8 163.2 114.6 142.5
Compensation of employees 50.9 134.6 194.0 217.7 597.3 64.2 145.2 218.8
Credit 91.8 177.8 236.6 267.4 773.7 104.8 192.7 262.3
Debit 41.0 43.2 42.6 49.7 176.4 40.6 47.5 43.5
Investment income -114.2 -103.9 -72.0 -83.0 -373.0 -80.1 -8.5 -48.0
Credit 10.6 14.9 16.3 35.5 77.3 42.5 58.6 51.1
Debit 124.8 118.7 88.3 118.5 450.3 122.6 67.1 99.1
Direct investment -49.1 -36.7 -11.0 -36.6 -133.4 -34.0 18.3 -17.1
Credit 0.2 0.3 0.3 3.9 4.7 3.1 2.6 2.4
Debit 49.3 37.0 11.3 40.5 138.1 37.0 -15.7 19.5
Income on equity and investment fund shares -41.4 -30.2 -4.6 -32.3 -108.5 -30.7 22.8 -14.2
Credit - - - - - - - -
Debit 41.4 30.2 4.6 32.3 108.5 30.7 -22.8 14.2
Dividends and withdrawals from income of quasi-corporations -0.4 -5.2 -31.9 -32.0 -69.6 -0.4 -3.8 -5.1
Credit - - - - - - - -
Debit 0.4 5.2 31.9 32.0 69.6 0.4 3.8 5.1
Reinvested earnings -41.1 -25.0 27.3 -0.2 -38.9 -30.3 26.6 -9.1
Credit - - - - - - - -
Debit 41.1 25.0 -27.3 0.2 38.9 30.3 -26.6 9.1
Interest -7.7 -6.5 -6.4 -4.4 -24.9 -3.2 -4.5 -2.9
Credit 0.2 0.3 0.3 3.9 4.7 3.1 2.6 2.4
Debit 7.9 6.8 6.7 8.2 29.6 6.3 7.1 5.3
Portfolio investment -13.0 -12.0 -11.0 -11.3 -47.4 -13.0 -11.7 -14.9
Credit 2.8 5.5 6.0 5.9 20.1 3.5 5.5 1.5
Debit 15.8 17.5 17.0 17.2 67.5 16.5 17.2 16.4
Investment income on equity and investment fund shares 0.1 -1.3 -0.1 -0.4 -1.6 0.1 -0.8 0.0
Credit 0.1 0.1 0.0 0.0 0.3 0.1 0.0 0.0
Debit - 1.4 0.1 0.4 1.9 - 0.8 0.0
Interest -13.1 -10.8 -10.9 -10.9 -45.7 -13.1 -10.9 -14.9
Credit 2.7 5.3 5.9 5.8 19.8 3.4 5.5 1.5
Debit 15.8 16.1 16.9 16.8 65.6 16.5 16.4 16.4

NOVEMBER 2017 15
1 2 3 4 5 6 7 8 9
Other investment -52.1 -55.1 -50.0 -35.0 -192.2 -33.2 -15.0 -15.9
Credit 7.6 9.1 10.0 25.7 52.5 35.9 50.5 47.2
Debit 59.7 64.3 60.0 60.8 244.8 69.1 65.5 63.2
Withdrawals from income of quasi-corporations - - - - - - - -
Credit - - - - - - - -
Debit - - - - - - - -
Interest -52.0 -55.1 -50.0 -35.0 -192.1 -33.1 -15.0 -15.8
Credit 7.6 9.1 10.0 25.7 52.5 35.9 50.5 47.2
Debit 59.7 64.2 60.0 60.7 244.6 69.0 65.5 63.1
Interest - - - - - - - -
Credit - - - - - - - -
Debit - - - - - - - -
SECONDARY INCOME 114.3 129.2 141.8 168.1 553.4 129.7 200.3 142.3
Credit 180.1 207.9 227.9 267.0 882.9 202.7 291.1 241.7
Debit 65.8 78.7 86.1 98.9 329.5 73.0 90.9 99.4
General government 33.9 38.8 44.1 44.1 161.1 33.4 101.3 32.1
Credit 48.3 56.9 64.5 67.7 237.4 53.3 122.7 58.8
Debit 14.3 18.0 20.4 23.5 76.3 19.9 21.4 26.8
Financial corporations, nonfinancial corporations, households, and NPISHs 80.4 90.4 97.7 124.0 392.4 96.3 99.0 110.3
Credit 131.8 151.0 163.4 199.3 645.5 149.4 168.5 182.8
Debit 51.5 60.7 65.7 75.3 253.1 53.1 69.5 72.6
Personal transfers (Current transfers between resident and nonresident households) 81.7 97.1 108.2 140.0 427.1 98.9 103.4 121.4
Credit 123.8 141.6 152.4 190.9 608.7 142.2 154.6 170.0
Debit 42.0 44.5 44.2 50.9 181.6 43.3 51.2 48.6
Other current transfers -1.3 -6.8 -10.5 -16.0 -34.7 -2.6 -4.4 -11.1
Credit 8.1 9.4 11.0 8.4 36.9 7.3 13.9 12.9
Debit 9.4 16.2 21.5 24.5 71.5 9.9 18.2 24.0
2. CAPITAL ACCOUNT 7.4 7.8 9.1 10.6 34.9 11.0 9.7 13.2
Credit 9.7 10.7 12.8 12.7 45.8 12.1 11.3 14.7
Debit 2.4 2.9 3.6 2.1 10.9 1.1 1.6 1.5
Capital transfers 7.4 7.8 9.1 10.6 34.9 11.0 9.7 13.2
Credit 9.7 10.7 12.8 12.7 45.8 12.1 11.3 14.7
Debit 2.4 2.9 3.6 2.1 10.9 1.1 1.6 1.5
General government 0.6 3.9 1.6 3.0 9.1 3.6 2.0 3.9
Credit 0.6 3.9 1.6 3.0 9.1 3.6 2.0 3.9
Debit - - - - - - - -
Financial corporations, nonfinancial corporations, households, and NPISHs 6.7 3.9 7.6 7.6 25.8 7.3 7.7 9.3
Credit 9.1 6.8 11.2 9.6 36.7 8.5 9.3 10.8
Debit 2.4 2.9 3.6 2.1 10.9 1.1 1.6 1.5
Net lending (+) / net borrowing (-) (balance from current and capital account) -108.6 -34.4 68.7 -129.0 -203.2 -77.0 49.8 16.6
3. FINANCIAL ACCOUNT -194.0 -71.6 -31.6 -138.1 -435.4 78.1 -117.5 54.6
Net lending (+) / net borrowing (-) (balance from financial account) -194.0 -71.6 -31.6 -138.1 -435.4 78.1 -117.5 54.6
Direct investment -29.1 -45.4 -107.2 -90.2 -271.9 -67.3 -29.8 -42.1
Net acquisition of financial assets 9.6 4.6 8.2 43.8 66.2 5.7 -6.3 6.3
Equity and investment fund shares 1.4 1.3 2.5 2.6 7.7 1.1 1.5 2.7
Equity other than reinvestment of earnings 1.4 1.3 2.5 2.6 7.7 1.1 1.5 2.7
Reinvestment of earnings - - - - - - - -
Debt instruments 8.2 3.3 5.8 41.2 58.5 4.6 -7.8 3.6
Net incurrence of liabilities 38.7 50.0 115.4 134.0 338.1 73.0 23.5 48.4
Equity and investment fund shares 47.1 82.1 66.6 27.9 223.7 76.5 -21.0 -1.5
Equity other than reinvestment of earnings 6.0 57.1 93.9 27.7 184.8 46.2 5.5 -10.7
Direct investor in direct investment enterprises 6.0 57.1 93.9 27.7 184.8 46.2 5.5 -10.7
Direct investment enterprises in direct investor (reverse investment) - - - - - - - -

16
1 2 3 4 5 6 7 8 9
Between fellow enterprises - - - - - - - -
Reinvestment of earnings 41.1 25.0 -27.3 0.2 38.9 30.3 -26.5 9.3
Debt instruments -8.4 -32.1 48.8 106.1 114.4 -3.6 44.6 49.9
Direct investor in direct investment enterprises -6.4 33.2 3.5 70.4 100.7 7.2 78.3 57.2
Direct investment enterprises in direct investor (reverse investment) - - - 0.0 0.0 -0.0 - -
Between fellow enterprises -1.9 -65.4 45.3 35.7 13.7 -10.8 -33.7 -7.3
Portfolio investment -5.4 -38.1 0.1 9.4 -33.9 48.2 -5.9 34.1
Net acquisition of financial assets 2.4 7.9 -0.8 13.6 23.1 6.9 6.9 18.8
Equity and investment fund shares 2.4 5.8 2.8 8.3 19.4 6.3 2.7 4.7
Central bank - - - - - - - -
General government -0.1 -0.1 0.4 2.9 3.1 0.7 -3.1 0.6
Deposit-taking corporations, except central bank - - - - - - - -
Other sectors 2.5 5.9 2.4 5.5 16.3 5.5 5.9 4.2
Debt securities -0.0 2.1 -3.6 5.2 3.7 0.6 4.2 14.0
Central bank - - - - - - - -
Deposit-taking corporations, except central bank -0.0 2.1 -3.6 5.2 3.7 0.6 4.2 14.0
General government - - - - - - - -
Other sectors - - - - - - - -
Net incurrence of liabilities 7.8 45.9 -0.9 4.1 56.9 -41.3 12.7 -15.3
Equity and investment fund shares -0.8 0.3 3.2 0.8 3.6 -0.7 -2.5 -0.0
Central bank - - - - - - - -
General government -0.8 0.3 3.2 0.8 3.6 -0.7 -2.5 -0.0
Deposit-taking corporations, except central bank - - - - - - - -
Other sectors - - - - - - - -
Debt securities 8.6 45.6 -4.1 3.3 53.4 -40.6 15.3 -15.3
Central bank - - - - - - - -
Deposit-taking corporations, except central bank 11.1 23.5 0.2 0.5 35.3 0.9 0.8 3.0
General government -2.5 22.1 -4.3 2.8 18.1 -41.5 14.5 -18.3
Other sectors - - - - - - - -
Financial derivatives (other than reserves) and employee stock options -0.3 -0.2 0.6 1.2 1.3 0.7 -1.9 1.4
Other investment 6.6 62.5 -181.0 -469.9 -581.7 210.9 -13.9 -4.6
Net acquisition of financial assets -27.5 -62.2 48.3 281.1 239.7 63.2 -35.4 -118.3
Net incurrence of liabilities -34.1 -124.7 229.4 750.9 821.4 -147.7 -21.5 -113.7
Other equity 1.0 0.2 - - 1.1 3.8 0.3 -
Net acquisition of financial assets 1.0 0.2 - - 1.1 3.8 0.3 -
Net incurrence of liabilities - - - - - - - -
Currency and deposits -57.9 -62.2 -18.5 -396.1 -534.7 95.7 12.9 160.2
Net acquisition of financial assets -53.9 -101.9 8.3 -101.6 -249.0 20.0 39.3 23.3
Central bank -0.1 0.0 -0.0 0.0 -0.1 0.0 0.0 0.0
Deposit-taking corporations, except central bank -6.9 -81.6 -11.7 -23.6 -123.7 31.6 55.8 11.0
General government - - - - - - - -
Other sectors -46.9 -20.3 20.0 -78.1 -125.2 -11.7 -16.5 12.3
Net incurrence of liabilities 4.0 -39.7 26.9 294.5 285.6 -75.7 26.5 -136.9
Central bank -0.2 0.1 0.1 -0.1 -0.0 -0.1 0.1 0.1
Deposit-taking corporations, except central bank 4.2 -39.8 26.7 294.5 285.7 -75.6 26.3 -137.1
General government - - - - - - - -
Other sectors - - - - - - - -
Loans 63.2 105.0 -151.5 -80.6 -64.0 100.7 -2.2 -174.0
Net acquisition of financial assets 23.9 35.8 37.7 357.5 454.8 13.6 -47.0 -161.3
Central bank - - - - - - - -
Deposit-taking corporations, except the central bank 22.9 35.9 36.6 356.9 452.3 12.0 -44.6 -163.4
Short-term 22.5 -0.3 73.7 212.2 308.1 -42.9 37.4 -193.7
Long-term 0.4 36.1 -37.1 144.7 144.2 54.9 -82.0 30.2

NOVEMBER 2017 17
1 2 3 4 5 6 7 8 9
General government -0.3 -0.3 -0.3 -0.3 -1.2 -0.3 -0.3 -0.3
Credit and loans with the IMF (other than reserves) - - - - - - - -
Other short-term - - - - - - - -
Other long-term -0.3 -0.3 -0.3 -0.3 -1.2 -0.3 -0.3 -0.3
Other sectors 1.3 0.2 1.3 0.9 3.6 2.0 -2.0 2.4
Short-term - - - - - 0.0 -0.0 -
Long-term 1.3 0.2 1.3 0.9 3.6 2.0 -2.0 2.4
Net incurrence of liabilities -39.3 -69.2 189.2 438.1 518.7 -87.0 -44.8 12.7
Central bank 4.5 12.7 10.8 14.8 42.7 9.9 28.8 43.6
Credit and loans with the IMF -0.0 13.4 -2.0 9.7 21.0 0.0 8.2 0.0
Other short-term - - - - - - - -
Other long-term 4.5 -0.6 12.8 5.1 21.7 9.8 20.6 43.6
Deposit-taking corporations, except the central bank -34.9 -97.9 76.3 33.0 -23.6 -65.6 -36.3 -0.2
Short-term -7.8 -13.3 21.0 15.9 15.7 -4.4 2.7 -4.6
Long-term -27.1 -84.6 55.3 17.1 -39.4 -61.2 -39.0 4.3
General government 13.1 44.7 100.0 343.8 501.6 9.4 7.4 39.8
Credit and loans with the IMF -2.6 -2.6 -2.6 -2.5 -10.4 -5.0 -5.2 -5.2
Other short-term 0.0 0.1 -0.2 0.0 -0.0 -0.1 -0.2 -0.0
Other long-term 15.6 47.2 102.8 346.4 512.0 14.6 12.8 45.0
Other sectors -21.8 -28.7 2.1 46.5 -1.9 -40.7 -44.7 -70.5
Short-term 0.5 -2.7 0.6 -30.2 -31.8 -2.7 -12.2 -7.4
Long-term -22.3 -26.0 1.5 76.7 29.9 -38.0 -32.5 -63.0
Insurance, pension, and standardized guarantee schemes -1.3 -0.6 0.7 1.3 0.2 -0.1 -0.8 -0.9
Net acquisition of financial assets -1.2 -0.4 1.0 1.5 1.0 0.5 -1.2 0.1
Other sectors -1.2 -0.4 1.0 1.5 1.0 0.5 -1.2 0.1
Net incurrence of liabilities 0.1 0.2 0.2 0.2 0.8 0.6 -0.4 1.0
Other sectors 0.1 0.2 0.2 0.2 0.8 0.6 -0.4 1.0
Trade credit and advances 2.6 30.5 -29.9 11.0 14.1 9.6 -13.6 12.4
Net acquisition of financial assets 2.3 8.5 -2.3 29.3 37.8 26.0 -28.4 17.7
Central bank 0.1 -0.0 -0.1 0.4 0.4 -0.3 -0.0 -0.0
Deposit-taking corporations, except the central bank -3.0 0.2 3.2 -0.3 0.2 -2.2 1.2 1.5
General government -0.3 -0.3 -0.2 10.9 10.2 3.4 3.5 -2.4
Other sectors 5.5 8.6 -5.3 18.2 27.1 25.0 -33.1 18.7
Net incurrence of liabilities -0.3 -22.0 27.6 18.3 23.7 16.4 -14.8 5.4
Central bank 0.0 -0.0 0.0 0.0 0.0 -0.0 -0.0 0.0
Deposit-taking corporations, except the central bank 3.1 -8.7 -4.8 -5.7 -16.1 2.7 -4.8 -1.8
General government - - - - - - - -
Other sectors -3.4 -13.3 32.4 24.0 39.7 13.7 -9.9 7.2
Other accounts receivable/payable -1.0 -10.4 18.2 -5.4 1.5 1.2 -10.3 -2.4
Net acquisition of financial assets 0.4 -4.4 3.7 -5.6 -6.0 -0.7 1.6 1.9
Central bank - 0.0 -0.0 0.0 0.0 -0.0 - 0.0
Deposit-taking corporations, except the central bank 1.7 -4.4 3.0 -5.8 -5.4 -0.9 1.3 2.1
General government - - - - - - - -
Other sectors -1.4 0.0 0.6 0.2 -0.5 0.1 0.3 -0.2
Net incurrence of liabilities 1.3 6.0 -14.6 -0.2 -7.4 -1.9 11.9 4.3
Central bank -0.2 -0.0 0.1 -0.1 -0.3 0.0 0.3 0.5
Deposit-taking corporations, except the central bank 1.7 6.9 -15.9 -0.1 -7.5 -3.0 12.8 3.0
General government - - - - - - - -
Other sectors -0.1 -0.9 1.3 -0.0 0.3 1.0 -1.1 0.8
Special drawing rights (Net incurrence of liabilities) 0.0 -0.0 -0.0 0.0 0.0 0.0 0.0 -0.0
RESERVE ASSETS -165.9 -50.5 255.9 411.3 450.8 -114.4 -66.0 65.9
Monetary gold - - - - - - - -
Special drawing rights 11.0 -8.2 -5.3 3.2 0.7 -3.4 7.0 -6.4
Reserve position in the IMF -0.0 - - - -0.0 - - -
Other reserve assets -176.8 -42.3 261.1 408.1 450.1 -111.0 -73.0 72.3
Currency and deposits -150.5 -36.0 226.0 298.1 337.6 -106.0 -152.9 -18.4
Claims on monetary authorities -126.6 -85.6 232.8 297.3 317.8 -204.6 -57.4 -6.1

18
1 2 3 4 5 6 7 8 9
Claims on other entities -23.9 49.6 -6.8 0.9 19.8 98.6 -95.5 -12.2
Securities -26.1 -6.0 34.9 107.4 110.2 -2.3 79.3 91.1
Debt securities -26.1 -6.0 34.9 107.4 110.2 -2.3 79.3 91.1
Short-term -30.0 - - -0.0 -30.0 21.0 -11.0 49.4
Long-term 3.9 -6.0 34.9 107.4 140.2 -23.3 90.3 41.7
Equity and investment fund shares - - - - - - - -
Financial derivatives -0.2 -0.3 0.2 0.3 0.0 -0.2 0.6 -0.4
Other claims -0.0 0.0 0.0 2.3 2.3 -2.5 -0.0 0.0
Net errors and omissions -85.5 -37.2 -100.3 -9.1 -232.1 155.1 -167.4 37.9
1 Starting from the 1st quarter of 2011 Balance of payment, international investment position and external debt of RA are compiled by the Central Bank of Armenia and will be published quarterly in the monthly “CBA Bulletin”.
2 Starting from the 1st quarter of 2012 Balance of payment, international investment position and external debt of RA are compiled according to “Guide to Balance of Payments”, 6-th edition.

NOVEMBER 2017 19
INTERNATIONAL INVESTMENT POSITION (according to “Guide to Balance of Payments”,
6-th edition)
million US dollars
Indicators
Po
sitio
n a
s o
f 3
0.0
6.2
017 Changes due to
Tota
l cha
ng
es
Po
sitio
n a
s o
f 3
0.0
9.2
017
Tra
nsaction
Oth
er
cha
ng
es in
volu
me
Excha
ng
e r
ate
cha
ng
es
Oth
er
price c
ha
ng
es
1 2 3 4 5 6 7 8
Net International Investment Positions -8422.3 54.6 117.4 -65.9 -6.7 99.4 -8323.0
ASSETS 5087.9 -29.9 3.0 27.0 -3.6 -3.6 5084.3
Direct investment 567.4 6.3 - 0.0 - 6.3 573.7
Equity and investment fund shares 186.5 2.7 - 0.0 - 2.7 189.1
Direct investor in direct investment enterprises 186.4 2.7 - - - 2.7 189.1
Direct investment enterprises in direct investor (reverse investment) - - - - - - -
Between fellow enterprises 0.1 0.0 - 0.0 - 0.0 0.1
Debt instruments 380.9 3.6 - 0.0 - 3.7 384.6
Direct investor in direct investment enterprises 0.0 -0.0 - - - -0.0 0.0
Direct investment enterprises in direct investor (reverse investment) 139.9 -1.9 - 0.0 - -1.9 138.0
Between fellow enterprises 240.9 5.6 - 0.0 - 5.6 246.6
Portfolio investment 79.2 18.8 - 0.1 - 18.9 98.1
Equity and investment fund shares 53.4 4.7 - 0.0 - 4.8 58.2
Central Bank - - - - - - -
Deposit-taking corporations, except the central bank 5.7 0.6 - 0.0 - 0.6 6.3
General government - - - - - - -
Other sectors 47.7 4.2 - 0.0 - 4.2 51.8
Debt securities 25.8 14.0 - 0.1 - 14.1 39.9
Central Bank 9.8 - - 0.0 - 0.0 9.8
Short-term - - - - - - -
Long-term 9.8 - - 0.0 - 0.0 9.8
Deposit-taking corporations, except the Central Bank 16.0 14.0 - 0.0 - 14.0 30.1
Short-term 5.0 16.0 - - - 16.0 21.1
Long-term 11.0 -2.0 - 0.0 - -2.0 9.0
General government - - - - - - -
Short-term - - - - - - -
Long-term - - - - - - -
Other sectors - - - - - - -
Short-term - - - - - - -
Long-term - - - - - - -
Financial derivatives (other than reserves) and employee stock options 4.2 -2.6 - 0.0 - -2.5 1.6
Other investment 2420.7 -118.3 3.0 11.2 - -104.1 2316.6
Other equity 26.8 - - 0.0 - 0.0 26.8
Currency and deposits 1427.1 23.3 - 4.3 - 27.6 1454.7
Central Bank 90.1 0.0 - 0.0 - 0.0 90.1
Deposit-taking corporations, except the Central Bank 403.6 11.0 - 4.3 - 15.2 418.9
Short-term 397.4 13.5 - 4.3 - 17.7 415.2
Long-term 6.2 -2.5 - 0.0 - -2.5 3.7
General government - - - - - - -
Other sectors 933.4 12.3 - - - 12.3 945.7
Short-term 933.4 12.3 - - - 12.3 945.7
Long-term - - - - - - -

20
1 2 3 4 5 6 7 8
Loans 774.6 -161.3 3.0 5.1 - -153.2 621.4
Central Bank - - - - - - -
Credit and loans with the IMF (other than reserves) - - - - - - -
Other short-term - - - - - - -
Other long-term - - - - - - -
Deposit-taking corporations, except the Central Bank 700.7 -163.4 - 5.3 - -158.1 542.6
Short-term 431.2 -193.7 - 3.9 - -189.8 241.5
Long-term 269.5 30.2 - 1.4 - 31.6 301.1
General government 10.8 -0.3 -0.0 - - -0.3 10.5
Credit and loans with the IMF (other than reserves) - - - - - - -
Other short-term - - - - - - -
Other long-term 10.8 -0.3 -0.0 - - -0.3 10.5
Other sectors 63.1 2.4 3.0 -0.2 - 5.2 68.3
Short-term - - - - - - -
Long-term 63.1 2.4 3.0 -0.2 - 5.2 68.3
Insurance, pension, and standardized guarantee schemes 6.1 0.1 - 0.0 - 0.1 6.2
Trade credit and advances 156.4 17.7 -0.0 1.7 - 19.4 175.8
Central Bank 0.1 -0.0 - 0.0 - -0.0 0.1
Deposit-taking corporations, except central bank 10.7 1.5 - 0.1 - 1.6 12.2
General government 19.2 -2.4 - - - -2.4 16.7
Other sectors 126.4 18.7 -0.0 1.6 - 20.3 146.7
Other accounts receivable- other 29.7 1.9 -0.0 0.1 - 2.0 31.7
Central Bank - 0.0 - 0.0 - 0.0 0.0
Deposit-taking corporations, except the Central Bank 15.1 2.1 - 0.1 - 2.2 17.2
General government - - - - - - -
Other sectors 14.7 -0.2 -0.0 0.0 - -0.2 14.5
Reserve assets 2016.4 65.9 - 15.6 -3.6 77.9 2094.3
Monetary gold - - - - - - -
Special drawing rights 7.3 -6.4 - 0.0 - -6.4 0.9
Reserve position in the IMF - - - - - - -
Other reserve assets 2009.1 72.3 - 15.5 -3.6 84.2 2093.4
Currency and deposits 669.9 -18.4 - 6.9 - -11.4 658.5
Currency and deposits 605.7 -6.1 - 6.6 - 0.5 606.3
Claims on monetary authorities 64.1 -12.2 - 0.3 - -11.9 52.2
Claims on other entities 1338.6 91.1 - 8.6 -3.6 96.0 1434.6
Securities 1338.6 91.1 - 8.6 -3.6 96.0 1434.6
Debt securities - 49.4 - - 0.1 49.4 49.4
Short-term 1338.6 41.7 - 8.6 -3.7 46.6 1385.2
Long-term - - - - - - -
Equity and investment fund shares 0.6 -0.4 - 0.0 - -0.4 0.3
Financial derivatives 0.0 0.0 - 0.0 - 0.0 0.0
Other claims 13510.2 -84.4 -114.4 92.9 3.1 -102.9 13407.3
LIABILITIES 4628.2 48.4 -75.7 22.2 0.6 -4.4 4623.8
Direct investment 3535.4 -1.5 -74.9 16.9 0.6 -58.8 3476.5
Equity and investment fund shares 3528.7 -1.5 -74.9 16.9 0.6 -58.9 3469.8
Direct investor in direct investment enterprises - - - - - - -
Direct investment enterprises in direct investor (reverse investment) 6.6 - - 0.0 - 0.0 6.7
Between fellow enterprises 1092.9 49.9 -0.8 5.3 - 54.4 1147.3
Debt instruments 655.1 57.2 -1.1 4.4 - 60.5 715.6
Direct investor in direct investment enterprises 36.5 - - 0.2 - 0.2 36.6
Direct investment enterprises in direct investor (reverse investment) 401.4 -7.3 0.3 0.7 - -6.3 395.1
Between fellow enterprises 1063.5 -15.3 - 0.8 2.5 -12.0 1051.4
Portfolio investment 25.8 -0.0 - 0.1 - 0.1 25.9
Equity and investment fund shares 25.8 -0.0 - 0.1 - 0.1 25.9
Deposit-taking corporations, except the Central Bank 0.0 - - 0.0 - 0.0 0.0

NOVEMBER 2017 21
1 2 3 4 5 6 7 8
Debt securities 1037.6 -15.3 - 0.7 2.5 -12.2 1025.5
Central Bank - - - - - - -
Short-term - - - - - - -
Long-term - - - - - - -
Deposit-taking corporations, except the Central Bank 37.6 3.0 - 0.6 - 3.6 41.2
Short-term - - - - - - -
Long-term 37.6 3.0 - 0.6 - 3.6 41.2
General government 1000.0 -18.3 - 0.1 2.5 -15.8 984.3
Short-term - - - - - - -
Long-term 1000.0 -18.3 - 0.1 2.5 -15.8 984.3
Other sectors - - - - - - -
Short-term - - - - - - -
Long-term - - - - - - -
Financial derivatives (other than reserves) and employee stock options 4.8 -3.9 - 0.0 - -3.9 0.9
Other investment 7813.7 -113.7 -38.7 69.8 - -82.5 7731.2
Other equity 1.2 - - 0.0 - 0.0 1.2
Currency and deposits 1058.0 -136.9 - 8.7 - -128.2 929.8
Central Bank 0.5 0.1 - 0.0 - 0.2 0.6
Deposit-taking corporations, except the Central Bank 1057.5 -137.1 - 8.7 - -128.4 929.1
Short-term 707.6 -116.0 - 6.6 - -109.3 598.3
Long-term 349.9 -21.1 - 2.1 - -19.1 330.9
General government - - - - - - -
Other sectors - - - - - - -
Loans 6421.9 12.7 -36.8 57.2 - 33.0 6455.0
Central Bank 564.7 43.6 - 8.9 - 52.5 617.2
Credit and loans with the IMF 303.8 0.0 - 4.6 - 4.6 308.4
Other short-term - - - - - - -
Other long-term 260.9 43.6 - 4.3 - 47.9 308.8
Deposit-taking corporations, except the Central Bank 1067.4 -0.2 - 1.9 - 1.7 1069.1
Short-term 94.3 -4.6 - 0.1 - -4.5 89.9
Long-term 973.0 4.3 - 1.8 - 6.2 979.2
General government 3516.1 39.8 - 38.5 - 78.3 3594.4
Credit and loans with the IMF 120.8 -5.2 - 1.7 - -3.4 117.3
Short-term 0.0 -0.0 - 0.0 - 0.0 0.0
Long-term 3395.3 45.0 - 36.8 - 81.7 3477.0
Other sectors 1273.8 -70.5 -36.8 7.8 - -99.5 1174.3
Short-term 48.7 -7.4 - 0.5 - -7.0 41.7
Long-term 1225.1 -63.0 -36.8 7.4 - -92.5 1132.6
Insurance, pension, and standardized guarantee schemes 2.6 1.0 - 0.0 - 1.0 3.6
Trade credit and advances 166.2 5.4 -1.7 1.7 - 5.3 171.5
Central Bank 0.1 0.0 - 0.0 - 0.0 0.1
Deposit-taking corporations, except the Central Bank 11.0 -1.8 - 0.2 - -1.6 9.3
General government - - - - - - -
Other sectors 155.2 7.2 -1.7 1.5 - 6.9 162.1
Other accounts payable - other 41.4 4.3 -0.1 0.3 - 4.5 45.9
Central Bank 0.3 0.5 - 0.0 - 0.5 0.8
Deposit-taking corporations, except the Central Bank 33.3 3.0 - 0.3 - 3.3 36.6
General government - - - - - - -
Other sectors 7.8 0.8 -0.1 0.0 - 0.7 8.4
Special drawing rights 122.5 -0.0 - 1.9 - 1.9 124.3

22
GROSS INTERNATIONAL DEBT (according to “Guide to Balance of Payments”, 6-th edition)
million US dollars
31.03.16 30.06.16 30.09.16 31.12.16 31.03.17 30.06.17 30.09.17
General Government 3936.2 4046.9 4171.4 4407.1 4404.1 4516.4 4578.6
Short-term 0.4 0.5 0.4 0.4 0.2 0.0 0.0
Currency and deposits 0.0 0.0 0.0 0.0 0.0 0.0 0.0
Debt securities 0.0 0.0 0.0 0.0 0.0 0.0 0.0
Loans 0.4 0.5 0.4 0.4 0.2 0.0 0.0
Trade credits and advances 0.0 0.0 0.0 0.0 0.0 0.0 0.0
Other debt liabilities 0.0 0.0 0.0 0.0 0.0 0.0 0.0
Long -Term 3935.8 4046.4 4171.0 4406.8 4403.8 4516.4 4578.6
Special drawing rights (SDRs), Allocation 0.0 0.0 0.0 0.0 0.0 0.0 0.0
Currency and deposits 0.0 0.0 0.0 0.0 0.0 0.0 0.0
Debt securities 916.3 962.9 993.0 1005.2 961.1 1000.0 984.3
Loans 3019.4 3083.4 3178.1 3401.6 3442.7 3516.3 3594.3
Trade credits and advances 0.0 0.0 0.0 0.0 0.0 0.0 0.0
Other debt liabilities 0.0 0.0 0.0 0.0 0.0 0.0 0.0
Central Bank 613.8 621.3 633.4 626.0 641.5 671.9 743.0
Short-term 0.5 0.5 0.7 0.6 0.5 0.9 1.5
Currency and deposits 0.3 0.4 0.5 0.5 0.3 0.5 0.6
Debt securities 0.0 0.0 0.0 0.0 0.0 0.0 0.0
Loans 0.0 0.0 0.0 0.0 0.0 0.0 0.0
Trade credits and advances 0.0 0.0 0.0 0.1 0.1 0.1 0.1
Other debt liabilities 0.1 0.0 0.1 0.0 0.1 0.3 0.8
Long -Term 613.3 620.8 632.8 625.5 641.0 671.0 741.5
Special drawing rights (SDRs), Allocation 123.8 122.8 123.0 118.3 119.7 122.5 124.3
Currency and deposits 0.0 0.0 0.0 0.0 0.0 0.0 0.0
Debt securities 0.0 0.0 0.0 0.0 0.0 0.0 0.0
Loans 489.6 498.0 509.7 507.1 521.3 548.6 617.2
Trade credits and advances 0.0 0.0 0.0 0.0 0.0 0.0 0.0
Other debt liabilities 0.0 0.0 0.0 0.0 0.0 0.0 0.0
Deposit-taking corporations, except central bank 2055.4 1938.4 2023.1 2328.3 2190.9 2208.5 2085.4
Short-term 561.5 490.6 528.6 874.1 730.5 848.0 734.2
Currency and deposits 424.0 368.6 406.1 742.5 603.4 709.4 598.3
Debt securities 0.0 0.0 0.0 0.0 0.0 0.0 0.0
Loans 72.1 58.9 80.1 95.9 91.5 94.3 89.9
Trade credits and advances 32.7 23.6 18.8 12.5 15.3 11.0 9.3
Other debt liabilities 32.7 39.5 23.6 23.2 20.3 33.3 36.6
Long -Term 1493.9 1447.8 1494.5 1454.2 1460.4 1360.5 1351.3
Currency and deposits 397.5 411.9 402.5 349.0 415.4 349.9 330.9
Debt securities 11.5 34.8 35.0 34.9 35.9 37.6 41.2
Loans 1084.9 1001.2 1057.0 1070.3 1009.1 973.0 979.2
Trade credits and advances 0.0 0.0 0.0 0.0 0.0 0.0 0.0
Other debt liabilities 0.0 0.0 0.0 0.0 0.0 0.0 0.0
Other Sectors 1458.5 1435.8 1460.2 1547.4 1578.1 1522.5 1348.5
Short-term 148.2 142.3 168.8 196.5 249.4 227.2 189.8
Currency and deposits 0.0 0.0 0.0 0.0 0.0 0.0 0.0
Debt securities 0.0 0.0 0.0 0.0 0.0 0.0 0.0
Loans 33.4 44.1 44.8 59.8 94.8 86.7 41.7
Trade credits and advances 111.2 95.4 119.8 132.7 147.0 134.0 140.8
Other debt liabilities 3.6 2.8 4.2 4.0 7.6 6.5 7.2
Long -Term 1310.3 1293.5 1291.5 1350.8 1328.7 1295.3 1158.7
Currency and deposits 0.0 0.0 0.0 0.0 0.0 0.0 0.0
Debt securities 0.0 0.0 0.0 0.0 0.0 0.0 0.0
Loans 1297.7 1280.1 1270.7 1325.8 1304.1 1270.3 1132.6
Trade credits and advances 9.7 10.3 17.4 21.4 20.4 21.2 21.2
Other debt liabilities 2.9 3.1 3.4 3.6 4.2 3.8 4.9
Direct Investment: Intercompany lending 948.0 908.1 953.1 1044.2 1076.4 1125.1 1147.3
Direct investor in direct investment enterprises 473.9 501.2 504.9 564.6 607.1 687.2 715.6
Direct investment enterprises in direct investor (reverse investment) 36.4 36.7 36.9 36.2 36.2 36.5 36.6
Between fellow enterprises 437.7 370.2 411.4 443.5 433.1 401.4 395.1
GROSS EXTERNAL DEBT 9012.0 8950.6 9241.3 9953.1 9890.9 10044.3 9902.8

NOVEMBER 2017 23
STRUCTURE OF INTERNATIONAL RESERVES OF THE REPUBLIC OF ARMENIA 1
million US dollars
Indicators 2016 2017
D 3 J F M 3 A M J 3 J A S 3 O N
Gross international reserves 2204.1 2067.3 2026.3 2053.1 1939.6 1982.2 2016.4 2103.3 2176.4 2094.3 2118.8 2174.4
Gold 0.0 0.0 0.0 0.0 0.0 0.0 0.0 0.0 0.0 0.0 0.0 0.0
SDR holdings in the IMF 3.5 1.0 0.2 0.1 9.7 7.8 7.3 2.1 0.9 0.9 0.9 11.8
Reserve position in the IMF 0.0 0.0 0.0 0.0 0.0 0.0 0.0 0.0 0.0 0.0 0.0 0.0
Foreign exchange 2 2200.6 2066.3 2026.2 2052.9 1929.9 1974.5 2009.1 2101.2 2175.5 2093.4 2117.8 2162.5
1 Calculated using actual exchange rates. 2 Includes only assets in convertible currencies. 3 Includes the CBA closing entries.
0
500
1,000
1,500
2,000
2,500
3,000
J13
M M J S N J14
M M J S N J15
M M J S N J16
M M J S N J17
M M J S N
Foreign exchange SDR holdings
mlnUS dollars

24
FOREIGN LIABILITIES OF THE CENTRAL BANK OF ARMENIA 1
million US dollars
Indicators 2016 2017
D 2 J F M 2 A M J 2 J A S 2 O N
Gross foreign liabilities 624.8 631.6 632.0 640.2 646.3 674.0 684.5 693.4 701.4 739.4 733.9 742.8
IMF credit 285.7 288.1 287.2 289.0 291.3 292.1 303.8 307.4 309.5 308.4 307.0 308.5
SDR allocation 118.3 119.2 119.1 119.7 120.6 121.5 122.5 123.8 124.8 124.3 123.7 124.7
Other loans 220.1 223.8 225.1 230.9 233.1 259.8 257.3 261.7 266.4 305.1 302.5 308.3
Other liabilities 0.7 0.5 0.6 0.5 1.3 0.6 0.9 0.5 0.6 1.6 0.8 1.3
1 Calculated using actual exchange rates. Includes liabilities in convertible currencies and Armenian drams. 2 Includes the CBA closing entries.
0
100
200
300
400
500
600
700
800
J13
M M J S N J14
M M J S N J15
M M J S N J16
M M J S N J17
M M J S N
IMF credt SDR allocation Other loans Other liabilities
mln US dollars