Extensive regulation of metabolism and growth during the ... · 2 Abstract Yeast cells grown in...
34
Extensive regulation of metabolism and growth during the cell division cycle Nikolai Slavov 1,2,† , David Botstein 2 and Amy Caudy 2,3 1 Departments of Physics and Biology, Massachusetts Institute of Technology, Cambridge, MA 02139, USA 2 Lewis-Sigler Institute for Integrative Genomics and Molecular Biology Department, Princeton University, Princeton, NJ 08544, USA 3 Donnelly Centre for Cellular and Biomolecular Research, University of Toronto, Toronto, M5S 3E1, Canada † Corresponding author: [email protected] Abbreviations: CDC - cell division cycle; GR - growth rate; HOC - high oxygen consumption; LOC - low oxygen consumption; EAP - ensemble average over phases; 1 arXiv:1406.3398v1 [q-bio.GN] 13 Jun 2014
Transcript of Extensive regulation of metabolism and growth during the ... · 2 Abstract Yeast cells grown in...

Extensive regulation of metabolism and growth duringthe cell division cycle
Nikolai Slavov1,2,†, David Botstein2 and Amy Caudy2,3
1 Departments of Physics and Biology, Massachusetts Institute of Technology, Cambridge, MA 02139, USA2 Lewis-Sigler Institute for Integrative Genomics and Molecular Biology Department, Princeton University,Princeton, NJ 08544, USA3 Donnelly Centre for Cellular and Biomolecular Research, University of Toronto, Toronto, M5S 3E1, Canada† Corresponding author: [email protected]
Abbreviations: CDC - cell division cycle; GR - growth rate; HOC - high oxygen consumption;LOC - low oxygen consumption; EAP - ensemble average over phases;
1
arX
iv:1
406.
3398
v1 [
q-bi
o.G
N]
13
Jun
2014

2
AbstractYeast cells grown in culture can spontaneously synchronize their respiration, metabolism, gene ex-pression and cell division. Such metabolic oscillations in synchronized cultures reflect single-celloscillations, but the relationship between the oscillations in single cells and synchronized culturesis poorly understood. To understand this relationship and the coordination between metabolismand cell division, we collected and analyzed DNA-content, gene-expression and physiologicaldata, at hundreds of time-points, from cultures metabolically-synchronized at different growthrates, carbon sources and biomass densities. The data enabled us to extend and generalize anensemble-average-over-phases (EAP) model that connects the population-average gene-expressionof asynchronous cultures to the gene-expression dynamics in the single-cells comprising the cul-tures. The extended model explains the carbon-source specific growth-rate responses of hundredsof genes. Our data demonstrate that for a given growth rate, the frequency of metabolic cyclingin synchronized cultures increases with the biomass density. This observation underscores thedifference between metabolic cycling in synchronized cultures and in single cells and suggestsentraining of the single-cell cycle by a quorum-sensing mechanism. Constant levels of residualglucose during the metabolic cycling of synchronized cultures indicate that storage carbohydratesare required to fuel not only the G1/S transition of the division cycle but also the metabolic cycle.Despite the large variation in profiled conditions and in the time-scale of their dynamics, mostgenes preserve invariant dynamics of coordination with each other and with the rate of oxygenconsumption. Similarly, the G1/S transition always occurs at the beginning, middle or end of thehigh oxygen consumption phases, analogous to observations in human and drosophila cells. Theseresults highlight evolutionary conserved coordination among metabolism, cell growth and division.

3
Introduction
The coordination of cell growth with cell division (Polymenis and Schmidt, 1997; Neufeld and
Edgar, 1998; Jorgensen and Tyers, 2004; Fingar and Blenis, 2004a; Tzur et al, 2009; Goranov and
Amon, 2010; Brauer et al, 2008; Slavov and Botstein, 2011; Hoose et al, 2012a; Turner et al, 2012;
Slavov and Botstein, 2013) and the deregulation of these processes in cancer (Cairns et al, 2011;
Dang, 2012; Jain et al, 2012) have been studied since the nineteenth century (Wilson, 1900). De-
spite major insights, such as the dependence of cell division on cell growth (Johnston et al, 1977;
Brauer et al, 2008; Slavov and Botstein, 2011) and the identification of participating pathways
(Jorgensen et al, 2002; Hoose et al, 2012b), many aspects of the coordination between cell growth
and division remain unclear (Jorgensen and Tyers, 2004; Benanti, 2012; Slavov et al, 2014). To
investigate this coordination, we exploited the spontaneous metabolic synchronization of yeast cul-
tures: when a glucose-starved culture of budding yeast is refed with a glucose-limited medium at
a constant rate, the culture can begin a respiratory cycle, manifested by periodic oscillation in the
levels of dissolved oxygen in the culture medium (Kuenzi and Fiechter, 1969; Von Meyenburg,
1969) and periodic expression of thousands of genes (Klevecz et al, 2004; Tu et al, 2005; Mur-
ray et al, 2007; Slavov et al, 2011; Machne and Murray, 2012), reviewed in (Tu and McKnight,
2006; Murray and Lloyd, 2007; Laxman and Tu, 2010; Murray et al, 2011). Recently we observed
similar oscillations in phosphate-starved nondividing yeast cells (Slavov et al, 2011), demonstrat-
ing that these phenomena of metabolic synchronization are not restricted to carbon-source-limited
or continuous yeast cultures. Rather, multiple lines of evidence including (i) single-cell analysis
(Silverman et al, 2010; Wyart et al, 2010), (ii) a mechanistic model connecting the growth-rate
and stress responses of synchronized and asynchronous cultures (Brauer et al, 2008; Slavov and
Botstein, 2011; Slavov et al, 2011, 2012), and (iii) elutriation-synchronized cultures (Slavov et al,
2012) suggest that the cycling in metabolically synchronized cultures reflects a metabolic cycle in
single cells from asynchronous cultures.
This metabolic cycling in single cells, however, does not exactly parallel the metabolic cycling
in synchronized cultures since measurements of the DNA content of single cells from the synchro-
nized cultures (Klevecz et al, 2004; Tu et al, 2005; Robertson et al, 2008; Blank et al, 2009; Slavov
and Botstein, 2011; Chin et al, 2012) have demonstrated at least two sub-populations during each
period of the synchronized cultures: dividing (2C DNA content) and non-dividing (1C DNA con-
tent). Thus, distinguishing between metabolic cycling in synchronized cultures and in single cells

4
is crucial to the analysis throughout this article. Early studies in elutriation-synchronized cultures
suggest the metabolic cycling in single cells includes cycling of biosynthetic enzymes, mRNAs for
most biosynthetic genes and the translation rate (Creanor and Mitchison, 1982; Mitchison, 1969;
Slavov et al, 2012).
The dividing and the nondividing subpopulations that coexist during each metabolic cycle in
synchronized cultures demand efforts to identify the genes and processes unique to either growth or
division. To identify such genes and clarify the difference between the metabolic cycling in single
cells and in synchronized cultures, we exploited our earlier observation that the phases of distinct
subpopulations, i.e., dividing and nondividing, shift between different growth conditions (Slavov
and Botstein, 2011). We metabolically synchronized cultures of budding yeast over a wide range
of growth conditions, differing by their growth rates and biomass densities, and characterized their
gene expression and physiology. We found that the frequency of cycling in metabolically syn-
chronized cultures increases with biomass density, reinforcing the difference between metabolic
cycling in single cells and in synchronized cultures and providing the first evidence for quorum
sensing in budding yeast whose growth is limited by the carbon source (glucose) and not by nitro-
gen. Using these findings and our gene expression data, we developed a general model connecting
cell division and metabolic cycling in single cells to the entrained metabolic cycles observed in
synchronized cultures. This model can account for the measured gene expression over hundreds of
time points in both metabolically synchronized and in asynchronous cultures growing at different
growth rates, biomass densities, nutrient limitations, and carbon sources.
Results
Experimental Conditions
We metabolically synchronized yeast as described previously by Kuenzi and Fiechter (1969);
Slavov and Botstein (2011): we grew the DBY12007 diploid strain in glucose-limited media to
stationary phase and subsequently fed the cultures with glucose-limited media at constant rates.
The experimental factors that we regulated to achieve a variety of growth conditions were (i) the
concentration of glucose in the feed media, which determines the biomass density (Ferea et al,
1999; Slavov and Botstein, 2011; Slavov, 2010), and (ii) the dilution rate, which at steady-state
(or the oscillatory [limit-cycle] regime) equals the average growth rate of the cultures. Under these

5
conditions, our cultures synchronized metabolically, as manifested by the periodic oscillation in the
levels of dissolved oxygen in the culture media, Fig. 1A. Such measurements of dissolved oxygen
track closely with the oxygen consumption rate, as demonstrated by independent measurements
of oxygen in the exhaust gas (Murray et al, 2011; Sasidharan et al, 2012) and by the observation
that injecting a carbon source into a carbon-source-limited culture induces a precipitous drop of
the dissolved oxygen within seconds (Ronen and Botstein, 2006; Slavov, 2010). The trace of dis-
solved oxygen in these metabolically synchronized cultures can be divided phenomenologically
into two phases, the low oxygen consumption phase (LOC), when the amount of oxygen in the
media is high because the cells consume little oxygen, and the high oxygen consumption phase
(HOC), when the reverse holds. This division can be quantified rigorously using the distribution
of dissolved oxygen levels, Fig. 1B. The distribution is bimodal because a metabolically synchro-
nized culture spends most of the time either in HOC (left mode in Fig. 1B) or in LOC (right mode
Fig. 1B) and much less in the transition (the data points between the modes).
The Period of Metabolic Cycling in Synchronized Cultures Depends Linearly on the Growth
Rate and on the Glucose Concentration in the Feed Media
We sought to explore how the period of metabolic cycling of synchronized cultures depends on
the growth rate (doubling period of the culture) and on the concentration of glucose in the feed
media (determining the biomass density) while all other parameters were kept constant, Fig. 1C.
The data in Fig. 1C reinforce the linear dependence between the doubling periods of the cultures
and the periods of the metabolic cycle that we reported previously (Slavov and Botstein, 2011) and
show a striking new dependence: for a given growth rate, the higher the concentration of glucose
in the feed media ([Glu]feed), and thus the biomass density, the shorter the period of the metabolic
cycle. This dependence is quantified by the decreasing intercepts of the linear models fit to the data,
Fig. 1C. Such continuous dependence between the biomass density and the cycling period provides
a mechanistic link between the “short” and the “long” period metabolic cycling in synchronized
cultures that have been treated as different phenomena. In our experimental setup, we are able to
regulate continuously the frequency of metabolic cycling of synchronized diploid cultures simply
by changing the growth rate (dilution rate) or the biomass density ([Glu]feed). A haploid culture,
however, failed to synchronize for all combinations of growth rates and biomass densities; see
Discussion. The linear models in Fig. 1C also highlight a dependence between [Glu]feed and the
6
rate at which the frequency of the metabolic cycling in synchronized cultures changes with the
growth rate: the rate of change increases with increase of [Glu]feed, as quantified by the increasing
slopes.
The Metabolic Cycling in Synchronized Cultures is Emergent Behaviour
We observe that the frequency of metabolic cycling in synchronized cultures can be altered by
changing the [Glu]feed while the growth rate (µ) and the doubling period are held constant. The
dependence of the frequency on [Glu]feed, which determines the number of cells per ml in the
culture (Ferea et al, 1999; Slavov and Botstein, 2011; Slavov, 2010), suggests that some form
of cell-cell communication, dependent on population density, affects the population dynamics.
Therefore, the dynamics in a synchronized culture do not map one-to-one to the dynamics in
single cells but depend on cell-cell communication, and thus on the collective properties of the
culture. Remarkably, the increase of the cell density increases the frequency of the metabolic
cycling in the synchronized culture, in full accord with the predictions of models based on quorum-
sensing synchronization (Garcia-Ojalvo et al, 2004; Schwab et al, 2010). Examples of quorum-
sensing have been described in the distantly related Candida albicans (Hornby et al, 2001; Chen
et al, 2004) and in Saccharomyces cerevisiae whose growth is limited by nitrogen (Chen and Fink,
2006). Our data suggest that glucose-limited Saccharomyces cerevisiae may also have a quorum-
sensing mechanism. Different authors have shown that many different chemicals can affect the
transitions between the phases of metabolically synchronized cultures (Murray et al, 1999; Keulers
et al, 1996; Murray et al, 2003; Kwak et al, 2003; Robertson et al, 2008; Tu and McKnight, 2009);
we do not know which ones of these chemicals, if any, mediate the quorum sensing that we observe.
We find that at least two parameters can affect the frequency of metabolic cycling in synchro-
nized cultures: the biomass density and the dilution rate, which in the oscillatory (limit-cycle)
regime that we study equals the growth rate (µ) of the culture. These two parameters, however,
have very different effects on the duration of LOC relative to HOC. The increase in growth rate
shortens the duration of LOCs relative to HOC (Slavov and Botstein, 2011). In contrast, increase
in the biomass density shortens both LOC and HOC preserving their relative duration unchanged.

7
The Metabolic Cycling in Synchronized Cultures is Fueled by Reserved Carbohydrates and
Depends on Cell Density
The rate of glucose catabolism is higher during HOC than during LOC, since HOC is associated
with higher rates of oxidative phosphorylation, as revealed by higher oxygen consumption, and
also with higher rates of fermentation, as revealed by glycolytic fermentation (Von Meyenburg,
1969). On the other hand, a continuous metabolically synchronized culture has a constant influx
of glucose from the feed media. If the rate of glucose import equals the rate of glucose consump-
tion, the concentration of glucose in the culture media would oscillate, peaking during LOC and
reaching a nadir at the end of HOC. However, if the rate of glucose import equals the maximum
rate of import that yeast can achieve and is thus constant, the concentration of glucose in the cul-
ture media would be constant too, and the glucose used during the HOC phase must come from
intracellular stores. To distinguish between these two possibilities, we measured the concentration
of residual glucose in the culture medium of a synchronized culture fed with a medium containing
800mg/L glucose and growing at µ = 0.133h−1. We found that the residual glucose concentration
is constant across the metabolically synchronized cultures (Fig. 2) and in good agreement with the
corresponding concentration measured by Boer et al (2008) for an asynchronous culture growing
at this range of growth rates in a glucose-limited medium. The culture has a constant influx of
glucose from the feed media, and we measured a constant concentration of the residual glucose.
Thus, mass conservation requires that the glucose uptake by the culture be constant too. This result
is consistent only with the second mechanism and suggests that yeast maximize the rate of glucose
import and store glucose as reserved carbohydrates when it is not consumed. This inference is
consistent with the increased levels of intracellular trehalose and glycogen measured during the
LOC phase in yeast (Kuenzi and Fiechter, 1969; Shi et al, 2010), and with similar observation in
mammalian cells (Rousset et al, 1979). Hence, reserved carbohydrates are not just accumulated
throughout the G1 phase and used during S/G2/M phases of the CDC but they are also used dy-
namically during the metabolic cycle. The constant uptake of glucose most likely reflects that the
cells are taking up the limiting resource, glucose, as fast as possible given the concentration in the
media and their import capacity, Fig. 2.

8
Variation in the Fraction of Cells Dividing per Metabolic Cycle in Synchronized Cultures
Having demonstrated that the cycling in synchronized cultures is an emergent behavior that de-
pends on cell density, we next sought to understand how the cycling of a synchronized culture
relates to the subpopulations comprising the culture. To this end, we measured dissolved oxygen
and DNA content in three continuous, glucose-limited, metabolically synchronized cultures grow-
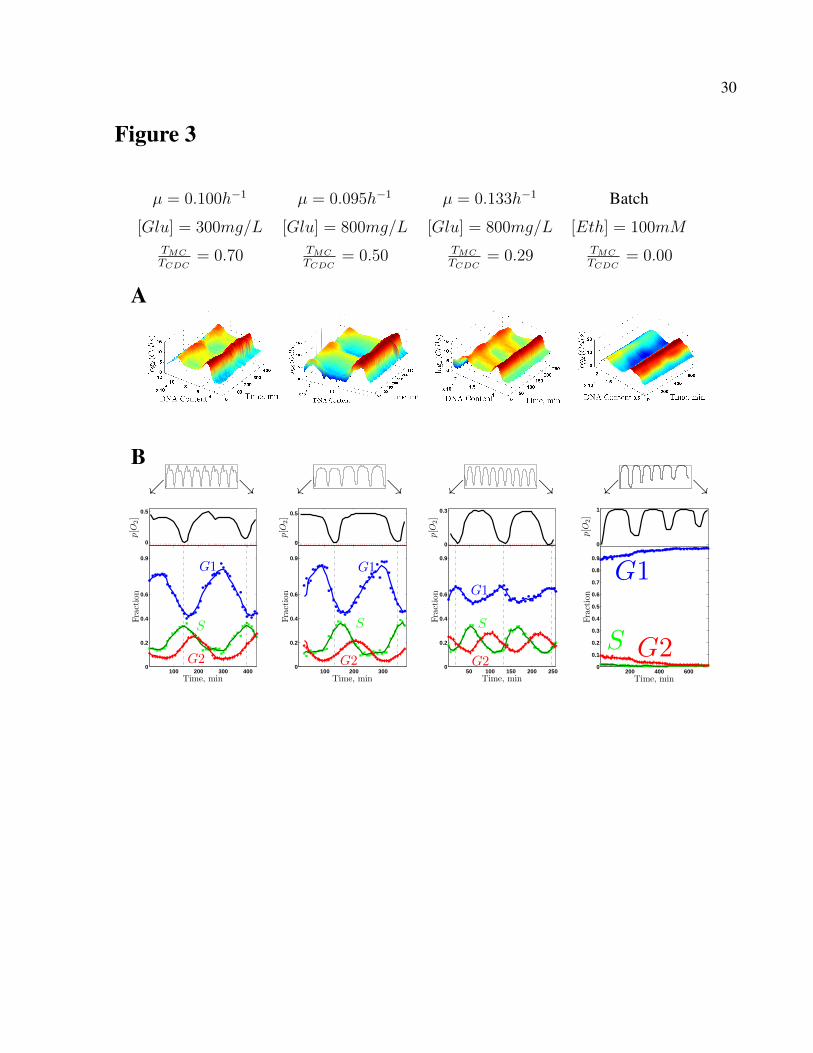
ing at different biomass densities and growth rates. Figure 3 displays the data from these cultures,
together with the previously published (Slavov et al, 2011) analogous data from a batch culture
growing in a phosphate-limited medium with ethanol as a sole source of carbon and energy. Each
of the continuous cultures was cycling steadily so that any two time-points with the same phase
had the same cell-density; thus, the fraction of cells dividing per metabolic cycle equals the ratio
of the period of metabolic cycling (TMC) to the CDC period (TCDC), TCDC
TMC, as displayed below the
growth parameters on the top of Fig. 3. In the batch culture, this ratio equals zero for the sampled
period since no cells passed the G1/S checkpoint (Slavov et al, 2011). These measurements of the
fraction of dividing cells per metabolic cycle in the synchronized cultures are consistent with the
DNA content measurements and demonstrate that our experimental setup has succeeded in achiev-
ing a substantial variation between the dividing and nondividing subpopulations across different
conditions of metabolic synchrony.
The Difference in Oxygen Consumption between LOC and HOC Decreases with Growth
Rate
The dissolved oxygen data in Fig. 3 have been normalized so that for each culture zero dissolved
oxygen corresponds to the lowest measured dissolved oxygen (highest consumption) and 1 cor-
responds to the dissolved oxygen in the medium before inoculation (zero consumption). These
data indicate a substantial variation between the relative dissolved oxygen levels during the LOC
and the HOC phases. At one extreme, the nondividing batch culture has extremely low oxygen
consumption during LOC. At the other extreme, the fastest growing continuous culture has very
high oxygen consumption in LOC relative to HOC. Generally, as growth rate increases, so does
the oxygen consumption during LOC relative to HOC. A possible explanation for this observation
is that as the growth rate increases and the relative duration of the LOC phase decreases (Slavov
and Botstein, 2011), the intensity of the physiological processes taking place in LOC and requiring
energy, such as macromolecular recycling and repair, also increases to compensate for the shorter

9
duration of the LOC phase.
The CDC Phases Shifts Relative to the Metabolic Phases in Synchronized Cultures
Since we have markers for both the division cycle (DNA content) and for the metabolic cycle
(dissolved oxygen), we can observe and characterize the two cycles across the studied growth con-
ditions. In the continuous cultures, the increase in the fraction of cells replicating DNA (G1/S tran-
sition; Fig. 3) always begins during HOC albeit with variation: at the very beginning of the HOC
phase (µ = 0.10h−1 and [Glu] = 300mg/L), midway through the HOC phase (µ = 0.133h−1
and [Glu] = 800mg/L) or somewhere in between (µ = 0.095h−1 and [Glu] = 800mg/L); This
variation is much more pronounced for the fraction of cells with duplicated DNA that peaks either
during LOC or during HOC. This variation is reinforced by the data for the largely nondividing
batch culture (Slavov et al, 2011), Fig. 3.
When each synchronized culture is considered independently, genes expressed in different sub-
populations, i.e., dividing and nondividing, would appear to be correlated with a specific phase
offset. As evident from Fig. 3, however, these correlations between the two subpopulations will
change as the offset between the metabolic and the division cycles changes in different conditions.
By considering the data for all conditions together, we can distinguish condition-specific correla-
tions from the condition-invariant correlations that hold across all growth conditions. For example,
the levels of genes expressed in dividing cells (S/G2/M) should always be correlated to each other
in the same way regardless of growth condition, i.e., have condition-invariant correlation. In con-
trast, the correlations between these genes expressed in dividing cells and the genes expressed
in the nondividing subpopulation are expected to change with the growth conditions (Slavov and
Botstein, 2011) as the phase offsets between different subpopulations shift. Furthermore, we can
associate the sets of genes that have condition-invariant correlations with either the cell division or
the cell growth cycle based on their correlation to either DNA content (cell division) or dissolved
oxygen (metabolism and cell growth).
Coordination of Gene Expression Dynamics during Cell Growth and Division
To identify such sets of correlation-invariant genes, we used DNA microarrays to measure gene
expression (see Methods) in all three cultures from Fig. 3. We combined and clustered these
data (Fig. 4) together with previously published gene-expression data from a batch metabolically-

10
synchronized culture growing in a phosphate-limited ethanol medium (Slavov et al, 2011) and
from a continuous glucose-limited culture (Tu et al, 2005). The most striking observation in the
clustered data (Fig. 4) is that despite the differences in growth conditions, the vast majority of
genes are expressed in the same phase relative to the trace of dissolved oxygen.
In stark contrast, the expression levels of a small cluster of genes (marked with a blue bar in
Fig. 4) shift relative to the phases of most other genes and the phase of the oxygen consumption.
These genes fall exactly within the above definitions of having condition-invariant correlations
to each other and condition-specific correlations to most of the other genes, we selected them
for further characterization, Fig. 5A. All of these genes are annotated to the G2 and M phases
of the CDC. Across all studied cultures, these genes correlate with cell division but not with the
oxygen consumption, Fig. 5A. This result demonstrates that the phase offsets between oxygen
consumption and DNA content from Fig. 3 are also reflected in similar offsets between the phases
of oxygen consumption and the expression of a coherent cluster of G2/M phase genes.
Notably, those genes that correlate with cell division are only a fraction of those annotated to
the cell cycle based on their periodic expression in mitotically synchronized cells (Gene Ontology
term GO : 0007049) growing in rich media (Spellman et al, 1998). Thus we sought to explore the
expression pattern of the remaining genes annotated to the CDC particularly since we previously
observed (Slavov et al, 2011) that the majority of the genes annotated to the CDC did not correlate
to the cell division as measured by DNA content. To test the generality of our previous observation,
we clustered the CDC-annotated genes that are expressed periodically in the nondividing batch
culture, Fig. 5B. The expression levels of these genes correlate strongly with the dissolved oxygen
in the media but not with the fraction of cells with replicated DNA, reinforcing and generalizing
our observations from the batch culture. The periodic transcription of many genes in concert with
the metabolic rather than the cell division cycle emphasizes the metabolic changes inherent in
growing cells and makes a clear distinction between growth and division. The extent to which this
transcriptional oscillation is translated into a protein oscillation depends on translational control
similar to the G1 cyclin Cln3 (Polymenis and Schmidt, 1997). Thus we conclude that most gene
annotated to the CDC are transcribed in concert with metabolism.
To explore gene expression patterns more globally and quantitatively, we decomposed the gene
expression data into singular vectors (Fig. 6). These vectors are low dimensional projections of
expression patterns that account for most of the variance (σ2) in the data, Fig. 6. The first singular

11
vector accounting for nearly half of the variance in gene expression is very similar for all cultures
and correlates in a very similar way to the dissolved oxygen (top panels in Fig. 6). This result
strongly supports the correlation between gene expression and oxygen consumption observed in
Fig. 4. The second singular vector in Fig. 6 is strikingly reminiscent of the carbon-source-specific
singular vector that we (Slavov and Botstein, 2011) found to account for 11% of the response
to changes in growth rate; it peaks during LOC in the continuous glucose-limited cultures, but
during HOC in the ethanol batch culture. This phase shift between gene-expression and oxygen-
consumption suggests an intriguing hypothesis, namely that the shift in the phase of some genes
might account for their carbon-source-specific growth rate responses (Slavov and Botstein, 2011).
The third singular vector (bottom panels in Fig. 6) is correlated to the oxygen consumption, similar
to the first one, but shows more variance across the different conditions of metabolic synchrony.
Metabolic Cycling can Account for the Carbon-source-specific Growth Rate Response Based
on the EAP Mechanism
Previously we reported that the growth-rate (GR) responses of 1500 genes, which do not depend on
the nature of the carbon source and the nutrient limitation, correlate very strongly with their phase
of peak expression in metabolically synchronized glucose-limited cultures (Slavov and Botstein,
2011). Based on this correlation and on the changes in the relative durations of the metabolic
phases that we measured (Slavov and Botstein, 2011), we suggested that the growth-rate (GR)
response of asynchronous cultures can be explained simply by the GR changes in the fraction of
cells in different phases of the metabolic and division cycles (Slavov and Botstein, 2011; Slavov
et al, 2011). We refer to this dependence between the composition of an asynchronous culture and
the population-average gene-expression of the culture as ensemble average over phases (EAP).
We also previously observed that a smaller subset of genes have opposite growth rate responses
in yeast grown on glucose or ethanol carbon source (Slavov and Botstein, 2011). Using the gene
expression across the metabolic cycle of a culture grown in ethanol medium and a culture grown
in glucose medium, we sought to test the hypothesis suggested by the second singular vector in
Fig. 6, namely whether the carbon-source-specific growth-rate responses can also be explained by
the EAP mechanism, similar to the universal growth-rate response (Slavov and Botstein, 2011).
This hypothesis would require that if a gene with a carbon-source-specific growth-rate response
peaks in HOC in ethanol, it peaks in LOC in glucose or vice versa.

12
To identify genes expressed in different metabolic phases and test whether such genes have
different GR slopes, we selected the genes whose corresponding gene-gene correlation vectors in
glucose and in ethanol are negatively correlated (Slavov and Dawson, 2009), whose expression
profiles are periodic as determined by correlation analysis (Slavov et al, 2011), and whose GR
slopes have opposite signs in ethanol and in glucose carbon source (Slavov and Botstein, 2011).
Clustering the resulting subset of genes indicated that indeed those genes shift phases (meaning
that their peaks move from HOC to LOC or vice versa) between ethanol and glucose, Fig. 7.
For each carbon source, the genes that peak during HOC have positive GR slopes in that carbon
source. Conversely, the genes that peak in LOC have negative GR slopes in that carbon source.
Thus, the EAP mechanism can explain the carbon-source-dependent GR responses of these genes,
confirming our hypothesis.
The genes peaking in LOC in glucose and in HOC in ethanol are enriched for energy generation
in the mitochondria. These genes include YAT1, YAT2, IDP2 that we characterized as having
carbon-source-dependent GR responses and being induced with growth-rate in ethanol but not in
glucose (Slavov and Botstein, 2011). This set of genes does not include structural mitochondrial
genes (those are not periodic in the batch culture, see Fig. 4). Thus, the phase shift in the expression
of mitochondrial genes between ethanol and glucose carbon source pertains to using mitochondria
for energy production from ethanol rather than making new mitochondria.
Discussion
Spontaneous respiratory oscillations in continuous cultures of Saccharomyces cerevisiae have been
known for decades (Kuenzi and Fiechter, 1969; Von Meyenburg, 1969) and treated as different
phenomena depending on the frequency of their synchronization. By gradually changing two pa-
rameters, biomass-density and growth-rate, we were able to: (i) demonstrate gradual transition
between the low and the high frequency respiratory cycles, suggesting common origin and biol-
ogy, and (ii) rigorously quantify the dependence among the growth parameters of the synchronized
cultures, their frequency of respiratory cycling, cell division, and gene-expression patterns. Fur-
thermore, we exploit the differences between respiratory oscillations under different conditions to
collect data that enabled us to characterize genes expressed in different subpopulations either with
the metabolic (cell growth) or with the cell division cycle. Such analysis is essential for distin-

13
guishing condition-invariant gene-gene correlations due to the timing of physiological processes
occurring in single cells from correlations induced by condition-dependent synchronization offsets
between subpopulations in synchronized cultures. We took advantage of yeast as a model organism
(Botstein and Fink, 2011) to rigorously characterize dynamics of cell growth and division that are
conserved in other eukaryotes (Slavov et al, 2012) less amenable to such quantitative experiments.
Influence of Carbon-source, Growth-rate and Biomass-density on Gene Expression and Cell
Division
A major result of our data and analysis is that the vast majority of highly-periodic genes are corre-
lated to each other in essentially the same way across all profiled conditions, regardless of strain-
background, carbon-source, growth-rate and biomass density; the mean-levels and the dynamics
of gene-expression change substantially among the diverse conditions we studied, but the rela-
tionships between the dynamic patterns of gene expression remain condition invariant. This result
strongly suggests that the fundamental biological functions of metabolism and cell growth are con-
served across the studied strain backgrounds, (CEN.PK and S288c), and actively regulated so that
the gene correlations among growth genes are preserved even when the duration of the phases of
metabolic cycling changes substantially (Fig. 1).
We also found that depending on the culture conditions, cell division shifts relative to the
metabolic phases. This result is supported both by the shift between the DNA-content and the
oxygen consumption data (Fig. 3), and by the shifts between the gene expression levels of the
genes oscillating with the two cycles (Fig. 5A). The G1/S transition always occurs during or around
the HOC phase (Fig. 3) but with a substantial variation depending on the growth conditions of
metabolic synchrony. Our data do not address directly the factors determining this variation and
future studies are required for its characterization. It could be that this variation is related to
the interaction between the quorum-sensing mechanism, which entrains the period of cycling at
the population level, and the average time that a cell needs, for the given experimental growth-
conditions, to complete the metabolic phases and become ready for the G1/S transition. Similar
temporal coincidence between high mitochondrial activity and oxygen consumption and the G1/S
transition is also observed in Drosophila melanogaster (Owusu-Ansah et al, 2008; Mandal et al,
2010) and human cells (Schieke et al, 2008; Mitra et al, 2009), and may be a general regulatory
mechanism (Slavov et al, 2012).
14
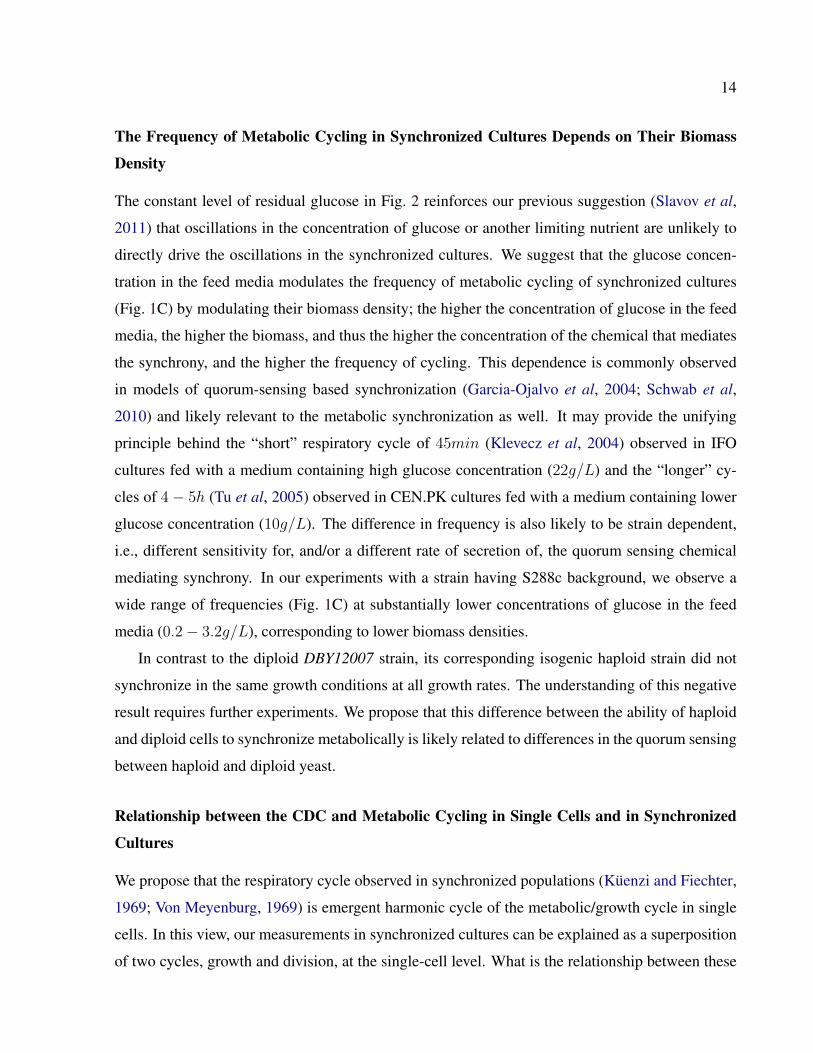
The Frequency of Metabolic Cycling in Synchronized Cultures Depends on Their Biomass
Density
The constant level of residual glucose in Fig. 2 reinforces our previous suggestion (Slavov et al,
2011) that oscillations in the concentration of glucose or another limiting nutrient are unlikely to
directly drive the oscillations in the synchronized cultures. We suggest that the glucose concen-
tration in the feed media modulates the frequency of metabolic cycling of synchronized cultures
(Fig. 1C) by modulating their biomass density; the higher the concentration of glucose in the feed
media, the higher the biomass, and thus the higher the concentration of the chemical that mediates
the synchrony, and the higher the frequency of cycling. This dependence is commonly observed
in models of quorum-sensing based synchronization (Garcia-Ojalvo et al, 2004; Schwab et al,
2010) and likely relevant to the metabolic synchronization as well. It may provide the unifying
principle behind the “short” respiratory cycle of 45min (Klevecz et al, 2004) observed in IFO
cultures fed with a medium containing high glucose concentration (22g/L) and the “longer” cy-
cles of 4− 5h (Tu et al, 2005) observed in CEN.PK cultures fed with a medium containing lower
glucose concentration (10g/L). The difference in frequency is also likely to be strain dependent,
i.e., different sensitivity for, and/or a different rate of secretion of, the quorum sensing chemical
mediating synchrony. In our experiments with a strain having S288c background, we observe a
wide range of frequencies (Fig. 1C) at substantially lower concentrations of glucose in the feed
media (0.2− 3.2g/L), corresponding to lower biomass densities.
In contrast to the diploid DBY12007 strain, its corresponding isogenic haploid strain did not
synchronize in the same growth conditions at all growth rates. The understanding of this negative
result requires further experiments. We propose that this difference between the ability of haploid
and diploid cells to synchronize metabolically is likely related to differences in the quorum sensing
between haploid and diploid yeast.
Relationship between the CDC and Metabolic Cycling in Single Cells and in Synchronized
Cultures
We propose that the respiratory cycle observed in synchronized populations (Kuenzi and Fiechter,
1969; Von Meyenburg, 1969) is emergent harmonic cycle of the metabolic/growth cycle in single
cells. In this view, our measurements in synchronized cultures can be explained as a superposition
of two cycles, growth and division, at the single-cell level. What is the relationship between these

15
cell autonomous cycles of growth and division in single-cells in the absence of cell-cell communi-
cation? In our culture with the lowest biomass density (µ = 0.10h−1 and [Glu]feed = 300mg/L),
most cells go through a single LOC and a single HOC phase before dividing as indicated by the
observation that 70% of the cells divide during each period of the culture, Fig. 3. The extrapolation
of this observation to the single-cell level predicts that a single-cell, when unperturbed, is likely to
go through a single LOC and HOC phase, replicate its DNA and divide. In contrast, if the growth is
entrained by cell-cell communication or perturbed by external stress, HOC and LOC can be short-
ened so that each cell has to go through multiple growth phases (as observed in the more dense
cultures in Fig. 1C) before it is ready to enter the S phase. In this context, the cell growth/metabolic
cycle and the CDC may be viewed not as separate cycles but as different phases of the cell life cy-
cle that are ordered in a sequence by the cyclin-dependent-kinases and the checkpoints. Our data
indicate that the relative duration and prominence of each phase changes, depending on the growth
conditions, to optimize cell growth and division in a changing environment.
The G1/S transition occurs close to the HOC phase in all continuous cultures that we studied.
This observation dovetails with similar observations across divergent eukaryotes (Owusu-Ansah
et al, 2008; Mandal et al, 2010; Schieke et al, 2008; Mitra et al, 2009; Slavov et al, 2012) and
brings about an attractive possibility: The activity of the target of rapamycin (TOR), a regulator
of biosynthesis and respiration (Schieke et al, 2006), may coordinate the metabolic and division
cycles. Indeed, the low activity of mammalian TOR observed in early G1 and high activity in
late G1 and S/G2/M phases (Schieke et al, 2008) can account for most changes in gene expression,
translation rate and respiration level observed during metabolic cycling. The characterization of the
molecular mechanisms by which TOR and other signalling pathways can control and be controlled
by the cycles of growth and division remains to be fully characterized (Fingar and Blenis, 2004b;
Duan and Pagano, 2011).
High-precision measurements of cell-volume (Goranov et al, 2009), cell-mass and cell-density
(Bryan et al, 2010) of single yeast cells have characterized the values and the variation of these
cell parameters during the cell division cycle of yeast growing in rich media. These results may be
related to the growth cycle that we study but there are two major differences worth emphasizing.
First, the previous studies focused on cells growing in rich media, in the regime of aerobic glycol-
ysis, and we have no direct data connecting the growth cycle that we observe in slowly growing,
respiring yeast to the growth and physiology of yeast growing by aerobic glycolysis in rich media.

16
The second major difference is in what is measured; the oscillations in storage carbohydrates are
exactly out of phase with the expected oscillations in synthesizing cell biomass and the two may
largely cancel their respective effects on the cell volume and mass, as would be suggested by the
constant flux of glucose uptake, Fig. 2. Indeed, studies that have measured both protein synthesis
and cell size (volume and mass) reported oscillations in protein synthesis but not in cell volume
and size (Creanor and Mitchison, 1982). Based on the connection between the stress-response that
we suggested (Slavov et al, 2012) and the correlation between mRNAs and their corresponding
proteins observed during osmotic stress (Lee et al, 2011), we expect that many of the increases
in mRNA levels will be reflected on the protein level as well albeit with altered magnitudes of
change.
Connecting the Dynamics of Cell Growth to the Gene Expression of Exponentially-Growing
Steady-State Asynchronous Cultures
We previously quantified the growth-rate dependent changes in the relative durations of the HOC
and the LOC phases based on the dissolved oxygen data in the media of synchronized cultures
(Slavov and Botstein, 2011). Since such growth-rate changes in the single-cell autonomous cell
growth/metabolic cycle will affect the composition of an asynchronous culture (fraction of cells
in different phases of the growth cycle), we have suggested that the population-average gene-
expression of the culture is an ensemble average over the phases (EAP) of the constituent cells
(Slavov and Botstein, 2011; Slavov et al, 2011, 2012). Our new data reinforce and extend this
model in two directions. First, our gene expression data demonstrate that the changes in the relative
durations of the LOC and the HOC phase occur not only at the level of oxygen consumption but
extend to the vast majority of periodically expressed genes (Fig. 4) as the model both predicts and
requires. Second, we demonstrate that the EAP mechanism can account for the population-average
expression-levels not only for the genes with carbon-source-independent growth-rate responses but
also for genes with carbon-source-dependent growth-rate responses. This finding provides further
support for the EAP mechanism and suggests that changes in the carbon-source alter the timing
of expression of hundreds of genes both in synchronous (Fig. 7) and in asynchronous cultures
(Slavov and Botstein, 2011). Taken together, our data and analysis underscore that cell growth
is not constant throughout the cell life-cycle but dynamically coupled to cell division in response
to nutrient availability and other conditions. Thus, understanding cell growth and division at the
17
single-cell level requires that both experiments and analysis transcend the confines of steady-state
approximations and delve into the rich dynamics of the physiological processes that define the life
cycle of cells.
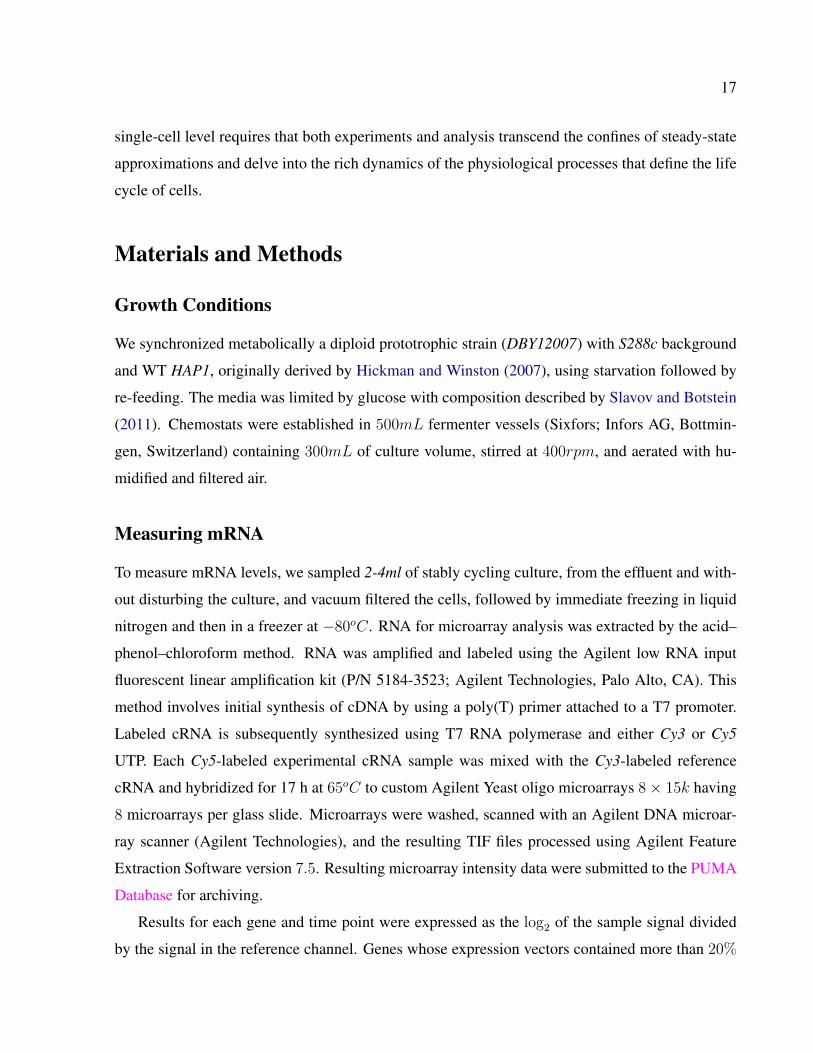
Materials and Methods
Growth Conditions
We synchronized metabolically a diploid prototrophic strain (DBY12007) with S288c background
and WT HAP1, originally derived by Hickman and Winston (2007), using starvation followed by
re-feeding. The media was limited by glucose with composition described by Slavov and Botstein
(2011). Chemostats were established in 500mL fermenter vessels (Sixfors; Infors AG, Bottmin-
gen, Switzerland) containing 300mL of culture volume, stirred at 400rpm, and aerated with hu-
midified and filtered air.
Measuring mRNA
To measure mRNA levels, we sampled 2-4ml of stably cycling culture, from the effluent and with-
out disturbing the culture, and vacuum filtered the cells, followed by immediate freezing in liquid
nitrogen and then in a freezer at −80oC. RNA for microarray analysis was extracted by the acid–
phenol–chloroform method. RNA was amplified and labeled using the Agilent low RNA input
fluorescent linear amplification kit (P/N 5184-3523; Agilent Technologies, Palo Alto, CA). This
method involves initial synthesis of cDNA by using a poly(T) primer attached to a T7 promoter.
Labeled cRNA is subsequently synthesized using T7 RNA polymerase and either Cy3 or Cy5
UTP. Each Cy5-labeled experimental cRNA sample was mixed with the Cy3-labeled reference
cRNA and hybridized for 17 h at 65oC to custom Agilent Yeast oligo microarrays 8× 15k having
8 microarrays per glass slide. Microarrays were washed, scanned with an Agilent DNA microar-
ray scanner (Agilent Technologies), and the resulting TIF files processed using Agilent Feature
Extraction Software version 7.5. Resulting microarray intensity data were submitted to the PUMA
Database for archiving.
Results for each gene and time point were expressed as the log2 of the sample signal divided
by the signal in the reference channel. Genes whose expression vectors contained more than 20%

18
missing values were filtered out. The small number of missing values in the expression vectors
of the remaining genes were replaced by the values computed from the linear interpolation of the
neighboring datapoints.
Measuring DNA Content
To measure DNA content, we diluted 200µl culture from each sampled time point with ethanol to
a final concentration of 70% ethanol and stored the samples in a freezer at −20oC. Subsequently,
the cells from each sample were pelleted and washed in 800µl 50mM sodium citrate at pH 7.2.
The washed cells were incubated overnight at 50oC in 500µl sodium citrate containing 250µg/ml
RNase A. Next, 50µl of 20mg/ml proteinase K were added to each sample and the samples were
returned back to 50oC for 2 more hours. After the incubation, each sample was sonicated for
10s and stained by the addition of 500µl 50mM sodium citrate containing 3µM SYTOX Green
(stock is 5 mM in DMSO from Molecular Probes Invitrogen). After 1 hour incubation in dark, the
DNA content of single cells from each sample was quantified by fluorescence activated cell sorting
(FACS).
Measuring Residual Glucose
Residual glucose was assayed in the filtrate (growth medium) from the samples for mRNA by
enzyme-coupled NADH oxidation reactions (assay kits from R-Biopharm, Darmstadt, Germany).
Between the filtration and the measurement, the samples were stored at −20oC.
Quantifying the period of metabolic cycling
To quantify the period of a metabolically synchronized culture, we used both (i) Fourier analysis
and (ii) direct measurements of the time-interval between two successive time-points during which
the culture has the same metabolic phase. For higher accuracy, we used the oxygen consumption
data only during stable oscillations (the limit cycle regimes) and averaged data from multiple
cycles. The two approaches gave statistically indistinguishable results and we present the result
from the more direct and intuitive measurement (ii).
19
Acknowledgments
We thank Sanford J. Silverman, David Schwab, and Jennifer Ewald for stimulating discussions
and feedback on the manuscript. Research was funded by a grant from the National Institutes of
Health (GM046406) and the NIGMS Center for Quantitative Biology (GM071508).
Figure Captions
Figure 1. The period of the metabolic cycling in synchronized cultures depends on thegrowth rate and on the biomass density. (A) The metabolic cycling can be can be dividedphenomenologically into two phases, the low oxygen consumption phase (LOC), when theamount of oxygen in the media is high because the cells consume little oxygen, and the highoxygen consumption phase (HOC) when the reverse holds. (B) The HOC and LOC phases can bequantified objectively based on the bimodality of the distribution of dissolved oxygen. (C)Independent continuous glucose-limited cultures were metabolically synchronized at the doublingperiods indicated on the x-axis and different biomass-densities corresponding to theconcentrations of glucose in the feed media indicated in the legend.
Figure 2. The residual glucose concentration remains constant throughout the metaboliccycling of synchronized cultures. Concentration of glucose in the culture media of ametabolically synchronized culture at growth rate µ = 0.133h−1 and glucose concentration in thefeed media [Glucose] = 800mg/L. The dissolved oxygen in the media is shown on the top.
Figure 3. The CDC phases shift relative to the phases of the oxygen consumption. Fourcultures were synchronized at different growth rates and carbon-sources (top) and profiled forDNA content and oxygen consumption. (A) The distributions of DNA content in single cell weremeasured by FACS and used to infer the fraction of cells in the phases of the CDC (B).

20
Figure 4. Clustered gene-expression data from five cultures synchronized at differentgrowth conditions. Hierarchically clustered gene expression data from the cultures described inFig. 3 and from a continuous glucose-limited culture (Tu et al, 2005). The data from each cultureand for each gene has been centered to zero mean to emphasize the oscillatory pattern. Thedissolved oxygen in the media during the sampling, scaled for best visibility, is indicated by thebars on the top. Clustering is based on non-centered correlation computed using all shown data.The gene-expression data in this and all other figures are displayed on a log2 scale (Eisen et al,1998).
Figure 5. The expression levels of genes annotated to cell division correlate either to oxygenconsumption or to DNA content. The genes annotated to the CDC can be separated into twosubsets based on their expression levels: genes correlating to DNA content and this cell division(A) and genes correlating to oxygen consumption (B). The top panels show the fraction of cellswith duplicated DNA in each culture from Fig. 3, rescaled for better visibility. The middle panelsshow the dissolved oxygen, also rescaled for visibility. The bottom panels show the geneexpression levels, displayed on a log2 scale, for the subsets of genes annotated to the CDC thateither correlate to cell division (A) or to oxygen consumption (B).
Figure 6. Dominant gene expression patterns. Singular value decomposition (SVD) of the geneexpression data from Fig. 4. Each column corresponds to a synchronized culture, the same orderan notation as in Fig. 4 and each row corresponds to a singular vector. The fraction of the varianceσ2 explained by each singular vector is indicated by the red numbers to the right of the panels.
Figure 7. Hundreds of periodic genes shift phases between glucose and ethanolcarbon-sources. The mean-centered expression levels of genes with phase-shifts are shown inthe phosphate-limited ethanol batch culture (left panel) and in the glucose-limited continuousculture (middle panel) growing at µ = 0.095h−1. The right panel shows the growth rate (GR)slopes from the same genes in phosphate-limited ethanol media (first column) and inglucose-limited media (second column). The clustering permutation was computed based only onthe gene expression data from the metabolically synchronized cultures. We previously computedgrowth rate (GR) slopes by regressing transcript levels against the growth rate (Brauer et al, 2008;Slavov and Botstein, 2011); positive GR slopes indicate increasing expression with growth rateand negative GR slopes indicate decreasing expression.

21
References
Benanti J (2012) Coordination of Cell Growth and Division by the Ubiquitin-Proteasome System.
In Seminars in Cell & Developmental Biology. Elsevier
Blank HM, Gajjar S, Belyanin A, Polymenis M (2009) Sulfur Metabolism Actively Promotes
Initiation of Cell Division in Yeast. PLoS ONE 4: e8018
Boer VM, Amini S, Botstein D (2008) Influence of genotype and nutrition on survival and
metabolism of starving yeast. Proceedings of the National Academy of Sciences 105: 6930–
6935
Botstein D, Fink GR (2011) Yeast: an experimental organism for 21st century biology. Genetics
189: 695–704
Brauer MJ, Huttenhower C, Airoldi EM, Rosenstein R, Matese JC, Gresham D, Boer VM, Troy-
anskaya OG, Botstein D (2008) Coordination of Growth Rate, Cell Cycle, Stress Response, and
Metabolic Activity in Yeast. Mol Biol Cell 19: 352–367
Bryan A, Goranov A, Amon A, Manalis S (2010) Measurement of mass, density, and volume
during the cell cycle of yeast. Proceedings of the National Academy of Sciences 107: 999
Cairns RA, Harris IS, Mak TW (2011) Regulation of cancer cell metabolism. Nature Reviews
Cancer 11: 85–95, PMID: 21258394
Chen H, Fink G (2006) Feedback control of morphogenesis in fungi by aromatic alcohols. Genes
development 20: 1150
Chen H, Fujita M, Feng Q, Clardy J, Fink G (2004) Tyrosol is a quorum-sensing molecule in
Candida albicans. Proceedings of the National Academy of Sciences of the United States of
America 101: 5048
Chin SL, Marcus IM, Klevecz RR, Li CM (2012) Dynamics of oscillatory phenotypes in Saccha-
romyces cerevisiae reveal a network of genome-wide transcriptional oscillators. FEBS Journal
Creanor J, Mitchison J (1982) Patterns of protein synthesis during the cell cycle of the fission yeast
Schizosaccharomyces pombe. Journal of cell science 58: 263–285

22
Dang C (2012) Links between metabolism and cancer. Genes Development 26: 877–890
Duan S, Pagano M (2011) Linking metabolism and cell cycle progression via the APC/CCdh1 and
SCFβTrCP ubiquitin ligases. Proceedings of the National Academy of Sciences 108: 20857–
20858
Eisen M, Spellman P, Brown P, Botstein D (1998) Cluster analysis and display of genome-wide
expression patterns. Proceedings of the National Academy of Sciences 95: 14863
Ferea T, Botstein D, Brown P, Rosenzweig R (1999) Systematic changes in gene expression pat-
terns following adaptive evolution in yeast. Proceedings of the National Academy of Sciences
96: 9721
Fingar D, Blenis J (2004a) Target of rapamycin (TOR): an integrator of nutrient and growth factor
signals and coordinator of cell growth and cell cycle progression. Oncogene 23: 3151–3171
Fingar D, Blenis J (2004b) Target of rapamycin (TOR): an integrator of nutrient and growth factor
signals and coordinator of cell growth and cell cycle progression. Oncogene 23: 3151–3171
Garcia-Ojalvo J, Elowitz MB, Strogatz SH (2004) Modeling a synthetic multicellular clock: Re-
pressilators coupled by quorum sensing. Proceedings of the National Academy of Sciences of
the United States of America 101: 10955 –10960
Goranov A, Amon A (2010) Growth and division–not a one-way road. Current opinion in cell
biology 22: 795–800
Goranov A, Cook M, Ricicova M, Ben-Ari G, Gonzalez C, Hansen C, Tyers M, Amon A (2009)
The rate of cell growth is governed by cell cycle stage. Genes development 23: 1408
Hickman M, Winston F (2007) Heme levels switch the function of Hap1 of Saccharomyces cere-
visiae between transcriptional activator and transcriptional repressor. Molecular and Cellular
Biology 27: 7414–7424
Hoose S, Rawlings J, Kelly M, Leitch M, Ababneh Q, Robles J, Taylor D, Hoover E, Hailu B,
McEnery K, et al (2012a) A Systematic Analysis of Cell Cycle Regulators in Yeast Reveals That
Most Factors Act Independently of Cell Size to Control Initiation of Division. PLoS Genetics 8:
e1002590

23
Hoose SA, Rawlings JA, Kelly MM, Leitch MC, Ababneh QO, Robles JP, Taylor D, Hoover EM,
Hailu B, McEnery KA, Downing SS, Kaushal D, Chen Y, Rife A, Brahmbhatt KA, Smith III R,
Polymenis M (2012b) A Systematic Analysis of Cell Cycle Regulators in Yeast Reveals That
Most Factors Act Independently of Cell Size to Control Initiation of Division. PLoS Genet 8:
e1002590
Hornby J, Jensen E, Lisec A, Tasto J, Jahnke B, Shoemaker R, Dussault P, Nickerson K (2001)
Quorum sensing in the dimorphic fungus Candida albicans is mediated by farnesol. Applied and
environmental microbiology 67: 2982
Jain M, Nilsson R, Sharma S, Madhusudhan N, Kitami T, Souza AL, Kafri R, Kirschner MW,
Clish CB, Mootha VK (2012) Metabolite Profiling Identifies a Key Role for Glycine in Rapid
Cancer Cell Proliferation. Science 336: 1040–1044
Johnston G, Pringle J, Hartwell L (1977) Coordination of growth with cell division in the yeast
Saccharomyces cerevisiae. Experimental cell research 105: 79–98
Jorgensen P, Nishikawa J, Breitkreutz B, Tyers M (2002) Systematic identification of pathways
that couple cell growth and division in yeast. Sciences STKE 297: 395
Jorgensen P, Tyers M (2004) How cells coordinate growth and division. Current Biology 14:
R1014–R1027
Keulers M, Satroutdinov A, Suzuki T, Kuriyama H (1996) Synchronization affector of autonomous
short-period-sustained oscillation of Saccharomyces cerevisiae. Yeast 12: 673–682
Klevecz RR, Bolen J, Forrest G, Murray DB (2004) A genomewide oscillation in transcription
gates DNA replication and cell cycle. Proceedings of the National Academy of Sciences of the
United States of America 101: 1200–1205
Kuenzi MT, Fiechter A (1969) Changes in carbohydrate composition and trehalase-activity during
the budding cycle of Saccharomyces cerevisiae. Archiv Fr Mikrobiologie 64: 396–407, PMID:
4916776
Kwak W, Kwon G, Jin I, Kuriyama H, Sohn H (2003) Involvement of oxidative stress in the reg-
ulation of H2S production during ultradian metabolic oscillation of Saccharomyces cerevisiae.
FEMS microbiology letters 219: 99–104

24
Laxman S, Tu BP (2010) Systems approaches for the study of metabolic cycles in yeast. Current
Opinion in Genetics Development 20: 599–604
Lee M, Topper S, Hubler S, Hose J, Wenger C, Coon J, Gasch A (2011) A dynamic model of
proteome changes reveals new roles for transcript alteration in yeast. Molecular systems biology
7
Machne R, Murray D (2012) The Yin and Yang of Yeast Transcription: Elements of a Global
Feedback System between Metabolism and Chromatin. PloS one 7: e37906
Mandal S, Freije WA, Guptan P, Banerjee U (2010) Metabolic control of G1-S transition: cyclin E
degradation by p53-induced activation of the ubiquitin-proteasome system. The Journal of Cell
Biology 188: 473–479
Mitchison J (1969) Enzyme synthesis in synchronous cultures. Science 165: 657
Mitra K, Wunder C, Roysam B, Lin G, Lippincott-Schwartz J (2009) A hyperfused mitochon-
drial state achieved at G1-S regulates cyclin E buildup and entry into S phase. Proceedings of
the National Academy of Sciences of the United States of America 106: 11960–11965, PMID:
19617534
Murray D, Beckmann M, Kitano H (2007) Regulation of yeast oscillatory dynamics. Proceedings
of the National Academy of Sciences 104: 2241
Murray D, Engelen F, Lloyd D, Kuriyama H (1999) Involvement of glutathione in the regulation of
respiratory oscillation during a continuous culture of Saccharomyces cerevisiae. Microbiology
145: 2739–2745
Murray D, Klevecz R, Lloyd D (2003) Generation and maintenance of synchrony in Saccha-
romyces cerevisiae continuous culture. Experimental cell research 287: 10–15
Murray DB, Haynes K, Tomita M (2011) Redox regulation in respiring Saccharomyces cerevisiae.
Biochimica Et Biophysica Acta 1810: 945–958, PMID: 21549177
Murray DB, Lloyd D (2007) A tuneable attractor underlies yeast respiratory dynamics. Bio Systems
90: 287–294, PMID: 17074432

25
Neufeld T, Edgar B (1998) Connections between growth and the cell cycle. Current opinion in cell
biology 10: 784–790
Owusu-Ansah E, Yavari A, Mandal S, Banerjee U (2008) Distinct mitochondrial retrograde signals
control the G1-S cell cycle checkpoint. Nature genetics 40: 356–361
Polymenis M, Schmidt E (1997) Coupling of cell division to cell growth by translational control
of the G1 cyclin CLN3 in yeast. Genes development 11: 2522
Robertson JB, Stowers CC, Boczko E, Johnson CH (2008) Real-time luminescence monitoring of
cell-cycle and respiratory oscillations in yeast. Proceedings of the National Academy of Sciences
105: 17988 –17993
Ronen M, Botstein D (2006) Transcriptional response of steady-state yeast cultures to transient
perturbations in carbon source. Proceedings of the National Academy of Sciences of the United
States of America 103: 389–394
Rousset M, Chevalier G, Rousset J, Dussaulx E, Zweibaum A (1979) Presence and cell growth-
related variations of glycogen in human colorectal adenocarcinoma cell lines in culture. Cancer
research 39: 531
Sasidharan K, Tomita M, Aon M, Lloyd D, Murray DB (2012) Time-Structure of the Yeast
Metabolism In vivo, In Advances in Systems Biology, Goryanin II, Goryachev AB (eds), vol-
ume 736 of Advances in Experimental Medicine and Biology, Springer New York, ISBN 978-1-
4419-7210-1, pp. 359–379
Schieke SM, McCoy JP, Finkel T (2008) Coordination of mitochondrial bioenergetics with G1
phase cell cycle progression. Cell Cycle Georgetown Tex 7: 1782–1787, PMID: 18583942
Schieke SM, Phillips D, McCoy JP, Aponte AM, Shen RF, Balaban RS, Finkel T (2006) The Mam-
malian Target of Rapamycin (mTOR) Pathway Regulates Mitochondrial Oxygen Consumption
and Oxidative Capacity. Journal of Biological Chemistry 281: 27643–27652
Schwab DJ, Baetica A, Mehta P (2010) Dynamical quorum-sensing and synchronization of non-
linear oscillators coupled through an external medium. arXiv10124863
26
Shi L, Sutter BM, Ye X, Tu BP (2010) Trehalose Is a Key Determinant of the Quiescent Metabolic
State That Fuels Cell Cycle Progression upon Return to Growth. Mol Biol Cell 21: 1982–1990
Silverman S, Petti A, Slavov N, Parsons L, Briehof R, Thiberge S, Zenklusen D, Gandhi S, Larson
D, Singer R, et al (2010) Metabolic cycling in single yeast cells from unsynchronized steady-
state populations limited on glucose or phosphate. Proceedings of the National Academy of
Sciences 107: 6946–6951
Slavov N (2010) Universality, specificity and regulation of S. cerevisiae growth rate response in
different carbon sources and nutrient limitations. Ph.D. thesis, Princeton University
Slavov N, Airoldi EM, van Oudenaarden A, Botstein D (2012) A conserved cell growth cycle can
account for the environmental stress responses of divergent eukaryotes. Molecular Biology of
the Cell 23: 1986–1997
Slavov N, Botstein D (2011) Coupling among growth rate response, metabolic cycle, and cell
division cycle in yeast. Molecular Biology of the Cell 22: 1997–2009
Slavov N, Botstein D (2013) Decoupling Nutrient Signaling from Growth Rate Causes Aerobic
Glycolysis and Deregulation of Cell-Size and Gene Expression. Molecular Biology of the Cell
24: 157–168
Slavov N, Budnik B, Schwab D, Airoldi E, van Oudenaarden A (2014) Constant Growth Rate Can
Be Supported by Decreasing Energy Flux and Increasing Aerobic Glycolysis. Cell Reports 7:
705 – 714
Slavov N, Dawson KA (2009) Correlation signature of the macroscopic states of the gene regula-
tory network in cancer. Proceedings of the National Academy of Sciences 106: 4079–4084
Slavov N, Macinskas J, Caudy A, Botstein D (2011) Metabolic cycling without cell division cy-
cling in respiring yeast. Proceedings of the National Academy of Sciences of the United States
of America 108: 19090–19095
Spellman PT, Sherlock G, Zhang MQ, Iyer VR, Anders K, Eisen MB, Brown PO, Botstein D,
Futcher B (1998) Comprehensive Identification of Cell Cycle-regulated Genes of the Yeast Sac-
charomyces cerevisiae by Microarray Hybridization. Mol Biol Cell 9: 3273–3297

27
Tu B, McKnight S (2006) Metabolic cycles as an underlying basis of biological oscillations. Nature
Reviews Molecular Cell Biology 7: 696–701
Tu B, McKnight S (2009) Evidence of carbon monoxide-mediated phase advancement of the yeast
metabolic cycle. Proceedings of the National Academy of Sciences 106: 14293–14296
Tu BP, Kudlicki A, Rowicka M, McKnight SL (2005) Logic of the Yeast Metabolic Cycle: Tem-
poral Compartmentalization of Cellular Processes. Science 310: 1152–1158
Turner J, Ewald J, Skotheim J (2012) Cell Size Control in Yeast. Current biology 22: R350 – R359
Tzur A, Kafri R, LeBleu V, Lahav G, Kirschner M (2009) Cell growth and size homeostasis in
proliferating animal cells. Sciences STKE 325: 167
Von Meyenburg HK (1969) Energetics of the budding cycle of Saccharomyces cerevisiae during
glucose limited aerobic growth. Archives of Microbiology 66: 289–303
Wilson E (1900) The cell in development and inheritance. Macmillan
Wyart M, Botstein D, Wingreen NS (2010) Evaluating Gene Expression Dynamics Using Pairwise
RNA FISH Data. PLoS Comput Biol 6: e1000979

28
Figure 1
50 100 150 200 250 300 35030
35
40
45
50
55
60
65
Time, min
Dissolved
oxygen
p[O
2],%
High Oxygen Consumption (HOC )
Low Oxygen Consumption (LOC )A
30 35 40 45 50 55 600
50
100
150
200
250
300
350
Dissolved oxygen p[O2],%
Phase
duration,min
High OxygenConsumption (HOC )
Low Oxygen Consumption(LOC )
B
0 100 200 300 400 500 600 700 800 9000
100
200
300
400
500
600
700
Doubling Period, min
MetabolicCyclingPeriod,min
C [Glu] = 0.3 g/L, Slope=1.1[Glu] = 0.4 g/L, Slope=1.1[Glu] = 0.8 g/L, Slope=1.0[Glu] = 1.6 g/L, Slope=0.9Linear Model

29
Figure 2p[O
2],%
0 50 100 150 200 2500
20
40
60
80
Time, min
[Glucose],mg/L
30
Figure 330
Figure 3
µ = 0.100h−1 µ = 0.095h−1 µ = 0.133h−1 Batch
[Glu] = 300mg/L [Glu] = 800mg/L [Glu] = 800mg/L [Eth] = 100mM
TMC
TCDC= 0.70 TMC
TCDC= 0.50 TMC
TCDC= 0.29 TMC
TCDC= 0.00
A
B↙ ↘ ↙ ↘ ↙ ↘ ↙ ↘
0
0.5
p[O
2]
100 200 300 4000
0.2
0.4
0.6
0.9
Time, min
Fraction
G1
S
G2
100 200 3000
0.5
p[O
2]
100 200 3000
0.2
0.4
0.6
0.9
Time, min
Fraction
G1
S
G2
0
0.3
p[O
2]
50 100 150 200 2500
0.2
0.4
0.6
0.9
Time, min
Fraction G1
S
G2
0
1
p[O
2]
200 400 6000
0.1
0.2
0.3
0.4
0.5
0.6
0.7
0.8
0.9
Time, min
Fraction
G1
S G2

31
Figure 4p[O
2]
µ = 0.100h−1 µ = 0.095h−1 µ = 0.133h−1 µ = 0.1h−1 Batch
−1
−0.8
−0.6
−0.4
−0.2
0
0.2
0.4
0.6
0.8
1
CDC
Mitoch
ondria

32
Figure 5
Ap[O
2]
CDC,G2
Time, min
CDC
Gen
es
1 94 188 276 371
Time, min16 91 170 245 320
Time, min1 59 117 165 215
Time, min
1 147 290 461 652−1
−0.5
0
0.5
1
B
p[O
2]
CDC,G2
Time, min
CDC
Gen
es
1 94 188 276 371
Time, min16 91 170 245 320
Time, min1 59 117 165 215
Time, min
1 147 290 461 652−1
−0.5
0
0.5
1

33
Figure 6
−0.1
0
0.1
−0.1
−0.05
0
0.05
0.1
SingularVectorComponen
ts
100 200 300 400
−0.1
0
0.1
100 200 300 50 100 150 200 250
Time, min200 400 600 800 200 400 600
p[O
2],%
0.45%
0.12%
0.11%
σ2

34
Figure 7
0
50
100
p[O
2]
Ethanol Centered Glucose Centered
Time, min
OutofPhase
Gen
es
GR Slopes
1 147 290 461 652Time, min
16 114 215 312Carbon Source
Eth Glu
−2 0 2