Extension Programs in Economics: An Assessment
24
Extension Programs in Economics: An Assessment Gregory M. Perry a a Author is Professor in the Department of Agricultural and Resource Economics, Oregon State University. Presented at the Agricultural and Applied Economics 2009 Meetings, Milwaukee, WI.
Transcript of Extension Programs in Economics: An Assessment

Extension Programs in Economics: An Assessment
Gregory M. Perrya
a Author is Professor in the Department of Agricultural and Resource Economics, Oregon State University. Presented at the Agricultural and Applied Economics 2009 Meetings, Milwaukee, WI.

Extension Programs in Economics: An Assessment
Programs in economics have been an integral part of cooperative agricultural extension
work since passage of the Smith-Lever Act in 1914. When created, the mandate given to
extension was to
• Develop practical applications of research knowledge;
• Provide instruction and practical demonstrations of existing or improved practices or
technologies in agriculture.
For example, a major emphasis during the 1920’s and 1930’s was in helping teach farm
management concepts to farm operators in each state. Extension personnel with expertise in
economics also taught farmers about marketing and helped operators organize cooperatives to
buy and sell farm commodities.
Extension was created at a time when the United States was still a largely rural, agrarian
nation. In 1910, for example, there were over 32 million farm residents on 6.4 million farms,
representing one out of every three Americans (Banks, Beale and Bowles). The present situation
is now very different. In 2002 there were about 3 million farm residents on 2.1 million farms,
representing about one out of every 100 Americans. A recent ECOP document, The Extension
System: A Vision for the 21st Century, stated:
“This nation’s extraordinary Extension network was developed to respond to early 20th Century needs when the economy was primarily agricultural, the population was predominantly rural, the industrial revolution was dominant, and the drivers of social change appeared contained within the boundaries of our nation. Nearly a century later the United States is primarily a heterogeneous, urban society dominated by technological and communications advances, myriad niches of employment and varied sources of wealth affected daily by global, economic and political alliances and turmoil” (p. 2).
This vision document by ECOP identifies challenges to those working in extension and
encourages greater engagement. It delineates ways in which extension can become more

engaged at all levels. However, the document fails to mention one critical component being
demanded from government organizations at all levels: Accountability. Members of Congress
and other national, state and local policymakers want to know how their support for all
government programs translates into improved societal welfare. In this area, outreach lags
behind research and teaching.
For example, if a congresswoman called the USDA to learn what research is being done
on the economics of technological change in tree fruit production, someone within CSREES
would be able to use the CRIS database to identify who is doing research on this issue, where the
work is taking place, how much money is being spent on the problem, the research papers that
have been published and so on. On the extension side, CSREES might be able to identify
someone working in this area, but could not give any sense as to expenditures on educational
programs that had been provided to those who might be interested in this issue. More generally,
information about who works in extension economics is not tracked at the federal level, let alone
some sense about to their activities as extension economists.
In their book Scholarship Assessed, Glassick, Huber and Maeroff noted the importance of
applied research (or outreach) as an output of all institutions of higher learning. Yet their survey
of 1,380 institutions of higher learning found that fewer than one-third of the respondent
universities conducted any independent assessments of their outreach faculty. How does one
assess the quality of an extension program? And what might that assessment look like?
The purpose of this paper is to take a first step in answering three questions: (1) What is
the current mix of extension economists in the United States, specifically by area of
specialization, age, location (by state and on or off-campus), by gender and by educational
degree? (2) Given the current age mix and hiring trends, what might extension economics look

like in 10 years? (3) What might a survey of extension economists reveal about where the most
respected extension economic programs are located?
Profiling Extension Economics
As noted beofre, CSREES does not maintain lists of faculty in the states who work in
extension, regardless of the field. Therefore, a critical first step in carrying out this study was to
create such a list for extension economists who operate in each state. This was done by
contacting the departmental heads or extension directors in each state and asking them to provide
names of faculty with extension appointments, along with the FTE each has in extension and
what is their major field of expertise. This information was collected in February and March of
2008. Additional information regarding areas of expertise, location and educational
accomplishments were obtained from websites and by contacting the individual faculty. The list
includes individuals who largely function as extension economists, even if they (occasionally)
don’t have any degrees in economics. It also includes faculty who are partially retired, those on
soft money support, those who serve as administrators and those who work out of county
extension offices but serve a multi-county area. Vacant positions that were in the process of
being filled were also included. A summary of the results by state is provided in Table 1.
By this reckoning, there were 569 extension economists in the 50 states, of which 409
were on campus (including 15 vacancies). The total FTE in extension was 261.7 for on-campus
and 145.7 for off-campus, for an average FTE per faculty member of 0.64 for on-campus and
0.91 for off-campus faculty. The largest contingent of extension faculty was in Texas, with 44
faculty (or almost 8% of all extension faculty nationally). Two states (Rhode Island and West
Virginia) had no economists on extension appointments. Massachusetts has blended their
monies and required that each of their teaching and research faculty devote 5% of their time to
outreach activities.
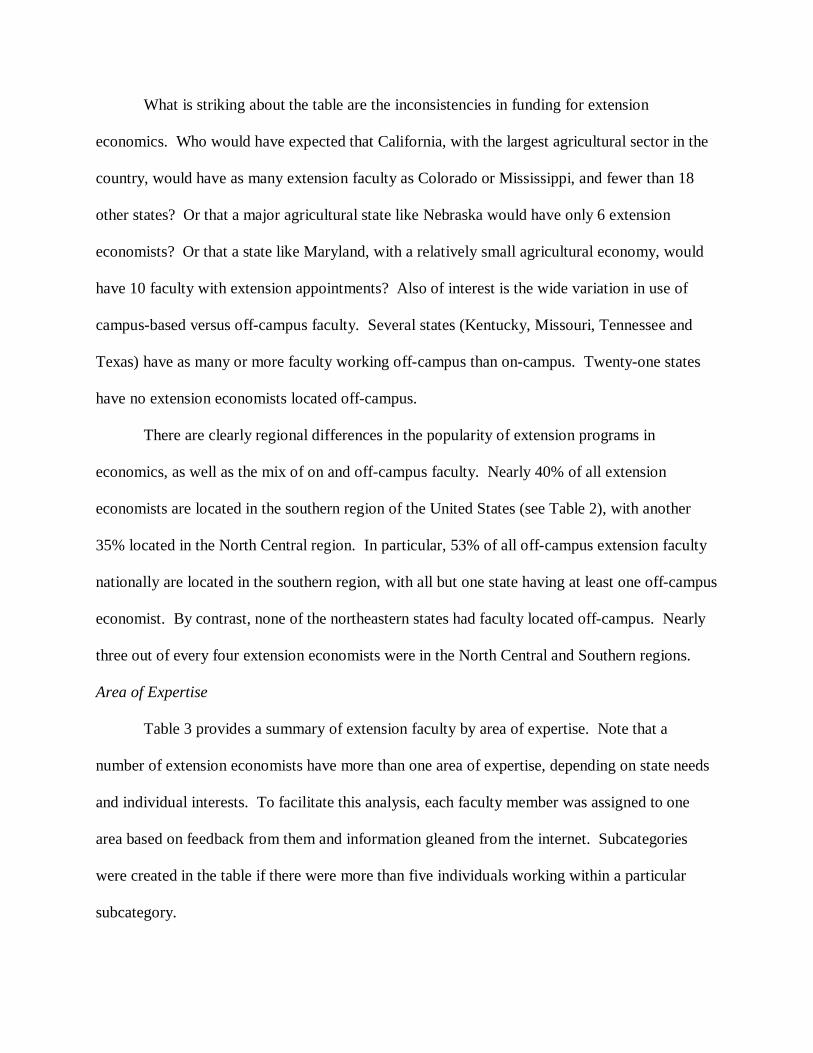
What is striking about the table are the inconsistencies in funding for extension
economics. Who would have expected that California, with the largest agricultural sector in the
country, would have as many extension faculty as Colorado or Mississippi, and fewer than 18
other states? Or that a major agricultural state like Nebraska would have only 6 extension
economists? Or that a state like Maryland, with a relatively small agricultural economy, would
have 10 faculty with extension appointments? Also of interest is the wide variation in use of
campus-based versus off-campus faculty. Several states (Kentucky, Missouri, Tennessee and
Texas) have as many or more faculty working off-campus than on-campus. Twenty-one states
have no extension economists located off-campus.
There are clearly regional differences in the popularity of extension programs in
economics, as well as the mix of on and off-campus faculty. Nearly 40% of all extension
economists are located in the southern region of the United States (see Table 2), with another
35% located in the North Central region. In particular, 53% of all off-campus extension faculty
nationally are located in the southern region, with all but one state having at least one off-campus
economist. By contrast, none of the northeastern states had faculty located off-campus. Nearly
three out of every four extension economists were in the North Central and Southern regions.
Area of Expertise
Table 3 provides a summary of extension faculty by area of expertise. Note that a
number of extension economists have more than one area of expertise, depending on state needs
and individual interests. To facilitate this analysis, each faculty member was assigned to one
area based on feedback from them and information gleaned from the internet. Subcategories
were created in the table if there were more than five individuals working within a particular
subcategory.

Farm management is the largest area of expertise, representing 25% of all on-campus
and nearly 50% of all off-campus faculty. The farm management area is no longer a major focus
in most graduate programs (see Perry), but represents about 1/3 of all extension faculty. Second
in total numbers are faculty in the community and economic development area, with 13% of all
faculty.
The adaptability of extension programs to statewide needs is evident in the diversity of
specializations evident in the group of extension economists. There are, for example, commodity
specialists for seafood, potatoes, cotton, poultry, citrus, soybeans, swine, horticulture, rice, and
alternative crops. No doubt these positions were created with strong support from the industries
they support. But there are also extension economists working in a wide variety of issues that
broadly spill over into areas outside traditional agricultural and resource economics, such as
Claudia Parliament’s program in K-12 economics education, programs at Purdue and North
Carolina State in natural resource leadership, Bonnie Carew’s programs in rural health policy
and Wally Tyner’s programs in energy economics.
Table 4 provides a summary of expertise areas by region. Much of the regional mix in
extension economists is as expected, but there are some surprises. Not too surprising was the
fact that nearly a quarter of all extension economists in the northeastern area work on resource
and environmental issues. What was surprising is that virtually no one in that same region works
primarily in the community development area (although some do limited work in this area).
Another distinction of the southern region apparent in this table is the greater use of commodity
specialists, apparently at the expense of farm management economists. It is also noteworthy
that the western region has the greatest proportion of community development economists.

Degrees Held and Gender
Among on-campus faculty, 325 (83%) held PhD degrees, 50 (13%), held MS degrees,
and 12 held JD degrees (including five with both JD and PhD degrees). Ten of those holding
PhD degrees received them from fields outside of economics or agricultural economics. For the
off-campus faculty, 91 (59%) held MS degrees and only 47 (31%) held PhD degrees. Also
noteworthy is that the average time between receiving the MS and PhD degrees for on-campus
faculty was over six years, suggesting a substantial number took full-time jobs before returning
to school to start or complete the PhD.
The gender mix in extension economics leans heavily toward men. Less than 15% of on-
campus extension economists are female and only 12% of those holding the PhD degree are
female. The mix only improves slightly when moving to off-campus positions. Eighteen percent
of off-campus extension economists are women, but only 13% of off-campus faculty who hold
the PhD degree are women. There has been a shift in recent years toward employing more
women in extension economics positions, a point that will be discussed in the next section.
Faculty Mix by Age
Replicating the results from Tables 2-4 by age provides great insight into how areas of
specialization, regional location, educational accomplishments and gender are shifting over time.
These data can also be used to project what extension economics is going to look like in another
decade and perhaps beyond. Because date of birth information was not readily available for each
faculty member, the year each received their BS degree was used as a proxy for age. These data
were obtained for 97% of all on-campus and 70% of all off-campus faculty. The results were
sorted into four groups, representing faculty who received their BS degree (1) before 1970, (2)
1970-1979, (3) 1980-1989, and (4) 1990 to present. Assuming the average person received their
BS degree at age 23, this breakdown suggests the first group are all eligible for retirement and

have probably already experienced substantial attrition from their ranks. In 10 years few
individuals in this group will still be working. The second group is just beginning to enter the age
to retire, so many of these economists will likely also no longer be working in 10 years. The
third and fourth groups should still be working in 10 years.
Table 5 provides a summary of characteristics for on-campus faculty by age group.
These numbers confirm that extension economists are an aging group, with 55% in the first two
groups. In other words, 1/3 or more of all the on-campus extension economists in the country
seem poised to retire in the next decade. Although the 1990-2004 group is larger in terms of
years than the 1970-79 and 1980-89, it also has experienced the smallest number of hires. The
trends are clear: Extension economics has been shrinking, and the recent economic troubles will
do nothing but accelerate that shrinkage.
These numbers hide an important caveat, however. It is that the shrinkage is not uniform,
but varies from place to place across the United States. Losses appear to be most severe in the
northeast (see Table 6), where nearly 2/3 of all extension economists are in the two categories
slated to be decimated by retirements over the next decade. By contrast, the Southern region
doesn’t appear to be suffering at all from shrinking extension programs in economics. The North
Central region also appears to have about half of their extension economists in the younger two
age groups.
The age mix for the off-campus faculty is more uniform (Table 7). Only 44 percent of
the faculty FTEs for off-campus extension economists are in the first two age cohorts. In fact,
the 1980-89 and 1990-2007 groups contain about the same percentage of faculty as the 1970-79
group. Again, the last group spans more years, suggesting some shrinkage is taking place, but at
much lower rates than is occurring with on-campus positions.

The hiring patterns off-campus (as shown in Table 8) tend to reflect an even younger age
cohort than is the case on-campus (Table 6). Why this the case is not clear, although one could
suggest a number of potential causes:
• More new positions are being created off-campus rather than on-campus, creating more
opportunities for new, younger faculty to enter the ranks of extension economists;
• Ancedotal evidence suggests off-campus positions pay less than on-campus positions, so
there may be more attrition from off-campus positions into the private sector;
• Some of the brighter and more motivated off-campus faculty may complete degree work
and otherwise distinguish themselves so that they get hired as on-campus statewide
extension specialists. These moves would create openings for new, younger hires off-
campus and add to the proportion of older faculty on-campus;
Table 9 provides a further breakdown by age, region and area of expertise. This level of
detail stretches the limits of the data in some categories, because there are so few faculty within
these categories. There are some interesting patterns, however. Note that percentages for each
row add to 100%, so comparing across rows provides some indication of how hiring patterns
have changed over time by region. For example, 27% of the extension economists in the North
Central region who graduated with a BS before 1970 were in the farm management area,
compared to 41% of the 1970-79 BS recipients, 21% of the 1980-89 BS recipients and 23% of
those receiving the BS in 1990 or later. Farm management hires remain strong across regions
and age categories, suggesting their expertise remains relevent. Agribusiness expertise tends to
more in demand recently than in past decades, beginning in the North Central region and
spreading to the other three regions. Marketing expertise and commodity specialists seem to
have experienced a small decline in importance.
Evaluating Extension Program Quality
The last part of this paper addresses the issue of evaluating the quality of extension
programs in each state. Universities, following the lead of other public and private entities, have
placed increased focus on accountability of programs. This effort, in turn, has motivated
universities to place increased emphasis on developing performance measures to track
improvements in student learning. The research community has long had an interest in
evaluating research quality through use of citation indices, program rankings and the like.
Evaluating the quality of outreach programs has proven more challenging. Most in the extension
community will agree that an important signal of extension program quality is the impact that
programs have on client groups. Developing a systematic way to evaluate impact, particularly
when comparing between programs in different states, remains a very illusive task.
In approaching this idea of evaluating extension program quality, I borrowed from the
work that I and others have done to evaluate the quality of graduate programs in our profession.
The approach is very simple: Ask other professionals for their evaluation of extension programs
in their area of expertise. The idea is that quality stands out and is recognized by peers across the
country. Consequently, I sent surveys to all 550 or so extension economists asking them to
identify up to 10 statewide extension programs in their area of expertise. They were then to use
a 1-5 scale to rank the quality of these extension programs, where 5 equals an Excellent program
and 1 equals a poor program. In assessing quality of programs, respondents were asked to
consider (1) overall program impact, (2) regional and national reputation, (3) quality and
appearance of materials produced by the program, and (4) types and quality of material available
on the internet.
The response rate to the initial survey was extremely low from the off-campus extension
economists. To me, this signaled that these faculty either were not interested in the study or,

more likely, felt unqualified to respond to the survey questions. For this reason, the survey effort
shifted to the on-campus faculty. The sample size for this population was 394 faculty.
The survey response rate was 31% (see Table 10), with a greater proportion of responses
coming from the Western region and lowest return rate in the North Central region. Of the 31%
responding nationally, nearly one in three responses (9%) indicated that they didn’t know enough
about extension programs outside their state to identify and rank them. Another one in eight
surveys (4%) were returned with the respondent indicating that they were not going to respond,
usually because they felt that this was an inappropriate way to evaluate extension programs.
Despite having experience doing several of these ranking studies for graduate programs
in our profession, I was still surprised by the negative reaction to the survey as expressed by a
number of faculty. One response representative of this reaction was a letter from five Kansas
State extension faculty, expressing concern that the survey focused on suppliers rather than users
of extension services. Their underlying concern with the survey was that the results would lead
to extension focusing more resources on “limited resource farmers and small towns” at the
expense of production agriculture. They suggested that, instead, research on this topic should
involve conducting a phone survey of those using extension services and asking them for
feedback about those services.
I will concede that the approach used here is limited because of the population being
surveyed. That said, a stakeholder survey would have its own significant flaws and is much
more involved and expensive than this study. And this survey does indicate both the national
profile and quality of extension programs, as evaluated by peers in the profession. Peer
evaluation is a key component of published research and in the promotion and tenure process.
Good extension economists are always on the lookout for new programs to present to their
clientele groups. Many quality extension programs can be adapted to other situations and reused

elsewhere. The low response rate to the survey (particularly by off-campus faculty) along with
the high rate of “Don’t Know” responses suggests that extension economists aren’t spending
enough time together learning about what others do.
If I were a critic of extension programs, I could interpret the low responses and high level
of professed ignorance as an indictment of extension economists. I would argue that the results
indicate that the majority have become complacent in their positions, uninterested in learning
about and doing anything new in their programs. But I am not going to take on the role of critic,
in part because I know that some who chose not to respond are bright economists who offer
excellent programs. I am going to be more generous in my interpretation and suggest that
extension economists feel they are too busy to organize and attend meetings where program
information is exchanged. Also, that what I was asking of them required a new way of
evaluating extension programs that they were not accustomed to nor comfortable with.
Program rankings were received from 65 individuals. Sufficient responses were received
to provide results in five areas – Farm Management, Marketing, Community Development,
Agribusiness and Natural Resources.
Farm Management
The ranking results for farm management are summarized in Table 11. The response rate
was 33% in this category (32 of 97 individuals surveyed), but only 20 respondents provided
ranking information. Only those programs ranked by at least 10 (50%) of respondents in this
area were reported in the Table. Three of the respondents did not provide numerical rankings,
but simply indicated their top programs. Kansas State’s farm management program received the
highest average ranking (4.7). Illinois, Purdue and Texas A&M were also highly regarded in the
farm management area. Minnesota and Oklahoma State were ranked by nine respondents, Iowa

State by eight respondents, and UC-Davis by seven respondents. About than 30 other programs
were ranked by at least one respondent.
Marketing
The results for extension marketing are provided in Table 12. The response rate was 36%
(20 of 55 individuals surveyed), but only 12 provided actual rankings. One did not provide
numerical rankings. The table results are limited to those schools ranked by 50% or more of the
12 respondents. There seemed to be much more consensus on the top programs in marketing.
Kansas State was mentioned by 10 of 12 respondents and received the highest average rating,
4.6. Oklahoma State was mentioned by all but one respondent and received an average score of
3.9. Texas A&M tied with Kansas State for the highest average score, but was mentioned on
fewer survey responses. Iowa State, Illinois, Purdue and Georgia were also well regarded by
survey respondents. Another 20 schools were mentioned by at least one respondent.
Community Development
The results for extension programs in community development are summarized in Table
13. The response rate was 27% (15 of 56 individuals surveyed), but rankings were limited to
nine surveys. One did not provide numerical rankings. Like the marketing results, there was
more uniformity of opinion in where the top programs are in community development.
Wisconsin was included in rankings by all nine respondents and received the highest average
score (4.5). Missouri and Penn State were mentioned on seven surveys, Missouri’s score was the
same as that for Wisconsin. Five other schools (Minnesota, Clemson, Ohio State, Illinois and
Purdue) were all mentioned by more than half of the respondents and received above average
scores. Another 18 schools were ranked by at least one respondent, although only Iowa State,
Oklahoma State and Nevada-Reno were ranked by three respondents.

Agribusiness
The ranking results for Agribusiness extension programs are provided in Table 14. The
response rate was 27% (7 of 26 individuals surveyed), rankings were provided by seven
respondents. The top five extension programs in agribusiness are located at Purdue, Iowa State,
Kansas State, Minnesota and Texas A&M. Purdue’s program received the highest average score,
4.5. The other four programs received above average scores. Another 20 programs were ranked
by respondents, only three (Florida, Kentucky and Oklahoma State) were mentioned on three
surveys.
Natural Resources
The survey results for Land and Water Resources are given in Table 15. The response
rate was the highest of any group at 46% (19 of 41 individuals surveyed), but only five provided
rankings. North Carolina, Penn State, Oregon State, Colorado State and Florida all were
identifed by three of the five respondents. All but Florida received average scores of 4.0 or
higher. Another 18 universities were ranked by respondents.
Innovative Programs
Those participating in the survey were also asked to identify up to five programs in the
country that they believe have done a good to exceptional job of adapting to the needs of
traditional and new clientele groups. In identifying these programs, they were instructed to look
beyond their own area of expertise and evaluate all extension economics programs. Responses
were received from 53 faculty. No ranking nor numerical evaluation was assigned to these
results by respondents. Consequently, the frequency that each program was reported is an
indication of its reputation for innovative programming.
Texas A&M was identified by 21 (40%) of respondents as an innovative program. The
next most often identified innovative programs were Purdue (36%), Kansas State (30%), Illinois

(21%) and Iowa State (19%). Also mentioned by five or more respondents were Minnesota,
Oklahoma State, Michigan State, Missouri and Wisconsin.
Summary and Conclusions
The purpose of this study was threefold: (a) To describe the current mix of extension
economists in the United States, (b) to examine the current mix by age as a way of projecting
what extension economics might look like in a decade and (c) to identify quality programs in
extension economics, as evaluated by those within the profession.
The largest contingent of on-campus extension economists is located at Purdue, although
more than 20 faculty with extension appointments are also found at North Carolina State and
Texas A&M. West Virginia and Rhode Island have no extension economists. About 60% of
extension economists nationally are located on campus, off-campus economists are particularly
popular in the Southern region. Nearly three out of every four extension economists in the
country are in the North Central and Southern regions.
Farm management specialists account for about one-third of all extension economists in
the US. Community development, marketing, agribusiness, commodity, and resource specialists
account for the bulk of the other specialty areas. There are some new and innovative extension
programs located in some states, but these programs generally remain targeted at the traditional
agricultural production clientele.
Analysis of the data by age does reveal that extension economics is changing. Faculty
are becoming more diverse, particularly in the gender area. Movement is toward greater use of
MS trained people in extension economics positions, particularly off-campus. There also seems
to be a trend toward hiring more faculty for off-campus positions.
Ancedotal evidence suggests that the number of economists funded by extension has been
in decline for a decade or more. Certainly the evidence suggesting that half the extension
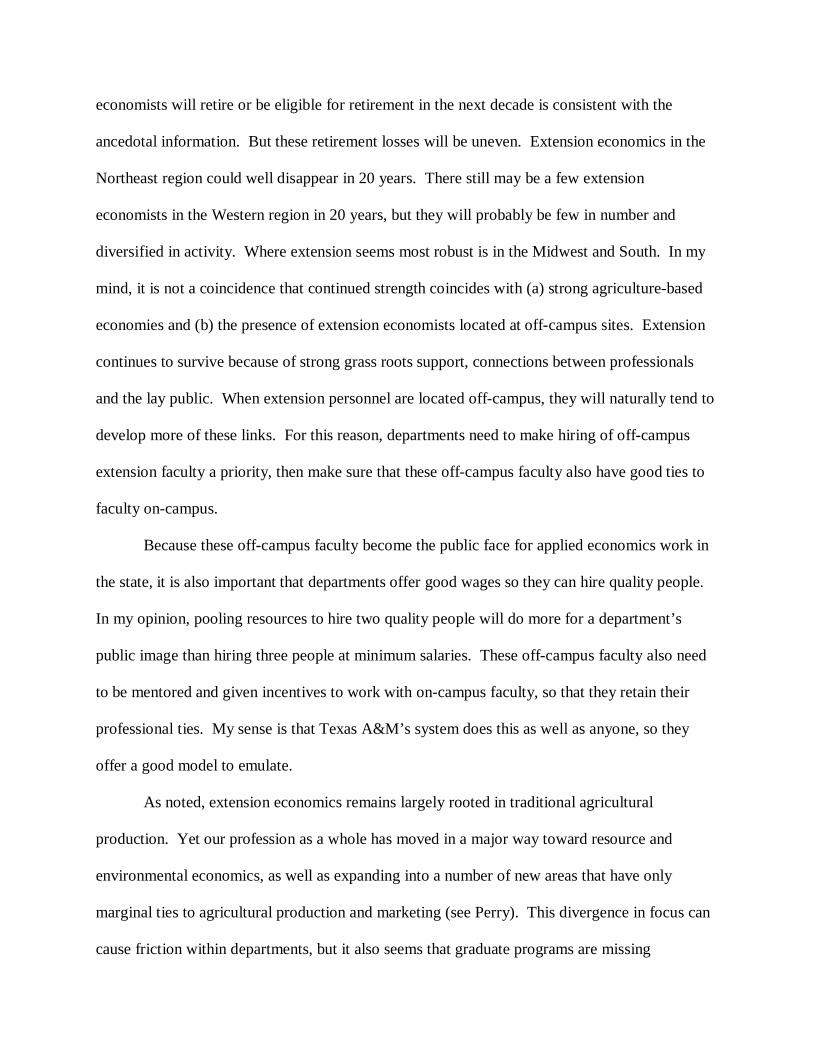
economists will retire or be eligible for retirement in the next decade is consistent with the
ancedotal information. But these retirement losses will be uneven. Extension economics in the
Northeast region could well disappear in 20 years. There still may be a few extension
economists in the Western region in 20 years, but they will probably be few in number and
diversified in activity. Where extension seems most robust is in the Midwest and South. In my
mind, it is not a coincidence that continued strength coincides with (a) strong agriculture-based
economies and (b) the presence of extension economists located at off-campus sites. Extension
continues to survive because of strong grass roots support, connections between professionals
and the lay public. When extension personnel are located off-campus, they will naturally tend to
develop more of these links. For this reason, departments need to make hiring of off-campus
extension faculty a priority, then make sure that these off-campus faculty also have good ties to
faculty on-campus.
Because these off-campus faculty become the public face for applied economics work in
the state, it is also important that departments offer good wages so they can hire quality people.
In my opinion, pooling resources to hire two quality people will do more for a department’s
public image than hiring three people at minimum salaries. These off-campus faculty also need
to be mentored and given incentives to work with on-campus faculty, so that they retain their
professional ties. My sense is that Texas A&M’s system does this as well as anyone, so they
offer a good model to emulate.
As noted, extension economics remains largely rooted in traditional agricultural
production. Yet our profession as a whole has moved in a major way toward resource and
environmental economics, as well as expanding into a number of new areas that have only
marginal ties to agricultural production and marketing (see Perry). This divergence in focus can
cause friction within departments, but it also seems that graduate programs are missing

opportunities to train and place graduate students. A few graduate programs ought to consider
offering a two-track program for prospective PhD students. The first track would train students
to do quality research suitable for publication in quality journals. These students would be hired
into research-teaching tenure track positions in economics and applied economics programs.
The second track would train students for positions in extension-teaching type positions. The
program for these students would deemphasize the high powered math and statistics common to
most PhD programs. Instead, students would receive a good grounding in economic theory and
use of quantitative tools, along with experience working on challenging problems faced by
extension economists. Alternatively, programs could increase the rigour of MS programs such
that they have this same level of theory and quantitative training.
References
Banks, V.J., C.L. Beale, and G.K. Bowles. Farm Population Estimates for 1910-62. USDA-Economic Research Service. ERS-130. 1963.
Extension Committee on Organization and Policy (ECOP). The Extension System: A Vision for the 21st Century. National Association of State Universities and Land Grant Colleges, Washington, D.C. February 2002.
Perry, G.M. “What is the Future of Agricultural Economics Departments and the Agricultural and Applied Economics Association?” Review of Agricultural Economics (in press).
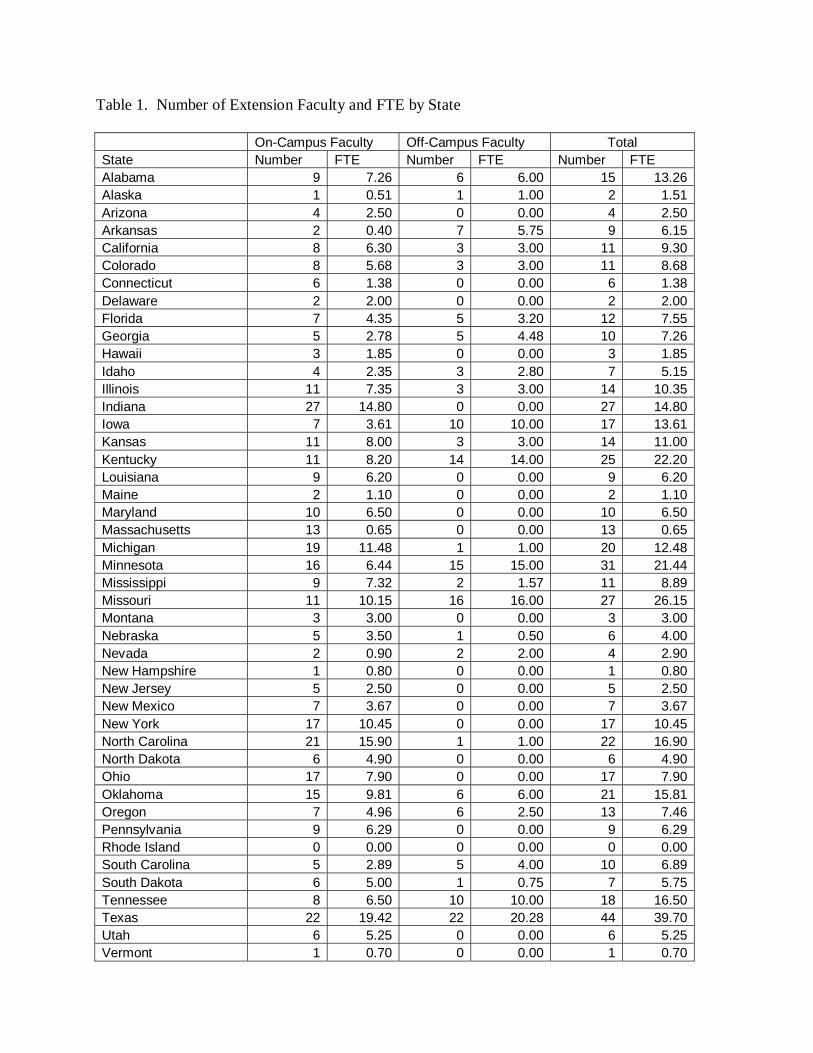
Table 1. Number of Extension Faculty and FTE by State
On-Campus Faculty Off-Campus Faculty Total State Number FTE Number FTE Number FTE Alabama 9 7.26 6 6.00 15 13.26Alaska 1 0.51 1 1.00 2 1.51Arizona 4 2.50 0 0.00 4 2.50Arkansas 2 0.40 7 5.75 9 6.15California 8 6.30 3 3.00 11 9.30Colorado 8 5.68 3 3.00 11 8.68Connecticut 6 1.38 0 0.00 6 1.38Delaware 2 2.00 0 0.00 2 2.00Florida 7 4.35 5 3.20 12 7.55Georgia 5 2.78 5 4.48 10 7.26Hawaii 3 1.85 0 0.00 3 1.85Idaho 4 2.35 3 2.80 7 5.15Illinois 11 7.35 3 3.00 14 10.35Indiana 27 14.80 0 0.00 27 14.80Iowa 7 3.61 10 10.00 17 13.61Kansas 11 8.00 3 3.00 14 11.00Kentucky 11 8.20 14 14.00 25 22.20Louisiana 9 6.20 0 0.00 9 6.20Maine 2 1.10 0 0.00 2 1.10Maryland 10 6.50 0 0.00 10 6.50Massachusetts 13 0.65 0 0.00 13 0.65Michigan 19 11.48 1 1.00 20 12.48Minnesota 16 6.44 15 15.00 31 21.44Mississippi 9 7.32 2 1.57 11 8.89Missouri 11 10.15 16 16.00 27 26.15Montana 3 3.00 0 0.00 3 3.00Nebraska 5 3.50 1 0.50 6 4.00Nevada 2 0.90 2 2.00 4 2.90New Hampshire 1 0.80 0 0.00 1 0.80New Jersey 5 2.50 0 0.00 5 2.50New Mexico 7 3.67 0 0.00 7 3.67New York 17 10.45 0 0.00 17 10.45North Carolina 21 15.90 1 1.00 22 16.90North Dakota 6 4.90 0 0.00 6 4.90Ohio 17 7.90 0 0.00 17 7.90Oklahoma 15 9.81 6 6.00 21 15.81Oregon 7 4.96 6 2.50 13 7.46Pennsylvania 9 6.29 0 0.00 9 6.29Rhode Island 0 0.00 0 0.00 0 0.00South Carolina 5 2.89 5 4.00 10 6.89South Dakota 6 5.00 1 0.75 7 5.75Tennessee 8 6.50 10 10.00 18 16.50Texas 22 19.42 22 20.28 44 39.70Utah 6 5.25 0 0.00 6 5.25Vermont 1 0.70 0 0.00 1 0.70

Virginia 6 3.13 1 1.00 7 4.13Washington 7 4.45 1 1.00 8 5.45West Virginia 0 0.00 0 0.00 0 0.00Wisconsin 11 6.33 5 2.96 16 9.29Wyoming 7 4.30 2 0.95 9 5.25Total 409 261.71 160 145.74 569 407.45
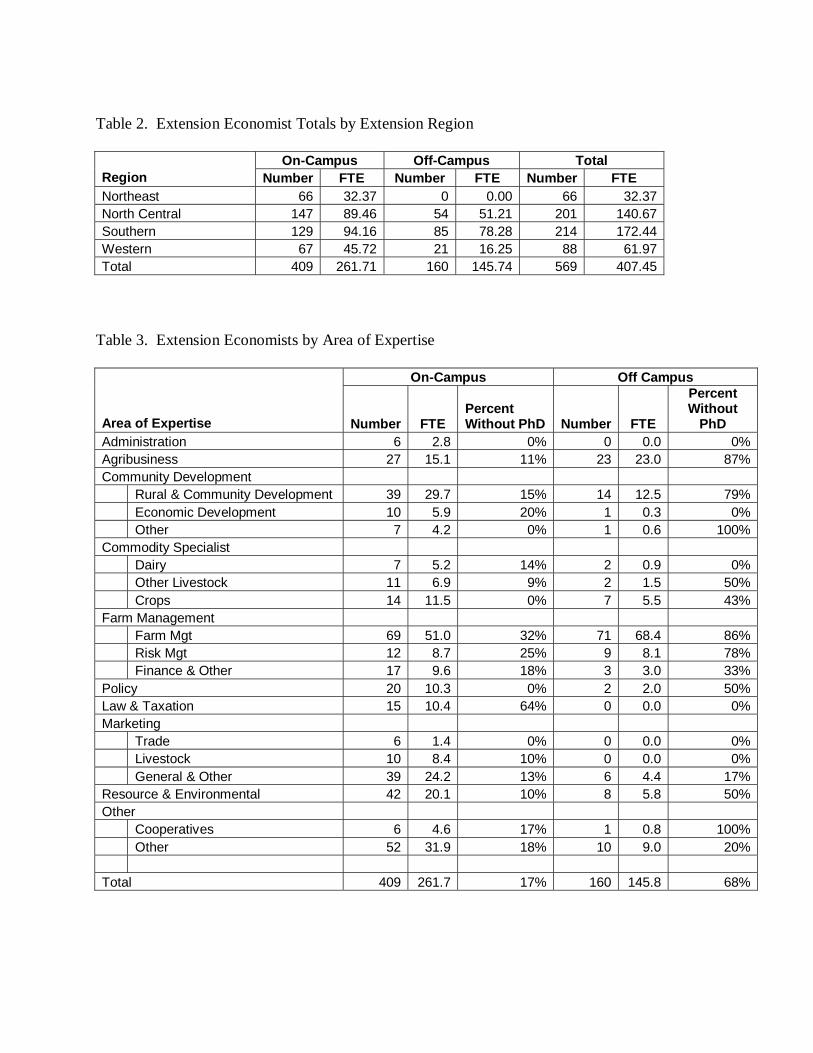
Table 2. Extension Economist Totals by Extension Region
On-Campus Off-Campus Total Region Number FTE Number FTE Number FTE Northeast 66 32.37 0 0.00 66 32.37North Central 147 89.46 54 51.21 201 140.67Southern 129 94.16 85 78.28 214 172.44Western 67 45.72 21 16.25 88 61.97Total 409 261.71 160 145.74 569 407.45
Table 3. Extension Economists by Area of Expertise
On-Campus Off Campus
Area of Expertise Number FTE Percent Without PhD Number FTE
Percent Without
PhD Administration 6 2.8 0% 0 0.0 0%Agribusiness 27 15.1 11% 23 23.0 87%Community Development Rural & Community Development 39 29.7 15% 14 12.5 79% Economic Development 10 5.9 20% 1 0.3 0% Other 7 4.2 0% 1 0.6 100%Commodity Specialist Dairy 7 5.2 14% 2 0.9 0% Other Livestock 11 6.9 9% 2 1.5 50% Crops 14 11.5 0% 7 5.5 43%Farm Management Farm Mgt 69 51.0 32% 71 68.4 86% Risk Mgt 12 8.7 25% 9 8.1 78% Finance & Other 17 9.6 18% 3 3.0 33%Policy 20 10.3 0% 2 2.0 50%Law & Taxation 15 10.4 64% 0 0.0 0%Marketing Trade 6 1.4 0% 0 0.0 0% Livestock 10 8.4 10% 0 0.0 0% General & Other 39 24.2 13% 6 4.4 17%Resource & Environmental 42 20.1 10% 8 5.8 50%Other Cooperatives 6 4.6 17% 1 0.8 100% Other 52 31.9 18% 10 9.0 20% Total 409 261.7 17% 160 145.8 68%

Table 4. Percent of Faculty in Areas of Expertise by Region
Region Agri-business
Community Development
CommoditySpecialist
Risk/Farm Management Marketing
Resource/ Environmental Other
North Central 15 13 4 29 12 2 25 Northeast 2 3 6 32 10 24 24 Southern 10 13 13 18 17 8 21 Western 5 18 6 24 11 18 18
Table 5. Characteristics of On-Campus Extension Economists by Age Category
BS Year Number of
Faculty
Percent of Total
Percent of FTE
Percent Not Holding PhD
Percent Female
1950-1969 67 17 16 10 5 1970-1979 147 38 38 14 12 1980-1989 97 25 25 18 12 1990-2007 76 20 21 24 30
Table 6. On-Campus FTE Percentage Breakdown by Age for Each Extension Region
BS Year Central Northeast Southern Western Overall 1950-1969 19 17 13 14 17 1970-1979 32 47 38 42 38 1980-1989 29 24 21 27 25 1990-2007 19 11 29 16 20
Table 7. Characteristics of Off-Campus Extension Economists by Age Category
BS Year Number of
Faculty
Percent of Total
Percent of FTE
Percent Not Holding PhD
Percent Female
1950-1969 11 10 8 45 9 1970-1979 38 34 34 55 8 1980-1989 31 28 26 58 10 1990-2007 32 29 31 75 38

Table 8. Off-Campus FTE Percentage Breakdown by Age for Each Extension Region
BS Year North
Central Northeast Southern Western Overall 1950-1969 7 0 11 6 10 1970-1979 26 0 33 38 34 1980-1989 23 0 24 38 26 1990-2007 44 0 32 19 31
Table 9. Percent of Faculty by Area of Expertise in Each Region for Each Age Group
BS Year Region Agri-business
Community Development
CommoditySpecialist
Risk/ Farm Manage Marketing
ResourceEnviron Other
North Central 3 10 3 27 13 7 37Northeast 0 0 0 36 9 27 27Southern 6 17 17 17 17 6 22
1950-1969 Western 0 25 13 38 0 13 13
North Central 5 11 2 41 23 0 18Northeast 0 3 10 27 10 20 30Southern 9 11 13 13 21 11 23
1970-1979 Western 0 19 4 19 15 27 15
North Central 14 19 5 21 10 2 29Northeast 0 8 8 31 8 38 8Southern 9 13 9 22 17 4 26
1980-1989 Western 6 22 6 22 11 11 22
North Central 4 8 8 23 12 8 38Northeast 11 0 0 44 11 11 22Southern 16 16 13 23 10 10 13
1990-2004 Western 20 0 10 30 10 10 20
Table 10. Summary of Ranking Survey Responses by Extension Region
Responses Didn’t Know Refused to Respond
Region Sample Size
# Pct. # Pct. # Pct. North Central 144 37 26 8 6 8 6 Northeast 66 19 29 8 12 1 2 Southern 121 39 32 10 8 4 3 Western 63 26 41 12 19 2 3 Total 394 121 31 38 10 15 4

Table 11. Assessment of Extension Program Quality in Farm Management Area (n=20)
State Number Evaluating State
Average Score for Quality of Program
Kansas 10 4.7 Illinois 11 4.3 Purdue 10 4.3 Texas 11 4.0
Table 12. Assessment of Extension Program Quality in Marketing Area (n=12)
State Number Evaluating State
Average Score for Quality of Program
Kansas 10 4.6 Texas 8 4.6 Iowa 8 4.3 Illinois 6 4.2 Oklahoma 11 3.9 Purdue 7 3.6 Georgia 7 3.3
Table 13. Assessment of Extension Program Quality in Community Development Area (n=9)
State Number Evaluating State
Average Score for Quality of Program
Wisconsin 9 4.5 Missouri 7 4.5 Minnesota 4 4.4 Pennsylvania 7 4.0 Clemson 6 3.7 Ohio 5 3.6 Illinois 4 3.5 Purdue 5 3.2

Table 14. Assessment of Extension Program Quality in Agribusiness Area (n=7)
State Number Evaluating State
Average Score for Quality of Program
Purdue 6 4.5 Iowa 5 4.2 Kansas 5 4.2 Minnesota 4 3.8 Texas 4 3.5
Table 15. Assessment of Extension Program Quality in Land and Water Resources (n=5)
State Number Evaluating State
Average Score for Quality of Program
North Carolina 4 4.3 Pennsylvania 3 4.3 Oregon 3 4.3 Colorado 3 4.2 Florida 3 3.7