Department of Agricultural Economics and Extension Faculty ...
168
Barriers and Incentives to Potential Adoption of Biofuel Crops by Smallholder Farmers in selected areas in the Chris Hani and O.R Tambo District Municipalities, South Africa Priviledge Cheteni A Thesis Submitted in the Fulfilment of the Requirement for the Degree of Master of Agriculture in Agriculture Economics Supervisor: Prof. A. Mushunje Co-Supervisor: Dr. A. Taruvinga Department of Agricultural Economics and Extension Faculty of Science and Agriculture May 2014 Copyright© 2014, Priviledge Cheteni
Transcript of Department of Agricultural Economics and Extension Faculty ...
Barriers and Incentives to Potential Adoption of Biofuel Crops by Smallholder
Farmers in selected areas in the Chris Hani and O.R Tambo District Municipalities,
South Africa
Priviledge Cheteni
A Thesis Submitted in the Fulfilment of the Requirement for the Degree of Master of
Agriculture in Agriculture Economics
Supervisor: Prof. A. Mushunje
Co-Supervisor: Dr. A. Taruvinga
Department of Agricultural Economics and Extension
Faculty of Science and Agriculture
May 2014
Copyright© 2014, Priviledge Cheteni
i
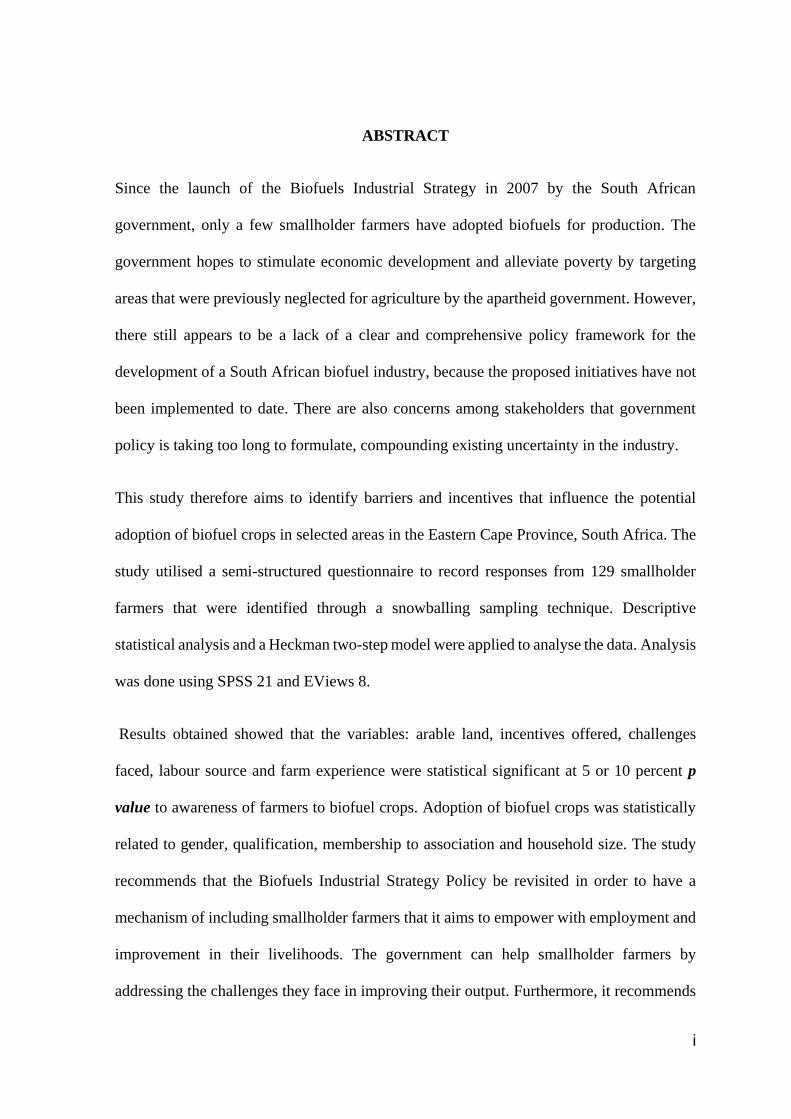
ABSTRACT
Since the launch of the Biofuels Industrial Strategy in 2007 by the South African
government, only a few smallholder farmers have adopted biofuels for production. The
government hopes to stimulate economic development and alleviate poverty by targeting
areas that were previously neglected for agriculture by the apartheid government. However,
there still appears to be a lack of a clear and comprehensive policy framework for the
development of a South African biofuel industry, because the proposed initiatives have not
been implemented to date. There are also concerns among stakeholders that government
policy is taking too long to formulate, compounding existing uncertainty in the industry.
This study therefore aims to identify barriers and incentives that influence the potential
adoption of biofuel crops in selected areas in the Eastern Cape Province, South Africa. The
study utilised a semi-structured questionnaire to record responses from 129 smallholder
farmers that were identified through a snowballing sampling technique. Descriptive
statistical analysis and a Heckman two-step model were applied to analyse the data. Analysis
was done using SPSS 21 and EViews 8.
Results obtained showed that the variables: arable land, incentives offered, challenges
faced, labour source and farm experience were statistical significant at 5 or 10 percent p
value to awareness of farmers to biofuel crops. Adoption of biofuel crops was statistically
related to gender, qualification, membership to association and household size. The study
recommends that the Biofuels Industrial Strategy Policy be revisited in order to have a
mechanism of including smallholder farmers that it aims to empower with employment and
improvement in their livelihoods. The government can help smallholder farmers by
addressing the challenges they face in improving their output. Furthermore, it recommends

ii
that a national study on barriers and incentives that influence the adoption of biofuel crops
be carried out in order to identify other factors that may hinder the Biofuels Strategy Policy
aims in empowering the disadvantaged farmers.
Key words: Barriers, Incentives, Adoption, South Africa, Biofuels, Smallholder

ii
DEDICATION
To my mother Mrs I Cheteni and to my late father Mr J Cheteni, and brothers and
sisters who have immeasurable faith in me. I love you all.

iii
ACKNOWLEDGEMENTS
First of all l would like to thank God for giving me strength and power to complete this
thesis and for his guidance in my life. It is through divine guidance that l managed to be at
this stage in my life. Thank You.
I would also like to humble acknowledge my supervisors Prof A Mushunje and Dr A
Taruvinga for rendering their utmost assistance during the course of this study. Their
unwavering support kept me going even though the road seemed tough. Their patience and
constructive ideas kept me strong during this project. My gratitude also goes to the
Department of Agriculture staff, who made it possible for me to identify the smallholder
farmers.
The financial assistance of the National Research Foundation (NRF) towards this
research is hereby acknowledged. Opinions expressed and conclusions arrived at, are
those of the author and are not necessarily to be attributed to the NRF. It is through
their support that l finally completed this thesis. Furthermore, l would like to acknowledge
the UFH Vice Chancellor`s office for playing a huge part in this project. Lastly, l express
my sincere thanks to the UFH Department of Agricultural and Extension personnel. It is
through their efforts that the project faced few obstacles. Keep up the good work.
.

iv
DECLARATION ON COPY RIGHT
I, Priviledge Cheteni the undersigned, student number 200909553, hereby declare that the
dissertation is my own original work, and that it has not been submitted, and will not be
presented at any other University for a similar or any other degree award.
Date:………………………
Signature:…………………………………

v
DECLARATION ON PLAGIARISM
I, Priviledge Cheteni, student number 200909553, hereby declare that I am fully aware of
the University of Fort Hare’s policy on plagiarism and I have taken every precaution to
comply with the regulations.
Signature: ........................

vi
DECLARATION ON RESEARCH ETHICS
I, Priviledge Cheteni student number 200909553, hereby declare that I am fully aware of
the University of Fort Hare’s policy on research ethics and I have taken every precaution to
comply with the regulations. I have obtained an ethical clearance certificate from the
University of Fort Hare’s Research Ethics Committee and my reference number is
MUS081SCHE01
Signature: ..............................

TABLE OF CONTENTS
ABSTRACT ......................................................................................................................... I
DEDICATION .................................................................................................................... II
ACKNOWLEDGEMENTS ............................................................................................. III
DECLARATION ON COPY RIGHT ............................................................................ IV
DECLARATION ON PLAGIARISM .............................................................................. V
DECLARATION ON RESEARCH ETHICS ............................................................... VI
ACRONYMS ................................................................................................................. VIII
TABLES AND FIGURES ................................................................................................. X
CHAPTER 1 ........................................................................................................................ 1
1.0 INTRODUCTION ............................................................................................................. 1
1.1 CONTEXT OF THE STUDY .............................................................................................. 1
1.2 BACKGROUND OF THE STUDY ....................................................................................... 3
1.2.1. Agriculture in South Africa ................................................................................. 3
1.2.2 Biofuels Industrial Strategy in South Africa ........................................................ 6
1.2.3 Biofuel crops ........................................................................................................ 7
1.2.4 The land use debate ............................................................................................ 10
1.2.5 The biofuel debate .............................................................................................. 12
1.2.6 Participation in Biofuel Market in South Africa ................................................ 13
1.3 PROBLEM STATEMENT ................................................................................................ 15
1.4 OBJECTIVES ................................................................................................................ 16
1.5 RESEARCH QUESTIONS ............................................................................................... 17
1.6 HYPOTHESIS ............................................................................................................... 17
1.7 SIGNIFICANCE OF THE STUDY ..................................................................................... 17
1.8 DELIMITATIONS OF THE STUDY ................................................................................... 18
1.9 DEFINITION OF TERMS ................................................................................................ 19
1.10 STUDY OUTLINE ....................................................................................................... 20
CHAPTER 2 ...................................................................................................................... 21

LITERATURE REVIEW ................................................................................................. 21
2.0 INTRODUCTION ........................................................................................................... 21
2.1 ADOPTION .................................................................................................................. 21
2.2 ADOPTERS CATEGORIES DEFINED ............................................................................... 23
2.3 ADOPTION CHARACTERISTICS AND STAGES ............................................................... 24
2.3.1 Adoption speed ................................................................................................... 24
2.3.2 Relative advantage ............................................................................................. 24
2.3.3 Insights from literature ...................................................................................... 28
2.4 DETERMINANTS TO FARMERS’ ADOPTION OF NEW TECHNOLOGY ................................ 28
2.4.1 Institutional factors ............................................................................................ 29
2.4.2 Farmers’ socio-economics factors ..................................................................... 29
2.4.3 Farmers perceptions .......................................................................................... 30
2.4.4 Economic benefits and risks of new technologies .............................................. 30
2.5 AWARENESS OF BIOFUELS .......................................................................................... 31
2.5.1 Awareness of new technology/crop varieties ..................................................... 31
2.5.2 Insights from literature ...................................................................................... 33
2.6 CURRENT BIOFUEL DEVELOPMENT IN SOUTH AFRICA ................................................ 33
2.7 BARRIERS TO BIOFUELS DEVELOPMENT ..................................................................... 35
2.8 CONCLUSION .............................................................................................................. 36
CHAPTER 3 ...................................................................................................................... 37
STUDY AREA ................................................................................................................... 37
3.0 INTRODUCTION ........................................................................................................... 37
3.1 LOCATION OF STUDY AREAS ....................................................................................... 37
3.2 OLIVER TAMBO DISTRICT MUNICIPALITY .................................................................. 39
3.2.1 Poverty levels ..................................................................................................... 41
3.2.2 Education ........................................................................................................... 41
3.2.3 Vegetation and soils ........................................................................................... 42
3.2.4 Rainfall, Temperature and Hydrology ............................................................... 42
3.2.5 Transport Infrastructure .................................................................................... 42
3.2.6 Economic activities ............................................................................................ 43
3.3 CHRIS HANI DISTRICT MUNICIPALITY (CHDM) ........................................................ 43
3.3.1 Socio- Economic information ............................................................................. 44
3.3.2 Economic Overview ........................................................................................... 44
3.3.3 Agriculture ......................................................................................................... 45
3.3.4 Temperature ....................................................................................................... 45
3.3.5 Rainfall ............................................................................................................... 46
3.3.6 Land type ............................................................................................................ 46
3.4 CONCLUSION .............................................................................................................. 47
CHAPTER 4 ...................................................................................................................... 48
RESEARCH METHODS ................................................................................................. 48
4.0 INTRODUCTION ........................................................................................................... 48
4.1 UNIT OF ANALYSIS ..................................................................................................... 48
4.2 Sampling Frame .................................................................................................... 48
4.3 SAMPLING TECHNIQUE ............................................................................................... 49
4.4 SAMPLING SIZE ........................................................................................................... 50
4.5 ORIENTATION STAGE .................................................................................................. 51
4.6 THE SURVEY ............................................................................................................... 51
4.7 DATA COLLECTION PROCEDURES ............................................................................... 51
4.8 ETHICAL CONSIDERATIONS ......................................................................................... 52
4.9 CONFIDENTIALITY AND ANONYMITY .......................................................................... 53
4.10 CODING OF DATA ...................................................................................................... 53
4.11 RELIABILITY ............................................................................................................. 54
4.12 VALIDITY ................................................................................................................. 54
4.13 MODELS ANALYSING ADOPTION ............................................................................... 55
4.13.1 Rational utility maximisation model ................................................................ 55
4.13.2 Static Models .................................................................................................... 56
4.13.3 lnsights from literature ..................................................................................... 58
4.15 ECONOMETRIC MODEL ............................................................................................. 60
4.15.1 Heckman two stage model ................................................................................ 60
4.15.2 The first stage of the Heckman model .............................................................. 61
4.15.3 Second stage of the Heckman Model ............................................................... 62

4.15.4 Definition of the regression equations used in the study ................................. 63
4.15.5 Definition of variables...................................................................................... 63
4.15.6 Dependent variable .......................................................................................... 64
4.15.7 Independent variables ...................................................................................... 64
4.16 Analytical software ............................................................................................. 68
4.17 CONCLUSION ............................................................................................................ 70
CHAPTER 5 ...................................................................................................................... 72
RESULT DISCUSSIONS ................................................................................................. 72
5.0 INTRODUCTION ........................................................................................................... 72
5.1 DESCRIPTIVE CHARACTERISTICS OF THE STUDY ......................................................... 72
5.2 RESPONDENTS STATISTICS ......................................................................................... 74
5.2.1 Gender ................................................................................................................ 74
5.2.2 Marital status ..................................................................................................... 74
5.2.3 Education ........................................................................................................... 75
5.2.4 Household size ................................................................................................... 75
5.2.5 Income ................................................................................................................ 77
5.2.6 Sources of income .............................................................................................. 77
5.2.7 Membership in association ................................................................................ 78
5.3 ADOPTION POTENTIAL AND FARMERS CHARACTERISTICS ........................................... 78
5.3.1 Gender of households and willingness to adopt biofuels ................................... 78
5.3.2 Age of respondents and willingness to adopt biofuels ....................................... 79
5.3.3 Marital Status and willingness to adopt biofuels ............................................... 80
5.3.4 Level of education of the respondents and willingness to adopt biofuels .......... 81
5.3.5 Household Size and willingness to adopt biofuels ............................................. 82
5.3.6 Household income and willingness to adopt biofuels ........................................ 83
5.3.7 Sources of income and willingness to adopt biofuels ........................................ 84
5.3.8 Income received from farming and willingness to adopt biofuels ..................... 85
5.3.9 Occupation and willingness to adopt biofuels ................................................... 86
5.4 LAND USE .................................................................................................................. 87
5.4.1. Arable land and willingness to adopt biofuels .................................................. 87
5.4.2 Arable land utilized ............................................................................................ 88

5.4.3 Land utilised last season .................................................................................... 90
5.4.4 Land tenure ........................................................................................................ 91
5.4.6 Source of food consumption ............................................................................... 93
5.4.7 Market Access .................................................................................................... 94
5.4.8 Access to credit .................................................................................................. 95
5.4.9 Farming Experience and willingness to adopt .................................................. 96
5.4.10 Labour and willingness to adopt ...................................................................... 97
5.4.11 Asset ownership ................................................................................................ 98
5.4.12 Membership in associations and willingness to adopt ..................................... 99
5.4.13 Contact with extension and willingness to adopt ........................................... 100
5.4.14 Type of information received from extension services ................................... 101
5.4.15 Sources of information ................................................................................... 102
5.5 AWARENESS AND ADOPTION OF BIOFUELS ................................................................ 103
5.5.1 Biofuels known by respondents ........................................................................ 103
5.5.2 Willingness to adopt biofuel crops ................................................................... 104
5.5.3 Willingness to adopt with incentives ................................................................ 105
5.5.4 Awareness to Biofuels crops ............................................................................ 107
5.6 CHALLENGES FACED BY SMALLHOLDER FARMERS ................................................... 109
5.7 INCENTIVES FOR THE ADOPTION OF BIOFUEL CROPS ................................................. 110
5.8 CONCLUSION ............................................................................................................ 111
CHAPTER 6 .................................................................................................................... 113
EMPIRICAL RESULTS AND DISCUSIONS ............................................................. 113
6.0 INTRODUCTION ......................................................................................................... 113
6.1 HETERESCEDASTICITY TESTS .................................................................................... 113
6.2 MODEL FIT ............................................................................................................... 114
6.2.1 Selection Equation ........................................................................................... 115
6.2.2 Outcome Model ................................................................................................ 117
6.3 CONCLUSION ............................................................................................................ 119
CHAPTER 7 .................................................................................................................... 121
CONCLUSION AND RECOMMENDATIONS .......................................................... 121

7.0 INTRODUCTION ......................................................................................................... 121
7.1 SUMMARY ................................................................................................................ 121
7.2 CONCLUSION ............................................................................................................ 123
7.3 POLICY RECOMMENDATIONS ................................................................................... 123
7.4 AREAS OF FURTHER RESEARCH ................................................................................. 127
REFERENCES ................................................................................................................ 128
APPENDIX ...................................................................................................................... 138

viii
ACRONYMS
BIS Biofuel Industrial Strategy
FAO Food and Agriculture Organisation
DME Department of Mineral and Energy
ISRDS Integrated Sustainable Rural Development Strategy
SPSS Statistical Package for Social Scientists
REEEP Renewable Energy and Energy Efficiency Partnership
CHDM Chris Hani District Municipality
NEPAD New Partnership for Africa's Development
IDP Integrated Development Planning
SADC Southern Africa Development Committee
DEDEA Department of Economic Development and Environmental Affairs
OR Oliver Tambo
OLS Ordinary Least Square
SADC Southern Africa Development Committee
GHG Green House Gases

ix
DAFF Department of Agriculture Fishery and Forestry
MEA Millennium Ecosystem Assessment
UNDESA United Nations Department of Economic and Social Affairs

x
TABLES AND FIGURES
Table 1.1 Conditions for Biofuels crops _______________________________________ 8
Table 2.1 Biofuels license status ____________________________________________ 34
Table 4.1 Sampling frame _________________________________________________ 50
Table 4.2 : Reliability tests ________________________________________________ 54
Table 4.3 Variables for the study ____________________________________________ 69
Table 4.4 Objectives Summary ______________________________________________ 71
Table 5.1 Descriptive statistics _____________________________________________ 73
Table 5.2 Respondents Summary ____________________________________________ 76
Table 5.3 Biofuels crops known by respondents _______________________________ 106
Table 5.4 Biofuels awareness questions _____________________________________ 108
Table 5.5 Challenges faced by respondents ___________________________________ 109
Table 5.6 Incentives identified by respondents ________________________________ 111
Table 6.1 Heterescedasticity ______________________________________________ 114
Table 6.2 Heckman two step model _________________________________________ 115
Figure 1.1 Land utilization _________________________________________________ 5
Figure 1.2 Top 10 commodities in South Africa ________________________________ 11
Figure 2.1 : Adoption model _______________________________________________ 26
Figure 2.2.Adoption profile ________________________________________________ 27
Figure 3.1 Eastern Cape Province___________________________________________ 37
Figure 3.2 Maize potential _________________________________________________ 39
Figure 3.3. Oliver Tambo District Municipality ________________________________ 40

xi
Figure 3.4. Chris Hani District Municipality __________________________________ 44
Figure 4.1 Conceptual Framework __________________________________________ 59
Figure 5.1: Respondents gender ____________________________________________ 78
Figure 5.2 Respondents age ________________________________________________ 80
Figure 5.3 Marital status __________________________________________________ 81
Figure 5.4 Highest qualification ____________________________________________ 82
Figure 5.5 Household size _________________________________________________ 83
Figure 5.6 Household income ______________________________________________ 84
Figure 5.7 Sources of Income ______________________________________________ 85
Figure 5.1 Income received from farming _____________________________________ 86
Figure 5.9 Occupation ____________________________________________________ 87
Figure 5.10 Arable land available ___________________________________________ 88
Figure 5.11 Land use by household size ______________________________________ 89
Figure 5.12 Arable land utilized last season ___________________________________ 90
Figure 5.13 Land tenure __________________________________________________ 91
Figure 5.14 Crops produced for consumption __________________________________ 92
Figure 5.15 Crops produced by respondents ___________________________________ 93
Figure 5.16 Sources of food consumption _____________________________________ 94
Figure 5.17 Distance to market _____________________________________________ 95
Figure 5.18 Access to credit________________________________________________ 96
Figure 5.19 Farm experience _______________________________________________ 97
Figure 5.20 Sources of labour ______________________________________________ 98
Figure 5.21 Farming equipment ____________________________________________ 99
Figure 5.22 Membership in association _____________________________________ 100

xii
Figure 5.23 Contact with extension officers __________________________________ 101
Figure 5.24 Type of information received from extension _______________________ 102
Figure 5.25 Communication Media _________________________________________ 103
Figure 5.26 Willingness to adopt biofuel crops ________________________________ 105
Figure 5.27 Willingness to adopt biofuels if given incentives _____________________ 106

1
CHAPTER 1
1.0 Introduction
This chapter presents the background of the study, defines the nature of the research problem
and provides justification or motivation for undertaking this study. It also sets out the objectives
of the study, hypotheses, and research questions.
1.1 Context of the study
Biofuels can be described as solid, liquid, or gaseous fuel consisting of, or derived from
biomass. Biofuel crops are crops that are used to generate biofuels. In 2004, a joint meeting of
the Southern Africa Development Community (SADC) under the theme ‘Farming for Energy’
stressed that biofuel production provides or presents an opportunity for the region to produce
its renewable energies. Challenges like high-energy costs facing economies from SADC justify
the proposal of a green economy. Biofuels therefore have now become an alternative to the
reduction of energy costs, with fuel production through farming expected to increase rural
employment, reduce Greenhouse Gases (GHG) as envisaged by the Kyoto Protocol
(Takavarasha et al. 2005). In Africa, the real potential of biofuel production lies in social
development.
In 2007, the Department of Minerals and Energy (DME) launched a Biofuel Industrial Strategy
for South Africa. A number of factors influenced the launch of the Biofuel Industrial Strategy
(BIS), and some of these are that the launch was part of the government efforts to uplift
smallholder farmer’s productivity (DME, 2007). Other factors include; support for cleaner and
environmentally friendly energy; support of renewable energy and the upliftment of the

2
agricultural sector-using surplus farming land; promoting sustainable development and
improve energy security.
Of particular importance are the Biofuel Industrial Strategy (2007) targets in the upliftment of
agricultural sectors and unlocking of economic benefits in the Sub-Sahara region, by attracting
investments in rural areas and promoting agricultural development. These targets will help
overcome trade distortion that the Sub Saharan Africa has faced with subsidised agricultural
production. A special requirement within the strategy is to create a connection between the first
and second economy, by creating agricultural opportunities in areas previously undermined by
the apartheid system (DME, 2007). According to the strategy, a first economy is characterised
as being industrialised and producing the country’s wealth and the second economy as the
underdeveloped, poverty-stricken and marginalised (DME, 2007). Since 2007, the Department
of Minerals and Energy (DME) in collaboration with the Department of Agriculture, Fishery
and Forestry (DAFF) have been actively involved with smallholder farmers in the production
of biofuels (Shi et al. 2009).
Smallholder farmers face a number of challenges that impede their growth and ability to
contribute to agriculture. According to DAFF (2012), some of the challenges include; lack of
access to land, inadequate infrastructure, and institutional challenges. Smallholder farmers
struggle to pay for inputs like fertilisers, seeds to name a few. Moreover, lack of reliable
markets, high transaction costs, unreliable distribution in remote areas are some factors
affecting smallholder farmers (DAFF, 2012).With the proposed BIS, however, smallholder
farmers are set to benefit immensely through the production of biofuel crops that perform well
in semi-arid regions, like the Eastern Cape.

3
In the Eastern Cape Province, biofuel crops are anticipated to be a game changer for
smallholder farmers because the region has vast underutilised semi-arid lands. The
underutilised lands were identified by the DME as potential areas that are suitable for biofuels
crops production. With this in mind, the production of biofuel crops is set to create jobs for the
Eastern Cape Province. However, to date biofuel production has been limited. Sapp (2013)
states that the slow pace of the adoption of biofuels production has been due to the lack of
supportive policy guidelines, and an ineffective implementation strategy to the food and fuel
debate.
ln the light of this background, a need arises to identify challenges and barriers that may
influence the potential adoption of biofuel crops by smallholder farmers. Otherwise, the low
rate of adoption of biofuel crops by smallholder farmers may indicate a serious problem within
the Biofuel Industrial Strategy Policy.
1.2 Background of the study
This section gives brief background information on the agriculture sector in South Africa and
the status of Biofuels Production.
1.2.1. Agriculture in South Africa
South Africa has a dual economy system composed of the commercial and subsistence sector.
The subsistence sector has an estimated 200000 emerging black farmers in rural areas, yet,
the commercial sector is composed of 35000 large scale farmers, mainly white farmers owning
over 82 million hectares of land (Mathivha, 2012). Agricultural activities are in the form of
intensive crop farming and livestock farming.

4
It is estimated that only 13 percent of land can be used for crop production in South Africa and
the most pressing problem is the availability of water. Rainfall is distributed unevenly across
the country with more than 50 percent of water used in Agriculture, with 1.3 million hectares
of land under irrigation (Mathivha, 2012). Goldblatt (2010) reports that declining farming and
water scarcity has left South Africa with less than two thirds of the number of farms it had in
the early 1990s. Moreover, there is a decline in agricultural employment (DAFF, 2013).
Agriculture’s contribution to employment also dropped by 75 percent between 1993 and 2005,
to about 628000 farm workers (Agricultural Statistics, 2012). Some of the reasons attributed to
the decline are that there is lack of participation from the youths and a decrease in farming
operators. Vink and Kirsten (1999) pointed the decline of employment in agriculture after
apartheid to bad policies that reduced export opportunities, discouraged labour saving and
encourage adoption of capital-intensive farming practices.
Over the past 15 years, South Africa has undergone structural changes that have resulted in an
open market oriented economy (Goldblatt, 2010). A number of agricultural policies were
crafted after apartheid to address the land imbalances between blacks and whites. Most of the
adopted policies were intended to remove control of the white minority on agricultural lands.
Subsequently, this led to a launch of a number of land programmes to support emerging farmers
(Goldblatt, 2010). Land redistribution has been a major challenge in the new South Africa.
Figure 1.1 shows the total land utilised for farming in South Africa:

5
Figure 1.1: Land utilization in South Africa
Source: Author computation from Agriculture Statistics, 2013
From the graphical presentation in Figure 1.1 above, there are two types of agricultural lands:
commercial and former homelands. The developing former homelands are depicted as
underutilised land. The total available arable land is between 123-125 million hectares, and
commercial farming utilises about 105 million hectares leaving 17 million of hectares
underutilised. The underutilised land in the former homelands are mainly in rural areas as
shown in the diagram, with the Eastern Cape Province having at least 5 million hectares of land
underutilised. KwaZulu Natal Province has less than 4 million hectares, Limpopo Province and
North West Province also have 3 to 4 million of hectares which are underutilised; Mpumalanga
has less than 1 million hectare homelands. The underutilised land in the former homelands can
be put into productive use by establishing biofuel crops production.
0 5 10 15 20 25 30 35 40
Western Cape
Northern Cape
Free State
Eastern Cape
KwaZulu-Natal
Mpumalanga
Limpopo
Gauteng
North West
MILLION HECTARES
PR
OV
INC
ES
Land utilization in South Africa
commercial agriculture lands developing former homelands total arable land

6
1.2.2 Biofuels Industrial Strategy in South Africa
The Biofuel Industrial Strategy was necessitated by the government’s need to create a link
between first and second economies. Targeting areas that were neglected during apartheid and
rural areas that do not have access to markets for their produce will make the link. Furthermore,
the strategy targets 14 percent of arable land in rural areas that is underutilised (DME, 2007).
The strategy proposes that for production of biofuels, maize be excluded in the initial stages of
implementation until such a time when there is certainty on the ability of the current
underutilised land to develop.
Letete (2009) investigated types of land classified as underutilised and came up with this
conclusion:
Communal land is defined as land composed of a number of large pieces of land in the rural
areas that are utilised by the whole community for agricultural purposes. All farming in this
land is pure subsistence.
State land are former homelands that are state owned that are of agricultural quality which
were meant for agricultural purposes but were never demarcated by the apartheid
government. Hence, this form of land is left unused by the community.
Lastly land owned by emerging black farmers. This is a form of land that was distributed
through the land reform. Nevertheless, due to lack of financial, management and
technological skills, most farmers have not developed it.
This study adopts Letete’s (2009) broad definition of underutilised land.

7
1.2.3 Biofuel crops
In producing biofuels, a proper mix of crops is a critical factor in the development of a good
production system. Canola, soya beans, sunflower, groundnuts, sugarcane, sugar beet, and
sorghum are the most suitable or favoured crops for biofuel production as envisaged in the
Biofuels Industrial Strategy. Table 1.1 below shows the conditions necessary for each targeted
crop to grow. Understanding the conditions necessary for biofuel crops to grow is crucial in
identifying former underutilised land in the former homelands that support these crops.
Table 1.1 illustrates that most crops can be easily grown in semi-arid regions. A semi-arid
region is defined as a region receiving lower precipitation below potential evapotranspiration,
but not extremely. Sugarcane, maize, wheat and sorghum production are the most suitable
crops for bio-ethanol production because they are sugar rich. The Food and Agriculture
Organisation FAO (2013) favours sorghum because it requires fewer inputs such as water and
fertilisers than sugar cane or sugar beet. The Biofuels Strategy spells out clearly that maize is
excluded from the targeted crops because it is one of the most important crops with regard to
food security in the Southern Africa Development Community (SADC).

8
Table 1.1 Conditions for Biofuels crops
NEPAD-CAADP, 2007

9
Furthermore, Farrell et al. (2006) highlights that although wheat is one of the largest produced
crops in South Africa, it is not targeted for biofuels because it is widely used in value added
products such as bread, which are an important part of the South African diet. Wheat was one
of the top produced commodity crops in 2012.
To understand the potential of the agriculture sector in South Africa, a background of the top
produced field crops is necessary. Figure 1.2 shows the top ten produced commodities in South
Africa. It shows that in 2012 over 15 million tonnes of sugar were produced as output. Sugar
cane is the most highly produced field crop in South Africa and it generates revenue of more
than US$1. 8 billion through exports to the SADC and European Union.
Maize is the second most produced commodity with over 12 million tonnes per annum,
generating at least US$1.3 billion. Since, the biofuels strategy stipulates that maize be excluded
in the targeted crops for biofuel; its production is mainly for consumption. Soybeans,
Sunflower seeds, barley and sorghum are other commodities that have a combined output of
over 1 million tonnes. It can be ascertained from the diagram above that most proposed biofuels
crops have stable production currently.
The fact that grain commodity crops are in top production currently, should highlight the
potential of the biofuel industry. In many instances, a sustainable industry is supposed to be
producing extra output to sustain its people. The extra output from sugar cane can be used to
produce ethanol without influencing or affecting the prices of sugar consumed by people.
Therefore, most field crops produced are not expected to affect consumer prices through
shortages. For instance, in the 2013 season a total of 834000 tonnes of soya beans was
consumed locally, and 30000 tonnes was exported (DAFF, 2013). Similarly, maize that was
domestically consumed in 2013 was estimated to be around 10.427 million tonnes and the

10
surplus 2.120 million tonnes was exported around the world (DAFF, 2013). However, the only
risk is when producers divert those crops for biofuels production leading to artificial shortages.
1.2.4 The land use debate
Sugrue and Douthwaite’s (2007) report on land use claims that agriculture production rose by
70 tonnes per hectare on leased plots, higher than organised small scale farming that was 30
tonnes on average. However, it was less than commercial farming that stood at 120 metric tons
per hectare. In addition, Sugrue and Douthwaite (2007) are of the view that maize should not
be used for energy, instead, they suggest that Jatropha or Moringa tree be used. Jatropha can
produce 2.5 metric tons of biofuels per hectare, which is better than soya that produces 0.8
tonnes per hectare on average. However, proponents of sustainability favour the development
of a food forest that includes different types of plants and species. Their contention is that the
arable land available for farming is degraded; therefore, planting food crops would stabilise
and improve soil fertility in the long run, subsequently helping smallholder farmers and
communities who own a lot of arable land.
In contrast, Renewable Energy and Energy Efficiency Partnership (2007) is of the view that
increased agricultural production has the potential to conflict with a number of resources, not
land only. Their line of reasoning is that increased agricultural production will increase inputs
including water, fertilizers, agricultural chemicals and these may have a negative impact on the
production system through a loss of soil fertility, soil biodiversity, and available quality of
water. Still, social and environmental benefits may be realised through agricultural
diversification and energy, as well as rural development using the land productively.

11
Figure 1.2 Top 10 commodities in South Africa
Sources: FAO, (2013)

12
Sugrue (2007) argues that even though the South African government opted for a Biofuels
Policy that targets smallholder farmers, Europe will import the biofuel energy, yet more than
30 percent of South Africans do not have access to energy. For this reason, biogas is suggested
as an option, which can be used locally, and is the most suitable option.
1.2.5 The biofuel debate
Pingali et al. (2008), Rosegrant et al. (2008), Elobeid and Hart (2007) are of the view that food
items constitute significant in consumption bundles of low-income earners and high prices
may have an adverse effect on the poor. Furthermore, inadequate food security, food deficits,
and undernourishment make the poor more vulnerable and volatile to prices changes in
commodities, hence, any increase in biofuel production is expected to have an adverse effect
on them. Hochman et al. (2008) and Coyle (2007) are of the opinion that the rapid growth of
biofuels production has a potential negative effect of diverting food crops to biofuels, and
consequently pushing commodity prices higher, which will have a serious effect on global food
and related markets.
However, another school of thought challenges the above view. Pingali et al. (2008) suggest
that an adverse effect may be realised as a positive supply response that may help small scale
farmers emerge. Furthermore, Pingali et al. (2008) are of the view that biofuels will serve as a
new source of demand for agriculture which could assist in revitalising agriculture in
developing countries. Of the same view is Schmidhuber (2006) who posits that benefits may
increase producer prices and biofuel production which may uplift rural economies.
A deeper look into literature suggests that there is a consensus about maize not being used to
produce ethanol, as it has a huge effect on food prices and poor communities. Cassman and

13
Liska (2007) noted that the sub Saharan region relies heavily on cereal import, hence, it is the
most vulnerable to price shocks. FAO (2013) stated that food prices are likely to remain volatile
in the period of 2011-2020, thus, any move that would destabilise prices further would be borne
by the vulnerable communities, consequently increasing poverty and promoting poor standards
of living in the end. Harrison (2009) argued that there is growing evidence that shows that
higher maize prices contribute to inflated food prices in the form of higher feed prices,
especially animals that depend on corn as feedstock for poultry, beef, pork and others.
From the information presented above, it can be deduced that as much as literature has differing
opinions concerning biofuel crops on agriculture, a growing body of literature believes that as
long as traditional crops such as corn and wheat are withdrawn from production, there are
greater chances that biofuel production would uplift impoverished communities.
1.2.6 Participation in Biofuel Market in South Africa
Farm household participation entails growing crops for sale to a biofuel firm or land rentals
contract and feedstock supply contracts by smallholder farmers. Mabiso and Weatherspoon
(2011) conducted a survey on household participation in biofuel production in the rural areas
in the Eastern Cape, Limpopo, and North West provinces of South Africa. A total of 247
households were randomly selected and given questionnaires to record answers on their
participation in biofuel markets. The findings are indicated below:
Biofuel firms were not employing local labour, instead they were importing labour. The
reason was that most firms had not yet created employment opportunities for locals.
Furthermore, the only labour recorded were few farmers hired by one biodiesel plant who
were mentoring less experienced biofuel crop farmers. A further analysis from the study
identified the firm was a Non-Governmental Organisation not necessarily a Biodiesel firm,

14
whose business model had objectives of empowering entrepreneurs in biodiesel markets by
providing free training in business management and farming skills. It was discovered that
the hired mentors were engaged by the firm four years before and received assistance and
training to produce sunflower and soybean to supply feedstock to the biodiesel firm.
Generally it can be concluded that no employment opportunities have been created this far.
Secondly, a number of crops were used as feedstock. Biodiesel firms used sunflower,
soybean, and canola; yet, ethanol firms used maize, sugar beets, and sugarcane.
Smallholder farmers were not participating in a number of biofuels programmes because
the firms excluded them.
It was noted that certain biofuels companies were using maize as feedstock yet the
government banned it. Moreso, none of the smallholder farmers were producing canola as
feedstock, but the farmers were leasing land to the biofuels firm that produced the canola
for its production. The main reason cited for this approach was that some firms were
focused more on renting land than training smallholder farmers.
It was difficult to define biofuel crops as feedstock in that study because farmers viewed
crops as cash crops or consumption crops depending on whether it is sold or consumed.
Mabaso and Weatherspoon (2011) therefore concluded that biofuels crops are also used as food
crops in South Africa excluding sugar beet. Although the study was not aimed at smallholder
farmers, it gives an idea about the current biofuels industry operations.

15
1.3 Problem statement
Biofuels are regarded as a means of decreasing greenhouse gases, thereby reducing global
warming. They also offered a solution in the reduction of non-renewable energy use and a
potential of alleviating poverty in areas with unsuitable land for cash crops. Consequently,
areas that were utilised for food production came under threat to meet the ever-growing
demands of biofuels.
In addition, instability in oil producing countries and climate change that has adversely affected
agriculture leading to poor yields has contributed to food cost (Dufey et al. 2007). Trade
barriers have increased food shortages as producing countries attempt to fight local price
increases (International Monetary Fund, 2008). Although no clear indications point to biofuels,
still they have been associated with food insecurity.
In South Africa, biofuel crops were identified as a potential to solving smallholder farmer
challenges. These challenges include creation of rural employment, creation of markets for
smallholder farmers and energy security (BIS, 2007). Peters and Thielman (2008) argue that
biofuel crops could be cultivated in a sustainable way and offer significant opportunities to the
developing countries.
Some biofuel crops can survive in semi-arid regions; hence, this makes them a good incentive
for smallholder farmers living in semi-arid regions like the Eastern Cape Province. The Eastern
Cape Province is a semi-arid region not good for commercial agriculture, thus, the region
specialises in livestock rearing (DAFF, 2012). Due to these characteristics, the region is well
suitable for biofuel crops production.
16
Although the Biofuel strategy seeks to address poverty and economic exploitation by
promoting agriculture in areas previously ignored by the apartheid system, since its launch it
has struggled to persuade smallholder farmers to look at producing biofuel crops. A large
number of smallholder farmers have not yet adopted biofuel crops regardless of the benefits
they stand to get from the biofuels industry. Despite the advantages proposed on biofuels crops
cultivation, adoption of biofuels crops remains low (von Braun, 2007).
This study therefore investigated the barriers and incentives that influence the potential
adoption of biofuel crops by smallholder farmers in selected areas in the Chris Hani District
Municipality and Oliver Tambo District Municipality in the Eastern Cape, South Africa.
1.4 Objectives
The main objective of the study was to identify factors affecting/influencing the potential
adoption of biofuels crops by smallholder farmers in the Eastern Cape, with an emphasis on
farmer’s characteristics.
Specific objectives are:
1. To investigate awareness of smallholder farmers of biofuel crops in selected areas in the
Eastern Cape Province.
2. To assess the level of potential adoption by smallholder farmers in selected areas in the
Eastern Cape.
3. To estimate determinants of farmers’ awareness and the potential to adopt biofuel crops
in the Eastern Cape Province.
17
4. To identify incentives that influence the potential adoption of biofuel crops by
smallholder farmers.
1.5 Research Questions
1. What theoretically determines the adoption of biofuel crops and farmers’
characteristics?
2. What is the potential level of adoption of biofuel crop by smallholder farmers in
selected areas in the Eastern Cape?
3. What determines the actual adoption and awareness of biofuel crops and what are the
bottlenecks?
4. What kind of incentives are needed to influence the potential adoption of biofuels crops.
1.6 Hypothesis
1. Farmers are aware of biofuel crops in the Eastern Cape Province.
2. The level of potential adoption of biofuel crops by smallholder farmers is high.
3. Social, economic, and farming factors influence farmers to adopt biofuel crops.
4. Capital, funding, markets are some of the incentives needed by smallholder farmers in
order for them to adopt biofuel crops.
1.7 Significance of the study
This study is based on the premise that agriculture constitutes one key element, within a broad
spectrum of strategies that can be adopted to reduce poverty and contribute to local economic

18
development. Furthermore, it was influenced by the interest shown by the government of South
Africa in trying to uplift rural smallholder farmer livelihoods using biofuels. In 2013, the
government set a clear target of 2 percent penetration of renewable energy (BIS, 2007);
unfortunately, this was never achieved. In order for the strategy to have a meaningful impact,
a thorough assessment of existing production capacity, adequate resources to drive the green
economy and incentives are needed to persuade smallholder farmers to adopt biofuel crops
production.
This study thus fills the gap in literature by digging deeper into the main factors affecting
awareness and adoption of biofuel crops by smallholder farmers in South Africa. To note are
these studies: Cloete and Idsardi (2012) measured biofuels effects on food security and
tradition crops; Mabiso and Weatherspoon (2011) estimated the impact of biofuel crops and
land rental markets in South Africa, and lastly Letete and von Blottnitz (2010) critically
analysed the biofuel policies in South Africa.
This study therefore will provide guidance to policy makers, government, agencies, academics,
and other relevant stakeholders who will find it useful in trying to understand factors that
influence smallholder farmers to adopt biofuel crops in South Africa, more specifically in the
Eastern Cape. Further, the study will provide key lessons to policy makers and practitioners
engaged in agricultural development in South Africa.
1.8 Delimitations of the study
The study focused on biofuel crops that grow in semi-arid areas and excluded any potential
plants used for biofuel extraction like Jatropha or Moringa. This is due to biodiversity concerns
raised by the Biofuel Industrial Strategy, such as, animal species poisoning and alien plants

19
that are toxic. Furthermore, the study did not attempt to identify all barriers and incentives to
potential adoption of biofuels crop in South Africa, but was limited to the Eastern Cape
Province because these factors are not uniform in all provinces. However, valuable lessons
from this study can be drawn as a directional tool in the formulation of incentives that can help
in the adoption of biofuels in South Africa.
1.9 Definition of terms
Incentives
Following Clark and Wilson (1961), an incentive is any factor that influences an individual to
behave in a certain way or something that motivates an individual to do a set behaviour. The
incentives of an individual can be separated into three motivations:
Intrinsic motivations- refer to the motivation that comes from within an individual such as
pleasure that one gets ahead of a task or from completion of a task.
Signalling motivation - refers to the motivation that individuals have on how they are perceived
by others, for instance, how people think.
An extrinsic motivation - refers to the motivation that comes from external factors affecting an
individual, such as material rewards. This includes money, assets, grades and so on. The
motivation rewards more satisfaction than what a task itself may not provide. Incentives of this
nature can be coercive, meaning an individual expects some of form punishment. These
incentives can also be legal, for example, tax incentives.
This study adopts Clarke and Wilson (1961)’s definition of incentives.
Biofuel

20
Biofuel are liquid fuels that have been derived from materials such as plant waste and animal
matter. They are separated into two groups; first generation and second generation. According
to Naik, Vaibhav, Prasant and Ajay (2010) first generation biofuels include biodiesel, bio
ethanol and biogas, and are resourced mainly from edible source current food material such as
maize, soybean, oil palm, sugar cane and cassava. Second-generation biofuel are fuels sourced
from non-edible sources such as jatropha and algae.
1.10 Study outline
This study consists of seven chapters. Chapter 1 introduces the study by presenting the
background to the study, aims, research problem, significance of the study and definition of
terms, among others. Chapter 2 discusses the literature on the adoption of new crops and
investigates more particularly the role of farmers’ characteristics in the adoption of new
technology. Chapter 3 describes the study area. Chapter 4 presents the econometric model and
estimation procedure. The chapter concludes with a theoretical model of adoption. Descriptive
results are discussed in Chapter 5. Chapter 6 provides a general discussion of results of the
econometric model. Lastly, Chapter 7 concludes the study and offers recommendations for the
way forward.

21
CHAPTER 2
LITERATURE REVIEW
2.0 Introduction
This chapter presents a review of relevant literature in an effort to explore the current debates
surrounding the adoption of biofuel crops among smallholder farmers. The chapter starts by
defining adoption and factors influencing or affecting adoption of new technology or seed
varieties. Factors affecting awareness to adoption of certain technologies are explained as well.
Lastly, barriers to adoption of biofuel crops conclude the chapter.
2.1 Adoption
Adoption of crops describes the decision to use or not use the crops and the spread of such
crops to economic agents. Adequate understanding of the process of adoption is necessary in
the improvement of agricultural programmes or research.
Following Rogers (2003), adoption is defined as the decision to use a new technology or
practice by economic agents on a regular basis. Feder, Just, and Zilberman (1985) posit that
adoption is in two forms, that is individual adoption (farm level) and aggregate adoption.
Individual adoption is said to be the degree of use of a new technology/innovation in long run
when the farmer has full information about the new technology and its expected potential.
Aggregate adoption is when a group of individuals or farmers adopts a new technology or seed
variety collectively. Feder et al. (1985) noted that adoption decisions involve choices of how
many resources are to be allocated to old and new technologies, if the technology is indivisible,
22
for instance, irrigation or mechanization, and lf the technology is divisible, for example,
fertiliser, improved seeds, then the decision process involves the allocation as well as the rate
of application. As a result, the adoption process includes simultaneous choices of whether to
adopt a technology or not and the intensity of the technology use. Feder et al. (1985) further
explain that a distinction should be made with regard to divisible and indivisible technology
when measuring intensity of adoption. Intensity of adoption can be measured individually in a
given period by the share of the farm under such new technology. Whereas when it comes to
indivisible agricultural technologies such irrigation machines and others at a farm level in a
given period is either use or non-use, the aggregate measure is continuous. This means
aggregate adoption can be measured by the percentage of farmers using the new technology in
a given area.
Two approaches are common in agricultural technology adoption literature. The first approach
dwells on adoption as a whole package and the second approach explained adoption as a
systematic event. Byerlee and Hesse de Polanco (1986) strongly argued that farmers do not
adopt technologies as a package, but rather adopt a single component or a few suitable
technologies. Leather and Smale (1991) supported Byerlee and Hesse de Polanco’s argument
that farmers choose to adopt inputs sequentially. Profitability, riskiness, uncertainty, and
institutional constraints are identified as the main agents determining the sequential adoption
stages. However, a study that was done by Ryan and Subrahmanyan (1975) focused on farmers
as rational agents who adopted based on trying to reduce the losses in an event that the crop
fails. As such, sequential adoption is a rational choice for farmers with limited cash. Rauniyar
and Goode (1996) defined farmers’ adoption as random which directly clashes with what
Rogers (1983) stated.

23
2.2 Adopters categories defined
Rogers (1983) identified five categories of adopters in a social system. These categories are;
innovators, early adopters, early majority, late majority and laggards. Rogers (1983) indicated
that the majority of early adopters are expected to be young, educated and ambitious and risk
takers. Contrary, late adopters are expected to be old, less educated, and conservative and risk
averse. The study identified five stages of the adoption process; awareness of the innovation;
interest and persuasion toward the innovation; evaluation or decision whether to adopt or not
the innovation; trial and confirmation sought on decision made and adoption. Adoption thus is
a sequence of events passing through these stages (Rogers, 1983). This is shown in Figure 2.1.
The innovation decision process by Rogers (1995) can be explained in five stages as follows:
Knowledge - this is when the individual is exposed to the existence of the innovation and
seeks information on how it functions.
Persuasion - is when the individual develops an attitude towards the innovation. This
maybe negative or positive attitude.
Decision - is when the individual engages in activities that lead to a choice to adopt or
reject the innovation.
Implementation - this is when the individual puts the innovation into use.
Confirmation - the individuals seek more positive aspects of an innovation. The
individual has hope of reversing that decision if it falls below his standard.
In Figure 2.1, the individual is influenced by prior knowledge when thinking of adopting. This
knowledge comes in the form of socio-economic factors and other personal variables. Then the
next stage is greatly influenced by interest or persuasion generated from prior knowledge. If

24
the individual is interested, a decision is made whether to adopt or not. If the decision is not to
adopt, the individual jumps the implementation stage and confirms his/her reaction to new
technology. If the decision is to adopt, the individual’s next stage is to implement the decision
and use the innovation. In the process, the next stage would be for the individual to confirm if
the innovation meets his/her standard by continuously evaluating. A decision is sort by the
individual if to reconsider adopting based on positive aspects seen in the innovation or to
discontinue using the innovation if there are more negatives with the innovation.
2.3 Adoption Characteristics and Stages
2.3.1 Adoption speed
Adoption speed is known to have an influence on adoption of technologies or crop varieties in
agriculture. A typical example can be given of technologies such as irrigation or mechanisation
that require a group’s action for adoption, compared to technologies that need an individual
will, such as, improved seed variety( Feder et al, 1985). The former are generally adopted
slowly compared to the latter technology that is independent of individuals.
2.3.2 Relative advantage
The relative advantage of a technology has the strongest effect/influence on the rate of
adoption. Examining the rate of adoption and other economic factors, Byerlee and De Polanco
(1986) suggested that the adoption pattern of a certain technology is a function of five
characteristics (riskiness, profitability, divisibility, complexity, availability, and initial capital
outlay).

25
The adoption process depends on how farmers value risks associated with the proposed
technology or innovation. Therefore, farmers pass through stages in deciding to adopt a
technology. A number of studies (e.g. Feder, 1980; Collier, 2001; Foster and Rosenzweig,
1995) identified that most individuals are risk averse when adopting technology. Hence,
farmers behaviour is guided by risks and uncertainty expected from adopting a certain
technology.

26
Figure 2.1: Adoption Model
Source: Rogers (1995)

27
The study highlighted that profitability and riskiness are a function of social-economic
environments such as prices or rainfall. Price and rainfall therefore are said to affect the
adoption rate.
In Figure 2.2, Mills et al. (1998) explained the adoption profile of farmers.
Figure 2.2: Adoption profile
Source: Mills et al. (1998)
Stage A explains the development lag that ends with a new technology. At B when a number
of farmers are aware of the technology they increase in adopting, then an adoption plateau
occurs at C when the targeted farmers have decided to use and have been exposed to the
technology. Stage D is when the technology is now getting obsolete. All these components
determine the rate of adoption.
0
5
10
15
20
25
30
35
40
45
5 10 15 20 30
po
ten
tial
ad
op
ters
pe
rce
nt
years after the start of adoption
A
B
C
D

28
2.3.3 Insights from literature
It has to be noted that adoption is hypothesised as happening in stages by literature.
Furthermore, adoption varies based on the innovation. Agriculture technological innovations
like tractors takes more time to be adopted because of the longer consultation period needed.
Yet, seed varieties can be adopted easily since the decision to adopt is done individually.
A number of studies (Rogers, 1983, 2003; Feder, 1980, Collier, 2001) admit that most
individuals are rational when deciding to adopt innovations, hence, they are risk averse. These
studies fail to understand that risk aversion is a concept influenced by a number of factors like
incentives offered, subsidies, or anything that can offer a profitable solution to farmers or
individuals. Risk aversion can be overcomed by incentives or output from adopting a certain
technology. A typical scenario is when farmers are promised that their produce would be
bought or when farmers are offered a stable market with heavily subsidised production costs.
Most farmers although rational, may behave irrationally when presented with such offers. This
scenario shows that risk aversion and rationality are concepts that are not clearly defined in a
number of studies.
It would be worthwhile if a number of studies on adoption could explain the concept of risk
aversion and rationality in line with the five proposed adoption stages by Rogers (1995). It may
be surprising to note that in each stage these two concepts may work in contrast. Limited
research in trying to understand these concepts in adoption studies presents a gap in literature.
2.4 Determinants to farmers’ adoption of new technology
This section introduces factors that influence adoption of new technology or seed varieties.

29
2.4.1 Institutional factors
Institutional factors can be summed up as factors such as having credit, access to price
information, being a member of an association and access to extension services. These factors
have been widely used as variables in a number of adoption studies in order to evaluate farmers’
behaviour. Uaiene et al. (2009) analysing agriculture technology adoption in Mozambique
reported that difficulties in accessing credit were a major constraint in adoption. Pattanayak et
al. (2003) noted that access to extension services, other stakeholders and Non-Governmental
Organisations have an influence in farmers’ adoption of new technology. The argument is that
farmers who usually meet extension officers and demonstrate the proposed technology have a
high chance of adopting technology. On the other hand, the Bandiera and Rasul (2005) study
on social networks and technology adoption by farmers pointed out that farmers with access to
paved roads, markets, farmers association, and in contact with extension agents are more likely
to adopt technology because they are exposed to information. lt is clear that institutional factors
also play a major role in determining whether farmers adopt certain technology or decline it.
2.4.2 Farmers’ socio-economics factors
A number of studies have used socio economic characteristics (i.e. gender, age, education,
household head) to explain household adoption behaviours. A study by Adegbola and
Gardebroek (2007) on adoption of technology by farmers noted that educated farmers are more
able to process inputs, allocate them efficiently, and assess the profitability of new technology
better than less educated farmers. Uaiene et al. (2009) is of the same view that educated
households are high adopters of technology in agriculture. On the contrary, a study by Adesina
and Forson (1995) on adoption of new agricultural technology found that both young and old
farmers adopted new technology. This was mainly influenced by these factors; young farmers

30
are risks takers and have long-term goals, yet, old farmers have more capital or have access to
credit. Zavale et al. (2005) disputed this notion and reported that older farmers in Mozambique
are less likely to adopt improved maize variety compared to young farmers.
2.4.3 Farmers perceptions
Farmers’ perceptions need to be understood when interpreting farmers’ adoption behaviour.
Neil and Lee (2001) are of the view that the adoption of new technologies is affected by
farmers’ perceptions of the amount of investments or initial capital outlay and labour that needs
to be allocated if they adopt the technology. Direct costs, profits associated with the improved
seeds, and yields were identified as factors affecting farmers’ perceptions (Adegbola and
Gardebroek, 2007). Martel et al. (2000), however, offered a different opinion on new
technology adoption after conducting a study in Honduras on adoption of dry beans. The
findings were that farmers adopt new technology when they perceived that it would reduce
labour costs, reduce risks in crop diseases and other farm costs. In addition, farmers are more
likely to adopt when they view a seed variety as having a potential to increase their income or
survive under different environmental conditions. Gonzales’s (2003) study purported that
farmers also consider environmental aspects such as climate, soil fertility and suitability of
seed varieties. Hence, it can be drawn from literature that farmers’ perceptions differ when it
comes to adoption and no clear factor can be generalised to each new technology.
2.4.4 Economic benefits and risks of new technologies
Economic profitability and risk of new technologies have an inherent effect on farmers when
adopting. Adegbola and Gardebroek (2007) stated that farmers who are aware of certain
technology will adopt if they evaluate the profitability or benefit that they anticipate will be
gained, taking into consideration investments and costs associated with such a technology.

31
Additionally, a study conducted in United States by Cornejo and McBridge (2002), on adoption
of bio-engineered crops discovered that farmers evaluate the impacts of farm location, soil
fertility, and climatic conditions on new technology before they adopt. However, farmers who
own land with poor physical conditions like fertility may adopt fertiliser with the hope of
improving those conditions. Uaiene (2009) recorded no positive correlation between land
tenure or farm size and land physical futures on farmer adoption behaviours. The study noted
that farmers in possession of land are less likely to adopt any technology like fertilisers because
land was abundant. Literature therefore is inconclusive about economic factors that influence
adoption. However, one view that is commonly held is that if technology leads to economic
benefits, it will be adopted.
2.5 Awareness of biofuels
2.5.1 Awareness of new technology/crop varieties
One of the crucial stages in the adoption of new technology that has been identified by literature
is the awareness stage. This is the stage when an individual has information about a certain
technology. Beale and Bolen (1955) conducted a study on agriculture technology and they
stated that awareness of a technology was the first stage of adoption. Beale and Bolen (1955)
defined awareness as a stage where an individual learns of the existence of a technology or has
little knowledge about it.
However, it seems in literature there is no consensus on what constitutes and influences
awareness. McBride et al. (1999) noted that awareness and attitude are influenced by
agricultural producers’ social economic characteristics. Rogers (2003) reinforced similar
claims. In introducing new technology or seed varieties, the first phase consists of making the
farmers aware of such technology, for instance, through demonstrations or other means and the
32
new technology is then be adopted if seen as beneficial. Diagne, (2010) and Daberkow and
McBride (2003) are of the opinion that an individual can adopt technology/crops without
knowing anything about its performance or characteristics.
A study conducted in Benin by Dandedjrohoun et al. (2012) on determinants of diffusion and
adoption of improved technology for rice parboiling pointed that the number of years in
parboiling experience, membership of women in an association, and ethnic group contributed
immensely to the awareness of the new technology. Similarly, Kromm and White (1991) are
of the same view that media, agricultural extension, crop consultants, play an important role in
early stages of adoption.
Studies done by Rollins (1993) and Korsching and Hoban (1990) noted that information
sources are very influential in the initial stages of adoption, because it is through media that
individuals get to be aware of the technology existence. Kinuthia (2010) discovered that
awareness of tree planting programme was positive and statistical significant. The claim was
that farmers who received information were in a better position of choosing to adopt new
technology than those who were not. Furthermore, Collier et al. (2002) got similar results that
farmers with better information on labour afforestation were in a better place to engage in tree
planting activities in their land. However, Dolisca et al. (2006) stated that although improving
information flow to a decision maker is a necessary condition, it does not necessarily mean
everyone who receives it would act on it.
Although much of the current research on technology adoption goes beyond awareness and
focuses on adoption rate or extent (Rogers, 1995, Feder et al. 1985, Adesina and Forson, 1995),
there is a broad consensus amongst researchers that awareness does have an influence on
adoption of technology. Diagne (2010) states that studies which exclude the awareness of
technology in adoption studies usually run the risk of producing an unidentified model.

33
Similarly, studies conducted by Diagne (2010), Diagne and Demont (2007) acknowledged
that any adoption study that does not account for awareness of the technology/crops to the
individuals leads to spurious conclusions about the potential adoption rate for the targeted
population. Nowak and Korsching (1998) stated that ignoring awareness stage in adoption
process and treating adoption as a dichotomous event could be partly responsible for the poor
predictive power of research using binary analytic models.
2.5.2 Insights from literature
From the literature studied, there is a consensus about including awareness as a determinant to
adoption of innovation or new seed varieties. However, detailed studies are required to
investigate factors that influence individuals to adopt a certain innovation or seed varieties. It
is surprising that there are limited studies from South Africa that have tried to explore factors
that influence awareness to innovations. This gap in literature can lead to policies that are only
good on paper, yet difficult to implement as shown by the current study.
2.6 Current biofuel development in South Africa
Biofuels are seen as a major source of employment and economic development in reducing the
decline of agriculture, especially in middle income and industrialised economies (DoE, 2014).
The South African government launched a Biofuels Industrial Policy in an effort to resuscitate
the agricultural sector and a 2 percent penetration target in national liquid fuel supply was
announced. Since this announcement was made, little has been achieved up to date (DoE,
2014). The major reason being that biofuels projects are not financially attractive at the
prevailing feedstock and crude oil/liquid prices. However, the problem seems to have been
partly addressed because eight companies have been offered operation licences to date (DoE,

34
2014). Table 2.1 shows the status of the licenced companies and their potential in biofuel
blending.
Table 2.1 Biofuel licences status as at 2013
Source: Department of Energy, (2014)
It can be seen from Table 2.1 that sorghum, sugarcane, sugar bee, soya been, canola and waste
vegetable oil are current the only feedstock that are expected to be used by the licenced
companies to produce fuel. To note are projects located at the Eastern Cape Province in
Cradock, Berlin and Port Elizabeth that are projected to produce over 900 million litres of
biofuel combined. The total capacity of the projected biofuels plants is expected to be about
1.262 million litres per annum, which is way above the targeted 2 percent level of biofuels in
the national liquid supply (DoE, 2014). Although the targets set by the Department of Energy
seem achievable. It is worth mentioning that none of the licenced project has been
commissioned because of a lack of an appropriate Biofuel Pricing Mechanism (DoE, 2014).

35
2.7 Barriers to Biofuels development
Biofuels development may offer growth in agriculture. However, there are two concerns that
have reinforced barriers to biofuels crops production.
Firstly, the possibility of requiring additional land and water resources means biofuel crops
may pose a threat to those resources, for instance, biofuel crops like the sugarcane are water
intensive and produced under monoculture (Liao, de Fraiture & Giordano, 2007). In order to
meet water requirement, irrigation withdrawals may have to increase by 20 percent even under
optimistic conditions (de Fraiture et al, 2007).
Secondly, the likely competition with food is one of the growing concerns about biofuel crops.
Pimentel (2003) noted that while price increase in food may benefit farmers, they have adverse
effect to urban and landless poor. Raswant, Hart and Romano (2008) pointed that as food prices
increase and staple foods become more expensive it will lead to alternatives getting expensive
as well, leading to food insecurity.
In 2007, the United Nations Department of Economic and Social Affairs (UNDES) undertook
a study on small-scale production of biofuels in Southern Africa region. The findings were as
follows:
Feedstock awareness- it was discovered that there is limited experience in choosing the right
feedstock to be used for small-scale farming.
Land ownership-land patterns are inconsistent in many nations. Land ownership rights may
become a thorny issue as biofuel cultivation competes with agricultural land. This situation is
set to lead to a diversion of cash crops being diverted to biofuels cultivation.
Policy support- it was discovered that there are a lack of policies to support small-scale
biofuels development at the local level. Also, in cases were Biofuels policies exist they tend to
36
focus on the commercials side of the biofuels production. Hence, the potential for biofuels
development to supply local energy needs has not been recognised.
Financing- a serious barrier that was said to affect many smallholder farmers was the issue of
financing or accessing affordable financing. This challenge affects smallholder farmers who
need to buy seeds and equipment for the production of biofuels crops.
Institutional awareness and capacity- the study noted that in sub Saharan Africa, there is a
lack of awareness in small-scale production of biofuels, as well as the capacity to improve or
develop production.
Market development- the findings also revealed that for any small-scale biofuel market to
exist, it is necessary to understand needs and establish supply chain for product delivery,
servicing and financing. Therefore, a number of smallholder farmers do not have business
models to sustain their production of biofuels crops.
2.8 Conclusion
The literature review reveals that farmers’ attitudes and perceptions remains a focal point in
any decisions to adopt technology or farm programmes. Further, it highlights that successful
adoption of agricultural technologies by smallholder farmers involves a process of analysing a
number of factors such as socio economic, institutional and household characteristics.
However, the varying degrees of factors influencing adoption have led to the adoption debate
to be inconclusive in literature, with some researchers arguing that a number of factors such as
economic situation and attitudes affect adoption. Yet, other researchers are of the view that
adoption is determined by awareneness to certain technology or seed varieties.

37
CHAPTER 3
STUDY AREA
3.0 Introduction
This chapter presents the population, geographical area, economic, social, and physical
characteristics of the study area. A description of the Chris Hani and Oliver Tambo District
municipalities under study is given.
3.1 Location of study areas
This research was carried out in the Eastern Cape Province of South Africa. The province is
shown diagrammatically in Figure 3.1 below with all district municipalities.
Figure 3.1: Eastern Cape Province
Source: Provincial Spatial Development Plan-Eastern Cape (2012)

38
The Eastern Cape is well known for its history in the struggles between native people (Xhosa)
and the European Colonialists (Lahiff, 2005). People were separated along racial lines, as was
the rest of South Africa during apartheid. This led to widespread dispossession of land and
other property (Kingwill, 2000). Rural areas or former homelands (Transkei and Ciskei)
dominate the province. Van Averbeke and Hebinck (2007) notes that the deep rural areas of
the former Ciskei and Transkei have presented enormous challenges to the land claim, land
restitution, and land redistribution reform policies introduced by the government since 1994.
The majority of people are poor and located in former homelands of Ciskei and Transkei, with
poverty dominating mainly in black, female-headed households (Lahiff, 2005). According to
Lahiff (2003) more than 10 million hectares of land (95 percent) in the Eastern Cape was in
the hands of 6500 white commercial farmers, employing over 70000 farm workers. The land
is for vegetable production, mixed farming, cattle ranching, sheep and dairy farming. Rainfall
is plentiful in the eastern side along the coast during summer more than the inland. Van
Averbeke (2000) points out that rainfall differs in accordance to proximity to the ocean.
Villages close to the ocean receive enough rainfall to grow crops and veld management; yet,
the ones further away receive little rainfall. During droughts, the communities’ socio-economic
activities are greatly disturbed as livestock perish and most are reliant on off farm activities
(Van Averbeke & Hebinck, 2007). One of the crops that usually gauges the potential of
agriculture is maize. That is, for the purposes of this study, maize was used to benchmark the
potential of agriculture in Eastern Cape because of its semi-arid conditions. According to
Figure 3.2, it can be seen that areas close to the coastal are more suitable for maize production.

39
Figure 3.2: Maize Potential
Source: Provincial Spatial Development Plan-Eastern Cape (2012)
Figure 3.2 shows that areas lying to the western area of the Eastern Cape province have no
potential in maize production. This therefore may also highlight the places of interest for the
biofuel crop production, because most of the crops are suitable for semi–arid regions. The
Cradock area in the western side of Queenstown has been targeted for biofuel productions and
a multi-million biofuel production facility is under construction.
3.2 Oliver Tambo District Municipality
It is of great importance to identify the study area set-up because all these characteristics
contribute to the livelihoods of the targeted respondents. One of the study areas that is
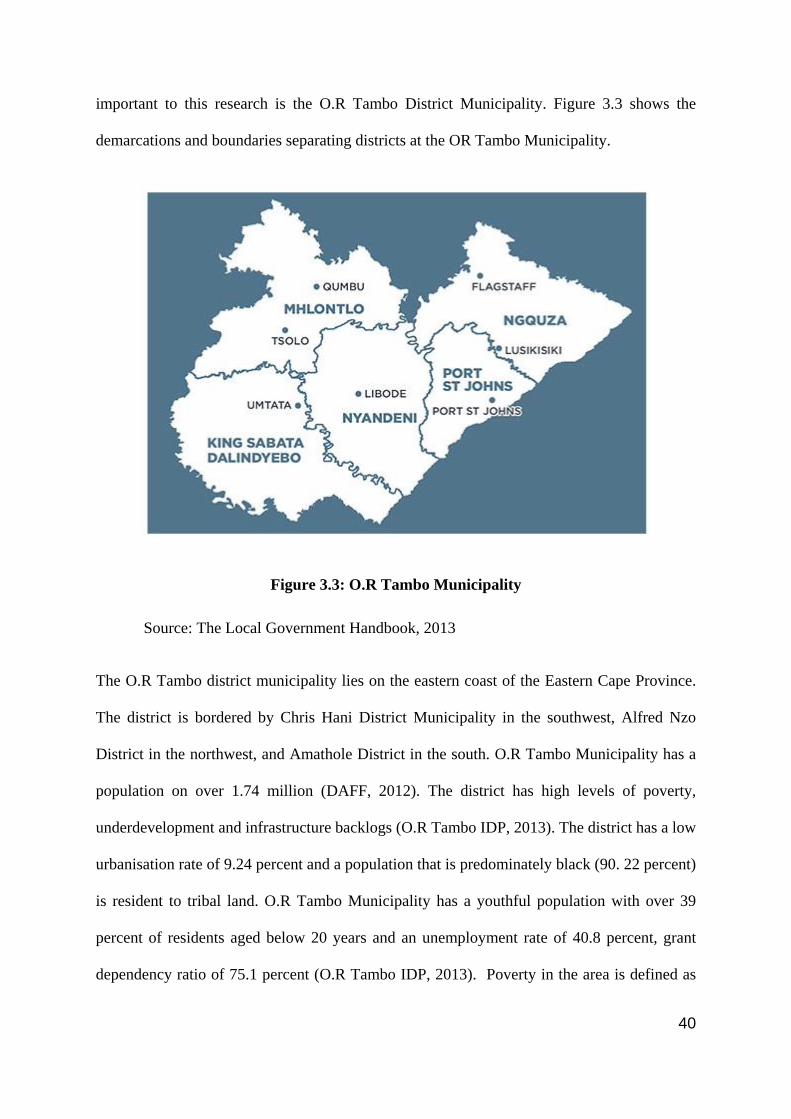
40
important to this research is the O.R Tambo District Municipality. Figure 3.3 shows the
demarcations and boundaries separating districts at the OR Tambo Municipality.
Figure 3.3: O.R Tambo Municipality
Source: The Local Government Handbook, 2013
The O.R Tambo district municipality lies on the eastern coast of the Eastern Cape Province.
The district is bordered by Chris Hani District Municipality in the southwest, Alfred Nzo
District in the northwest, and Amathole District in the south. O.R Tambo Municipality has a
population on over 1.74 million (DAFF, 2012). The district has high levels of poverty,
underdevelopment and infrastructure backlogs (O.R Tambo IDP, 2013). The district has a low
urbanisation rate of 9.24 percent and a population that is predominately black (90. 22 percent)
is resident to tribal land. O.R Tambo Municipality has a youthful population with over 39
percent of residents aged below 20 years and an unemployment rate of 40.8 percent, grant
dependency ratio of 75.1 percent (O.R Tambo IDP, 2013). Poverty in the area is defined as

41
deep and pervasive with at least 37.7 percent of residents living in squalid conditions (O.R
Tambo IDP, 2013). The district per capita income is R14679 per annum. The district has a poor
skills base with a literacy rate of 51.6 percent (O.R Tambo IDP, 2013).
According to the Department of Economic Development and Environmental Affairs (DEDEA,
2012), almost 65 percent of the households have access to water. The Human Development
Index is 0.40 as from 2009. Although it increased from 3.8, it still reflects a lack of access to
basic services, high illiteracy rate, and low standards of living, similarly to the Chris Hani
District Municipality.
3.2.1 Poverty levels
Global Insights (2011) estimated that approximately 60.6 percent of the African population in
the O.R Tambo District Municipality is impoverished. Of this number at least 58.9 percent of
the total population where living in poverty. However, comparing on a national basis only 37.7
percent of the total population was living in poverty (O.R Tambo IDP, 2013). The Ngquza
Hill local Municipality had the highest percentage of people living with poverty (64.8 percent),
although the urban municipalities had a lower rate of people living in poverty (O.R Tambo
IDP, 2013)
3.2.2 Education
According to the O.R Tambo IDP (2013), the district is characterised by lower levels of
education. A total of 22 percent of the population had no schooling in the year 2001. However,
this improved from 2001-2011 to 9 percent of the population (O.R Tambo IDP, 2013).The
district has been facing challenges with tertiary education facilities, hence, only one tertiary
institution is present in the district.

42
3.2.3 Vegetation and soils
The O.R Tambo District Municipality is composed of dense mixed grass veld, with no
dominant species. Acocks (1953) describes the vegetation as Dohne Sourveld. Soils are mainly
composed of mudstone and sandstone, which are structureless (Manona, 2005). The topsoil is
approximately 300-400mm deep with the underlying soils composed of impenetrable rock or
high clay. Manona (2005) noted that soils are of doleritic intrusions generated from the Karoo
Dolerite. The soils are of Karoo origin making it ideal to farm drought resistant crops like
sorghum or millet.
3.2.4 Rainfall, Temperature and Hydrology
The O.R Tambo district receives annual rainfall of above 800 mm (DAFF, 2013). The rainfall
decreases inland and lower in major river valleys (O.R Tambo IDP, 2013). During winter
months rain falls in the coastal areas and the inland areas receive 80 percent of precipitation or
more during the months of October to March. The temperature ranges from a mean minimum
of 14.3 -19.8 degrees in January and 1.8-13.4 degrees Celsius in July. The mean maximum
range is 14.3-25.3 degrees Celsius in January and 19.5-21.4 degrees Celsius in July.
One large river system called Umzimvubu and two medium rivers namely Mthatha and
Umtamvuna provides the area with water. The area has a number of coastal rivers with limited
catchments stretching no more than 60 km inland (O.R Tambo IDP, 2013).
3.2.5 Transport Infrastructure
The low historical investments in road infrastructure in the O.R Tambo resulted in very poor
access to the major road routes. The effect is that it isolates the already impoverished
communities from important livelihood socio economic opportunities and limits economic
43
development making it expensive to move inputs and outputs within the district and outside
(O.R Tambo IDP, 2013). Furthermore, the district roads are below provincial average
concerning surfacing due to the remoteness from major economics hubs (DEDEA, 2012). The
status of the road infrastructure may prove to be a significant factor in improving smallholder
farmers’ access to biofuel markets. Currently, a number of national, provincial and district
roads are being upgraded and refurbished in the area (O.R Tambo IDP, 2013).
3.2.6 Economic activities
According to the South Africa National Disaster Management Centre (NDMC, 2011), the
district relies mostly on retail and wholesale sectors that have minimum growth potential with
little to offer towards employment opportunities. Furthermore, mixed farming of crops and
livestock is predominant, with crops such as cabbage and potatoes dominating, although maize
is usually farmed in the district. The area has a high crime rate, poor road infrastructure and
rail, making it hard to link to nearby seaports.
3.3 Chris Hani District Municipality (CHDM)
According to the Department of Provincial and Local Government DPLG (2013), Chris Hani
District Municipality lies in the northern – eastern part of Eastern Cape. It was established in
2000 after the new demarcation of districts. The study area map is shown in Figure 3.4 with
clear demarcations of small villages.

44
Figure 3.4: Chris Hani Municipality
Source: The Local Government Handbook, 2013
3.3.1 Socio- Economic information
There are about 795461 people who live in CHDM and they cover an area of 36558km2( Chris
Hani IDP, 2013). At least 79 percent reside in rural areas or former homelands, while the
remaining are urban based. Generally, the population density is 21.83 persons/km2. More than
55.9 percent of the population is composed of youths that are younger than 24 years of age
(Chris Hani IDP, 2013). Households headed by women contribute around 53.5 percent of the
population and the predominant language is (IsiXhosa) spoken by 93.3 percent in the district
(Chris Hani IDP, 2013).
3.3.2 Economic Overview
The area is reliant on Community Services which contributes 52 percent to the GDP and it is
characterised by agricultural activities wish contribute 4 percent in GDP (Chris Hani IDP,
2013). The Gini coefficient that measures inequality is 0.6. A value of zero means that they is
a case of perfect equality, and one is perfect inequality. The inequality is more on black

45
communities. The Human index that measures development should be preferably above 0.50
to represent an acceptable level of development. In CHDM, the index is 0.46, which is an
unacceptable level (Chris Hani IDP, 2013). This is caused by a lack of basic services such as
housing and infrastructure to name a few.
3.3.3 Agriculture
Timber and livestock production are the two agricultural sectors that have a comparative
advantage in the area. Although crop production and agro processing remain vital, the transport
cost and high volume markets makes these sectors uncompetitive (Chris Hani IDP, 2013). In
2008 an Integrated Agricultural Strategy was develop, and the following sectors were targeted
for investment in agriculture: Agro–processing, livestock farming, crop production with special
emphasis on biofuels, and irrigation schemes (Chris Hani IDP, 2013). The area is faced with
challenges in livestock production due to low skills, access to land, poor veld, limited access
to market and credit access to emerging farmers due to insecure land tenure (Chris Hani IDP,
2013). Furthermore, biofuel development has been of prime importance with the establishment
of a project near Cradock. The project is set to revive and re activate sectors of the economy in
the area (Chris Hani IDP, 2013).
3.3.4 Temperature
The temperature in CHDM is characterised by extreme weather patterns. In summer, the
maximum temperature exceeds 40 degrees Celsius in the lower lying areas in the western (arid)
section (Chris Hani IDP, 2013). Minimum temperatures are often below zero degrees Celsius
and frost is a common occurrence in winter months in high lying areas. The period of frost is
usually from mid-April to early October (Chis Hani IDP, 2013). Temperature in the eastern
part of the district is usually moderate, with frost occurring from May to September. The high

46
temperature rates predominate in the area offers great opportunity for biofuels crops that are
usually adaptable to semi-arid conditions. Hence, this shows that the area has a huge potential
in biofuels production
3.3.5 Rainfall
The rainfall is usually in summer with 70-80 percent precipitation in form of thunderstorms
and hail. Rainfall varies over the area depending on altitude and distance to the coast (Chris
Hani IDP, 2013). In western arid areas, the rainfall is around 200mm-300mm, whereas in
eastern, it is 700mm-800mm (Chris Hani IDP, 2013). However, the huge part of the area is
generally semi-arid and receives less than 400mm of rainfall. Evaporation is much higher than
rainfall. This situation complicates crop production, as it requires other moisture conservation
methods for dry cropping and irrigation management. Hence, the area may be well suited for
biofuel crops such as sorghum, sunflower and soya that can be easily grown in semi-arid
regions.
3.3.6 Land type
According to the Chris Hani Municipality Spatial Development Framework (2011), the area is
composed of Beaufort sediment with dolerite intrusions. This type of landscape was formed
through a combination of shale, mudstone, and sandstone. The soils are rocky and not suitable
for crop production. However, in the valleys deeper soils are predominating. Rocky soils can
be considered for crops such as sorghum. Thus, utilizing land that is available for productive
uses. Soils in the more arid areas are shallow and consists of mainly Mispah, Glenrosa and
Swartland (Chris Hani IDP, 2013).

47
3.4 Conclusion
The OR Tambo Municipality is the only district that receives more rainfall than any other
municipality in the Eastern Cape Province because of its geographic location. Inland areas
receive little rainfall, hence, they may be targeted for biofuels production. Briefly, agriculture
in the O.R Tambo District Municipality is predominantly subsistence farming in communal
lands. The area is favoured by moderate temperatures that are ideal for farming rain fed crops
like maize, potatoes, and others.
The Chris Hani Municipality District is characterised by moderate rainfall, high temperatures,
poor soils and many thunderstorms. Families who grow crops on dry land have a serious
shortage of water due to high evaporation rates prevalent in the area. However, the area is good
for farming especially in deeper valleys with the use of irrigation. The next chapter explains
the methodology employed in the study.

48
CHAPTER 4
RESEARCH METHODS
4.0 Introduction
This chapter presents the research method and clarifies the research procedures that were
adopted in this study. This is important in order to evaluate the usefulness of the research
results. Issues addressed include the research design, data collection reliability, validity and the
underlying population of the study. The chapter proceeds to discuss how the data collection
and interpretation are particularly linked to the conception of the biofuel industry. The chapter
concludes by the Heckman model specification that was used for a regression analysis.
4.1 Unit of analysis
Trochim (2006) stated that the unit of analysis is a major entity in any study. It can be of the
following nature; groups, individuals, geographic units to name a few. In this study, individual
farmers were used as the unit of analysis. The farmers were from Chris Hani and Oliver Tambo
District Municipalities. A questionnaire was administered in person to record data.
4.2 Sampling Frame
A sample frame is defined as a list of units from which a sample is drawn (Lewis-Beck et al.
2004). In this study, farmers were selected based on their willingness to participate in the
survey. Not all farmers in study areas were selected, but a sample was drawn from the targeted

49
population. The two districts were purposively selected because of their agricultural potential,
geo-climatic and soil characteristics, as well as, cropping history.
4.3 Sampling technique
This study adopted a non-random purposive sampling technique to select the smallholder
farmers. A snowballing sampling technique refers to a situation in which the probability of
including each element of the population in a sample is unknown (Kish, 1987).The snowballing
sampling technique is used to capture a range of perspectives relating to the thing under study.
This technique helps in gaining deeper insights into units under study. These units may exhibit
a wide range of attributes, behaviours, experiences, qualities, situations and so forth.
The main reason for choosing this method was to focus on particular characteristics of the
population of interest. This in turn helped in answering the research questions proposed for the
study. However, this method can be prone to bias. In order to correct the sample bias a
Heckman Two step model was then used to remove any sample bias.
A non-exhaustive list of farmers was acquired from the Department of Agriculture in Chris
Hani Municipality and Oliver Tambo District Municipality with the help of the Agricultural
Extension Officers. Interviews were then conducted on households that had access to arable
land. Then farmers in both municipalities were classified as non-land utilizer and land utilizers
after using a snowballing sampling technique. Non-land utilisers where farmers who did not
farm for the last two seasons and land utilizers where farmers who farmed their land in the past
two seasons. Utilised land is land exclusively for farming crops.
In order to draw the sample a random sampling technique was applied to choose the first
respondent. Then upon finishing with the respondent, they will suggest the next respondent to

50
be interviewed. Since, the technique was applied randomly at the first instance, the samples of
land utilizers and utilizers were not likely to be equally. Therefore, the snow balling technique
started after the first interview.
The sampling frame is shown on Table 4.1.
Table 4.1 Sampling Frame
Oliver Tambo Municipality Chris Hani Municipality Total
Land Utiliser Non-Land Utilisers Land Utiliser Non-Land Utilisers
50 29 30 20 129
4.4 Sampling size
A bigger sample size is always preferred when collecting data about a group. Although it is
more representative, it tends to be costly, while a small sample is less accurate but more
convenient (Singh & Chaudhary, 1979). As stated above, the study consisted of two areas
namely, O.R Tambo and Chris Hani municipality districts. In Chris Hani District, areas
sampled had farmers partaking in irrigation farming and consisted of smallholder farmers
utilising and non-utilising land. The two types of farmer groups were purposively selected in
order to identify certain characteristics or traits that would help in identifying farmers that were
likely to adopt biofuel crops and those who would not.
The areas sampled were Zwelitsha, Maya, Entla kweFolo, Mkhukhwini, and Elalini. In the
OR Tambo District smallholder farmers selected were utilising and non-utilising land, but
mainly those who were involved in rain-fed crop production. The areas sampled were Blekane,
Bomvu and Hlophe. The selection of the sampled areas in each municipality was done random.

51
In the Oliver Tambo Municipality, 50 smallholder farmers were identified and in Chris Hani
District Municipality a total of 79 smallholder farmers were part of the sample. This contributed
to a total sample size of 129 smallholder farmers. In choosing the number of farmers sampled
per area, accessibility of farmers and distance were taken into consideration. In Chris Hani
District Municipality, farmers were far much spaced than OR Tambo Municipality. Meaning
one had to travel a long distance to get a farmer to interview. The challenge of the data
collection process is that since all the interviews were voluntary, it was costly to travel a large
distance and fail to interview the farmer or farmers.
4.5 Orientation stage
This stage involved visiting the study areas in 2013 and holding discussions with farmers. The
main objectives for the study were outlined to the farmers through agricultural extensions
officials. This was done to familiarise and interact with the farmers so as to identify key issues
pertaining the study areas.
4.6 The survey
After the orientation stage, the actual survey was done between the period of January and
February 2014. A questionnaire was used to collect data. This was done through the
administration of a similar semi-structured questionnaire.
4.7 Data collection procedures
In order to fulfil the objectives of the study, both primary and secondary data was recorded.
Secondary data was used mainly for the description of the study areas and background
information.

52
Primary data was collected using semi-structured questionnaires. The questionnaires were
interviewer administered to reduce problems of misinterpretations and misunderstanding of
words or questions, since the areas had illiterate and literate farmers. Kvale (1996) states that
interviews standardize the order in which questions are asked. Open-ended question allow
individuals to express their opinions. However, most of the questions were closed ended to
make it easier when coding and for simplicity in capturing information without wasting time
for the respondents. Each interview lasted approximately 20 minutes.
Face–to-face interviews were the means of administering the questionnaires based on the
following advantages:
High reliability of data was obtained since the interviewer can probe with further questions
if respondents seem to not understand the questions or appear to be falsifying information.
The method ensures that all the necessary information found in the questionnaire was
answered to avoid having a lot of missing data. Hence, this improved the validity of the
questionnaire.
The method enhances internal validity of the conclusions drawn.
Factual questions relating to respondents background and personal data such as educational
level, gender, age, marital status were asked at the beginning of the questionnaire. This was
followed by farm characteristics questions. Lastly, question relating to biofuels completed the
interview.
4.8 Ethical considerations
The following steps were taken in order to comply with the ethical requirements and standards:

53
The right to participate and withdraw voluntary at any stage of the interview was
practised, to ensure that the respondent was not coerced into participation.
The purpose of the study was explained beforehand so that the individual understood
the nature the research.
The procedures of the study were clarified, so that the individual could expect what
was anticipated in the research.
The right to privacy within the research and after, as well as, the right to obtain results
was maintained.
The benefits to be accrued from study were explained clearly.
Signatures of both participant and researcher formalising such an agreement gave a go
ahead to the study.
The findings of the research will not be falsified, suppressed, or invented to suit the
need of the respondents and researcher.
4.9 Confidentiality and anonymity
The confidentiality and anonymity of respondents was assured in the study. This was achieved
by not asking names from respondents. However, the district or village that the respondents
came from were required.
4.10 Coding of data
According to Rossman and Rallis (1998), coding is the process of organising the material to
get a meaning from that material. This process involves taking an image, text data, or sentences
and labelling those categories with a term. The data that was extracted from respondents was
recorded on a Windows Excel spreadsheet and transferred to SPSS version 21 for coding and

54
analysis. Furthermore, the same Excel spreadsheet was taken to the econometrics software
package of EViews version 8 to analyse the Heckman two-step model.
4.11 Reliability
Reliability of the instrument used to collect data was ensured by the use of different types of
question formats. This enabled the research design to pick inconsistencies in the responses. A
Cronbach Alpha was used to test reliability. This is a measure of internal consistency or how
closely related a set of items are as a group. A high value in the alpha is often used as evidence
that the items measure an underlying or latent construct. The Cronbach’s Alpha was above the
minimum 0.6 resembling the reliability of the instrument in capturing what it intends to capture.
Table 4.2 shows the test results.
Table 4.2 Reliability Test
Cronbach's Alpha No of Items
.624 129
4.12 Validity
To ensure that the conclusions drawn by the study are as valid as possible, the study ensured
that municipalities exhibiting conditions of grain or crop farming formed part of the study. The
validity issue is linked to generalisability of the research to other provinces that did not form
part of this study. The study can certainly generalise its results within the areas it has studied
and areas exhibiting similar conditions as the study areas. When linking the results to provinces
that did not form part of the sample, readers and researchers should be careful and view the
study results as indicative, instead of descriptive.

55
Model Specification
4.13 Models analysing adoption
This section reviews theoretical and empirical models used to analyse adoption studies.
4.13.1 Rational utility maximisation model
This model is based on a few assumptions. Firstly, households are assumed to be rational utility
maximizing units that select their preferences from a set of participation or adoption
preferences in a biofuels related market. Household decisions are based on farm household’s
utility obtained from participation or adoption subject to its reservation utility, farm household
characteristics, and resource constraints. Therefore, the underlying farm household’s utility
from participating/ adopting in a biofuel market q:
Uq*= Xβq + Kq αq +ϵq,……………………………………………………………………….(1)
where X is a vector of the observable independent variables, for instance, farmland, incentives,
household characteristics (rent, landholding size, gender, education), Kqis a vector of
unobserved latent variables (farm potential that affects the choice to adopt biofuels or
participate in the market and household earnings), ϵq, is the error term which is assumed to be
independent of Kq yet βq and αq are respective parameters associated with X and Kq . Uq*is
the unobserved farm household choice to adopt/ participate in a biofuels market, q is the
observed. If K is assumed to be latent denoting the specific market adoption/participation
choice of farm household, then we can write K=q when Uq*= Max (Uz*). Where Uz* is a
complete set of optimising utility levels associated with z adoption/participation decision that
the farm household can make. Therefore, the expected household income to be achieved by
each participating or adopting choice can be expressed as follows :

56
E (y) = u* (fβ+Iqλq+ iγ)……………………………………………………………..(2)
Where f is a set of exogenous variables with associated parameters β and λq, which represents
the effects of adopting or participation in a biofuels related market in farm household earnings
relative to non-participation. The expected earnings are also a function of the unobserved
variables Kq with marginal effects parameters γ.
The utility maximization model can be used empirically as a multinomial probit model that has
an error term that is assumed to follow a normal distribution with correlation between
alternatives (Greene, 2012). This is more favoured over the multinomial logit model because
it relaxes the independence of irrelevant alternatives assumptions (IIA) (Greene, 2012).
4.13.2 Static Models
A static model tries to weigh farmers’ decisions to adopt an improved technology at a specific
period. The model tries to answer questions of what determines whether a particular technology
is adopted or not and what determines the pattern of adoption. A simple static model is a logistic
model that can be shown as follows:
𝜕𝑁𝑡
𝜕𝑡= 𝑔𝑡(𝑁𝑀 − 𝑁𝑡)…………………………………………………………………………….
(1)
Where 𝜕𝑁𝑡
𝜕𝑡 is known as the rate of changes in adoption over time,t and 𝑔𝑡 is the coefficient of
diffusion (which is a measure on how fast adoption occurs). The cumulative frequency of
adopters is represented by 𝑁𝑡at time t and 𝑁𝑀 is the maximum numbers of adopters in a system
over time. (𝑁𝑀 − 𝑁𝑡) represents the number of potential adopters not joining at a time t.
57
A number of models in adoption studies are set in static binary or probit or logit models (Jansen,
2003). In such models, the adoption process is strictly dichotomous (to adopt or not) where the
functionality relationship between the probability of adoption and a set of variables are
estimated using the logit or probit model. These two models investigate the effect of regressors
on the decisions to use or not, they do not measure the intensity of adoption (Feder et al. 1985).
For instance, a decision to adopt a one quarter of recommended new seed variety is treated the
same as a farmer who adopts the recommended level of seed. Therefore, a Tobit is mainly used
in such instances where the amount of seeds can be ascertained (i.e. data on the area planted
those seeds)
Other alternatives to analyse adoption decisions involve the use of a double hurdle model that
takes into account zero observations (Heckman, 1976). The model choice is very important
because it influences the results obtained within the study. Amemiya (1984) states that
inappropriate use of non-user data can lead to bias and inconsistent in estimates, for example,
a Tobit model assumes that results or decisions regarding adoption and its intensity are equally
similar. Yet, studies conducted by Coady (1995) proved otherwise by indicating that the results
are not similar. Heckman (1976) produced a model that is most restrictive since it assumes that
non-zeros for non-adopters are generated by the decision, making the standard Tobit model
irrelevant in such instances.
A study by Negatu and Parikh (1999) used a Probit and an ordered Probit to test the significance
of the impact of farmers’ perception in the adoption of new technologies. The Probit model
was used to analyse the adoption decisions, while perception of farmers were modelled using
the ordered Probit. Consequently, a simultaneous model combining the Probit and Ordered
Probit approaches provides a useful approach in modelling a two-way relationship between
adoption and perception. To determine dependent variables of simultaneous nature of discrete
58
and continuous endogenous, the Heckman (1978) was proposed. The Heckman uses a reduced
form of parameter estimates as instruments to overcome the problem of estimating system of
equations, with discrete and continuous endogenous variables. For instance, if estimating the
effects education of men has on their income, a problem met is that men who are not working
do not have income. If it happens that unemployed men are a result of poor education, running
a regression with income as a dependent would lead to biased estimates.
Thus, a Heckman procedure offers two steps in correcting that bias. The first step is to test the
model using a probit model, and then the residuals from the probit analysis are used to create
Lambda that is equal to the lnverse Mills Ratio. The value of the Lambda is added as an
additional variable. In the second step, the analysis is done using an Ordinary Least Square
regression. Therefore, two models are created, that is the selection model and outcome model.
The main caution for the method usage is that the selection equation or model should contain
at least one variable that is not related to the dependent variable. If such a variable is not present,
issues of multi-collinearity may lead to estimation difficulties and spurious coefficients.
4.13.3 lnsights from literature
Some studies justify the use of binary or dichotomous models, while other studies are of the
view that failure to measure awareness when testing adoption potential generally leads to
spurious results.
Nevertheless, every model has its strengths and weaknesses. As long as a model can come to
conclusive results that many studies agree upon, it is a suitable model. Therefore, they are many
criterions that can be used to access a model viability. Therefore, if it passes all the required
steps of a model fit, then it is a good model.

59
4.14 Conceptual Framework
Awareness
Farmers are made aware of the biofuel crops.
Interest
Then they gain interest if the benefits outweigh the
costs
Evaluation
They calculate risks involved in trying the new crops and the
opportunities gained.
Trial
They now try a specimen and to see if
the risks can be monitore
Adoption
If they are satisfied after trial period they will adopt the
product or decline
Source: Author
Figure 4.1 Conceptual Framework

60
Figure 4.1 demonstrates that awareness is the first stage to any adoption process. Therefore, in
order to have a buy-in from the targeted population, one must try to disseminate information.
4.15 Econometric Model
In this study, a binary choice model in the form of a two-step procedure known as the Heckman
model was used to investigate factors affecting/influencing the potential adoption of biofuel
crops. The model was designed to measure choices between two discrete alternatives. The
model has been widely used in adoption studies (Usman et al. 2011; Deressa, 2007; Gennrich,
2004; Demeke, 2003). Furthermore, it has been widely used to correct any sample selection
bias. It takes the form explained below:
4.15.1 Heckman two stage model
The Heckman estimation corrects for non-random sample selection by using two equations. A
typical model for interest is : 𝑦 = 𝑥𝛽 + 𝑢 … … … … … … … … … … … … … … … … … . . (1)
Where 𝐸 (𝑢
𝑥) = 0, 𝑠 = 1[𝑧𝛾 + 𝑣 ≥ 0] where s =1, if we observe y and 0 otherwise. The
correlation between u and v leads to sample selection problem. Therefore, the first step would
be to estimate 𝛾 on a probit of st = zt using the whole sample. Then an inverse Mills ratio 𝜆𝑡′ =
𝜆(−𝑧𝑡𝛾′)of each i is computed. Using a selected sample with observation for which st =1, the
second procedure would be to run a regression of yt on xt, 𝜆𝑡′ (Wooldbridge, 2000)
The inverse Mills Ratio is extracted from a probit equation in the first stage to provide OLS
selection bias corrected estimates. A simple equation model with a random sample size of n
can be written as follows:
𝑌1𝑡 = 𝑋1𝑡𝛽1 + 𝑈1𝑡 … … … … … … … … … … … … … … … … … … … … … … … … … … (2)
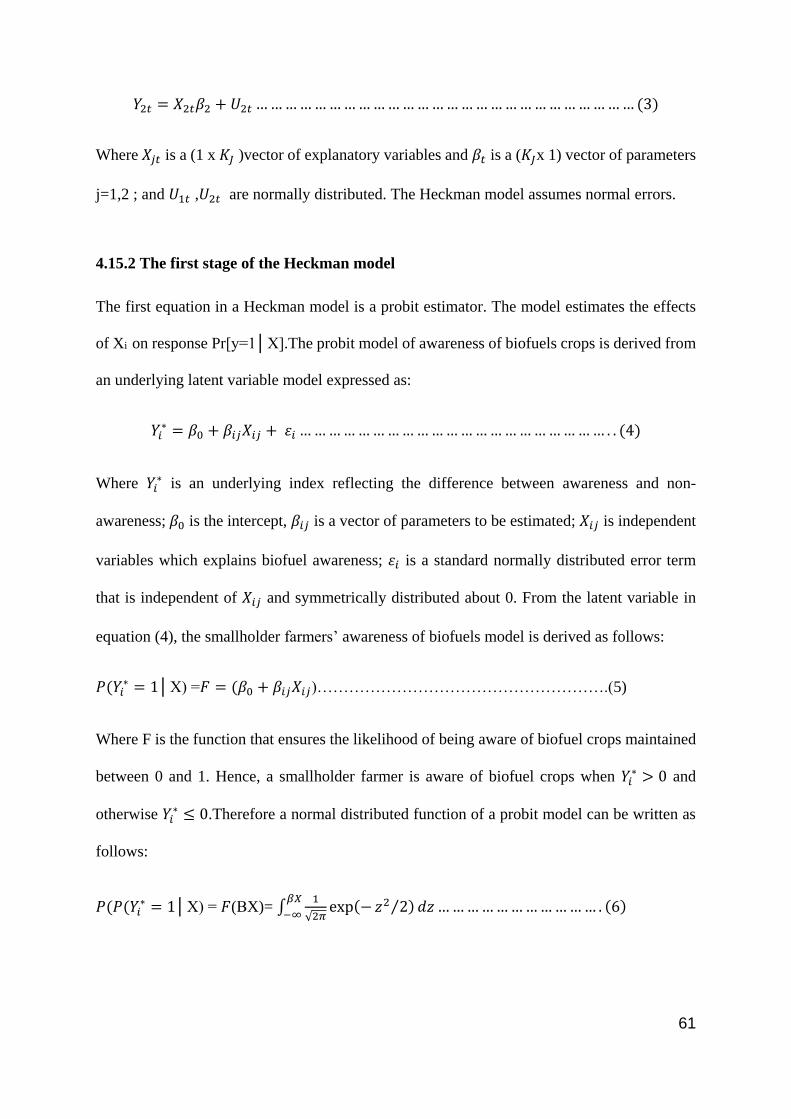
61
𝑌2𝑡 = 𝑋2𝑡𝛽2 + 𝑈2𝑡 … … … … … … … … … … … … … … … … … … … … … … … … … … (3)
Where 𝑋𝑗𝑡 is a (1 x 𝐾𝐽 )vector of explanatory variables and 𝛽𝑡 is a (𝐾𝐽x 1) vector of parameters
j=1,2 ; and 𝑈1𝑡 ,𝑈2𝑡 are normally distributed. The Heckman model assumes normal errors.
4.15.2 The first stage of the Heckman model
The first equation in a Heckman model is a probit estimator. The model estimates the effects
of Xi on response Pr[y=1│X].The probit model of awareness of biofuels crops is derived from
an underlying latent variable model expressed as:
𝑌𝑖∗ = 𝛽0 + 𝛽𝑖𝑗𝑋𝑖𝑗 + 𝜀𝑖 … … … … … … … … … … … … … … … … … … … … … . . (4)
Where 𝑌𝑖∗ is an underlying index reflecting the difference between awareness and non-
awareness; 𝛽0 is the intercept, 𝛽𝑖𝑗 is a vector of parameters to be estimated; 𝑋𝑖𝑗 is independent
variables which explains biofuel awareness; 𝜀𝑖 is a standard normally distributed error term
that is independent of 𝑋𝑖𝑗 and symmetrically distributed about 0. From the latent variable in
equation (4), the smallholder farmers’ awareness of biofuels model is derived as follows:
𝑃(𝑌𝑖∗ = 1│X) =𝐹 = (𝛽0 + 𝛽𝑖𝑗𝑋𝑖𝑗)……………………………………………….(5)
Where F is the function that ensures the likelihood of being aware of biofuel crops maintained
between 0 and 1. Hence, a smallholder farmer is aware of biofuel crops when 𝑌𝑖∗ > 0 and
otherwise 𝑌𝑖∗ ≤ 0.Therefore a normal distributed function of a probit model can be written as
follows:
𝑃(𝑃(𝑌𝑖∗ = 1│X) = 𝐹(ΒX)= ∫
1
√2𝜋
𝛽𝑋
−∞exp(− 𝑧2 2⁄ ) 𝑑𝑧 … … … … … … … … … … … . (6)

62
Where P is the probability that the ith smallholder farmer will be aware of biofuel crops and 0
otherwise; X is the (k x1) vectors of the independent variables; z is the standard normal variable
and β is the (k x1) vector of coefficients to be estimated.
4.15.3 Second stage of the Heckman Model
The estimates of γ of the probit model were used to generate the estimates of the inverse Mills
ratio term that is as follows:
𝛾′𝑡(−𝑍𝑡𝛾′) =
𝜃(𝑍𝑡𝛾′)
∅(𝑍𝑡𝛾′)………………………………………………………………… (7)
Where ∅(. ) is the standard normal cumulative distribution function (cdf) and 𝜃(. )is the
standard normal probability density function (pdf) in a truncated standard normal distribution.
Greene (2000) states that truncation takes place when a sample is drawn from a population of
interest. The second stage is estimated by ordinary least squares and uses observations with
positive values of the dependent variable, hence, it is the outcome equation that includes the
inverse Mills ratio and X variables as regressors.
Γ𝐽 = 𝜙𝛾′𝐽 + 𝜗Λ𝐽 + Ε𝐽……………………………………………………………….(8)
Where Γ𝐽 is the non f ,𝛾′𝐽 is the inverse Mills ratio and Λ𝐽 represents variables such as socio
economic (age,education,farm size), economic variables (income) and more. The error term is
Ε𝐽 and consistent estimates of 𝜙 and α = 1. The sample selection equation is as follows:
𝑃′𝑗 = 𝜂𝑋𝑗 + 𝜀𝑗………………………………………………………………………(9)
The sample rule is that Γ𝐽 is observed only when 𝑃′𝑗 is greater than zero. 𝑃′𝑗 is the decision to
adopt biofuels or not. Hence, the outcome mechanism is that:

63
𝑃′𝑗 = 𝜂𝑋𝑗 + 𝜀𝑗Where 𝑃𝑡 = 1 if 𝑃𝑡 > 0 and 0 otherwise. Therefore the regression model
Γ𝐽 = 𝜙𝛾′𝐽 + 𝜗Λ𝐽 + Ε𝐽 is observed if 𝑃𝑡 = 1 , ( 𝜀𝑗 , Ε𝐽)~ bivariate normal and the error terms
follow a bivariate normal distribution with mean 0 and correlation р.
4.15.4 Definition of the regression equations used in the study
The following equations were used to estimate the Heckman Model:
𝑦1𝐴𝑊𝐴𝑅𝐸 = 𝑏𝑜 + 𝑏1 ∗ 𝐺𝐸𝑁𝐷𝐸𝑅 + 𝑏2 ∗ 𝐴𝐺𝐸 + 𝑏3 ∗ 𝑄𝑈𝐴𝐿𝐼𝐹𝐼𝐶𝐴 + 𝑏4 ∗ 𝑀𝐸𝑀𝐵𝐸𝑅𝐴𝑆𝑆 + 𝑏5
∗ 𝐶𝑂𝑁𝑇𝐴𝐶𝑇𝐸𝑋𝑇 + 𝑏6 ∗ 𝐹𝐴𝑅𝑀𝐸𝑋𝑃𝐸 + 𝑏7 ∗ 𝐹𝐴𝑅𝑀𝐸𝑄𝑈𝑃 + 𝑏8
∗ 𝑂𝐶𝐶𝑈𝑃𝐴𝑇𝐼𝑂𝑁 + 𝜀 … … … … (𝟏𝟎)𝐒𝐞𝐥𝐞𝐜𝐭𝐢𝐨𝐧 𝐌𝐨𝐝𝐞𝐥
𝑦2𝐴𝐷𝑂𝑃𝑇 = 𝑏𝑜 + 𝑏1 ∗ 𝐻𝐻𝑆 + 𝑏2 ∗ 𝐴𝑅𝐴𝐵𝐿𝐸 + 𝑏3 ∗ 𝐼𝑁𝐶𝐸𝑁𝑇𝐼𝑉𝐸𝑃𝐴𝑅𝑇 + 𝑏4 ∗ 𝐻𝐻𝐼𝑁𝐶𝑂𝑀𝐸
+ 𝑏5 ∗ 𝐶𝐻𝐴𝐿𝐸𝑁𝐺𝐸 + 𝑏6 ∗ 𝑈𝑇𝐼𝐿𝐼𝑍𝐸𝐿𝐴𝑁𝐷 + 𝑏7 ∗ 𝐵𝑂𝑅𝑅𝑂𝑊𝑀𝑂𝑁𝐸𝑌 + 𝑏8
∗ 𝐿𝐴𝐵𝑆𝑂𝑈𝑅𝐶 + 𝑏9 ∗ 𝐿𝐴𝑁𝐷𝐴𝐶𝑄𝑈𝐼𝑅𝐸 + 𝑏10 ∗ 𝐷𝐼𝑆𝑇𝐴𝑁𝐶𝐸
+ 𝜀 … … … … … … … … … … (𝟏𝟏)𝐎𝐮𝐭𝐜𝐨𝐦𝐞 𝐌𝐨𝐝𝐞𝐥
4.15.5 Definition of variables
The variables chosen for this study were directed by previous literature on adoption of
agricultural technologies and crops. The literature was presented in Chapter 2 for easy
reference. Independent variables are divided into three groups: demography characteristics of
farmers that includes household size, age, and education. Institution factors such as; access to
markets, tenure system, credit access, farm experience, membership to associations; and

64
economic factors such as income, awareness of biofuels, adoption of biofuels. A detailed
description of variables is provided in the subsequent sections.
4.15.6 Dependent variable
In this study, awareness and adoption were modelled as jointly binary dichotomous variables
with the impacts of determinants of awareness estimated using a bivariate logistic specification.
The dependant variable for the outcome equation is whether the farmers would adopt biofuel
crops or not (ADOPT). Following Daberkow and McBride (2003) the ADOPT variable is
specified in binary with (0 = adopt biofuel crops) and (1= not adopt biofuel crops). The
dependent variable for the selection model is AWAREBIO. This variable is also in a dummy
format like ADOPT where 0 means the farmer is aware of crops and 1 the farmer is not aware
of biofuel crops. In order to identify respondents as potential adopters or not, a screening
question was posed and through their responses it was then easy to identify the two separate
groups.
4.15.7 Independent variables
Age- this variable measures the age of the respondents and it is continuous. As farmers age,
advances risk aversion comes into play, thus, low chances of adopting a certain technology.
Young farmers are risk loving and are expected to have a high probability of adopting new
technology. The variable therefore has a positive or negative relationship with adoption
depending on age. Kherallah and Kirsten (2001) posit that older farmers are resistant to change
and therefore are likely not to adopt technology. On the other hand, Ngqangweni and Delgado
(2003) are of the view that older farmers are experienced, hence, there are likely to adopt so as
to increase their output.

65
Household size - this variable is a continuous variable that indicates the number of people in
a household. This includes parents, children and other relatives who live in the same dwelling
and share food together. A large family size means labour maybe available in form of young,
middle aged and older people who may participate in farming. On the other hand, a large
household size may mean added pressure for residential houses. This may lead to more land
being used for housing, thus, leading to negative participation in farming.
Education- the variable measures formal or lack of education of a household head in the
family. It measures the level of education with no education. Tadesse and Kasa (2004)
hypothesised that education level was positively related to the adoption of agricultural
technology. Educated people are more likely to be informed and interpret information better
than the uneducated. This means they may understand innovations faster, as a result, making
quick decisions on whether to adopt certain technology or not. Siebert et al. (2010) notes that
farmers with a higher level of education may take advantage of any training and information,
therefore, they are able to successfully participate in new technology adoption than the less
educated.
Credit access - the variable measures if the respondents have access to credit facilities or the
possibility of getting credit. It is a dummy variable, which takes a value of 1 if the farmer has
credit and 2 if the farmer has no access to credit. Farmers with credit usually overcome
difficulties or financial constraints and they are able to buy inputs. In contrast, farmers with no
access to credit find it difficult to acquire or adopt agricultural technology (Taha, 2007).Access
to credit therefore is expected to influence the probability of willingness to adopt biofuel crops.
Farming experience- measures the number of years of experience in farming. Farmers with a
lot of experience as in the number of years appear to have better knowledge and might be able

66
to identify advantages of new technology. Therefore, farming experience is expected to have a
positive influence in adoption.
Contact with extension officers- this variable measures the number of times the agricultural
extension officers’ visit farmers per month and it is a continuous variable. Any contact with
extension officers is expected to increase the likelihood of farmers adopting new technology
(Habtemariam, 2003). The more the farmer is in contact with extension officers, the higher the
chances of acquiring more information on proposed adoption technologies or crops.
Land tenure- It is a discrete variable. Land ownership is believed to have a huge influence on
adoption of technologies linked to land (Feder, et al. 1985). Daberkow and McBride (2003)
notes that land has a huge influence when the innovation requires investment to be tied to land.
Farmers who own land are expected to be motivated to adopt agricultural technology or crops
unlike those who rent the land.
Labour – this refers to active male or female members in a household or community. A
household with a larger number of members per hectare is more likely to be in a position to
adopt new technology or try an innovation. Kidane (2001) states that labour influences the
adoption behaviour of farmers. This means that a farmer with access to more labour has a high
probability of adopting production of biofuels crops.
Utilised land - farmers who are utilising land are expected to be influenced by what there might
get if they adopt a certain technology. The relationship of adoption maybe positive or negative
if they do not find a solid reason on why they should forego the current crops they are producing
and adopt new crops. Farmers who are not utilising land may see this as a big opportunity to
bounce back to agriculture, since the land can now be utilised to the fullest. Therefore, they
have a higher probability of adopting biofuel crop production.

67
Gender – this is a categorical variable where 1 represents a male and 2 a female. It is expected
to influence the adoption rate in biofuels because males are the ones more engaged in farming
than females. Gender also influences the access to assets such as capital and land, which have
a direct effect on productivity. In traditional societies, access to land is usually restricted to
males and women access land through males. However, the decision to participate in
production of biofuel crops will likely involve males, even though the households may be
headed by females.
Members associations - this variable measures the involvement and affiliation of a respondent
to any formal and informal organisation. Individuals who are active in associations are likely
to have better awareness and knowledge than those not involved in any associations
(Habtemariasm, 2004). It takes the value of 0 if the farmer is a member and 1 otherwise.
Therefore, respondents who are active in associations are in a better position to understand the
innovation before it is launched through grape vine engagements. Hence, being a member of
an association is expected to influence positively the adoption of biofuels.
Distance to market- this variable measures the distance that the respondent takes to reach the
nearest market or where the respondent sells his/her output. Markets that are far away usually
discourage farmers from participating in any income benefiting activities. The reason being
that transport adds more costs to the farmer. As a result, the shorter the distance to the market,
the higher the chances of farmers participating or adopting new crops varieties.
Incentives - the variable involves the incentives offered to farmers to discontinue of current
crops they are farming and opt for biofuels crops. It is highly likely that farmers who are offered
incentives may be flexible in adopting biofuel crops, if there think incentives will improve their
yield and income. Therefore, it is expected that incentives will have a positive influence on
farmers adopting biofuel crops. The variable is a dummy, with 0 representing willingness to

68
adopt biofuels based on incentives offered and 1 non-willingness to adopt biofuels when
offered incentives.
Challenges - the variable expresses the challenges that farmers are exposed to when deciding
to participate in an agriculture programme or adopting new technology. It is unlikely that
farmers who face more challenges would adopt a certain crop or new invention, especially if it
leads to more risks. Therefore, the more the challenges the higher the chances that the farmer
will not adopt the production of biofuel crops. The variable was a categorical. Where
challenges were grouped as institutional, financial and socio economic challenges.
The summarised variables and the expected priori are shown in Table 4.3 below.
4.16 Analytical software
Two statistical packages were used in this study to take advantage of different features in both
programs. Statistical Package for Social Science (SPSS) is excellent in descriptive statistics,
comparison of means and logit models. The Eviews software package is excellent in running
econometric models and provides a number of tools for testing and screening data; therefore,
it was used for testing heterescedasticity and the Heckman two step model.

69
Table 4.3 Variables for the study
Variable Definition Type Unit of measurement Expected
Sign
Dependent Variables
ADOPTBIO Adoption of biofuels Binary 1 = adopt & 0 otherwise
AWAREBIO Awareness to biofuels Binary 1 = aware & 0 otherwise
Independent Variables
Farmers socio-demography characteristics
HHGENDER Household gender Binary 0= Male &1 = Female +/-
HHAGE Household age Continuous Years +/-
HHEDU Household education Continuous Level +
HHSIZE Household size Continuous members +/-
HHINCOME Household income Continuous South African Rands +
Farming, institutional and management factors
UTILAND Utilization of land Binary 0 = yes &1 = no +/-
ARABLE Amount of utilized land Continuous Hectares +/-
TENURE How land was acquired Discrete tenure +
DISTANCE Distance to market Continuous Kilometres -
FARMEXPE Level of farming experience Continuous Years +
CREDIT Access to credit Binary 0= yes &1 = no +
LABOUR Source of labour Discrete Type of labour +/-
MEMASSOC Member of association Binary 0= yes & 1 = no +
AGRICEXTE Contact with agriculture extension
agents
Binary 0= yes &1 = no +
INCENTIV Offered incentives Binary 0= yes &1 = no +
CHALLENGES Challenges faced by a farmer Categorical Type -

70
4.17 Conclusion
This chapter outlined the methodology and analytical tools that were used in this study. The chapter
highlighted the major strengths of this study in the following format:
The explanatory variables under consideration in Table 4.2 made the empirical model more
reliable in measuring what it intends to measure.
Use of primary data and the sample size that was purposive were selected in order to achieve
an in depth response rate that would answer every objective that this study seeks to address.
Further, the sampling method justified the use of the Heckman two-step model to correct for
any sample bias.
Use of two statistical packages that have been tried and tested to be good in analysing
econometrics and statistics data, thus, increasing the reliability and validity of the data recorded.
The objectives are restated in Table 4.4 below.

71
Table 4.4 Objectives Summary
Objectives Questions Hypothesis Analytical tool
1. To investigate awareness of smallholder farmers on
biofuels crops in selected areas in the Eastern Cape
Province.
What determines theoretically
adoption of biofuel crops and
farmers’ characteristics?
Farmers are aware of
biofuels crops in the Eastern
Cape Province.
Descriptive
statistics
2. To access the level of potential adoption by smallholder
farmers.
What is the level of potential
adoption of biofuels crop by
smallholder farmers in selected
areas in the Eastern Cape?
Farmers are aware of
biofuels crops in the Eastern
Cape Province
Descriptive
statistics
3. To estimate determinants of farmers potential to adopt
biofuels crops in the Eastern Cape Province.
What determines the actual
adoption of biofuel crops and
what are the bottlenecks?
Social, economic, and
farming factors influence
farmers to adopt biofuels
crops.
descriptive
statistics and
econometric
model
4. To identify incentives that influence the potential
adoption of biofuels crops by smallholder farmers.
What kind of incentives are
needed to influence the
potential adoption of biofuels
crops?
Capital, funding, markets
are some of the incentives
needed by smallholder
farmers in order for them to
adopt biofuels crops.
Descriptive
statistics

72
CHAPTER 5
RESULT DISCUSSIONS
5.0 Introduction
This chapter presents the major findings of the study on barriers and incentives to widespread
adoption of biofuels in the Eastern Cape. Firstly, descriptive statistics are presented so as to
highlight the livelihoods of respondents and factors that may influence them in adopting biofuel
crops. Demographic, farm characteristics, income sources, challenges, and incentives
necessary for adoption of biofuels are also presented. The chapter concludes by analysing the
Heckman two stage model in order to answer the objectives set for the study.
5.1 Descriptive characteristics of the study
Table 5.1 below summarises sample characteristics in which measurements such as the mean,
standard deviation, median, skewness and kurtosis are given. The mean and median were in
the range of zero to four, implying that there were no outliers. The following characteristics
were negatively skewed. Suggesting that the mean is lower than the median.
Age distribution of survey respondents
Household income
Systems of land tenure
Credit Access
Distance to market
Farm experience
Source of income

73
Table 5.1 Descriptive statistics
Variables N Mean Median Std. Deviation Skewness Kurtosis
Gender 129 .47 0.00 .501 .142 -2.011
Age of respondents 129 2.15 2 0.674 -0.185 -0.792
Highest qualification 129 2.17 2 1.276 0.959 -0.088
Household size 129 4.48 5 1.404 -0.872 0.18
Household income 129 3.11 3 1.517 0.045 -1.527
Arable land 129 2.3 2 1.101 0.23 -1.278
Utilize land 129 0.2 0 0.403 1.506 0.27
Arable land utilised last season 104 2.02 1 1.182 0.573 -1.297
Land tenure 129 3.59 4 0.989 -1.851 2.109
Crops produced 108 2.04 1 1.611 1.946 3.201
Distance to market 109 3.44 4 0.821 -1.286 0.662
Access to credit 129 1.65 2 0.478 -0.642 -1.613
Farm experience 129 2.32 2 0.729 -0.573 -0.922
Source of labour 127 1.22 1 0.435 1.655 1.551
Member of any association 129 1.46 1 0.5 0.173 -2.001
Contact to any extension 129 1.48 1 0.502 0.078 -2.025
Awareness to biofuels crop 129 0.48 0 0.502 0.078 -2.025
Willing to adopt 129 0.21 0 0.408 1.446 0.092
Willing to adopt if given incentives 129 0.35 0 0.478 0.642 -1.613
Sources of income 129 3.73 3 1.344 -0.277 -0.959

74
Skewness and Kurtosis values were less than one, with the exception of land tenure that was
over two.
5.2 Respondents Statistics
The average age of the respondents was between 35-50 years and the prominent qualification
was grade twelve. The majority of households had between 5-6 members with a household
income on average of 2001-3000 per month. Most households had arable land of 0.5-1 hectares
and the majority utilized 0.6-1 hectares last season. The distance to the market was over 10
kilometres and farm experience ranged between 6-10 years. This is presented in Table 5.2 .
5.2.1 Gender
The results in Table 5.2 show that males comprised 53.14 percent of the sample as a percentage
of head of households. This represents the general norm in Africa where most households are
male headed or dominated. This observation is similar to Montshwe (2006), who discovered
that males still dominate in the agricultural sector in South Africa. At least 52.71 percent of
respondents interviewed were 35 years and over, but less than 50 years. A total of 31.01 percent
respondents were 50 years and above.
5.2.2 Marital status
The study also assessed the marital status of the respondents. Table 5.2 shows the distribution
of households by marital status. At least 45 percent of the respondents were married, 21 percent
single, 18 percent divorced, and 16 percent widowed. The marital status helps in accessing the
duties of participants per household in the African society. In addition, married people are able

75
to share household activities such as farming, herding livestock and harvesting. Whereas single,
widowed and divorced households usually struggle with household activities.
5.2.3 Education
The majority of respondents had at least a primary education. A total of 39.53 percent attended
grade 11 or lower, at least 28.68 percent attended grade 12; 16.28 percent had a diploma, 6.2
percent had a bachelor’s degree and 9.3 percent received a post graduate degree. Nkhori (2004)
observed that the problem of education especially in rural areas household is set to decline as
access of education improves. However, Musemwa et al, (2007) pointed out that the problem
may be caused by the fact that most of the youths are employed in the formal sector and other
informal sectors, as they view agriculture as a dirty job. Therefore, since the majority of
respondents have secondary qualifications, this is not expected to affect potential adoption of
biofuel crops because most of the older smallholder farmers have a lot of experience in farming.
5.2.4 Household size
Table 5.2 shows that households with more than 6 people were 28.58 percent of the sample.
Similarly, households with 4 or 5 members made 25 percent of the sampled households.
Smallholder agriculture is heavily dependent on household labour. FAO (2013) posits that
increasing family size tends to provide families with the required labour for agricultural
production, yet, larger families exert a great deal of insistence on consumption than the labour
contributed to agricultural production. Hence, larger families are expected to be having
adequate labour for farming.

76
Table 5.2 Respondents Summary
Variable Description Percent Variable Description Percent
Gender Male 53.5 Farm experience 0-5 years 15.5
Female 46.5 5.1-10 37.2
Age of
respondents
15-34 16.3 10.1 and more 47.3
35-50 52.7 Source of labour Family 77
51 and above 31 Community 20.2
Qualifications Grade 11 or lower 39.5 Other
2.8
Grade 12 28.7 Member of
association
Yes 54.3
Post matric diploma 16.3 No 45.7
Bachelor degree 6.2 Source of income Donation 6.2
Postgraduate degree 9.3 Agriculture 10.1
Household size Live alone 5.4 Salary 34.9
2 5.4 Pat time jobs 5.4
3 7.8 Grants 38.8
4 27.1 Business owned 3.9
5/6 25.6 Occupation Unemployed 45
More than 6 28.7 Formal employed 29.5
Household
income
0-1000 17.1 Pensioner 7.8
1001-2000 27.9 Self employed 13.2
2001-3000 12.4 Full time farmer 4.7
3001-4000 12.4
4001 and over 30.2
Distance to
market
Less than 0.5km 2.3
0.6-5km 10.9
5.1-10km 18.6
10.1 or more 52.7

77
5.2.5 Income
Table 5.2 shows different levels of income received by households in the study area. It is
illustrated that 30 percent of respondents receive an income over R4000 a month, 28 percent
receive income between R1000-2000 per month, 17 percent receive less that R1000 and 24
percent receive income between R2000-4000. It was noted that many respondents who earned
above R2000 per month supplemented their income with pension grants or child support grants.
From the study, it emerged that most respondents depended on social grants. At least 39 percent
depend on social grants for their livelihoods. These grants are in form of pensioners’ grants
and child support grants. A closer analysis at the respondents revealed that 34.16 percent
survived on salaries, 10.16 percent on agricultural outputs through selling their produce, and
6.25 percent received donations, 5.47 percent worked part time jobs to raise income and 3.19
percent owned businesses that generated income. It can be deduced from the results that most
farmers earn off-farm income. Therefore, since a number of respondents are earning off-farm
income, they may be persuaded to farm biofuel crops to improve their on farm income.
5.2.6 Sources of income
When it comes to employment, a total of 44.96 percent respondents were not employed. This
was explained by a high percentage of respondents having grants as a form of income.
Respondents that were formally employed constituted 29.46 percent of the sample. Pensioners
were 7 percent of respondents, full-time farmers were 5 percent of the sampled respondents
and 13 percent were self-employed.
78
5.2.7 Membership in association
Farming associations serve as a communication tool for many farmers. Therefore, membership
to an association was considered for this study. A total of 54.26 percent respondents stated that
there are members of agricultural associations or societies. Being a member of an association
serves as a network where valuable information pertaining to agriculture can be exchanged.
Members can also learn new things and this is a platform for discussing innovations, identifying
constraints faced by members. With a number of respondents being members to agricultural
associations, it is expected that they would be willing to participate in biofuels production.
Being a member to agricultural association may have an influence to farmers in adopting new
technology (Diagne, 2010).
5.3 Adoption potential and farmers characteristics
This section explains the association of variables to adoption of biofuel crops.
5.3.1 Gender of households and willingness to adopt biofuels
The relationship between gender and willingness to adopt biofuels crop was investigated.
Males had a higher percentage (43.41 percent) of respondents who were willing to adopt
biofuels and females had 35.66 percent respondents willing to adopt biofuels. Mihiretu (2008)
claimed that males and females are likely to play different roles in technology adoption
depending on the nature of the technology. This is mainly caused by the socio-cultural values
and norms. For instance, males have a freedom to participate in a number of extension
programs. Although the literature is inconclusive on gender concerning adoption, the results
give an insight of the likely gender to adopt biofuel crops for production. The results are shown
in Figure 5.1.

79
Figure 5.1: Respondents gender and willingness to adopt
5.3.2 Age of respondents and willingness to adopt biofuels
The age group of 35-50 years has the highest percentage (41.86 percent) of potential adopters
of biofuel crops, followed by the over 50 years age group. The results are in support of
literature, which states that many risk takers are farmers in their midcareer or mid ages. The
findings are similar to Jera and Ajay’s (2008) study on participation in fodder tree growing.
Dereje (2006), however noted that as farmers’ age increases the probability of adopting new
technology decreases. Yet, Hofferth (2006) suggested that older people become more adaptive
to technology because of experience in farming. The results are presented in Figure 5.2.

80
Figure 5.2: Respondents age and willingness to adopt
5.3.3 Marital Status and willingness to adopt biofuels
Figure 5.3 shows that married people have the highest percentage (42.11 percent) of adopting
biofuel crops, followed by divorced people at 18 percent and single people at 18 percent as
well. The results show single, divorced and married are high-risk takers as they have the largest
percentages of respondents with a potential to adopt.

81
Figure 5.3: Marital status and willingness to adopt
5.3.4 Level of education of the respondents and willingness to adopt biofuels
Figure 5.4 shows that most of the respondents are beyond the youth age, hence, only a few
respondents did tertiary level. Thus, the highest potential to adopt is seen from respondents
who did Grade 12 and under. It is not surprising though that the highest respondents not willing
to adopt 12.49 percent possess grade 11 and below. Partly uneducated people are expected to
be resistant to new technology or seed mixtures, because they may struggle to understand the
benefits of such technology or seeds. The results are similar to Joseph (2008) who observed
that farmers with more education are likely to adopt new technology than those with primary
level. Moreover, farmers with more education were said to be aware of information concerning
adoption. Bembridge (1988) noted that lack of knowledge affects the potential to adopt new
technology such as seed varieties.

82
Figure 5.4: Highest qualification and willingness to adopt
5.3.5 Household Size and willingness to adopt biofuels
The study considered the household size effect to the potential adoption of biofuel crops. Figure
5.5 shows that households with more than 4 members have a higher chances of adopting
biofuels crops (24.03 percent). Phororo (2001) stated that large households have extra labour
capacity available, hence a large household may influence the potential to adopt biofuel crops.
A close look at the findings reveals that as the household size increases, so does the percentage
of not willing to adopt. The factors that influence large households may be tied to the need to
generate additional income to nurture every member. Moreover, as the household size
increases, so does the stress of finding reliable income to get into motion.

83
Figure 5.5: Household size and willingness to adopt
5.3.6 Household income and willingness to adopt biofuels
Household income status has an influence on the adoption of biofuel crops, in that households
with higher income may be persuaded to adopt biofuel crops based on the premise that they
can afford to buy seeds for farming. On the other hand, households with little income may not
be persuaded to adopt biofuels unless they have some sort of subsidy or sponsorship. Over
half of the respondents earning income through agriculture were not willing to adopt biofuels
for production. Figure 5.6 shows that households earning R1000-2000 had 22.48 percent
respondents willing to adopt biofuels and household earning R4000 and more had 23.26
percent potential adopters. This generally means that low-income households find themselves
looking for alternatives to increase their income through adopting biofuels with the hope of
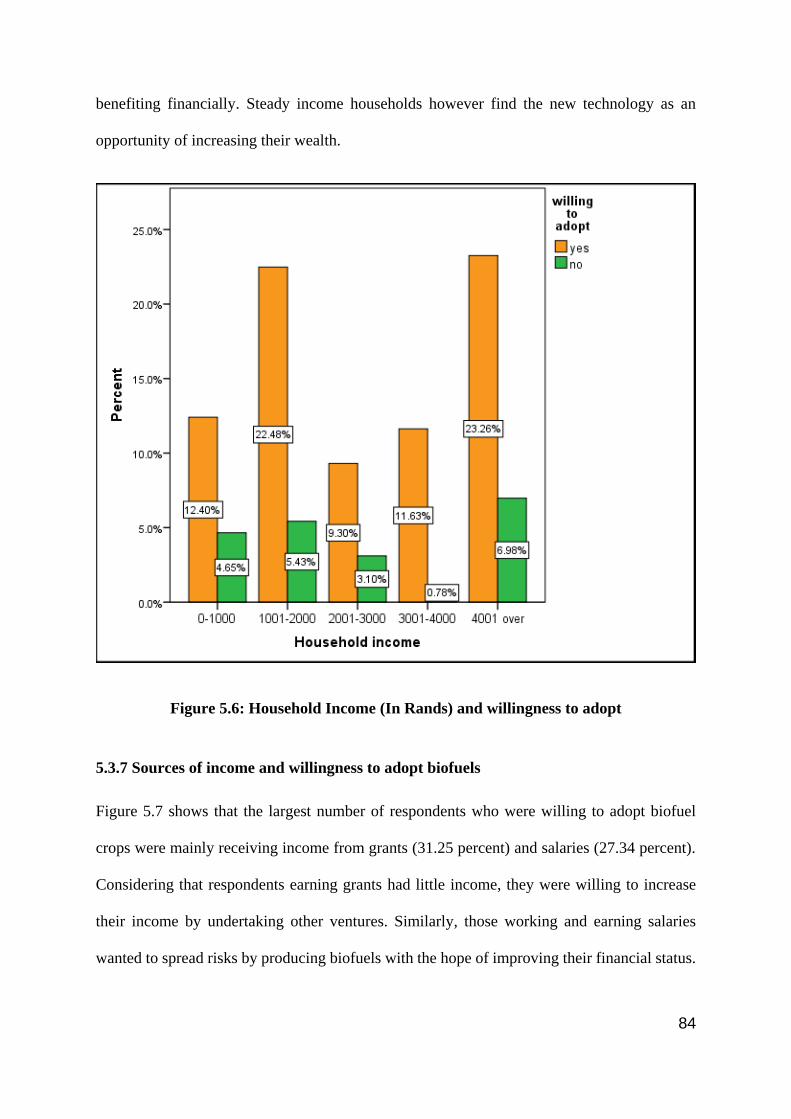
84
benefiting financially. Steady income households however find the new technology as an
opportunity of increasing their wealth.
Figure 5.6: Household Income (In Rands) and willingness to adopt
5.3.7 Sources of income and willingness to adopt biofuels
Figure 5.7 shows that the largest number of respondents who were willing to adopt biofuel
crops were mainly receiving income from grants (31.25 percent) and salaries (27.34 percent).
Considering that respondents earning grants had little income, they were willing to increase
their income by undertaking other ventures. Similarly, those working and earning salaries
wanted to spread risks by producing biofuels with the hope of improving their financial status.

85
Respondents earning income from agriculture however were much willing to adopt biofuels
crops due to the risks associated with new crops.
Figure 5.7: Sources of Income and willingness to adopt
5.3.8 Income received from farming and willingness to adopt biofuels
A closer analysis of household income received from agriculture highlighted that 47 percent of
respondents were earning less than R2000/month from agriculture, 16 percent received R2000-
4000/month from agricultural produce, 37.5 percent received more than R4000/month, and 5
percent benefited nothing from agriculture. Normally households consume their produce and
sell when they produce a surplus. It is therefore necessary to understand how households try to
diversify their income in trying to survive. Furthermore, realising how much income is

86
generated from agriculture helps in identifying the number of respondents who are likely to
adopt biofuel crops for production. Households receiving substantial income from agriculture
may be motivated to increase that income and households getting little may turn around their
fortunes and earn more through biofuels production. The income level earned from agriculture
is shown in Figure 5.8 .
Figure 5.8: Income received from farming and willingness to adopt
5.3.9 Occupation and willingness to adopt biofuels
It is also not surprising that half of respondents practising farming as an occupation were not
willing to consider adopting biofuel crops because of a lack of knowledge and other reasons.
However, the unemployed constituted 40.3 percent of respondents willing to adopt biofuel
crops. This was expected considering that they were not employed and anything that would
give them income would be accepted. Moreover, the employed had 23.6 percent respondents
willing to adopt. This meant that the issue of spreading risk was in consideration. The lowest
percentage of those willing to adopt biofuels was from farmers. The farmers said that biofuels

87
crops needed more land than they had; hence, there was no need to adopt. Figure 5.9 shows the
results.
Figure 5.9: Occupation and willingness to adopt
5.4 Land Use
The study examined the patterns of land ownership and use in both municipalities under study.
Further, the study assessed how much arable land was available to farmers and how much was
utilised during the previous seasons.
5.4.1. Arable land and willingness to adopt biofuels
The respondents were asked a question on available land for agricultural activities. Figure 5.10
displays arable land available for farming.
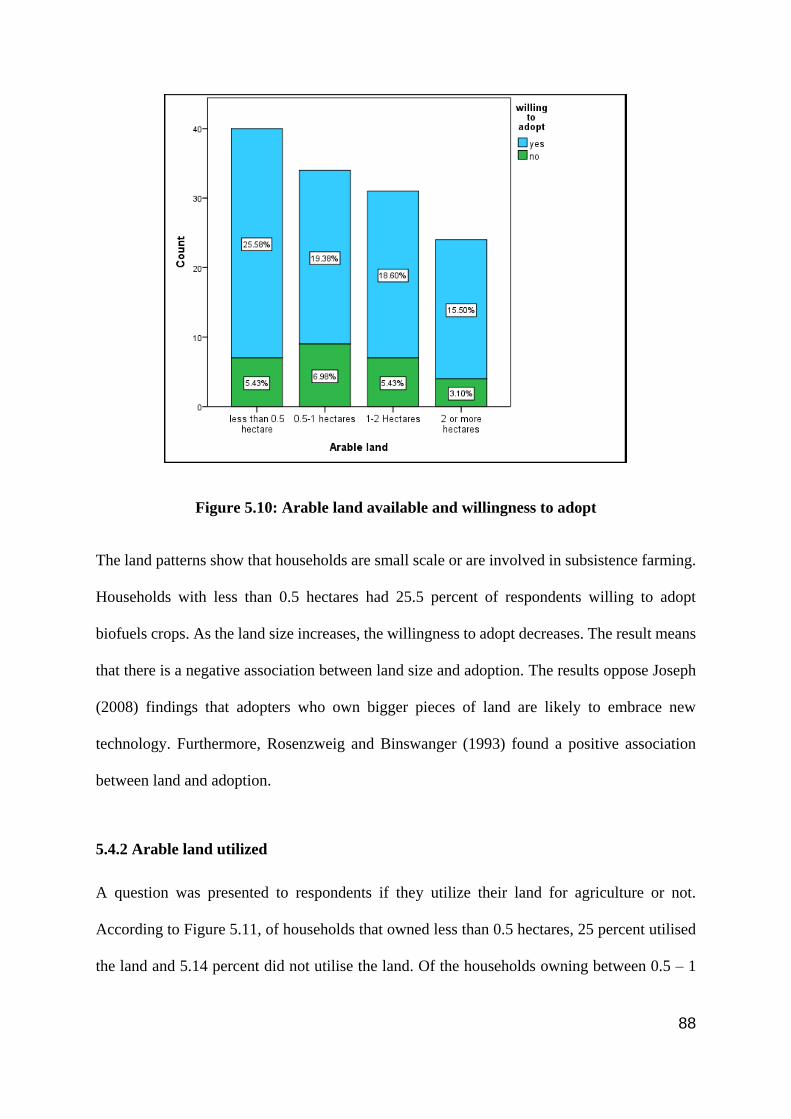
88
Figure 5.10: Arable land available and willingness to adopt
The land patterns show that households are small scale or are involved in subsistence farming.
Households with less than 0.5 hectares had 25.5 percent of respondents willing to adopt
biofuels crops. As the land size increases, the willingness to adopt decreases. The result means
that there is a negative association between land size and adoption. The results oppose Joseph
(2008) findings that adopters who own bigger pieces of land are likely to embrace new
technology. Furthermore, Rosenzweig and Binswanger (1993) found a positive association
between land and adoption.
5.4.2 Arable land utilized
A question was presented to respondents if they utilize their land for agriculture or not.
According to Figure 5.11, of households that owned less than 0.5 hectares, 25 percent utilised
the land and 5.14 percent did not utilise the land. Of the households owning between 0.5 – 1

89
hectares, 17.83 percent were utilizing their land and 8.53 percent were not. This was quite
shocking considering that one would expect a farmer with a lot of land would be making use
of it. However, it was quite understandable considering that a number of respondents were
complaining of lack of support from government institutions and failure to get the required
inputs.
At least 18 percent of households owning 1-2 hectares were utilizing their land and 5.43 percent
were not. Some of the respondents who were not utilizing their land stated that the land was
now treated as grazing plots for their animals. Some earned income by charging other farmers
to put their animals for grazing in those plots. It was further noted that 17.83 percent of
households owning over 2 hectares were utilising the land for agricultural purposes and 0.78
percent of respondents were not utilising the land. The number of respondents non-utilising the
land was greatly reduced. This was contributed partly by the fact that some respondents were
renting their larger farms, hence, they needed to pay rent regardless of the circumstances. For
them the best option was to use the land and try getting something from it.
.

90
Figure 5.11: Arable land utilized
5.4.3 Land utilised last season
In order to understand the problems that usually face farmers in agriculture, an understanding
of how much land was utilised last season was important. Another question was posed to
farmers to clarify how much land was utilised for farming during the previous season. A total
of 51.9 percent of households utilised less than 0.5 hectares, 10.58 per cent utilised over 0.6 -
1 hectares, 21.52 per cent utilised 1.1-2 hectares and the number of respondents who utilised
more than 2 hectares was 16.35 percent. The percentages for land utilisation were expressed as
a percentage for their household land holdings. The findings indicate that there was a decline
in land use for people who owned over 1 hectare and less than 2 hectares. In contrast,
households that utilised less than 0.5 hectare increased to over 50 per cent. Respondents
highlighted that seeds and fertiliser were the challenges that caused decline in land use from
the previous season. This is shown in Figure 5.12.
Figure 5.12: Arable land utilized last season

91
5.4.4 Land tenure
In order to understand how land tenure can influence adoption, Figure 5.13 shows potential
adopters according to the land tenure system. A total of 63.67 per cent respondents who
inherited land were willing to adopt biofuel crops. Property rights to the land might have
influenced this. Respondents who had state land were willing to adopt as well. However, half
of the respondents who were renting land were not willing to adopt based on the insecurity of
the land and ownership, since they cannot amend the land without approval from the property
owner. Land ownership therefore has an influence on those willing to adopt.
Figure 5.13: Land Tenure

92
5.4.5 Agricultural production
In order to understand factors that would influence the adoption of biofuel crops, respondents
were given a question on their production in agriculture. Figure 5.14 shows crops that were
cultivated by the respondents in the survey areas. Consequently, it was discovered that 56.86
percent produced maize for consumption, 22.55 percent produced potatoes for consumption,
12.75 percent produced cabbages, and the rest produced peas, spinach, onions or other crops.
This implies that the maize was the only biofuel crop produced by most respondents and it
was for consumption.
Figure 5.14: Crops produced for consumption
Figure 5.14 above shows that 66.67 respondents produced other crops for sale. These crops
included carrots, beetroot, pepper, pumpkins to name a few. However, respondents producing
maize were the highest likely adopters of biofuels crops with 48.15 percent of maize producers
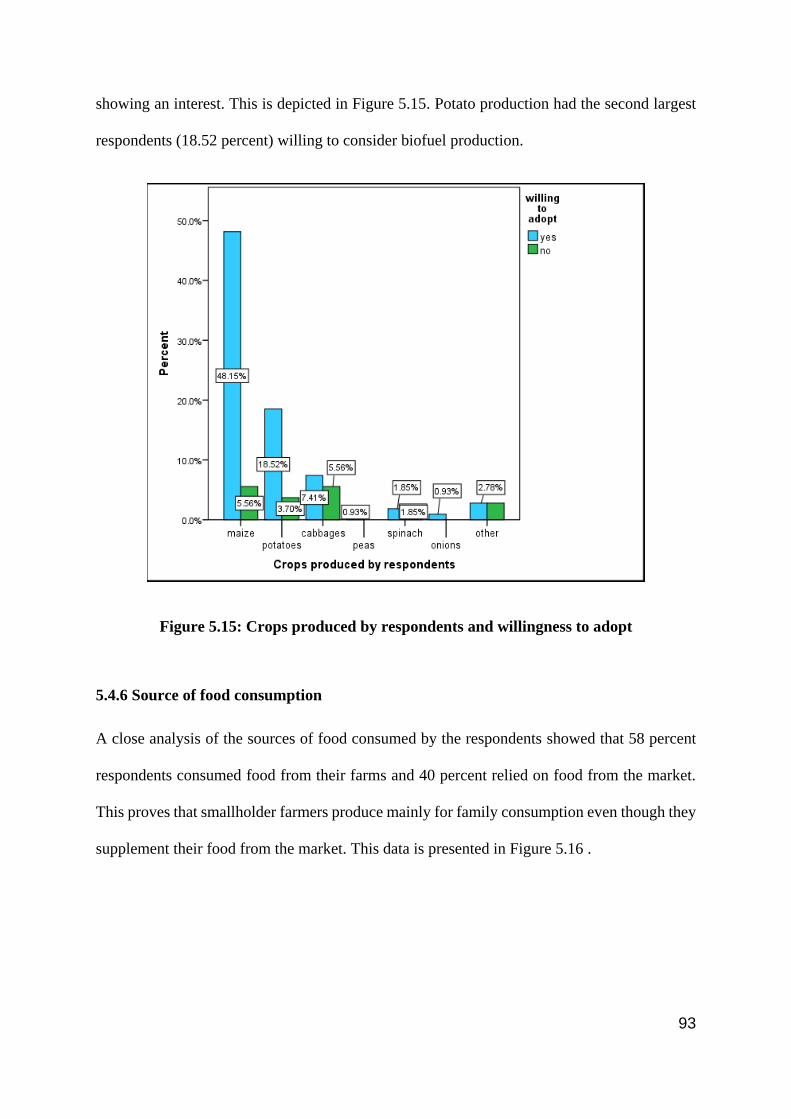
93
showing an interest. This is depicted in Figure 5.15. Potato production had the second largest
respondents (18.52 percent) willing to consider biofuel production.
Figure 5.15: Crops produced by respondents and willingness to adopt
5.4.6 Source of food consumption
A close analysis of the sources of food consumed by the respondents showed that 58 percent
respondents consumed food from their farms and 40 percent relied on food from the market.
This proves that smallholder farmers produce mainly for family consumption even though they
supplement their food from the market. This data is presented in Figure 5.16 .

94
Figure 5.16: Sources of food consumption
5.4.7 Market Access
The distance travelled by farmers to sell their produce or buy their input has a serious bearing
on how they participate in any agricultural programme. More than 62.39 percent travelled 10
kilometres or more to buy inputs and sell their produce. At least 22 percent travelled 6-10
kilometre to reach their closest market and 15 percent travelled 5 kilometres or less. This is
depicted in Figure 5.17 . A number of farmers stated that distance increases their cost so they
were forced to sell their produce locally, and in certain instances, they did barter trade to have
access to other products they need for consumption. However, 48.62 percent respondents who
were over 10 kilometres away from the market were willing to consider adopting biofuels for
production regardless of the distance to the stores.

95
Figure 5.17: Distance to market and willingness to adopt
5.4.8 Access to credit
The study investigated if respondents had access to credit for agricultural purposes or not.
Figure 5.18 shows that only 34.8 per cent had access to credit and the rest 65 per cent did not
have access to credit. Information obtained from the respondents shows that access to credit
is hard for most small-scale farmers since most lending houses require collateral in order to
grant loans for farming. These findings are similar to those of Machete (2004) who discovered
that in South Africa a significant number of farmers has no access to credit. Furthermore, the
results prove that although a number of agricultural credit institutions were formed, their role
is very limited or the procedures of obtaining financing through those institutions are not spelt
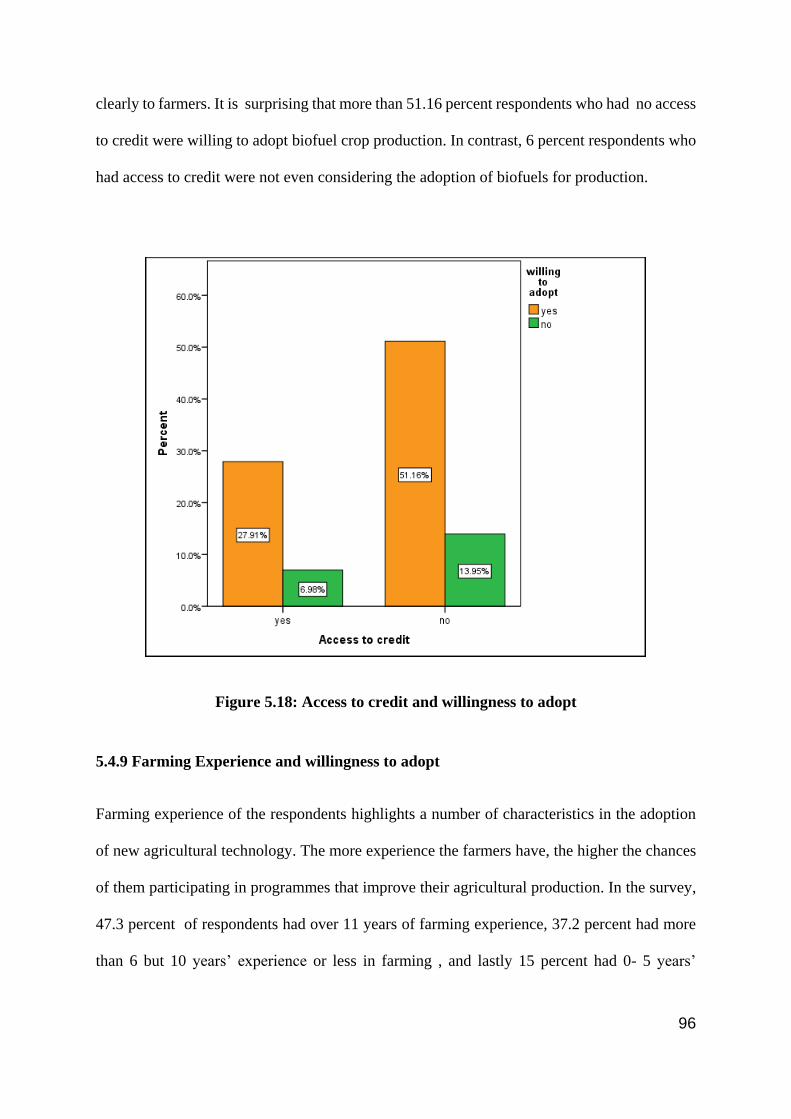
96
clearly to farmers. It is surprising that more than 51.16 percent respondents who had no access
to credit were willing to adopt biofuel crop production. In contrast, 6 percent respondents who
had access to credit were not even considering the adoption of biofuels for production.
Figure 5.18: Access to credit and willingness to adopt
5.4.9 Farming Experience and willingness to adopt
Farming experience of the respondents highlights a number of characteristics in the adoption
of new agricultural technology. The more experience the farmers have, the higher the chances
of them participating in programmes that improve their agricultural production. In the survey,
47.3 percent of respondents had over 11 years of farming experience, 37.2 percent had more
than 6 but 10 years’ experience or less in farming , and lastly 15 percent had 0- 5 years’

97
experience. The results tally with the ages of the respondents since most of the respondents
were over the age of 15-34 . It was observed that as farmers’ experience increases in years, so
does the pace of adoption. The most likely adopters were farmers with over 11 years experience
in agriculture. These results are presented graphically in Figure 5.19.
Figure 5.19: Farm experience and willingness to adopt
5.4.10 Labour and willingness to adopt
Labour is recognised as one of the most significant factors in smallholder farming, considering
that most families cannot hire labour. In Figure 5.20 results are presented on sources of labour
from the respondents. Of all respondents, 78 per cent relied on family labour for farming and
20 percent hired labour from the community. Mushunje (2001) notes that labour input largely
substitutes for capital input in smallholder agriculture. This is especially true in the Eastern
Cape where most people rely on social grants for their upkeep as shown in previous sections.
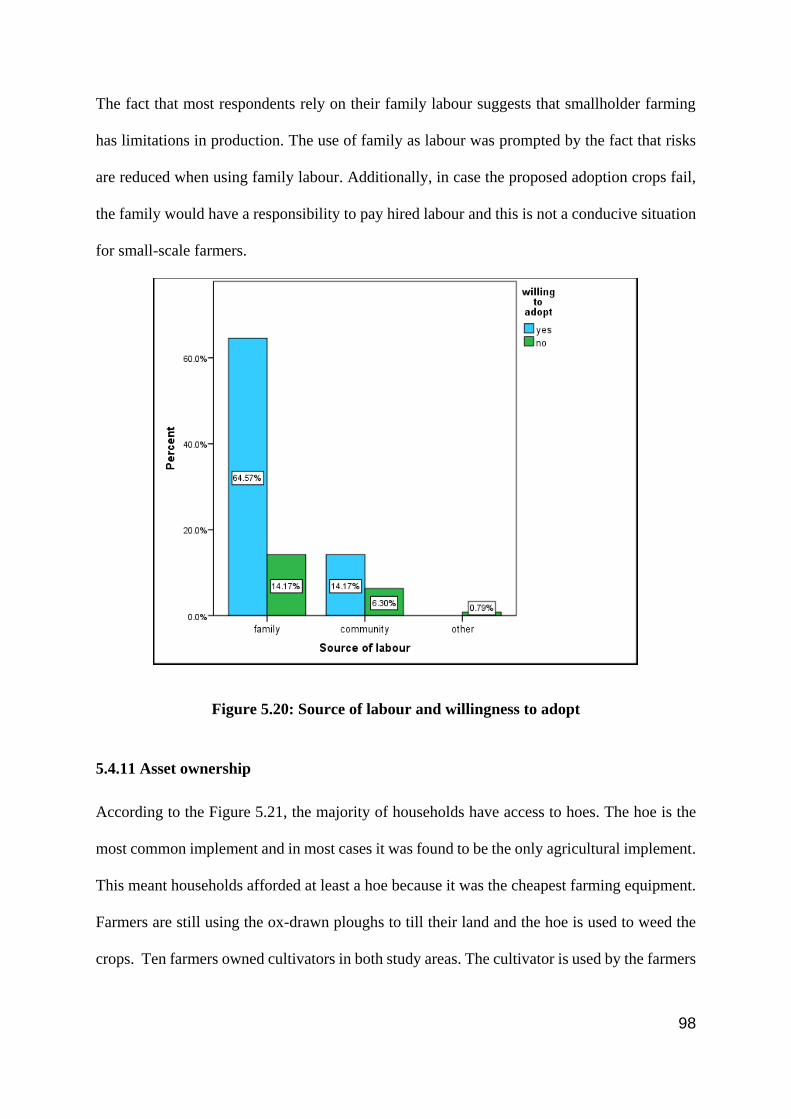
98
The fact that most respondents rely on their family labour suggests that smallholder farming
has limitations in production. The use of family as labour was prompted by the fact that risks
are reduced when using family labour. Additionally, in case the proposed adoption crops fail,
the family would have a responsibility to pay hired labour and this is not a conducive situation
for small-scale farmers.
Figure 5.20: Source of labour and willingness to adopt
5.4.11 Asset ownership
According to the Figure 5.21, the majority of households have access to hoes. The hoe is the
most common implement and in most cases it was found to be the only agricultural implement.
This meant households afforded at least a hoe because it was the cheapest farming equipment.
Farmers are still using the ox-drawn ploughs to till their land and the hoe is used to weed the
crops. Ten farmers owned cultivators in both study areas. The cultivator is used by the farmers

99
to cultivate land for farming. There were a few farmers who had access to irrigation systems.
This was mainly attributed to the high costs needed in acquiring the systems. Hence, those who
owned an irrigation system would lease or rent it to other farmers. It was further noted that a
number of farmers did not have farming equipment, and they borrow during the farming
season. This situation contributed to certain households failing to utilize their land last season.
Therefore, it can be seen from the responses that if the biofuels industry is set to be a success,
farming equipment should Donated to farmers since a number of them cannot afford it.
Figure 5.21: Farming equipment
5.4.12 Membership in associations and willingness to adopt
Respondents who were members of an association had the largest percentage (45.75 percent)
of potential adopters compared to those who were not (33.33 percent). These findings are

100
similar to Adegbola and Adekambi’s (2008) findings which point that being a member to a
farmers' association promotes access to information through other members, thus helping in
adoption of new technology. Figure 5.22 presents the findings in percentages.
Figure 5.22: Membership in association and willingness to adopt
5.4.13 Contact with extension and willingness to adopt
Extension officers offer extension services to farmers. Therefore, any contact with extension
officers is believed to have an influence in helping farmers adopt certain technology or let alone
offer farmers information on innovations. Adesina and Forson (1995) noted that an extension
service was one of the most authoritative sources available to farmers. Furthermore, it was
hypothesised as having a positive relation to adoption of new technologies by exposing farmers
to new information or innovations. A total of 41.86 percent respondents who obtained
extension services were willing to adopt biofuels compared to the 37.82 percent who were not

101
visiting extension. There were no significant differences between those with access to
extension offices and those with no access with regards to their potential to adopt biofuels. The
farmers' responses are shown in Figure 5.23 .
Figure 5.23: Contact to extension and willingness
5.4.14 Type of information received from extension services
Information is vital to any farmer. It can help smallholder farmers to increase their productivity
or it can destroy them. In the study, it was found that more than 28 percent of respondents
received information on soil preparation and fertiliser application, 12 percent received
information on marketing, 10 percent received information on seeds and 9 percent on crop
rotation. Respondents pointed out challenges with information received from extension
officers. They stated that most of the information is not tailor made to suit certain areas,
considering that physical characteristics of certain areas differ. The claim was that most

102
extension officers offer the same information each year to different farmers, which does not
help them in improving their productivity. Figure presents the results in Figure 5.24 .
Figure 5.24: Type of information received from extension
5.4.15 Sources of information
Information acquisition is of prime importance to any farmer. It regulates the marketing output
for the farmer. The results from the study reveal that 77 percent respondents received
information through cell phones. The information was from social networks (Facebook,
WhatsApp etc.) or general conversation with family members and friends. A total of 9 percent
of respondents asked around to gather information on agricultural production and 3 percent got
information through radio/television. It was shocking to note that only 3.95 percent of
respondents sourced their information through extension services. When asked about why they
do not rely on extension services, the respondents said that most extension officers do not have

103
up to date information on a number of agricultural activities except general information on land
preparation and fertilisers. This gap in information dissemination may prove to be a challenge
in reaching out smallholder farmers targeted for the biofuel industry. The responses are shown
in Figure 5.25 below.
Figure 5.25: Communication Media
5.5 Awareness and adoption of biofuels
In order to understand why few farmers have not yet adopted biofuels for production, it was
necessary to identify their awareness levels with regard to biofuels. A question was posed if
they were aware of biofuel crops. A total of 51.94 percent of the respondents confirmed their
awareness.
5.5.1 Biofuels known by respondents
Table 5.3 shows that most respondents knew sugarcane and soya bean. Overall, 64.3 percent
of the respondents knew sugarcane as a biofuel crop. This is because many respondents were

104
aware that ethanol is extracted from sugarcane. A total of 36.3 percent of respondents knew
soya bean as a crop used for biofuels. In trying to understand how they knew of the crop, it was
discovered that many respondents were aware that soya bean is used for biofuels through media
channels like the television and radio.
Table 5.3 Biofuel crops known by respondents
Crops Grown Percent
(N=129)
Sugarcane
Canola
Sunflower
Sorghum
Wheat
Soyabean
Groundnuts
Maize
64.3
19.3
10.8
18.5
7.4
36.3
7.4
3.4
At least 18 percent respondents knew that sorghum can be used as biofuel crop although they
usually used it for traditional brewing. It was surprising that only 3 percent of respondents
knew that maize can be used as a biofuel crop. This was unexpected considering that the
government has been emphasizing that maize not used for biofuels. Furthermore, this finding
meant that the government was assuming that farmers knew that maize can be used for biofuels
production, yet, the facts on ground point otherwise.
5.5.2 Willingness to adopt biofuel crops
In order to understand the challenges that may bear on the biofuel industry, responses of
whether non-producing and producing farmers were willing replace the crops there are
currently farming and adopt biofuels in their farming system were recorded. Figure 5.26 shows
that 79.07 percent of the respondents stated that they were willing to adopt biofuel crops for

105
farming and replace crops they are currently farming. In contrast, 20.93 percent stated that they
are not willing to be part of the biofuel industry if there are to replace their current crops. The
findings reveal that farmers maybe quick to embrace new technology that they believe would
improve their productivity and income. However, as rational beings they can only do so after
assessing the risks involved in managing biofuel crops production.
Figure 5.26: Willingness to adopt biofuel crops
5.5.3 Willingness to adopt with incentives
Respondents were given a question based on their willingness to adopt biofuel crops if given
incentives in the form of government subsidies or price support for production of biofuels,
inputs for biofuels production and access to markets. The percentage of farmers who were
willing to adopt biofuels dropped from 79 percent to 65.12 percent and those not willing to
adopt increased from 20 percent to 34.88 percent. The results in Figure 5.27 suggest that
farmers may not be attracted to adopt biofuel crops depending on the type of incentives offered.
The main problem identified by most farmers was that if they were offered government
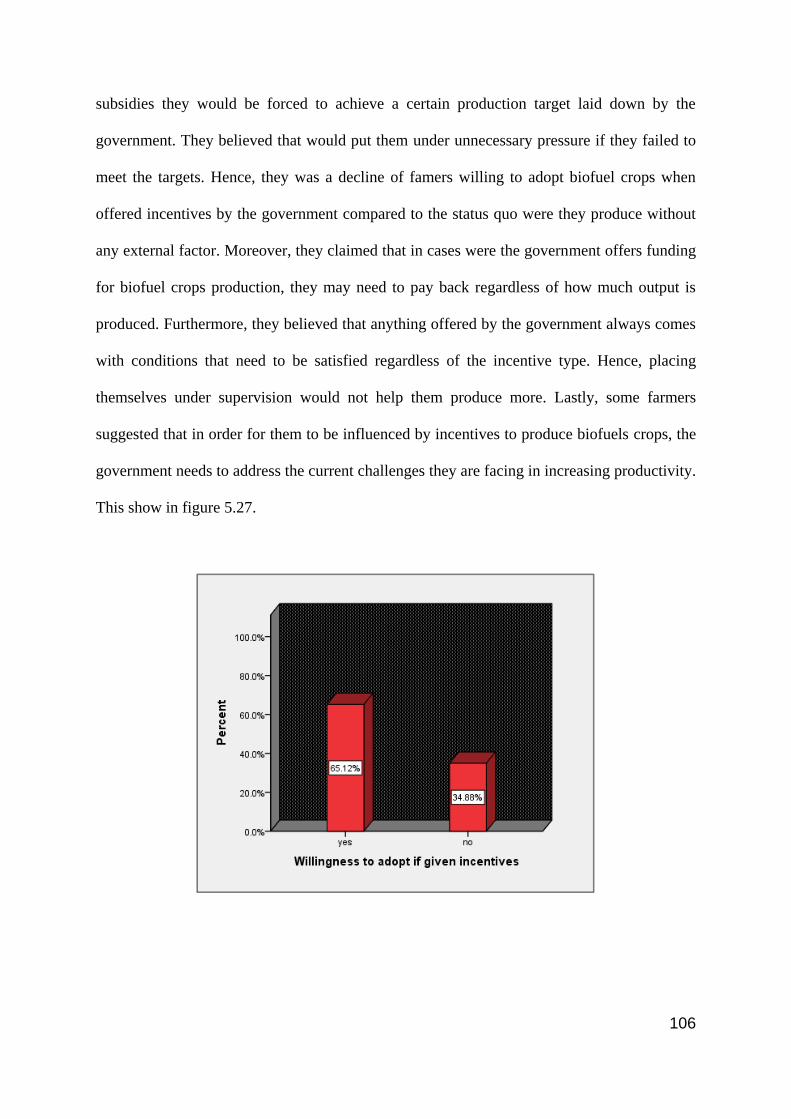
106
subsidies they would be forced to achieve a certain production target laid down by the
government. They believed that would put them under unnecessary pressure if they failed to
meet the targets. Hence, they was a decline of famers willing to adopt biofuel crops when
offered incentives by the government compared to the status quo were they produce without
any external factor. Moreover, they claimed that in cases were the government offers funding
for biofuel crops production, they may need to pay back regardless of how much output is
produced. Furthermore, they believed that anything offered by the government always comes
with conditions that need to be satisfied regardless of the incentive type. Hence, placing
themselves under supervision would not help them produce more. Lastly, some farmers
suggested that in order for them to be influenced by incentives to produce biofuels crops, the
government needs to address the current challenges they are facing in increasing productivity.
This show in figure 5.27.
107
Figure 5.27: Willingness to adopt biofuels if given incentives
5.5.4 Awareness to Biofuels crops
To understand how respondents perceive the biofuel industry, a number of questions structured
in a Likert scale were posed. The scale had strongly disagree as the most negative response
and strongly agrees as the most positive response. Table 5.4 shows the responses to the
questions that were posed on biofuels awareness.

108
Table 5.4 Biofuels awareness questions
Figures in the table are in percentages.
Questions posed to respondents Strong
Disagree
Disagree Neutral Agree Strongly Agree
The biofuels market is sustainable for small-scale farmers. 0.78 3.10 32.56 41.86 21.71
Participating in biofuel production would increase my farming output. 7.75 1.55 31.01 56.59 3.10
I have knowledge of the proposed crops for biofuel production by the Department of
Energy.
32.56 3.10 15.50 46.51 2.33
Biofuels will create employment opportunities for small-scale farmers. 1.55 3.88 37.21 44.96 12.40
Biofuel production will increase productivity for small-scale farmers. 0 2.33 40.31 51.16 6.20
Producing biofuel crop will help small-scale farmers to access markets. 0 0 24.3 52.71 23.25
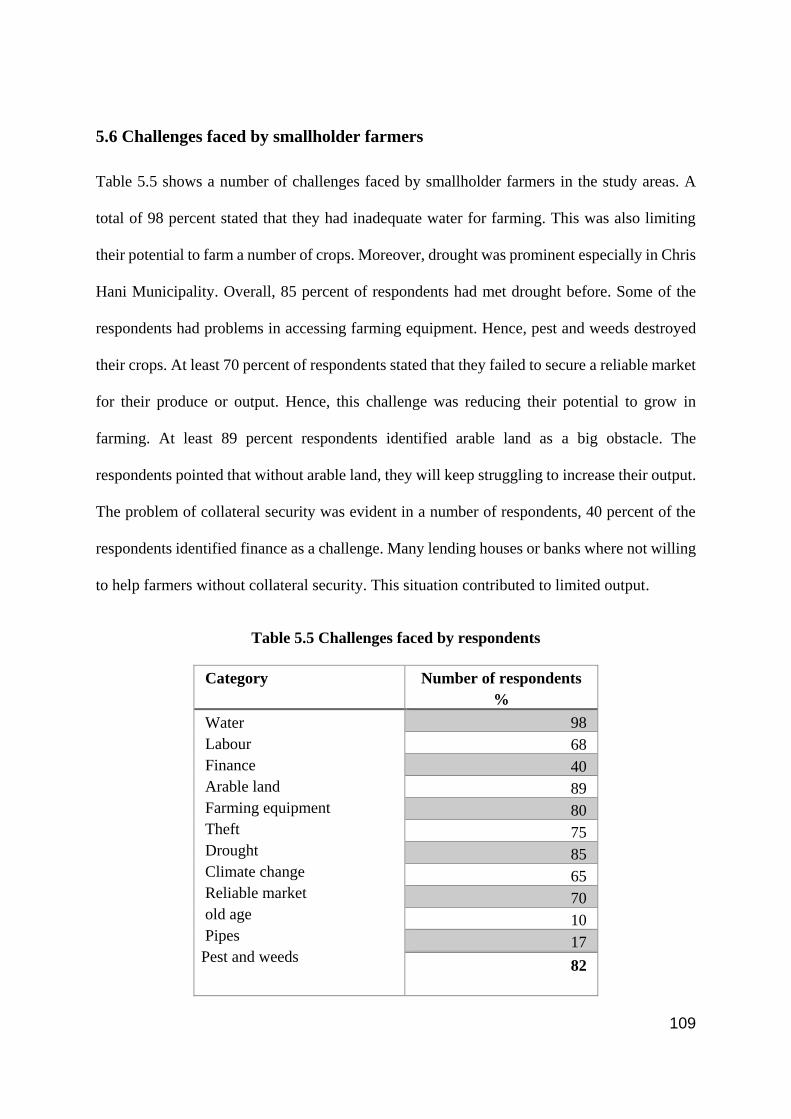
109
5.6 Challenges faced by smallholder farmers
Table 5.5 shows a number of challenges faced by smallholder farmers in the study areas. A
total of 98 percent stated that they had inadequate water for farming. This was also limiting
their potential to farm a number of crops. Moreover, drought was prominent especially in Chris
Hani Municipality. Overall, 85 percent of respondents had met drought before. Some of the
respondents had problems in accessing farming equipment. Hence, pest and weeds destroyed
their crops. At least 70 percent of respondents stated that they failed to secure a reliable market
for their produce or output. Hence, this challenge was reducing their potential to grow in
farming. At least 89 percent respondents identified arable land as a big obstacle. The
respondents pointed that without arable land, they will keep struggling to increase their output.
The problem of collateral security was evident in a number of respondents, 40 percent of the
respondents identified finance as a challenge. Many lending houses or banks where not willing
to help farmers without collateral security. This situation contributed to limited output.
Table 5.5 Challenges faced by respondents
Category Number of respondents
%
Water
Labour
Finance
Arable land
Farming equipment
Theft
Drought
Climate change
Reliable market
old age
Pipes
Pest and weeds
98
68
40
89
80
75
85
65
70
10
17
82
110
Reliable market and drought has been a obstacle to farmers for some time. Farmers stated that
the distance they travelled to sell their produce was great and this affected their profits.
Smallholder farmers usually struggle to access markets as compared to commercial farmers.
Consequently, they stated that usually they sell the produce locally, in many cases through
barter trade. Few farmers identified irrigation pipe shortages as a big problem, especially those
staying close to water body sources. The problem they encounter most was fetching water for
their farms. They stated that it was a costly exercise and tiresome because it requires a good
deal of labour which is always scarce if not expensive.
5.7 Incentives for the adoption of biofuel crops
Farmers identified a number of incentives that they think would improve the adoption pace of
biofuel crop production. Table 5.6 illustrates that a total of 93 percent of farmers identified
knowledge as a key factor in adoption of biofuel crops. They stated that small scale farmers do
not know biofuel crops; hence, one cannot adopt something that he/she does not know. A
number of farmers sought more knowledge on a proper description of biofuel crops. Eighty
seven (87) percent stated that if given equipment they would adopt biofuel crops. A number of
farmers who borrow equipment for agriculture highlighted this. A total of 45 percent farmers
identified arable land as the key to adoption of biofuel crops, because the current farmlands
were not arable enough. Therefore, an incentive that would increase their land capacity or
fertility would be welcome.

111
Table 5.6 Incentives identified by respondents
Category Number of Respondents
%
Equipment
Stable market
Arable land
Sponsor
Labour
None
Knowledge
Finance
87
63
45
67
50
5
93
73
About 67 percent stated that if they get someone to sponsor them, they would be more than
willing to adopt the biofuel crops. They identified lack of resources as a serious obstacle
affecting them in securing seeds and pesticides; therefore, any sponsorship would be welcome.
At least 63 percent wanted a stable market for their produce in order to adopt biofuels. The
grounds were that if the market was unstable, they run the risk of losing more since they are
not sure how the crops will perform. At least 5 percent farmers wanted no incentive to adopt
biofuel crops. Lastly, 50 percent identified labour as a motivator. The motion was that if they
got labour, they might use the underutilised land to produce biofuel crops.
5.8 Conclusion
It can be concluded from descriptive statistics that smallholder farmers who were surveyed are
generally old and rely on pensioners’ grants. Moreover, it was observed that a number of
respondents are unemployed. In addition, many farmers were underutilising their land due to a
number of challenges such as water shortage, theft, lack of equipment and funding and these
have led to a decline in productivity. Lastly, most farmers were aware of biofuel crops and they

112
were willing to adopt biofuel crops for production if there is enough information. The next
chapter presents the empirical model results.
113
CHAPTER 6
EMPIRICAL RESULTS AND DISCUSIONS
6.0 Introduction
A Heckman two-step model was used to examine demographic, socio-economic, farm specific and
biofuel factors that influence the adoption of biofuel crops. Heteroscedasticity tests were conducted
because in logistic regression heteroscedasticity can produce biased and misleading parameter
estimates. Eight of the variables were identified to be statistically significant given their low p value
that was less than 0.05. These include arable land, incentives to participate, challenges, labour
source, gender, qualification and membership in association.
6.1 Heterescedasticity tests
In order to calculate the regression model, a heterescedatisticity test was conducted. The results
from the White test showed that the Probability of the Chi-Square was well above the 0.05
significant levels and we accepted the null hypothesis that state that the variables are
homoskedastic. This means that the error term is homoscedastic and we should not adjust any
standard errors (Greene, 2012). The results are shown in Table 6.1 .

114
Table 6.1 Heterescedasticity
Heteroskedasticity Test: White
F-statistic
Obs*R-squared
Scaled explained SS
1.336567
68.94596
61.55970
Prob. F(61,45)
Prob. Chi-Square(61)
Prob. Chi-Square(61)
0.1549
0.2266
0.4559
6.2 Model Fit
Table 6.2 shows that the model fit had the following specification: the estimated variance of
residuals was at 0.27 with the Sum of Squared residuals at 6.945. Log likelihood was at -40.70
reporting the log likelihood of coefficients estimates assuming that there are normally distributed.
The standard deviation of dependent variables was 0.427. The Akaik, Schwarz and Hannan-Quinn
criterion all showed lower information criterion values for the Heckman two step model, suggesting
that the model is robust and can measure what it intends to measure. Lower values especially on
the Akaik info criterion are preferred (Greene, 2012). Furthermore, the Schwarz criterion that
imposes a penalty for additional variables was at 1.167.

115
Table 6.2 Heckman two-step model
Dependent Variable: ADOPT
Method: Heckman Selection
Sample: 1 129
Selection Variable: AWAREBIO
Estimation method: Heckman two-step
Variable Coefficient Std. Error t-Statistic Prob.
Selection Equation
C
AGE
GENDER
QUALIFICA
MEMBERASS
CONTACTEXT
FARMEXPERI
FARMEQUIP
OCCUPATION
-0.418891
-0.070168
0.858991
-1.393838
0.935929
0.340332
0.382349
0.122361
0.327695
1.433957
0.265638
0.380165
0.256512
0.333940
0.372853
0.209052
0.084102
0.216156
-0.292122
-0.264149
2.259521
-5.433810
2.802688
0.912778
1.828970
1.454915
1.516010
0.7709
0.7923
0.0262**
0.0000***
0.0062***
0.3638
0.0707*
0.1491
0.1330
Outcome Equation
C
HHS
HINCOME
ARABLE
INCENTIVESPART
CHALLEN
UTILISELAND
BORROWMONEY
LABSOURCE
LANDACQUIRE
DISTANCE
0.308152
0.081327
0.013285
0.134692
0.342467
0.027538
0.092340
-0.094266
0.382582
-0.074320
-0.081809
0.628281
0.043241
0.057942
0.054412
0.131541
0.014278
0.298934
0.111505
0.114837
0.094449
0.064931
0.490469
1.880771
0.229273
2.475421
2.603505
1.928683
0.308899
-0.845396
3.331514
-0.786875
-1.259933
0.6250
0.0632*
0.8192
0.0152***
0.0108***
0.0569*
0.7581
0.4001
0.0012***
0.4334
0.2109
Mean dependent var 0.234043 S.D. dependent var 0.427976
S.E. of regression 0.276261 Akaike info criterion 1.117695
Sum squared resid 6.945156 Schwarz criterion 1.669735
Log likelihood -40.70862 Hannan-Quinn criter. 1.341737
Values marked with an asterisk *** represent significant at 1 percent, and the values
marked ** represent significant at 5 percent level and values marked * represent
significant at 10 percent level.
6.2.1 Selection Equation
The selection equation was composed of the following variables; age, gender qualification,
membership in association, contact with extension, farm equipment, farm experience and

116
occupation. It was discovered that gender, qualification, contact with the extension and knowledge
of biofuels were statistically significant.
Gender – the results suggest a positive and significant relationship between awareness of biofuel
crops and gender of household (coefficient: 0.858991). The positive association of the coefficient
meant that there was an increase in awareness to biofuel crops on females holding other things
constant. Asfaw and Admassie (2004) noted that male-headed households tend to receive
information more quickly about new technologies in agriculture as compared to female-headed
households. Similarly, Diagne (2010) recorded a negative correlation between female and
awareness of parboiled rice in Guinea.
Qualification or high level of education had a negative association with awareness of biofuels (co
efficient: -1.393838). Education is believed to have an influence on agriculture production. This is
quite true as educated people are usually associated with access to information on agricultural
technology (Norris & Batie, 1987). Surveys conducted by Oyedele and Yahaya, (2009); Owuba, et
al. (2001) identified that a high level of education contributes to the degree of agricultural
productivity of the households. Hence, this improves awareness of farmers to innovations or new
technology. The findings of this study contradict those of Daberkow & McBride (2003) who
discovered that higher education level increased the likelihood of awareness in precision agriculture
technologies. Although education has been highlighted in numerous studies as significant in
adoption of technology, literature has been inconclusive on its effect on awareness of biofuel crops
production.
Membership to association – membership and frequent participation in activities in line with
agriculture has a positive (coefficient: 0.935929) influence on awareness of agricultural technology.
As expected, participation or belonging to an agriculture society had an influence in the awareness

117
of people of biofuel crops. This suggests that the more the individual attends or participates in an
association, the higher the chances of the individual receiving the information that would influence
his/her decision to adopt biofuel crops. A study conducted by Dandedjrohoun et al. (2012) recorded
a positive association between membership in an association and awareness of new technology. The
findings state that being involved in associations helps in the sharing of information through
informal and formal discussions, which increases the level awareness.
Farm experience - the variable was hypothesised as having an influence in the awareness of biofuel
crops. It was expected that most farmers with a number of years of experience in farming are likely
to be aware of new technology or seed varieties due to well-established communication networks.
The coefficient was positive (0.382349) and statistically significant at 0.10 percent level. The
positive relationship between awareness and farm experience means that the more experience a
farmer has, the higher the chances of being aware of biofuel crops.
6.2.2 Outcome Model
The second stage of the equation was to analyse the extent of potential adoption of the biofuels.
The inverse Mills Ratio from the selection equation was then added to the outcome model to capture
the selection bias effect.
Arable- this variable measures arable land size utilized during the last farming season. Farmers
who utilized arable land are likely adopt new technology or crops in agriculture. This is influenced
by the fact that they expect to earn higher profits if they adopt new technology or crops. The variable
was found to be statistically significant (coefficient: 0.134692) in influencing adoption of biofuel
crops. Ogada, Mwabu and Muchai (2014) noted that the size of land cultivated by the household
was positively correlated with adoption of new technology. Furthermore, an increase of a

118
household’s cultivated land area by one acre, on average, increased the probability of adoption of
inorganic fertilizer and improved maize varieties by five per cent. Contrary, Dereje (2006) posited
that farmers owning large amounts of arable land are in a better position to adopt new technology,
compared to farmers who own small arable land because they face difficulties.
Incentives - this variable exhibited a positive relationship (coefficient: 0.342467) with adoption
and was statistical significant. It should be noted that for incentives to improve the potential
adoption rate of smallholder farmers, they should be in line with their expectations. In the survey,
smallholder farmers were asked if they would adopt biofuel crops if they were offered price support,
subsidized input and funding by the government. Many were sceptically and they claimed that the
government would need payment regardless of the output they get. In which case, this would put
pressure on them to increase output yet they will be starting to farm biofuel crops. However, it is
particularly true that incentives may influence farmers in adopting new agriculture technology or
crops. The chances of an individual adopting a certain technology without motivation are lower as
long as they are risks involved in such adoption. It can be concluded that farmers are risk averse
people and usually behave rationally. This means that given a choice to transfer the risks to
someone, they will do so. In this case incentives would act as insurance for the risk they face in
adopting new crops.
Challenges - this variable captures factors that hinder adoption to farmers. It has a positive and a
significant coefficient of 0.027538. Farmers facing a number of challenges may be motivated to
adopt biofuel crops in anticipation of improved productivity. This may depend on the challenges
faced by the farmers. Although challenges may have an influence on farmers’ potential to adopt
biofuel crops, it has not been documented in literature. Therefore, it can be assumed that farmers
who are facing challenges such as, little rainfall maybe motivated to adopt biofuel crops that can
119
survive in semi-arid regions and at the same time improving their soil fertility. Yet, on the other
hand, farmers struggling with farming equipment may not be interested in trying new crops varieties
because of insecurity or fear of the unknown.
Labour source - the coefficient (0.382582) of labour is positive and significant. This means that a
unit increase in labour we can expect an increase in the propensity to adopt biofuels crops. Farmers
who obtain labour from the community incur more costs than the ones who utilise family labour. It
can be noted that from the challenges faced by farmers and incentives wanted in order to adopt
biofuels, labour is a critical part of any adoption.
Household size - the coefficient for this variable was positive (0.081327) and statistically
significant at 0.10 level. This coefficient means that for every unit increase in household size
holding everything constant, chances of adoption are increased. A larger household may be
expected to be interested in any venture or opportunity that would secure their livelihoods. As such,
the higher the number of members of a household, the easier it may be to adopt biofuel crops. From
the survey results, a number of households with a number of family members are struggling
financially. Therefore, one-way of improving their household income maybe to produce biofuel
crops and sell them.
6.3 Conclusion
This chapter provided empirical evidence on factors affecting or influencing the potential adoption
of biofuel crops by smallholder farmers in selected areas in the Eastern Cape Province. The results
on the selection equation pointed out that the variables: age, gender, qualification, membership in
association and farm experience were statistically significant in influencing farmers’ awareness to

120
biofuel crops. Yet, the outcome model the variables arable, incentives, challenges, household size,
and labour source were statistically significant.

121
CHAPTER 7
CONCLUSION AND RECOMMENDATIONS
7.0 Introduction
The main aim of the study was to identify factors affecting/influencing the potential adoption of
biofuel crops by smallholder farmers in selected areas in the Eastern Cape Province. Specific
objectives included the following: identifying the factors that influence or affect the potential
adoption of biofuel crops; investigating if farmers are aware of biofuels crops in the Eastern Cape
and estimating determinants of farmers’ potential to adopt biofuel crops in the Eastern Cape.
A Heckman two-step model was used to determine the factors that influence adoption of biofuel
crops, and descriptive statistics were used to answer the study objectives. By identifying the factors
that influence the potential adoption of biofuel crops in selected areas in the Eastern Cape, the study
provided valuable information that would help in making the Biofuels Industrial Strategy a success
in eradication poverty to smallholder farmers and improving energy security in South Africa.
7.1 Summary
Subsistence farming has the potential of improving growth and eradicating poverty in communal
areas. However, to unlock this potential the Biofuels Industrial Strategy Policy should try to cater
for the smallholder farmers.
It can be inferred from literature that challenges facing smallholder farmers in South Africa include
lack of access to market, lack of equipment, inadequate access to credit, pest and weeds, lack of

122
seeds to name a few. These problems are practical and need effort from both the government and
people on ground.
This study was conducted in selected areas in the Chris Hani District Municipality and Oliver
Tambo District Municipality in Eastern Cape. A snowballing sampling technique was utilised in
this study and the selection of respondents was based on availability and willingness of farmers to
participate in the research. A total of 129 smallholder farmers were interviewed through face to face
interviews using a questionnaire. Xhosa speaking students assisted in data capturing because Xhosa
speaking people dominate the province. The data collected was then analysed using the SPSS 21
Software and EViews 8 software. SPPS was used to analyse descriptive statistics and Eviews was
used to regress the Heckman two-step model.
The majority of the surveyed smallholder farmers were 35-50 years of age. Most of them had
primary education and matriculation. The farmers produced a number of crops and vegetables for
consumption, and in a few instances, they sold to the market. The most dominant gender from the
study were males. Furthermore, low levels of income dominated the study areas. Most respondents
survived on government grants for the upkeep of their families and the unemployment rate was high
in the study areas. Only a few youths participated in agricultural activities.
Eight variables were statistically significant for the econometric model analysis. These are: in the
selection model- gender, qualification, contact with extension and knowledge of biofuels were
significant and in the outcome model - incentives to participate, arable land, challenges, labour were
statistical significant at 5 percent level.

123
7.2 Conclusion
Smallholder farmers face a number of constraints in accessing markets and agricultural products.
The most highlighted problems were water shortages, theft, pest and weeds, droughts to name a
few. On the other hand, knowledge, access to arable land, labour, sponsorship, finance, among
others were identified as incentives necessary in the adoption of biofuel crops. A number of
respondents also cited lack of relevant information as a hindrance to the adoption of biofuel crops.
Therefore, in order for smallholder farmers to adopt biofuels a collective effort by the government
and the targeted beneficiaries is the key to the success of the biofuels strategy. Moreover, lack of
knowledge from the targeted beneficiaries would further delay the achievements of the strategy
even if it is redrafted. Hence, knowledge dissemination is seen as a key incentive to the success of
the strategy.
7.3 Policy Recommendations
In order to achieve the targets of the Biofuel Industrial Strategy Policy, the government can help
smallholder farmers by reducing the challenges faced, such as, lack of farming input like seeds. The
government can gives incentives like farming inputs subsidies. In addition, a number of challenges
pointed by respondents, such as, pest and weeds can be corrected by spraying the fields and
surroundings areas harbouring such pests. The study findings pointed a problem with the extension
services provided in study areas. In short, extension services should try to adapt to areas based on
the geography and other factors and avoid using a one size fits all approach as pointed out by the
respondents. This may help in educating farmers on how best they can benefit from biofuel crops
production.

124
Another challenge pointed was the lack of access to credit facilities. The government can create a
similar entity like the Land Bank that provides financial services to smallholder farmers, but with
relaxed collateral requirements to target smallholder farmers.
Apart from these suggestions, the government can try to introduce incentives to smallholder
farmers. The incentives can be in form of these:
Payment per unit production - these payments are usually referred to as deficient payment,
whereby producers receive payment direct from the government per unit of output produced.
A similar system was used in the United States to support wheat farmers (Russo, 2007).
Farmers receive a payment equal to the difference between a guarantee price and the market
price. This form of payment structure can be used to pay smallholder farmers for the difference
in guarantee price they incur. This may also help in improving output since farmers would be
safeguarded from losing income due to price changes. This type of payment would reduce the
risk factor exposed to farmers in an unpredictable market.
Payment per hectare- this is a payment system based on historical or actual number of hectares
on a farm. In this case, the amount of land occupied determines the payment received.
Therefore, smallholder farmers who own large hectares of land would be motivated to put it
into use if they are not already doing so. Moreover, this payment structure motivates
smallholder farmers who wish to grow commercially, because they may be persuaded to
acquire more land with the hope of getting more support from the government, hence, this
may improve their productivity in the long run. In the European Union, a similar system was
used to pay farmers based on the land owned and the number of animals on that land. This
system was very successful in pushing farmers to utilise land.

125
Payments per farm or farmer- this depends on how many farms a farmer owns or how many
employees work for the farmer. In situations whereby the farmer has more labourers, payment
from the government would reduce the wage costs that he/she suffers. As a result, the farmer
can now divert the extra income to productive places with the farm. Thus, increasing the inputs
needed to improve productivity. This is one way of reducing the labour payment bill for
farmers, especially those who are struggling to pay hired labour, such as, smallholder farmers.
All direct income payment have an effect on agricultural production, but the effects differ according
to the instruments used. For instance, the effect is high for deficiency payments as compared to
hectare payments. Direct income payment offers more possibilities compared to price support
because they can be differentiated. As such, they can be made conditional, for instance, in terms of
number of hectares farmed. However, price support can also lead to direct higher production, thus
leading to an increase in output in the long run. The only challenge in doing a price support scheme
is that the government will need to draft a trade policy that will lead to a decline in supply (using
import tariffs or supply quotas) and increasing demand (using export subsidies). The policy will be
necessary to stimulate the price level so that both the producers and consumers do not lose from the
price scheme.
Other recommendations to consider include:
Short-term policy recommendation
The government should engage community leaders when disseminating information to
farmers. This would make it easier for farmers to be aware of agricultural innovations.
There is an urgent need for the government to engage lending houses to relax certain
requirements for farmers to access credit facilities. lt is evident from the study that most

126
farmers struggle to access credit, .therefore, relaxing certain requirements on collateral
security may improve the number of smallholder farmers benefiting from credit arrangements.
This would in turn lead to improved output, as farmers will be able to afford inputs.
There is a need for the provision of training to farmers willing to adopt biofuel crops. Training
will help farmers in realising full potential in the production of biofuel crops and in turn
motivate others to adopt the crops proposed.
Re-evaluation of extension services is necessary to keep farmers interested in a number of
agricultural programmes offered by the government.
There is a need by the agriculture and energy departments to publish or publicise any new
information pertaining biofuel crops and these efforts should be stepped up or intensified. This
can be done by advertising through radio, television or any medium of communication that is
utilised mostly by smallholder farmers.
Medium term policy Recommendation
Identification of farmers with under-utilised land is necessary in tapping potential for
adoption of biofuel crops. The government can try to confirm the number of farmers
utilizing land through the Department of Agriculture. This will also help in planning for a
support structure that best suits farmers.
Long Term policy recommendations
Promotion of large-scale production of biofuel crops targeting every farmer with under
utilised pieces of land. This can be done by increasing direct or indirect income payments.
The payments can be linked to output or acreage. Incentivising farmers through a payment

127
structure will also motivate a number of youths who are not participating in agriculture
because they will get employment. Moreover, direct or indirect payment leads to the
redistribution of income, hence, eradicating poverty in rural areas where smallholder
farmers live.
A mid-term review of the Biofuels Strategy is necessary in measuring the targets proposed,
and necessary corrections should be implemented.
7.4 Areas of further research
Although the findings of the study indicate that smallholder farmers face many challenges, research
that can quantify the extent of challenges faced by farmers is needed. This kind of research may
reveal the untold story of a number of challenges that seem small yet they have a huge bearing on
farmers’ livelihood and adoption potential. A similar study on barriers and incentives to adoption
of biofuels crops can be done at a national level to come up with an exhaustive list of barriers and
incentives hindering the adoption of biofuel crops in South Africa. This study was done at a district
level, therefore its findings should not be generalised to the whole of South Africa in principle, even
though it may act as a guideline in making the Biofuels Industrial Strategy a success.

128
REFERENCES
Acocks, J.P.H., 1953. Veld Types of South Africa. Memoirs Botanical Survey of South Africa 28:
Department of Agriculture, Pretoria.
Adegbola, P. & Gardebroek, C., 2007. The effect of Information sources on technology adotpion
and modification decisions. Agricultural Economics, Issue 37, pp. 54-64.
Adégbola, P. & Adékambi S. A., 2008. Taux et déterminants de l’adoption des variétés améliorées
d’igname développées par l’IITA. Rapport d’étude,p. 31.
Adesina, A. & Forson, J., 1995. Farmers perception and adoption of new Agricultural
Technology: Evidence from analysis in Burkina Faso and Guinea. Agricultural Economics, Issue
13, pp. 1-10.
Amemiya, T., 1984. Tobit Models: A Survey. Journal of Econometrics, Volume 24, pp. 3-61.
Asfaw, A. & Admassie, A., 2004. The role of education on the adoption of chemical fertilizer
under different socieconomiLOc environments i Ethiopia. Agricultural Economics, 20(3), pp.
215-228.
Bandiera, O. & Rasul, I., 2002. Social networks and technology adoption in northern
Mozambique, s.l.: CEPR.
Bandiera, O. & Rasul, I., 2005. Social Networks and Technology Adoption in Northern
Mozambique. The Economic Journal, 116(514), pp. 869-902.
Bayard, B., Jolly, C. & Shannon, D., 2007. The economics of adoption and management of alley
cropping in Haiti. Journal of Enviromental Management, Volume 84, pp. 62-70.
Beale, G. & Bolen, J., 1955. How farm people accept new ideas., Iowa: s.n.
Bembridge, T.J., 1988. An evaluation of the Venda Agricultural Extension Service. Republic of
Venda.
Biofuels Industrial Strategy (BIS) of the Republic of South Africa ., 2007. Department of Minerals
and Energy.
http:// www.info.gov.za/view/DownloadFileAction?id=77830 [Accessed February 2014).
129
Byerlee, D. & De Polanco, H., 1986. Farmers stepwise adoption of technological packages:
evidence from Mexican Altiplano.. American Journal of Agricultural Economics, Issue 68, pp.
520-527.
Cassman, K. & Liska, A., 2007. Food and Fuel for all: Realistic or Foolish?. Biofuels,Bioproducts
and Biorefining, Volume 1, pp. 18-24.
Chris Hani Municipality Spatial Development Framework., 2011. Chris Hani Municipality.
Chris Hani IDP., 2013. Chris Hani District Municipality IDP 2013-14 Review.
Clark, P. & Wilson, J., 1961. Incentive system: A theory of organization. Administrative Science
Quarterly , Volume 6, pp. 129-166.
Cloete, P. & Idsardi, E., 2012. Bio fuels and Food Security in South Africa: The role of
indigeneous and traditional food. Foz do Iguacu,Brazil, IAAE.
Coady, J., 1995. Effects of Green Revolution Strategies on tenants and small scale land owners in
the Chilalo Region of Ethiopia. Enomometrica, Issue 62, pp. 213-233.
Collier, R., Parfitt, B. & Woollard, D., 2002. A voice on the land: An Indigenous peoples' guide to
forest certification in Canada, s.l.: s.n.
Cornejo, J. & Mcbridge, M., 2002. Crops, Adoption of Bioengineered, Washington, DC: s.n.
Coyle, W., 2007. The future of Biofuels: A global perspective. Amber Waves, Volume 5, pp. 24-
28.
Daberkow, S. & McBride, W., 2003. Farm and operators characteristics affecting the awareness
and adoption of precision agricultural technologies in USA. Precision Agriculture, 4(2), pp. 163-
177.
Dandedjrohoun, L., Diagne,A., Biaou,G., N'cho ,S., & Midingoyi, S., 2012. Determinants of
diffusion and adoption of improved technology for rice parboiling in Benin. Review of
Agricultural and Enviromental Studies, 93(2), pp. 171-191.
de Fraiture, C., Wichelns, D., Kemp Benedict, E. & Rockstrom, J., 2007. Scenarios on water for
food and environment. In Water for Food, Water for Life: A Comprehensive Assessment of Water
Management in Agriculture. Colombo: London and International Water Management Institute.
Demeke, B., 2003. Factors influencing the Adoption of introduced soil conservation practises in
North Western Ethiopia, s.l.: University of Groningen.
Department of Agriculture Forestry and Fisheries., 2012. Agricultural statistics.
http://www.nda.agric.za/docs/statsinfo/Ab2012.pdf [Accessed 11 December 2013]

130
Department of Agriculture Forestry and Fisheries., 2013. Quarterly Economic Overview of the
Agriculture, Forestry and Fisheries sector.
http://www.nda.agric.za/docs/Economic_analysis/Publication%20Cover%20-
%20January%20to%20March%202013.pdf [Accessed 11 December 2013]
Dereje, H., 2006. Assessment of farmers evaluation criteria and adoption of improved bread
wheat varieties in Akaki,central Ethiopia, s.l.: s.n.
Deressa, T., 2007. Measuring the economic impact of climate change on Ethiopian
Agriculture:Ricardian Approach. World Bank Policy Research .
Diagne, A., 2010. Technological change in smallholder agriculture: Bridging the adoption gap by
understanding its source. The African Journal of Agricultural and Resource Economics, 5(1), pp.
261-283.
Diagne, A. & Demont, M., 2007. Taking a new look at empirical models of adoption:Average
treatment effect estimation of adoption rates and theri determinants. Agricultural Economics,
Volume 37, pp. 201-210.
DME, 2007. Biofuels Industrial Strategy of the Republic of South Africa, s.l.: Goverment Printer.
Department of Energy (DoE)., 2014. Draft Position Paper of South African Biofuels Regulatory
Framework. Government Printers.
Dolisca, F., Carter, D.R., McDaniel, J.M, Shannon, D.A. & Jolly, C.M., 2006. Factors influencing
farmers participation in forestry management programs: A case study from Haiti. Ecological
Management, 236, pp. 324-331.
Dufey, A., Vermeulen, S. & Vorley, W., 2007. Biofuels: strategic choices for commodity
dependent developing countries, Amsterdam: Common Fund for Commodities.
Elobeid, A. & Hart, C., 2007. Ethanol expansion in the food versus fuel debate:How will
developing countries fare?. Journal of Agricultural and Food industrial Organisation, 5(6).
FAO, 2013. www.fao.org. [Online] Available at: htt://www.fao.org [Accessed 17 August 2013].
Farrell, A. Plevin, J.R., Turner, T.B., Jones, D.A. & O'Hare,M., 2006. Ethanol can contribute to
energy and environmental goals. Science, 311(5760), pp. 506-508.
Feder, G., Just, R. & Zilberman, D., 1985. Adoption of agricultural innova Adoption of
agricultural innovation in developing countries:A survey. Economic Development and Cultural
Change., Issue 33, pp. 255-298.

131
Foster, A. D. & Rosenzweig, M. R., 1995. Learning by doing and learning from others: human
capital and technological change in agriculture. Journal of Political Economy, Volume 103, pp.
936-947.
Gennrich, N., 2004. Factors influencing the adoption of microenterprises and their impact in
rural Gautemala, s.l.: Experto Internacional En Desarrollo Rural.
Goldblatt, A., 2010. Agriculture:Facts and Trends, s.l.: WWF-SA.
Collier, C., 2001. The economics of risk and time. Cambridge: MIT Press.
Gonzales, R., 2003. Economic evaluation of bean research investment in Mexico, Michigan: East
Lansing.
Greene, W., 2012. Econometrics Analysis. 7th Edition ed. s.l.:Pearson Education.
Habtemariam, A., 2003. The comparative Influence of Intervening variable in the adoption of
maize and dairy farmers in Shashemene and Debrezieit ,Ethiopia, s.l.: s.n.
Harrison, R., 2009. The food versus fuel debate: Implications for consumers. Journal oof
Agricultural and Applied Economics, Volume 41, pp. 493-500.
Heckman, J., 1976. The common structure of statistical modelsof trunscation,sample selection and
limited dependent variables and a simple estimation for such models.. Annals of Economic and
Social Measurement, Issue 5, pp. 475-491.
Herath, J. & Takeya, H., 2003. Factors determining intercropping by rubber smallholders in Sri
Lanka: A logit analysis. Agricultural Economics, Volume 29, pp. 159-168.
Hochman, G., Sexton, S. & Zilberman, D., 2008. The Economics of Biofuel Policy and
Biotechnology. Journal of Agricultural and Food Industrial Organisation, 6(8).
Hofferth, S. L., 2006. Residential father family type and child well-being – Investment versus
selection, in Demography. Volume 43(1), pp. 53–77.
International Monetary Fund (IMF)., 2008. IMF Country Report No. 08/284. IMF, Washington,
DC.
Jansen, H. G. P., 2003. Inter-Regional Variation in the Speed of Adoption of Modern Cereal
Cultivars in India. Journal of Agricultural Economics. Volume 43 (1). Blackwell Publishing Ltd.
http://dx.doi.org/10.1111/j.1477-9552.1992.tb00201.x [Accessed 3 April 2014]
Jera, R. & Ajayi, O., 2008. Logistic modeling of smallholder livestock farmers adoption of tree
based fodder technology in Zimbabwe. Agrekon, 47(3), pp. 379-392.
132
Joseph, W., 2008. Adoption of Conservation Agriculture in Malawi. Masters Thesis, Duke
University.
Kherallah, M. & Kirsten, J., 2001. The new institutional economics: Applications for agricultural
policy research in developing countries, Washington: International Food Policy Research
Institute.
Kidane, G., 2001. Factor Influencing the Adoption of New Wheat and Maize vzarieties in
Tigray,Ethiopia: the case of Hawzien Woreda, s.l.: Haramaya University.
Kingwill, R., 2000. The Invisible Farmers in the Eastern Cape. Multiple livelihoods and Social
Change.
Kinuthia, E., 2010. The effects of the international small group and tree planting program on
household income in Nyeri District,Kenya, s.l.: s.n.
Kish, L., 1987. Statistical Design for Research. New York: John Wiley & Sons, Inc.
Korsching, P. & Hoban, T., 1990. Relationships between information sources and farmers’
conservation perception and behavior.. Society and Natural Resources, Volume 3, pp. 1-10.
Kromm.D & White, S., 1991. Reliance on sources of information for water saving practices by
irrigators in the High Plains of the U.S.A. Journal of Rural Studies, Volume 7, pp. 411-421.
Kvale, S., 1996. Interviews—An introduction to qualitative research interviewing. Thousand Oaks,
CA: Sage.
Lahiff, E., 2003. The politics of Land Reform in Southern Africa. Sustainable Livelihoods in
Southern Africa.
Lahiff, E., 2005. Willing seller,willing buyer to a people-driven land reform, Cape Town:
University of Western Cape.
Leathers, H. & Smale, M., 1991. A Bayesian approach to explaining sequential adoption of
components of technological package. American Journal of Agricultural Economics, Volume 68,
pp. 519-527.
Letete, T., 2009. Multi objective Modelling of biofuel supply systems, Cape Town: University of
Cape Town.
Letete, T. & von Blottnitz, H., 2010. Biofuels Policies in South Africa: Acritical analysis, Cape
Town: University of Cape Town.
Lewis-Beck, M.S. Bryman, A., & Liao, F.T., 2004. The Sage Encyclopaedia of Social Science
Research Methods. 3. London: Sage Publications.

133
Liao, Y., de Fraiture, C. & Giordano, M., 2007. The impact of China’s WTO accession on its
agricultural water use. Global Governance. Under review.
Mabiso, A. & Weatherspoon, D., 2011. The impact of biofuels crop and land rental markets on
farm household incomes: Evidence from South Africa. Pennsylvania, AAEA.
Machete, C., 2004. Agriculture and poverty in South Africa: Can agriculture reduce poverty?,
s.l.: Land and Agricultural Policy Centre.
Manona, S. S., 2005. Smallholder agriculture as local development strategy in rural South Africa:
Exploring prospects in Pondoland, Eastern Cape. Unpublished Masters Thesis. University of Cape
Town.
Martel, P., Bernsten, R. & Weber, M., 2000. Food Markets,Policy and Technology: The case of
Honduran dry beans. MSU international Development working paper .
Mathivha, O., 2012. Current and Emerging Youth Policies and Initiatives with a Special focus on
links to Agriculture, s.l.: Fanrpan.
McBride, W. & Daberkow.G.S., 2003. lnformation and the Adoption of Precision Farming
Technologies. Journal of Agribusiness, 21(1), pp. 21-38.
Mcbride, W., Daberkow, G.S. & Christensen, L., 1999. Attitudes about precision agriculture
innovations among U.S corn growers. s.l., Sheffield Academic Press, pp. 927-936.
McCann, M., 2005. District Profile Eastern Cape O.R Tambo District Municipality.
MEA., 2005. Ecosystems and Human Well-being. Millennium Ecosystem Assessment. Island Press,
Washington DC, USA.
Mihiretu,T. A., 2008. Farmers evaluation and adoption of improve onion production package in
Fogera district, South Gondar, Ethiopia. MSc Thesis. Haramaya University, Haramaya.
Mills, B., Hassan, R. & Mwangi, P., 1998. Estimating potential benefits from research and setting
research priorities for maize in Kenya.
Montshwe, D., 2006. Factors affecting participation in mainstream cattle markets by smallholder
cattle farmers in South Africa, Bloemfontein: University of Free State.
Municipality, 0. D., 2013. Integrated Developement Plan 2013/14, s.l.: Goverment Printers.
Musemwa, L, Mushunje, A., Chimonyo, M., Fraser, G., Mapiye, C. & Muchenje, V., 2007. Nguni
cattle marketing constraints and opportunities in the communal areas of South Africa. African
Journal of Agricultural Research, 3 (4), pp 239-245.

134
Mushunje, A., 2001. Efficiency of small-scale farmers and land reform in Zimbabwe, s.l.: s.n.
Naik, S., Goud, V., Rout, K. & Dalai, K., 2009. Production of first and second generation
biofuels: A comprehensive review. Renewable and Sustainable Energy Revies, 14(2010), pp. 578-
597.
Naik, S., Vaibhav, V., Prasant, K. & Ajay, K., 2010. Production of first and second generation
biofuels: A comprehensive review. Renewable and Sustainable Energy Reviews, Volume 14, pp.
578-597.
Negatu, W. & Parikh, A., 1999. The impact of perception and other factors on the adoption of
agricultural technology in the Moret and Jiru Woreda district of Ethiopia. Agricultural
Economics, Issue 21, pp. 205-216.
Neil, S. & Lee, D., 2001. Explaining the adoption nad disadoption of sustainable agriculture:The
case of cover crops in Northern Honduras. Economic Development and Cultural Change, iv(59),
pp. 793-820.
NEPAD–CAADP., 2007. Biofuels (Bioethanol and Biodiesel) Crop Production: Technology Options for
Increased Production, Commercialisation & Marketing. Bankable Investment Project, 4(5), pp 20.
Ngqangweni, S. & Delgado, C., 2003. Decision on livestock keeping in the semi arid areas of
Limpopo province, Pretoria: University of Pretoria.
Nkhori, P.A., 2004. The impact of transaction costs on the choice of cattle markets in Mahalapye
District, Botswana. Msc Agric Dissertation. University of Pretoria, South Africa.
Norris, E. & Batie, S., 1987. Virginia farmers’ soil conservation decisions: an application of Tobit
analysis. Southern Journal of Agricultural Economics, 19(1), pp. 89-97.
Nowak, P. & Korsching, P., 1998. The human dimension of soil and water conservation: A
historical and methodological perspective. Chelsea,MI, Sleeping Bear Press and Ann Arbor Press.
Ogada, J.M., Mwabu, G. & Muchai, D., 2014. Farm technology adoption in Kenya: a simultaneous
estimation of inorganic fertilizer and improved maize variety adoption decisions. Agricultural and
Food Economics, 2 (12).
O.R Tambo IDP., 2013. O.R Tambo Integrated Development Plan Review 2013-14.
Owuba, C., Le Master, D., Bowker, J. & Lee, J. G., 2001. Forest tenure systems and sustainable
forest management: the case of Ghana. Forest Ecology and Management, Volume 149, pp. 253-
264.
Oyedele, O. & Yahaya, M., 2009. Bridging marketing information needs of citrus farmers from
selected rural communities of south-west Nigeria. Journal of Applied Agricultural Research, pp.
21-25.

135
Pattanayak, S., Mercer, D., Sills, E. & Yang, J., 2003. Taking Stock of Agroforestry adoption
studies. Agroforestry Systems, Issue 57, pp. 173-185.
Peters, J. & Thielman, S., 2008. Promoting Biofuels: Implications for developing countries.
Energy Policy, Volume 36, pp. 1538-1544.
Phororo, H., 2001. Food Crops or Cash Crops in the Northern Communal Areas of Namibia: Setting
a Framework for a Research Agenda .Windhoek: Namibian Economic Policy Research Unit.
Pimentel, D. & Pimentel, M., 2003. World population, food, natural resources, and survival.
World Futures, Volume 59, pp. 145-167.
Pingali, P., Raney, T. & Wiebe, K., 2008. Biofuels and food security: Missing the point. Review
of Agricultural Economics, 30(3), pp. 506-515.
Provincial Spatial Development Plan., 2012. Eastern Cape Province Map.
http://drupal6dev15.econsultant.co.za/content/psdp_old [Accessed 17 December 2013].
Raswant, V., Hart, N. & Romano, M., 2008. Biofuel Expansion: Challenges, Risks and
Opportunities for Rural Poor People, s.l.: IFAD's Governing Council.
Rauniyar, G. & Goode, F., 1996. Managing Green Revolution Technology: An Analysis of a
differential practice combination in Swaziland. Economic Developemnt and Cultural Change,
Issue 44, pp. 413-436.
REEEP (2007), Biofuels – Mixed Blessings. http://www.reeep.org/9863.2656/biofuels-mixed-
blessings.htm [Accessed 5 January 2014]
Rogers, E.M., 1983. The Diffusion of Innovations, 3rd Edition, Free Press, New York.
Rogers, E.M., 1995. The Diffusion of Innovations, 4th Edition, Free Press: New York.
Rogers, E.M., 2003. Diffusion of innovations. New York: Free Press.
Rollins, T., 1993. Using the innovation adoption diffusion model to target educational
programming. Journal of Agriculture Education, Volume 34, pp. 46-54.
Rosegrant, M., Zhu, T., Msangi, S. & Sulser, T., 2008. Global scenarios for Biofuels:Impacts and
implications. Review of Agricultural Economics, 30(3), pp. 495-505.
Rosenzweig, M. & Binswanger. H., 1993. Wealth, Weather Risk and the Composition and
Profitability of Agricultural Investments. Economic Journal, 103(416), pp 56–78.

136
Rossman, L. & Rallis, S., 1998. Learning in the field: An intoductionto qualitative research. CA:
Sage.
Ryan, J. & Subrahamanyam, K., 1975. Package of practice approach in adoption of high yielding
varieties, s.l.: An appraisal,Economic and Policy Weekly.
Sapp, M., 2013. Can biofuels really be blamed for food insecurity in Africa? Volume 7(5), John
Wiley & Sons, Ltd. http://dx.doi.org/10.1002/bbb.1444 [Accessed 5 April 2014].
Schmidhuber, J., 2006. Impact of an increased biomass use on Agricultural Markets, Prices and
Food security: A longer term perspective.. Paris, Global Energy.
Shi, N., Chen Yu, D., Li, H. & Hu, S., 2009. Introduction to biofuel, Berkeley: s.n.
Singh, R.K. & Chaudhary. B. D., 1979. Biometrical methods in quantitative genetic analysis,
Kalyani Publishing: New Delhi.
South African National Disaster Management Centre (NDMC)., 2011. OR Tambo District
Municipality.
Sugrue, A., 2007. The problem with biofuels. Global Dialogue, Volume 12.
Sugrue, A. & Douthwaite, R., 2007. Biofuels production and the threat to South Africa`s food
security, s.l.: Regional and Hunger Programme.
Tadesse, M. & Kasa, B., 2004. Determinants of fertilizer use in Gununo area, Ethiopia, s.l.: s.n.
Taha, M., 2007. Determinants of the adoption of imrpoved onion production package in Dugda
Bora District,East Shoa, Ethiopia, s.l.: Alemaya University.
Takavarasha, T., Uppal, J. & Hongo, H., 2005. Feasibility Study for the production and use of
biofuel in the SADC region, Gaborone: SADC.
The Local Government Handbook, 2013. Municipalities in the Eastern Cape. Available
http://www.localgovernment.co.za/districts/view/6/or-tambo-district-municipality [Accessed 15
January 2014]
Trochim W.M.K., 2006. Research Methods Knowledge Based. Available
http://www.socialresearchmethods.net/kb/design.php [Accessed 10 March 2014].

137
Uaiene, R., Arndt, C. & Masters, W., 2009. Determinant of Agricultural Technology Adoption in
Mozambique, s.l.: Ministry of Planning and Development Mozambique.
UNEP., 2007. Sustainable Biofuels: A Framework for Decision Makers, UNEP, Nairobi.
Usman, S., Umar, A. & Goni, M., 2011. Farmers’ Awareness and Adoption of Improved Sesame
Seeds in Jigawa State of Nigeria: An application of Heckman`s Sample Selection Model.
Savannah Journal of Agriculture, 6(2), pp. 67-72.
Van Averbeke, W., 2000. Land use in the Eastern Cape. Agricultural Rural Development Research
Institute University of Fort Hare, Alice.
Van Averbeke, W. & Hebinck, P., 2007. Livelihoods and Landscapes: The people of Guquka and
Koloni and their resources. Leiden: Brill.
Vink, N. & Kirsten, J., 1999. A descriptive analysis of employment trends in South African
Agriculture. Agrekon, 38(2), pp. 204-228.
von Braun, J., 2007. When food makes fuel—the promises and challenges of biofuels. Canberra,
Australia: International Food Policy Research Institute.
Wooldridge, J., 2002. Econometric Analysis of Cross Section and Panel Data, MIT Press.
Zavale, H., Mabaya, E. & Christy, R., 2005. Adoption of improved maize seed by smallholder
farmers in Mozambique, New York: Departmentof Applied Economic and Management .
.

138
APPENDIX
Farmers Questionnaire
Title: Barriers and incentives to widespread adoption of bio fuels crops by smallholder
farmers in selected areas in Chris Hani and OR Tambo District Municipalities, South
Africa.
Introduction
In this interview schedule there is no wrong or correct answer. What is required is just your opinion
on bio fuels crops production. This will assist in formulation of policies, research and extension
programme that are appropriate to your area. Your cooperation will be therefore highly appreciated.
General information
Date..............................
Name of respondent..................................................................................
Name of enumerator.................................................................................
Name of village..........................................................................................

139
Section A – Demographic information
This section of the questionnaire refers to background or biographical information.
Although we are aware of the sensitivity of the questions in this section, the information will allow
us to compare groups of respondents. Once again, we assure you that your response will remain
anonymous. Your co-operation is appreciated.
A1. What is your gender?
Male 1
Female 2
A2. What is your age?
A3. Your highest educational qualification?
Grade 11 or Lower 1
Grade 12 (Matrics, std 10) 2
Post Matric Diploma or certificate 3
Baccalaurete Degree (s) 4

140
Post Graduate Degree (s) 5
A4. Size of your household, i.e the number of people, including yourself, who live in your
house/dwelling for at least three months of the year?
Live Alone 1
2 2
3 3
4 4
5 or 6 5
More than 6 6
A5. What is your occupation?.............................................................................................................
A6. What are the sources of your income? State...............................................................................
………………………………………………………………………………………………….........
A7. Who is the household head of the family?....................................................................................
A8. Who makes household decisions?................................................................................................
A9.What is your household income per month?
R0-1000 1
R1001-2000 2
R2001-3000 3
R3001-4000 4
Over 4001 5

141
Section B - Farming information
B1. How much arable land (ha) do you have access to?
1. Less than 0.5 hectares 1
2. 0.5-1 hectares 2
3. 1-2 Hectares 3
4. 2 hectares or more 4
B2. Do you utilize the land?
1. Yes 1
2. No 2
B2b. If No why?...............................................................................................................................
………………………………………………………………………………………………………
……………………………………………………………………………………………………….
B2c. If YES how much land is utilized?
1. Less than 0.5 hectares 1
2. 0.5-1 hectares 2
3. 1-2 Hectares 3
4. 2 hectares or more 4
B3.How much arable land in hectare did you use last season?........................................................

142
B4. How did you acquire land?
Bought 1
Lease 2
Rent 3
Inherited 4
Other (Specify) 5
B5. In the last season, did this household grow food crops for sale or home consumption?
1. Yes 1
2. No 2
B5b.If Yes which crops did you produce?
Maize 1
Potatoes 2
Cabbages 3
Peas 4
Spinach 5
Onions 6
Other 7
5Bc. If other specify…………………………………………………………………………………
…………………………………………………………………………………………………….....
B6. How much produce did you consume, sell, donate, other: specify in kilograms (kg)

143
Crops Quantity
Produced
Quantity
Consumed
Quantity
sold
Quantity
Donated
1
2
3
4
5
6
B7.What are the sources of your food consumption?
Farm 1
Market 2
Other 3
B8 .Where do you get your farm inputs?........................................................................................
B9.Where do you market your farm ouput?......................................................................................
B10.What is the distance to market where you sell your output?
Less than 0.5 km 1
0.5-5km 2
6-10km 3
10km or more 4
B11.How do you get your market information?................................................................................
B12. Did you borrow any money for crop production last season?

144
1. Yes 1
2. No 2
B12b. If Yes from whom? And for what?...........................................................................................
.............................................................................................................................................................
.............................................................................................................................................................
B12c. If No why did you not seek credit?...........................................................................................
………………………………………………………………………………………………………
………………………………………………………………………………………………………
B13.What is the level of your farming experience?
0-5 years 1
6-10 2
11 and over 3
B14.What is the source of your labour for farming?
Family 1
Community 2
Other 3
B15. How much is your farm production costs?.................................................................................
B16. How much Income do you get from farming ?...........................................................................

145
B17. What kind of farming equipment do you have? State .............................................................
………………………………………………………………………………………………………
………………………………………………………………………………………………………
B18a. Are you a member of any farmers’ membership association?
1. Yes 1
2. No 2
B18b.If Yes name the organisation?...................................
……………………………………………………………………………………………………….
B18c. If No why?...............................................................................................................................
B19. Are you in contact with Agriculture extension agents?
1. Yes 1
2. No 2
B19b. If Yes how many times do you visit them per month?.............................................................
B19c.What kind of information do you get from them?.....................................................................
……………………………………………………………………………………………………….
…………………………………………………………………………………………………….....
B20. What challenges are you facing as a farmer?..............................................................................
………………………………………………………………………………………………………
……………………………………………………………………………………………………….

146
Section C
This section explores your attitude and perceptions regarding awareness and adoption of biofuels
crops.
C1. Are you aware of biofuels crops?
1. Yes 1
2. No 2
C1b. If Yes what do you know about biofuels?...............................................................................
………………………………………………………………………………………………………
……………………………………………………………………………………………………..
C2. From the list below can you tick biofuels crops that you are aware of .
Sugarcane 1
Canola 2
Sunflower 3
Sorghum 4
Wheat 5
Soybean 6

147
Groundnuts 7
Maize 8
Other 9
C2b. If Other can you name the crops……………………………………………………………
C3. What is your view about biofuels?...............................................................................................
………………………………………………………………………………………………………
……………………………………………………………………………………………………….
C4. Are you willing to participate in biofuels production?
1. Yes 1
2. No 2
C4b. If No why are you not willing?...................................................................................................
………………………………………………………………………………………………………
……………………………………………………………………………………………………….
C5. What kind of incentives would make you participate in biofuel productions?.............................
………………………………………………………………………………………………………
……………………………………………………………………………………………………….
C6. If offered incentives are willing to let go the crops you are currently farming?

148
1. Yes 1
2. No 2
C6b. If No why are not you willing to let go the crops you are farming?..........................................
………………………………………………………………………………………………………
………………………………………………………………………………………………………
To what extent do you agree with each of the following statements. Please indicate your answer
using the following 5-point scale where:
1. = Strongly disagree (SD)
2. = Disagree (D)
3. = Neutral (N)
4. = Agree (A)
5. = Strongly Agree (SA)
SD D N A SA
C7. The biofuels market is sustainable for small-
scale farmers
1 2 3 4 5
C8. Participating in biofuels production would
increase my farming output
1 2 3 4 5
C9. I have knowledge of the proposed crops for
biofuels production by the Department of Energy
1 2 3 4 5
C10. Biofuels will create employment
opportunities for small scale farmers
1 2 3 4 5

149
C13. Please enter your perception regarding any other beneficial or detrimental effects of
adopting bio fuels crops in the space provided below
.............................................................................................................................................................
.............................................................................................................................................................
.............................................................................................................................................................
.............................................................................................................................................................
............................................................................................................................................................
Thank you for your co-operation in completing this questionnaire.
C11. Biofuels production will increase
productivity for small scale farmers
1 2 3 4 5
C12. Producing biofuels crop will help small
scale farmers to access markets
1 2 3 4 5