
ExtendedAbstract Calibration service
5
Calibration service for mobility measurements based on reference material for monodisperse spherical particles in aerosols Egbert Buhr 1 , Tobias Klein 1 , Anke Jordan-Gerkens 1 , Jürg Schlatter 2 , Felix Lüönd 2 , Anastasios Melas 3 , Athanasios Mamakos 3 , Kai Dirscherl 4 , Thomas Tuch 5 , Alfred Wiedensohler 5 1 Physikalisch Technische Bundesanstalt (PTB), Germany 2 Federal Institute of Metrology METAS, Switzerland 3 Joint Research Centre – Institute for Energy and Transport (JRC-IE), EC 4 Danish Fundamental Metrology (DFM), Denmark; 5 Leibniz-Institut für Troposphärenforschung e.V. (TROPOS), Germany Email presenting author: [email protected] Abstract Reference nanoparticles are commonly delivered and stored as suspensions. One reason is that agglomeration of the nanoparticles can be avoided or strongly reduced using appropriate additives. To use nanoparticle suspensions for the calibration of mobility analysers, the suspensions must be aerosolized, dried and diluted. And, of course, the size of the nanoparticles needs to be known with sufficiently low uncertainty. For the determination of the particle size distribution, two methods have been applied in this study. One method uses a Scanning Electron Microscope in transmission mode (TSEM) and the other makes use of Atomic Force Microscopy (AFM). Both methods analyse particles which are deposited on surfaces. In addition, the aerosolized particles are measured with a Scanning Mobility Particle Sizer (SMPS). Instrumentation Commercially available particles made of gold and polysterene latex (PSL) were used in this study, see table 1 . Aiming for reliable size measurements of nanoparticles, a special SEM technique using a transmission electron detector (“Transmission Scanning Electron Microscopy”, TSEM) has been proven to be valuable [1]. The measurement setup consists of a standard SEM (Zeiss Supra 35 VP) equipped with a transmission detector placed underneath the sample. The AFM used in this analysis is a Dimension 3100m Metrology AFM, equipped with 3 capacitive sensors for full closed-loop control. Its capabilities have been investigated thoroughly [2]. For the evaluation of the uncertainty associated with the measured particle size we applied the internationally accepted rules described in the ‘Guide to the expression of uncertainty in measurement’ (GUM) [3]. For aerosolisation of suspensions containing certified particles two generators are commonly used: Atomizer or electrospray. Atomizing suspensions with atomizers (e.g. TSI 3076, Topas ATM 220, Palas UGF) is applicable for particles with diameters above 100 nm. Below that diameter the size distribution of the certified particles is covered by a huge amount of residual particles originating from pure solution droplets. This effect can be minimized by using very pure water only to a certain degree. As an alternative, the electrospray TSI 3048 was evaluated for the aerosolisation of particles below 100 nm. With the electrospray, the residues are well separated from particles with diameters > 20 nm. For 200 nm PSL particles, a Topas ATM 220 atomizer was used with a solution consisting of 18 drops of the original PSL solution diluted by 100 ml of ultrapure water.
Transcript of ExtendedAbstract Calibration service

Calibration service for mobility measurements based on reference material for
monodisperse spherical particles in aerosols
Egbert Buhr1, Tobias Klein
1, Anke Jordan-Gerkens
1, Jürg Schlatter
2, Felix Lüönd
2, Anastasios Melas
3, Athanasios
Mamakos3, Kai Dirscherl
4, Thomas Tuch
5, Alfred Wiedensohler
5
1 Physikalisch Technische Bundesanstalt (PTB), Germany
2 Federal Institute of Metrology METAS, Switzerland
3 Joint Research Centre – Institute for Energy and Transport (JRC-IE), EC
4 Danish Fundamental Metrology (DFM), Denmark;
5 Leibniz-Institut für Troposphärenforschung e.V. (TROPOS), Germany
Email presenting author: [email protected]
Abstract
Reference nanoparticles are commonly delivered and stored as suspensions. One reason is that
agglomeration of the nanoparticles can be avoided or strongly reduced using appropriate additives. To use
nanoparticle suspensions for the calibration of mobility analysers, the suspensions must be aerosolized,
dried and diluted. And, of course, the size of the nanoparticles needs to be known with sufficiently low
uncertainty. For the determination of the particle size distribution, two methods have been applied in this
study. One method uses a Scanning Electron Microscope in transmission mode (TSEM) and the other makes
use of Atomic Force Microscopy (AFM). Both methods analyse particles which are deposited on surfaces. In
addition, the aerosolized particles are measured with a Scanning Mobility Particle Sizer (SMPS).
Instrumentation
Commercially available particles made of gold and polysterene latex (PSL) were used in this study, see table
1 . Aiming for reliable size measurements of nanoparticles, a special SEM technique using a transmission
electron detector (“Transmission Scanning Electron Microscopy”, TSEM) has been proven to be valuable
[1]. The measurement setup consists of a standard SEM (Zeiss Supra 35 VP) equipped with a transmission
detector placed underneath the sample. The AFM used in this analysis is a Dimension 3100m Metrology
AFM, equipped with 3 capacitive sensors for full closed-loop control. Its capabilities have been investigated
thoroughly [2]. For the evaluation of the uncertainty associated with the measured particle size we applied
the internationally accepted rules described in the ‘Guide to the expression of uncertainty in measurement’
(GUM) [3].
For aerosolisation of suspensions containing certified particles two generators are commonly used:
Atomizer or electrospray. Atomizing suspensions with atomizers (e.g. TSI 3076, Topas ATM 220, Palas UGF)
is applicable for particles with diameters above 100 nm. Below that diameter the size distribution of the
certified particles is covered by a huge amount of residual particles originating from pure solution droplets.
This effect can be minimized by using very pure water only to a certain degree. As an alternative, the
electrospray TSI 3048 was evaluated for the aerosolisation of particles below 100 nm. With the
electrospray, the residues are well separated from particles with diameters > 20 nm. For 200 nm PSL
particles, a Topas ATM 220 atomizer was used with a solution consisting of 18 drops of the original PSL
solution diluted by 100 ml of ultrapure water.

Particle material Size Manufacturer Product Number
Gold 20 nm TedPella 15705-1
Gold 30 nm TedPella 15706-1
Gold 40 nm TedPella 15707-1
Silver 40 nm TedPella 15707-1SC
Gold 100 nm TedPella 15708-9
PSL 200 nm Thermo-Scientific 3200A
Table 1: Summary of suspensions with spherical particles.
Parameter Gold
20 nm
Gold
30 nm
Gold
40 nm
Gold
100 nm
PSL
200 nm
Silver
30 nm
Gold
20 nm
Gold
30 nm
Gold
40 nm
Measurement instrument TSEM TSEM TSEM TSEM TSEM AFM AFM AFM AFM
Mean particle size in nm 21.0 29.8 44.5 103.8 208.9 31.8 17.2 26.7 38.0
Expanded uncertainty (k=2) in nm 1.9 2.0 2.2 3.9 7.2 1.6 1.4 1.5 1.9
Standard deviation in nm 1.4 2.7 4.4 9.3 9.1 8.2 2.0 3.0 5.9
Mode size in nm 20.7 29.6 43.4 103.2 210.3 31.0 19.0 28.0 n.a.
Number of analyzed particles 9397 2038 2202 2382 4431 364 410 151 83
Table 2: Results of the size measurements with TSEM and AFM on various particle suspensions
Since the stability of the aerosol generation with the original electrospray TSI 3048 did not satisfy the
needs, it was modified as follows: a) The 210
Po neutralizer (initially 185 MBq, t50 = 138 days) was replaced by
a 241
Am neutralizer (37 MBq, t50 = 432 years) in order to increase the half-life of the neutralizer. b) The
pressure gauge was changed in order to expand the range from 0…345 mbar (5 psig) to 0…>700 mbar. c)
The pressure chamber was tightened by gluing the capillary with epoxy resin adhesive to the enclosing tube
that ends in a Swagelok fitting. d) Tests have shown that the electrospray runs in a more stable manner
with the buffer solution at a concentration of 2 mM of ammonium acetate instead of 20 mM as indicated in
the user manual.
Results
The comparison shows fair agreement between the ‘stepwise mode’ and the ‘SMPS mode’ at the evaluated
settings, see table 3. The relative deviation increases for decreasing particle diameter. Comparison of the
mean diameter from the ‘SMPS mode’ with TSEM measurements (see table 2) shows good agreement for
the nominal 40 nm gold particles. For 20, 30 and 100 nm gold particles, SMPS measurements systematically
lead to a larger diameter than TSEM measurements. The tendency towards larger deviations between
SMPS and TSEM for decreasing particle diameter supports the conjecture that deviations might be due to
the slip correction which has to be applied in the size analysis of airborne particles.

Parameter Gold
20 nm
Gold
30 nm
Gold
40 nm
Gold
100 nm
PSL
200 nm
DMA voltage at peak
concentration 469 ± 3 V 904 ± 9 V 1536 ± 25 V 4685 ± 45 V
1 2564 ±10 V
2
Mode particle size calculated
according to ISO 15900 24.0 ± 0.4 nm
33.8 ± 0.6
nm
44.6 ± 1.0
nm 107.4 ± 1.5 nm 201 ± 3 nm
Expanded uncertainty (k=2) of the
mode size from DMA 0.8 nm 1.2 nm 2.0 nm 3.0 nm 6 nm
Number concentration at peak ~ 200 cm-3
~ 200 cm-3
~ 100 cm-3
~ 60 cm-3
~ 300 cm-3
Mean particle size SMPS 23.5 ± 0.1 nm 33.0 ± 0.4
nm
44.2 ± 0.4
nm 107.3 ± 0.4 nm 197 ± 1 nm
Mode particle size SMPS 23.4 ± 0.1 nm 32.9 ± 0.4
nm
44.1 ± 0.4
nm 106.7 ± 1.2 nm 196 ± 1 nm
Number concentration (integral) ~ 9000 cm-3
~ 4000 cm-3
~ 6000 cm-3
~ 2000 cm-3
~ 5000 cm-3
Table 3: Measurements of the nanoparticle samples under test in the ‘DMA-mode’ and ‘SMPS-mode’
Due to the relatively small amount of particles measured with the AFM, the methods are compared
separately for the relevant sizes. As can be seen in figure 1, there is a systematic bias between the AFM and
the other techniques. As the particle size is determined by the AFM by the height of the particle above the
reference surface, effects such as vertical particle deformation upon adhesion have a greater impact on the
one-dimensional AFM measurement in comparison to the lateral measurement of the TSEM.
Conclusions
In combination with the size calibration using TSEM or AFM and the evaluated procedure to aerosolize the
particles, the suspended gold particles with sizes between 20 nm and 100 nm appear to be promising as
reference particles for DMA calibration with regard to automotive applications. This is based on the
assessment of the associated uncertainty in sizing (< 5%), the roundness of the particles, and the width of
the size distribution. Nevertheless, the deviations between different sizing methods for particles below 100
nm have to be better understood before particles in this size range can be established as reference
materials for DMA calibration.
1 Sheath flow 3 L/min
2 Long DMA TSI 3081
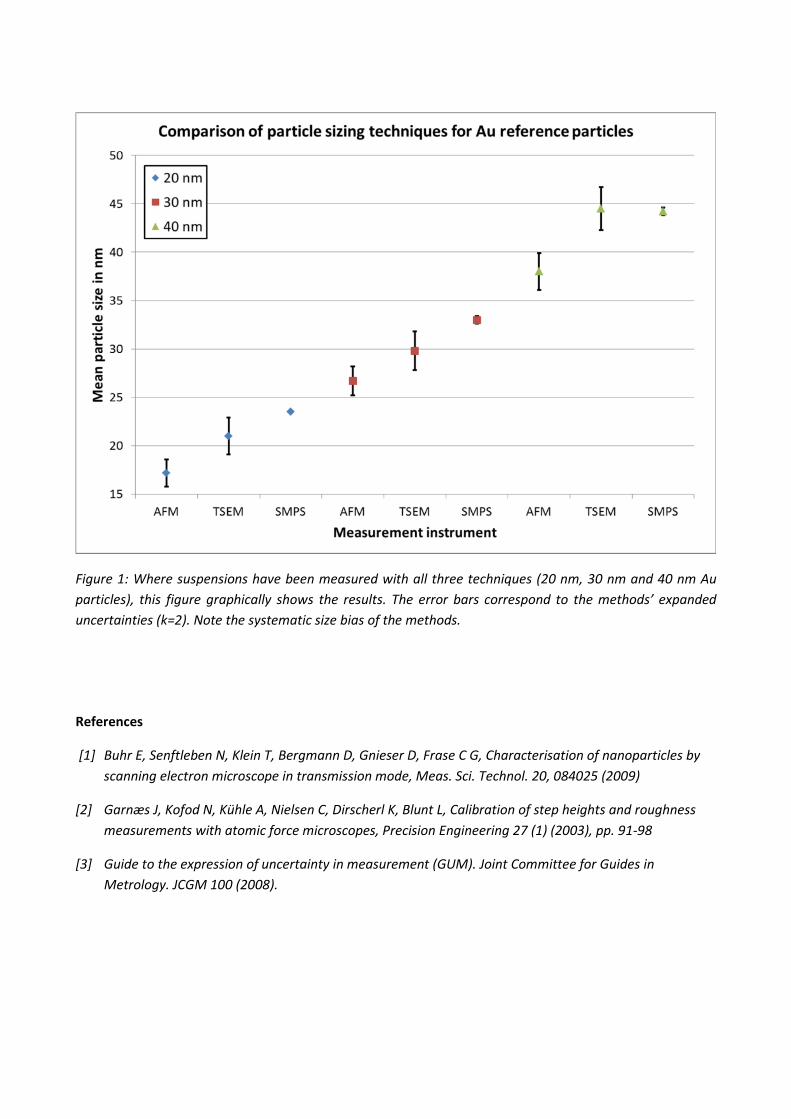
Figure 1: Where suspensions have been measured with all three techniques (20 nm, 30 nm and 40 nm Au
particles), this figure graphically shows the results. The error bars correspond to the methods’ expanded
uncertainties (k=2). Note the systematic size bias of the methods.
References
[1] Buhr E, Senftleben N, Klein T, Bergmann D, Gnieser D, Frase C G, Characterisation of nanoparticles by
scanning electron microscope in transmission mode, Meas. Sci. Technol. 20, 084025 (2009)
[2] Garnæs J, Kofod N, Kühle A, Nielsen C, Dirscherl K, Blunt L, Calibration of step heights and roughness
measurements with atomic force microscopes, Precision Engineering 27 (1) (2003), pp. 91-98
[3] Guide to the expression of uncertainty in measurement (GUM). Joint Committee for Guides in
Metrology. JCGM 100 (2008).

Calibration service for mobility measurements based on reference material for monodisperse spherical particles in aerosols
Egbert Buhr1, Tobias Klein1, Anke Jordan-Gerkens1, Jürg Schlatter2, Felix Lüönd2, Anastasios Melas3, Athanasios Mamakos3, Kai Dirscherl4, Thomas Tuch5, Alfred Wiedensohler5
1 Physikalisch Technische Bundesanstalt (PTB), Germany, 2 Federal Institute of Metrology METAS, Switzerland, 3 Joint Research Centre – Institute for Energy and Transport (JRC-IE), EC, 4 Danish Fundamental Metrology (DFM), Denmark; 5 Leibniz-Institut für Troposphärenforschung e.V. (TROPOS), Germany
In combination with the size calibration using TSEM or AFM and the evaluated procedure to aerosolize the particles, the suspended goldparticles with sizes between 20 nm and 100 nm appear to be promising as reference particles for DMA calibration with regard to automotiveapplications. This is based on the assessment of the associated uncertainty in sizing (< 5%), the roundness of the particles, and the width ofthe size distribution. Nevertheless, the deviations between different sizing methods for particles below 100 nm (see figure 6) have to be betterunderstood before particles in this size range can be established as reference materials for DMA calibration.
Presenting person:
Kai Dirscherl, [email protected]
Tel: +45 4525 5878
Danish Fundamental Metrology Ltd.
Matematiktorvet 307
DK-2800 Kgs. Lyngby
Tel +45 4593 1144
Fax +45 4593 1137
www.dfm.dk
Calibration set-up
Aerosolisation results and conclusions
[1] Regulation No. 83: Uniform provisions concerning the approval of vehicles with regard to the emission of pollutants according to engine fuel requirementshttp://www.unece.org/fileadmin/DAM/trans/main/wp29/wp29regs/r083r4e.pdf
[2] Commission Regulation (EC) No 692/2008 of 18 July 2008 implementing and amending Regulation (EC) No 715/2007 of the European Parliament and of the Council on type-approval of motor vehicles with respect to emissions from light passenger and commercial vehicles (Euro 5 and Euro 6) and on access to vehicle repair and maintenanceinformation. http://eur-lex.europa.eu/LexUriServ/LexUriServ.do?uri=OJ:L:2008:199:0001:0136:EN:PDF
Concerns related to the adverse health effects of automotive exhaust aerosols have driven the regulatory authoritiesworldwide to limit the particulate emissions of diesel vehicles. The particulate emission performance at a certification stage istraditionally monitored gravimetrically, by means of collecting samples from a Constant Volume Sampler (CVS). Recognizingthat the gravimetric procedure would not be sensitive enough to discriminate between the very efficient wall flow DieselParticulate Filters (DPFs) and flow through particulate filters, a particle number limit was also introduced which becameeffective at a Euro 5b stage (9/2011 – [1], [2]).
Reference nanoparticles are commonly delivered and stored as suspensions. One reason is that agglomeration of thenanoparticles can be avoided or strongly reduced using appropriate additives. To use nanoparticle suspensions for thecalibration of mobility analysers, the suspensions must be aerosolized, dried and diluted. And, of course, the size of thenanoparticles needs to be known with sufficiently low uncertainty.
For the determination of the particle size distribution, two methods have been applied in this study. One method uses aScanning Electron Microscope in transmission mode (TSEM) and the other makes use of Atomic Force Microscopy (AFM).Both methods analyse particles which are deposited on surfaces.
The advantage of this procedure is that the calibration of the particle sizer can be repeated with the same size standardseveral times, as long the suspension is not soiled or the particles are not agglomerated. The risk or disadvantage of thismethod is that the measured diameter of deposited particles may differ from the diameter after aerosolisation.
Commercially available particles made of gold and polysterene latex (PSL) were used in this study, see table 1 . Finally, thereference particles were also measured by a Scanning Mobility Particle sizer (SMPS).
The work presented here has been executed within the European Metrology Research Program (EMRP)“Emerging requirements for measuring pollutants from automotive exhaust emissions”(ENV02 “PartEmission”).
Figure 2: Example of a TSEM image of the 100 nm Au particles
Figure 3: Example of a TSEM image of the 200 nm PSL particlesFigure 1: Example of a TSEM image of the 30 nm Au particles
Particle material
Size Manufacturer Product Number
Gold 20 nm TedPella 15705-1Gold 30 nm TedPella 15706-1Gold 40 nm TedPella 15707-1Silver 40 nm TedPella 15707-1SCGold 100 nm TedPella 15708-9PSL 200 nm Thermo-
Scientific3200A
Table 1: Summary of suspensions with spherical particles.
Parameter Gold 20 nm
Gold 30 nm
Gold 40 nm
Gold100 nm
PSL 200 nm
Silver30 nm
Gold 20 nm
Gold 30 nm
Gold 40 nm
Measurement instrument TSEM TSEM TSEM TSEM TSEM AFM AFM AFM AFM
Mean particle size 21.0 nm 29.8 nm 44.5 nm 103.8 nm 208.9 nm 31.8 nm 17.2 nm 26.7 nm 38.0
Expanded uncertainty (k=2) of the mean size
1.9 nm 2.0 nm 2.2 nm 3.9 nm 7.2 nm 1.6 nm 1.4 nm 1.5 nm 1.9 nm
Spread of size distribution (standard deviation of particle size)
1.4 nm 2.7 nm 4.4 nm 9.3 nm 9.1 nm 8.2 nm 2.0 nm 3.0 nm 5.9 nm
Spread of size distribution (standard deviation of particle size) in % of mean particle size
6.6 % 9.1 % 9.8 % 9.0 % 4.4 % 26 % 11.8 % 11.3 % 15.5 %
Mode size 20.7 nm 29.6 nm 43.4 nm 103.2 nm 210.3 nm 31.0 nm 19.0 nm 28.0 nm too few particles
Median size 20.9 nm 29.7 nm 43.9 nm 103.3 nm 209.9 nm 27.9 nm 17.7 nm 27.3 nm 38.9 nm
Number of analyzed particles 9397 2038 2202 2382 4431 364 410 151 83
Aiming for reliable size measurements of nanoparticles, a special SEM technique using a transmission electron detector (“Transmission Scanning Electron Microscopy”, TSEM) has been proven to be valuable [3]. The measurement setup consists of a standard SEM (Zeiss Supra 35 VP) equipped with a transmission detector placed underneath the sample. For image examples, see figures 1-3.
The AFM used in this analysis is a Dimension 3100m Metrology AFM, equipped with 3 capacitive sensors for full closed-loop control. Its capabilities have been investigated thoroughly [4]. See figure 4 for an example image.
For the evaluation of the uncertainty associated with the measured particle size we applied the internationally accepted rules described in the ‘Guide to the expression of uncertainty in measurement’ (GUM) [5].
Table 2 sums up all results from the measurements.
For aerosolisation of suspensions containing certified particles two generators are commonly used: Atomizer or electrospray.
Atomizing suspensions with atomizers (e.g. TSI 3076, Topas ATM 220, Palas UGF) is applicable for particles with diameters above100 nm. Below that diameter the size distribution of the certified particles is covered by a huge amount of residual particles originating frompure solution droplets. This effect can be minimized by using very pure water only to a certain degree. As an alternative, the electrospray TSI3048 was evaluated for the aerosolisation of particles below 100 nm. With the electrospray, the residues are well separated from particleswith diameters > 20 nm. For 200 nm PSL particles, a Topas ATM 220 atomizer was used with a solution consisting of 18 drops of the originalPSL solution diluted by 100 ml of ultrapure water.
Since the stability of the aerosol generation with the original electrospray TSI 3048 did not satisfy the needs, it was modified as follows,see figure 5: a) The 210Po neutralizer (initially 185 MBq, t50 = 138 days) was replaced by a 241Am neutralizer (37 MBq, t50 = 432 years) inorder to increase the half-life of the neutralizer. b) The pressure gauge was changed in order to expand the range from 0…345 mbar (5 psig)to 0…>700 mbar. c) The pressure chamber was tightened by gluing the capillary with epoxy resin adhesive to the enclosing tube that ends ina Swagelok fitting. d) Tests have shown that the electrospray runs in a more stable manner with the buffer solution at a concentration of 2mM of ammonium acetate instead of 20 mM as indicated in the user manual.
Parameter Gold 20 nm
Gold 30 nm
Gold 40 nm
Gold 100 nm
PSL 200 nm
DMA voltage at peak concentration 469 ± 3 V 904 ± 9 V 1536 ± 25 V 4685 ± 45 V2 2564 ±10 V1
Mode particle size calculated according to ISO 15900
24.0 ± 0.4 nm 33.8 ± 0.6 nm 44.6 ± 1.0 nm 107.4 ± 1.5 nm 201 ± 3 nm
Expanded uncertainty (k=2) of the mode size from DMA
0.8 nm 1.2 nm 2.0 nm 3.0 nm 6 nm
Number concentration at peak ~ 200 cm-3 ~ 200 cm-3 ~ 100 cm-3 ~ 60 cm-3 ~ 300 cm-3
Mean particle size SMPS 23.5 ± 0.1 nm 33.0 ± 0.4 nm 44.2 ± 0.4 nm 107.3 ± 0.4 nm 197 ± 1 nmMode particle size SMPS 23.4 ± 0.1 nm 32.9 ± 0.4 nm 44.1 ± 0.4 nm 106.7 ± 1.2 nm 196 ± 1 nmNumber concentration (integral) ~ 9000 cm-3 ~ 4000 cm-3 ~ 6000 cm-3 ~ 2000 cm-3 ~ 5000 cm-3
The comparison shows fair agreement between the ‘stepwise mode’ and the ‘SMPS mode’ at the evaluated settings, see table 3. Therelative deviation increases for decreasing particle diameter. Comparison of the mean diameter from the ‘SMPS mode’ with TSEMmeasurements (see table 2) shows good agreement for the nominal 40 nm gold particles. For 20, 30 and 100 nm gold particles, SMPSmeasurements systematically lead to a larger diameter than TSEM measurements. The tendency towards larger deviations between SMPSand TSEM for decreasing particle diameter supports the conjecture that deviations might be due to the slip correction which has to be appliedin the size analysis of airborne particles.
Due to the relatively small amount of particles measured with the AFM, the methods are compared separately for the relevant sizes. Ascan be seen in figure 6, there is a systematic bias between the AFM and the other techniques. As the particle size is determined by the AFMby the height of the particle above the reference surface, effects such as vertical particle deformation upon adhesion have a greater impacton the one-dimensional AFM measurement in comparison to the lateral measurement of the TSEM:
[3] Buhr E, Senftleben N, Klein T, Bergmann D, Gnieser D, Frase C G, Characterisation of nanoparticles by scanning electron microscope in transmission mode, Meas. Sci. Technol. 20, 084025 (2009)
[4] Garnæs J, Kofod N, Kühle A, Nielsen C, Dirscherl K, Blunt L, Calibration of step heights and roughness measurements with atomic force microscopes, Precision Engineering 27 (1) (2003), pp. 91-98
[5] Guide to the expression of uncertainty in measurement (GUM). Joint Committee for Guides in Metrology. JCGM 100 (2008).
Table 2: Results of the size measurements with TSEM and AFM on various particle suspensions
Figure 4: Example of an AFM image of the 20 nm Au particles
Table 3: Measurements of the nanoparticle samples under test in the ‘DMA-mode’ and ‘SMPS-mode’ 1 Long DMA TSI 3081
2 Sheath flow 3 L/min
Figure 5: Modifications on TSI 3048 Electrospray
Figure 6: Where suspensions have been measured with all three techniques (20 nm, 30 nm and 40 nm Au particles), this figure graphically shows the results.The error bars correspond to the methods’ expanded uncertainties (k=2). Note the systematic size bias of the methods.
Introduction