Exploring the World’s Oceans with Tara - INPE · Exploring the World’s Oceans with Tara. In...
44
Exploring the World’s Oceans with Tara
Transcript of Exploring the World’s Oceans with Tara - INPE · Exploring the World’s Oceans with Tara. In...

Exploring the World’s Oceans with Tara

In this talk, I will address the following:
What is Tara?
How did we get to sail on the Tara?
What science does the Tara promote?
Present a few scientific results from recent expeditions.
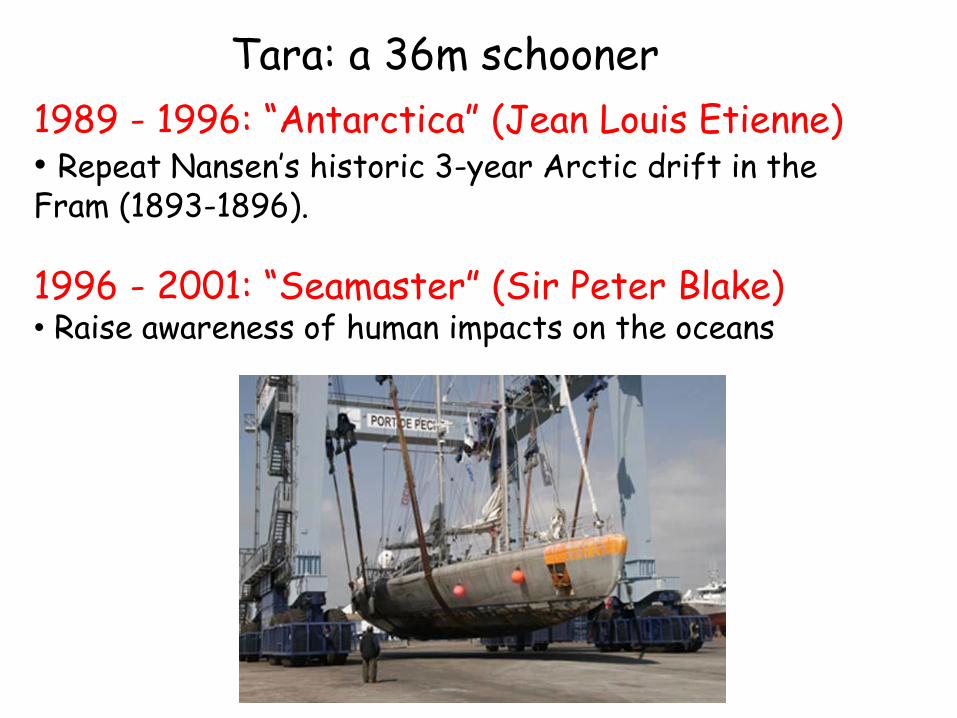
Tara: a 36m schooner
1989 - 1996: “Antarctica” (Jean Louis Etienne)• Repeat Nansen’s historic 3-year Arctic drift in the Fram (1893-1896).
1996 - 2001: “Seamaster” (Sir Peter Blake)• Raise awareness of human impacts on the oceans

A family affair
Tara is actually the Tara V

2003- present: the Tara Expeditions foundation for marine research
• Finance long-term scientific research concerning the impact of global warming on ecosystems.
• Increase general awareness about environmental issues.
• Diffuse scientific data for educational and policy purposes.
Etienne Bourgois

10 years of tara, 10 expeditions
200420042005
2013 2006-20082009-2012 2006
2005
2014
2005

How did UMaine get involved with Tara?

A three year expedition:
• To explore plankton and coral reef ecosystems in relation to environmental conditions
• To popularize Science
• To educate

• 3 years of sampling throughout all the oceans (~500 stations + continuos data acquisition)
• Sample all microscopic life ‘end to end’(from viruses to fish larvae), by size classes
• Sampling of ecosystems down to 2,000m
• Multidisciplinary approach from oceanography to genomics
• Modern instrumentation (high throughput genomics and fast imaging methods)
Scientific plan: characterize planktonic ecosystems in the World’s Oceans

Planned Tara Oceans route
• Scientific considerations
• Seasons:Northern-Southern hemispheres
• In-line with prevailing winds

Inspired by:
Venter’s global ocean sampling expedition (2003-2010):
1872-76, 362 ‘stations’
Challenger expedition

Some facts about Tara• Aluminum hull – ice strengthen
• 36m long x 10m wide
• Draught: 1.50 – 3.50m
• Weight: 120 tons
• Sail area: 400m2
• Propulsion: 2 x 350 HP
• Watermaker: 300 litres/hour
• Fuel tanks: 40,000 litres
• Water tank: 6,000 litres
• 3 kW wind generator power system
• Communication: Satellite/radio
• Oceanography: 3,000 m winch
• Autonomy: 5,000 nautical miles
• Number of berths: 14Photo: Francis Latreille

Challenge: what could we (@Umaine) do to contribute? Who would fund it?
Answer: NASA products need validation.Database currently biased.
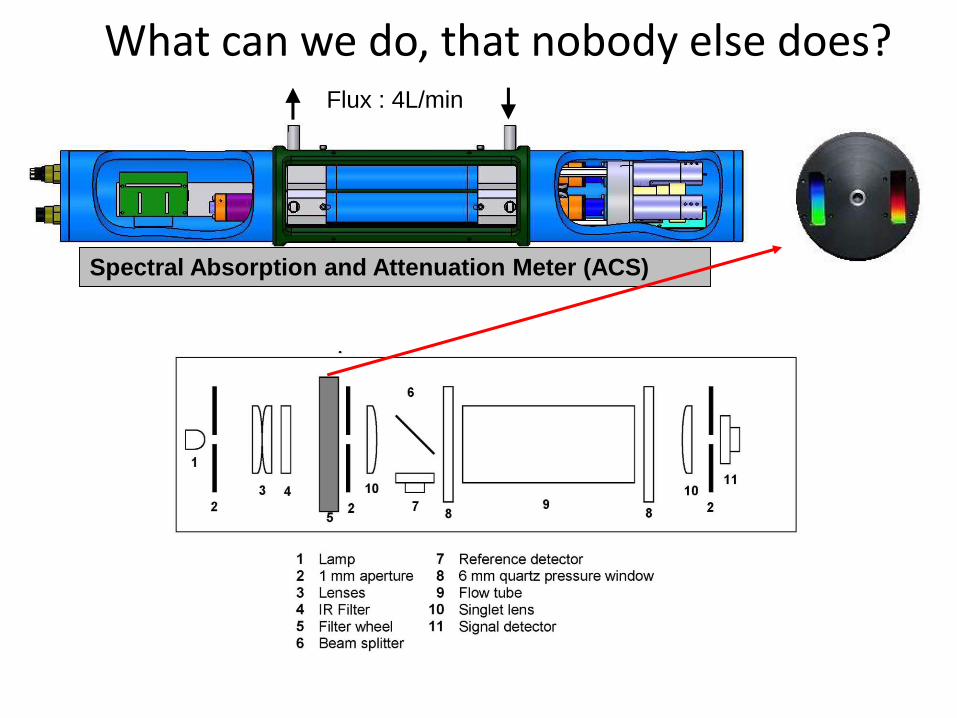
Spectral Absorption and Attenuation Meter (ACS)
Flux : 4L/min
What can we do, that nobody else does?

System for acquisition and processing of particulate absorption/attenuation:
Validation against filter-pad
Slade et al., 2010, JTECH

Acquisition and processing of particulate absorption:
Slade et al., 2010, JTECH
atot-ag
Simultaneous scattering and T correction based on shape of aw(T).
Generated three additional products:
1. [Chl_a]2. Size index (from cp)3. Particulate Organic Carbon from cp
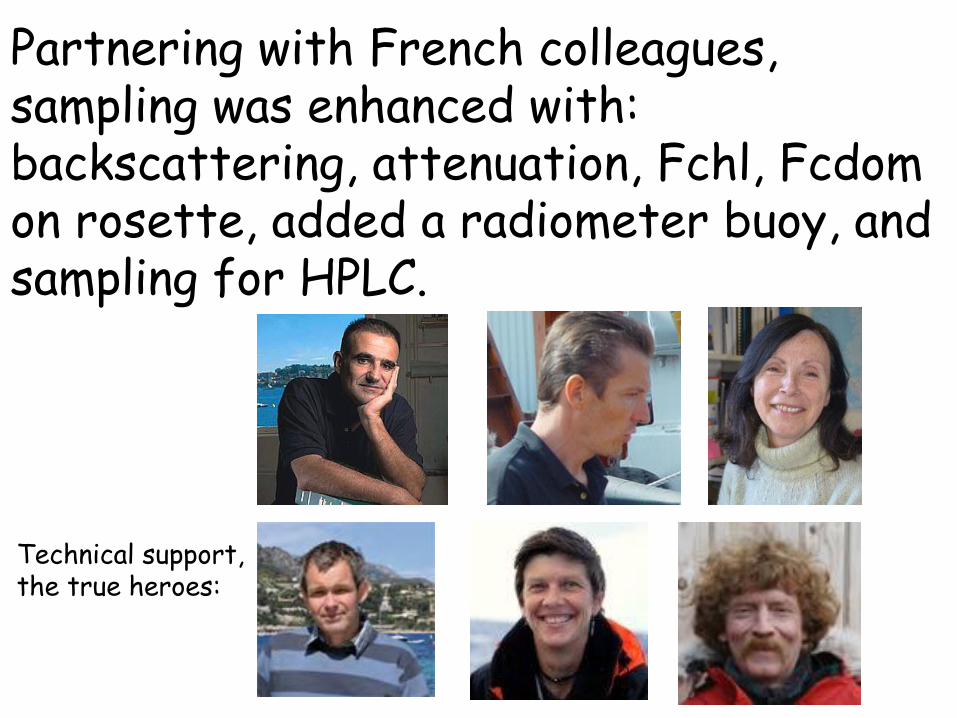
Partnering with French colleagues, sampling was enhanced with: backscattering, attenuation, Fchl, Fcdomon rosette, added a radiometer buoy, and sampling for HPLC.
Technical support, the true heroes:

TARA OCEANS: Challenges• Funding – how do we get on (boat is leaving 9/2009)
• Use an appropriate data and sample tracking system
• High quality logistics (permits, handling and shipping of samples)
• computing and conceptual tools to organize the data and do modeling

Septembre 2009, Lorient, Bretagne It takes a village!
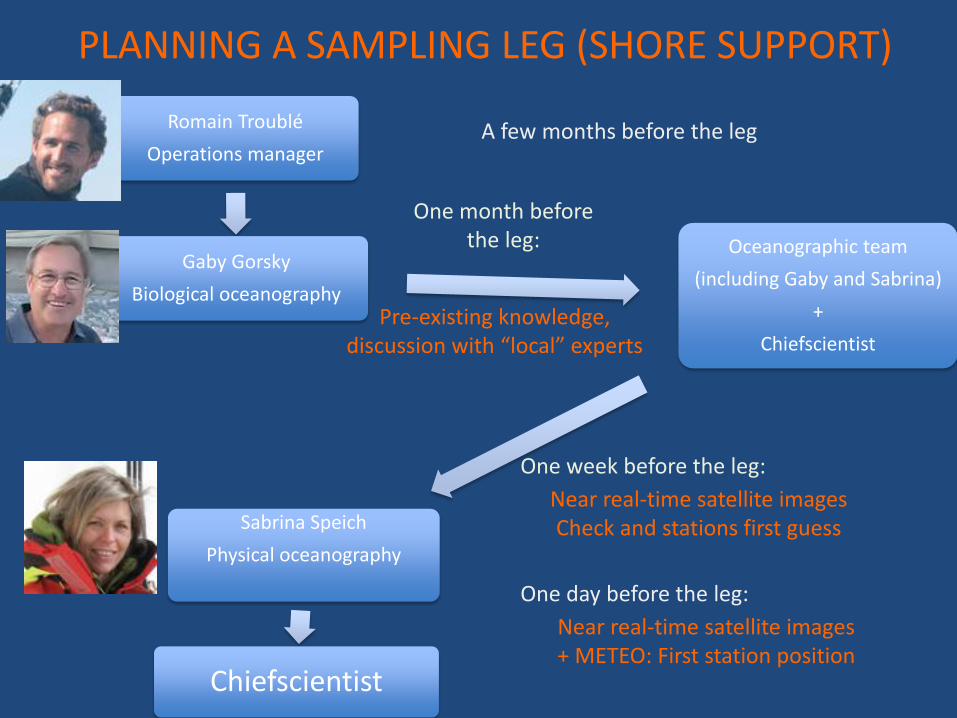
Romain Troublé
Operations manager
Gaby Gorsky
Biological oceanography
Oceanographic team
(including Gaby and Sabrina)
+
Chiefscientist
Sabrina Speich
Physical oceanography
Chiefscientist
One week before the leg:
PLANNING A SAMPLING LEG (SHORE SUPPORT)
Pre-existing knowledge, discussion with “local” experts
Near real-time satellite images Check and stations first guess
One day before the leg:
Near real-time satellite images + METEO: First station position
A few months before the leg
One month before the leg:

Revised plan
UMaine personnel chief-scientists on 3/33 legs +2/6 in following Polar Circle.

Added responsibilities:
Scientific steering committee
Responsible for imaging and cytometry (with Laval)
Umaine personnel on every leg
Added equipment:• Flowcytobot• CPR• ALFA• Ultrapath• pH• PCO2

Virtual tour of the Tara as it during the Polar Circle expedition
Photo: Clare Kines, Arctic Bay, Nunavut

How is data collected on Tara?
I. Rosette: Physical variables: temperature, salinity, pressure, light level.Optical variables: scattering, attenuation. Biological variables: imaging camera, chlorophyll.Chemical variables: nitrate, oxygen, DOM.
Bottles to collect water ->Biological variables: Virus, bacteria, pigmentsChemical variables: Carbonates, nutrients, O18
II. Nets (of variables mesh size):Biological variables: protists, phytoplankton, zooplankton (for ‘-omics’ and imaging)
Spatial scales: 1km2
Temporal scales: week/daysVertical scales: surface to 1000m at O(1m)

Anna Deniaud
Come on board with Todd the copepod

For Lino (near Disco Island, Greenland):

Station 168Barents Sea
(Open Water)

Station 188Kara Sea
(Ice edge)
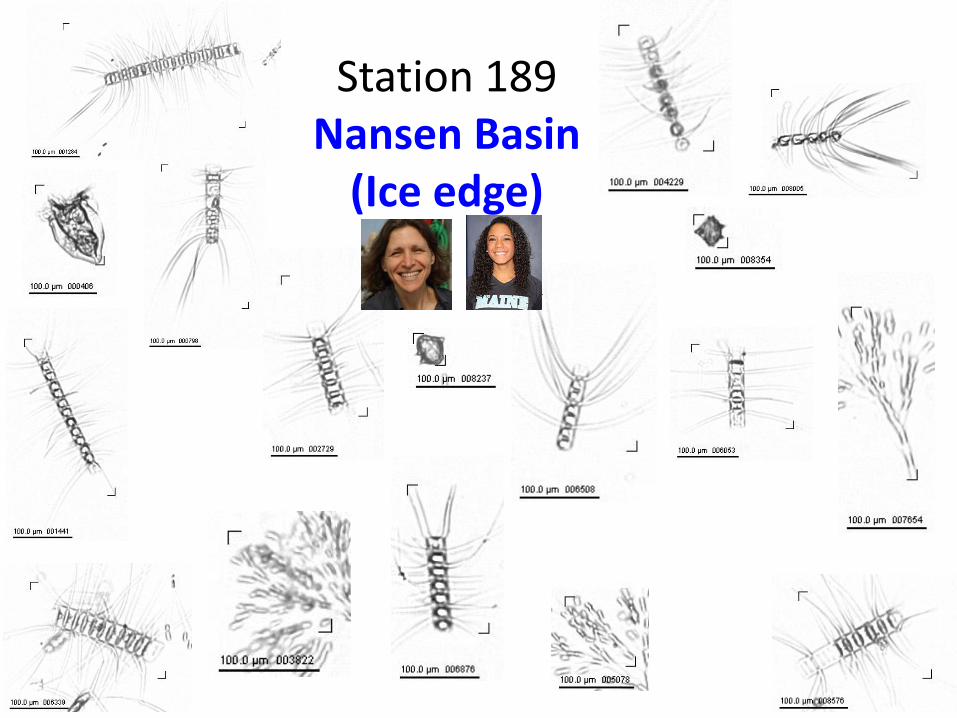
Station 189Nansen Basin
(Ice edge)

Data and Samples Collected:On Board and on Land


Tara-OCEANSIntegration Services & Data Products (ISDP)
Provides online tools and data products
Tara-OCEANSCentral Metadata Registry (CMR)
Provides metadata related to sample IDs
Data Archive
Flow of Samples / Files
Flow of Metadata
Flow of Raw Data
Flow of Processed Data
Users
Tara-OCEANS Sampling
Distributed Data Sources & their respective Data Archives
Ocean Optics
Tara-OCEANSCentral Data Repository (CDR)
Replicates selected data on a regular basis (FTP repository)
Data Archive
Oceanography
Data Archive
Zooscan
Data Archive
Flow cytometry
Data Archive
High-throughput Sequencing
Data Archive
High-throughputImaging
Other Registries (e.g. CoML, SeaDataNet,
WoRMS, NCBI,
GenBank)
Etc… Etc… Etc… Etc…

DATALocations where we have particulate absorption (95,000) and attenuation (72,000) 1km2-averaged spectra.

Tara data: where does it fit?
Single images
Bulk properties
genes
Presence/absence
Biogeochemistry
Ecology
Prey/Predator/symbiosis
EcosystemmodelsPigments
Biomass Rates
Biogeochemicalmodels
EnvironmentPhysics/chemistry

TARA OCEANS: Some results
Massive DNA sequencing @ Genoscope: Sampled > 1,000,000,000 ribosomal DNA sequences extracted form all eukaryotic samples, representing >1,000 planktonic communities.
Sequenced >100,000,000 bacterial genes, >50% new to science.
80 meta-genomes sequences – whole samples (virus <-> fish larvae)– notable: reached saturation.

Archaea
Bacteria
Eukaryotes
Viruses
Cross-kingdom interactions(454 data; 0.2-1.6 µm, 17 samples, 13 stations)
Spearman correlationsFDR < 0.05|Rho| > 0.7
=> 3700 correlations/edges (2.5%)=> 537 taxa (nodes)

Comparison with remote sensing
IOP variance – within satellite pixel variability
Werdell et al., 2013
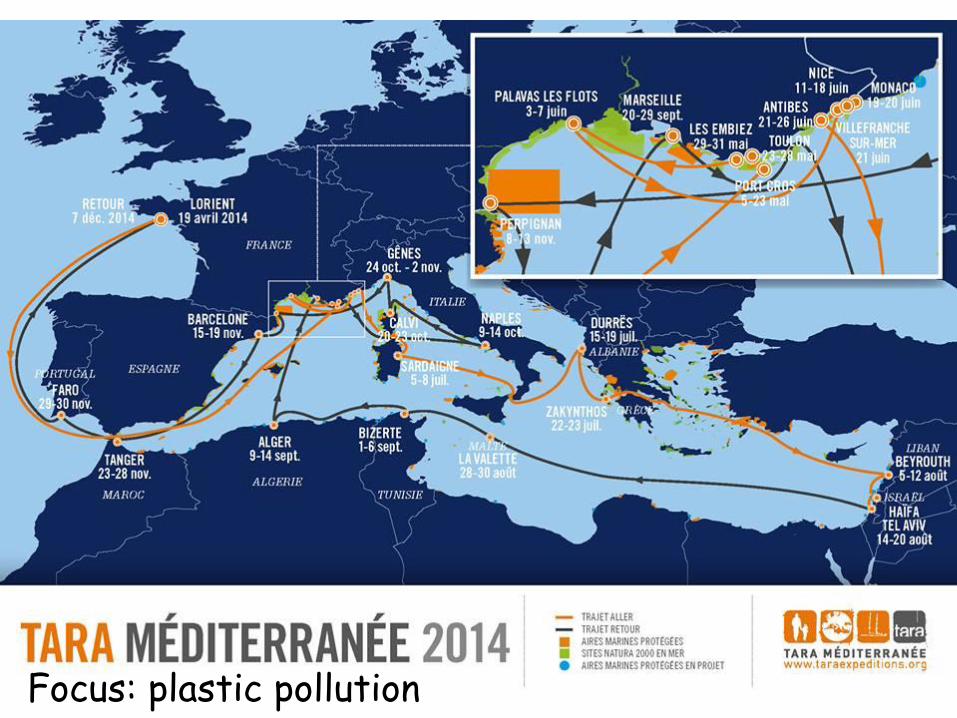
Focus: plastic pollution

Exhibitions
School visits
Reports
Films
Fashion Art

Anna Deniaud
Chasing the ice edge

Tara is at the table with the most influential international organizations
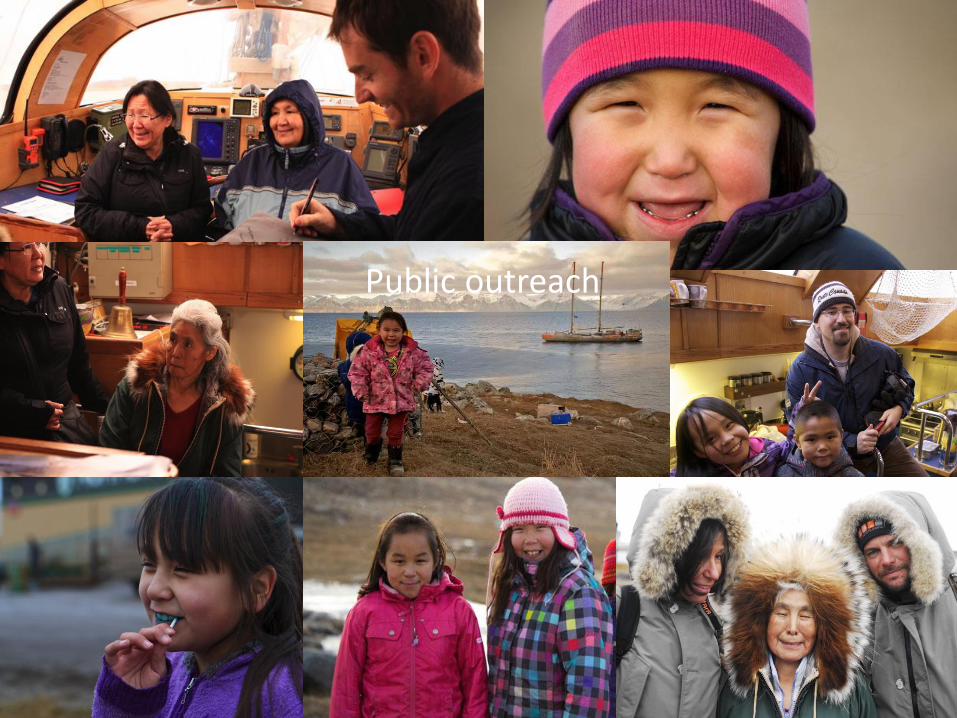
Public outreach

Summary:
I. In science, social skills are just as important as the three R’s.
II. Private funding allows more flexibility than public in the execution of your work. There is an added ‘cost’: need to educate non- specialists in the importance of your work.
III. Oceanography has lost its use of sail in research. Time to rethink.
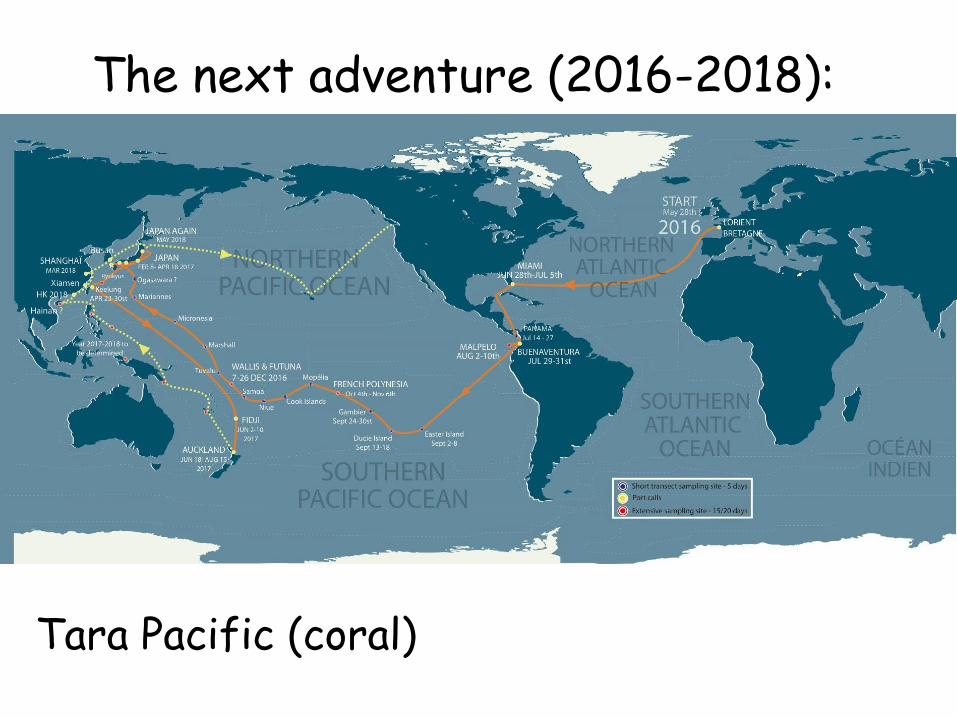
The next adventure (2016-2018):
Tara Pacific (coral)