Exploring the Solid Liquid Phase Change of an Adapted Dzugutov Model Using Generalized...
8
Exploring the Solid−Liquid Phase Change of an Adapted Dzugutov Model Using Generalized Replica Exchange Method Qing Lu, † Jaegil Kim, ‡,§ and John E. Straub* ,‡ † Division of Materials Science and Engineering, Boston University, Brookline, Massachusetts 02446, United States ‡ Department of Chemistry, Boston University, Boston, Massachusetts 02215, United States ABSTRACT: The generalized replica exchange method (gREM) is applied to simulate a solid− liquid phase change in an adapted Dzugutov model system. The idea of gREM is to incorporate the merit of sampling from a generalized ensemble into the replica exchange paradigm. The generalized ensemble weights are determined from effective temperatures tailored for this system, through an inverse mapping strategy. The ordered and disordered phases are smoothly joined together through a succession of unimodal energy distributions, providing a continuous transformation from an isotropic liquid into an amorphous solid phase under the given condition. The phase change temperature is determined by evaluation of various thermodynamic and structural order parameters. The increasing tendency for icosahedral local order under cooling is quantified using bond order parameters. The ergodic measure is used to demonstrate the advantage of gREM over the traditional temperature-based REM in sampling the phase change region. ■ INTRODUCTION The replica exchange method (REM) (or parallel tempering) 1,2 has been widely used in the computer simulation of diverse complex systems such as proteins, 3−8 glasses, 9−11 and atomic clusters, 12,13 where methods based on sampling the conven- tional canonical ensemble struggle to attain ergodic sampling over a rugged energy landscape characterized by multiple minima separated by high barriers. 14−16 In the standard temperature REM (tREM), a set of statistically independent canonical molecular dynamics (MD) or Monte Carlo (MC) simulations run in parallel at specified temperatures. The coupling of low- and high-temperature replicas via exchanges of configurations allows the low-temperature replicas to escape from trapped regions more easily, facilitating ergodic sampling. 13 While tREM has proven to be highly effective in equilibrium sampling of stable phase states, the standard tREM struggles to attain its maximum power in the vicinity of a first- order phase transition. 17 In moving across a strong phase change, canonical energy distributions are effectively disjointed and characterized by an energy gap corresponding to a latent heat. Since the acceptance probability of replica exchanges is determined by the energy overlap of neighboring replicas, an energy gap between P T<Tc (E) and P T>Tc (E) around the critical temperature T c , P T (E) being the canonical probability density function (PDF) at the temperature T, significantly impairs replica exchanges. The acceptance of replica exchanges for a pair of inverse temperatures, β and β′, close to β c = 1/T c , becomes exponentially suppressed as A(βE;β′E′) = min- [1,e Δβ(E ′ −E) ] ≈ e −|ΔβΔE| , where Δβ = β′ − β and ΔE is the energy gap. The generalized REM (gREM) 18 has been developed to restore the full power of replica exchange by incorporating noncanonical ensembles into the replica exchange paradigm. The generalized ensemble sampling weights are determined from tailored effective temperatures through an inverse mapping strategy. Illustrative simulations on a Potts spin system with varying system size and simulation conditions demonstrated a comprehensive sampling for phase- coexistent states with a dramatic acceleration of tunneling transitions. 18 We apply gREM to explore the phase change properties of an adapted Dzutugov model system. The MD simulation of this simple monatomic system was reported by Elenius and Dzugutov. 19 Their results demonstrated that upon constant- density cooling toward a critical point, the isotropic liquid is continuously transformed into a low-density phase with a mesoscopic order similar to that of a smectic liquid crystal. In this work, we test the effectiveness of gREM for achieving enhanced sampling while exploring thermodynamic changes and structural transformations associated with the phase change. ■ METHODS gREM in the Isothermal−Isobaric Ensemble. gREM 18 combines generalized ensembles with replica exchanges in order to restore the full power of replica exchange in the vicinity of a strong phase transition. To handle volume fluctuations in solid−liquid phase change here we extend gREM to the isothermal−isobaric ensemble. In contrast to the NVT ensemble where the internal energy, E, of the system is a natural dynamic variable at the fixed volume V, the enthalpy H = E + PV, which describes the thermal energy change when a Special Issue: Macromolecular Systems Understood through Multi- scale and Enhanced Sampling Techniques Received: January 12, 2012 Revised: March 21, 2012 Published: March 27, 2012 Article pubs.acs.org/JPCB © 2012 American Chemical Society 8654 dx.doi.org/10.1021/jp300406c | J. Phys. Chem. B 2012, 116, 8654−8661
Transcript of Exploring the Solid Liquid Phase Change of an Adapted Dzugutov Model Using Generalized...
Exploring the Solid−Liquid Phase Change of an Adapted DzugutovModel Using Generalized Replica Exchange MethodQing Lu,† Jaegil Kim,‡,§ and John E. Straub*,‡
†Division of Materials Science and Engineering, Boston University, Brookline, Massachusetts 02446, United States‡Department of Chemistry, Boston University, Boston, Massachusetts 02215, United States
ABSTRACT: The generalized replica exchange method (gREM) is applied to simulate a solid−liquid phase change in an adapted Dzugutov model system. The idea of gREM is to incorporate themerit of sampling from a generalized ensemble into the replica exchange paradigm. The generalizedensemble weights are determined from effective temperatures tailored for this system, through aninverse mapping strategy. The ordered and disordered phases are smoothly joined together througha succession of unimodal energy distributions, providing a continuous transformation from anisotropic liquid into an amorphous solid phase under the given condition. The phase changetemperature is determined by evaluation of various thermodynamic and structural order parameters.The increasing tendency for icosahedral local order under cooling is quantified using bond orderparameters. The ergodic measure is used to demonstrate the advantage of gREM over the traditionaltemperature-based REM in sampling the phase change region.
■ INTRODUCTIONThe replica exchange method (REM) (or parallel tempering)1,2
has been widely used in the computer simulation of diversecomplex systems such as proteins,3−8 glasses,9−11 and atomicclusters,12,13 where methods based on sampling the conven-tional canonical ensemble struggle to attain ergodic samplingover a rugged energy landscape characterized by multipleminima separated by high barriers.14−16 In the standardtemperature REM (tREM), a set of statistically independentcanonical molecular dynamics (MD) or Monte Carlo (MC)simulations run in parallel at specified temperatures. Thecoupling of low- and high-temperature replicas via exchanges ofconfigurations allows the low-temperature replicas to escapefrom trapped regions more easily, facilitating ergodicsampling.13 While tREM has proven to be highly effective inequilibrium sampling of stable phase states, the standard tREMstruggles to attain its maximum power in the vicinity of a first-order phase transition.17 In moving across a strong phasechange, canonical energy distributions are effectively disjointedand characterized by an energy gap corresponding to a latentheat. Since the acceptance probability of replica exchanges isdetermined by the energy overlap of neighboring replicas, anenergy gap between PT<Tc(E) and PT>Tc(E) around the criticaltemperature Tc , PT(E) being the canonical probability densityfunction (PDF) at the temperature T, significantly impairsreplica exchanges. The acceptance of replica exchanges for apair of inverse temperatures, β and β′, close to βc = 1/Tc ,becomes exponentially suppressed as A(βE;β′E′) = min-[1,eΔβ(E′−E)] ≈ e−|ΔβΔE|, where Δβ = β′ − β and ΔE is theenergy gap. The generalized REM (gREM)18 has beendeveloped to restore the full power of replica exchange byincorporating noncanonical ensembles into the replicaexchange paradigm. The generalized ensemble samplingweights are determined from tailored effective temperatures
through an inverse mapping strategy. Illustrative simulations ona Potts spin system with varying system size and simulationconditions demonstrated a comprehensive sampling for phase-coexistent states with a dramatic acceleration of tunnelingtransitions.18
We apply gREM to explore the phase change properties of anadapted Dzutugov model system. The MD simulation of thissimple monatomic system was reported by Elenius andDzugutov.19 Their results demonstrated that upon constant-density cooling toward a critical point, the isotropic liquid iscontinuously transformed into a low-density phase with amesoscopic order similar to that of a smectic liquid crystal. Inthis work, we test the effectiveness of gREM for achievingenhanced sampling while exploring thermodynamic changesand structural transformations associated with the phasechange.
■ METHODSgREM in the Isothermal−Isobaric Ensemble. gREM18
combines generalized ensembles with replica exchanges inorder to restore the full power of replica exchange in thevicinity of a strong phase transition. To handle volumefluctuations in solid−liquid phase change here we extendgREM to the isothermal−isobaric ensemble. In contrast to theNVT ensemble where the internal energy, E, of the system is anatural dynamic variable at the fixed volume V, the enthalpy H= E + PV, which describes the thermal energy change when a
Special Issue: Macromolecular Systems Understood through Multi-scale and Enhanced Sampling Techniques
Received: January 12, 2012Revised: March 21, 2012Published: March 27, 2012
Article
pubs.acs.org/JPCB
© 2012 American Chemical Society 8654 dx.doi.org/10.1021/jp300406c | J. Phys. Chem. B 2012, 116, 8654−8661
process occurs at constant pressure, P, becomes the keydynamical variable in the NPT ensemble.Around the phase change region, the enthalpy distribution,
Pα(H), becomes bimodal due to a large energy or volume gapseparating two phases, where α denotes a replica index.Sampling unstable or metastable, phase-mixed configurationsbecomes a rare event due to a large free energy barrier. Thefundamental idea of an isothermal−isobaric gREM is tosystematically design a set of generalized ensembles, Wα(H),so that unstable or metastable enthalpy states corresponding tothe phase change region are transformed into stable ones,resulting in a unimodal Pα(H). In the most general case, theenthalpy distribution associated with Wα is determined as
= Ωα αP H H W H( ) ( ) ( ) (1)
where Ω(H) is the density of states in enthalpy defined by∫ δ[H(E(r),V) − H]dr dV. By defining an isobaric entropy,S(H) = ln Ω(H) (kB = 1), analogous to the entropy in themicrocanonical ensemble, eq 1 further transforms intoexp{S(H) − wα(H)} = exp{−β α(H)}, α(H) being thegeneralized free enthalpy density and wα being the generalizedeffective potential. The generalized partition function isobtained as Zα(β) = ∫ dHe−βFα(H).The key quantity in the isothermal−isobaric gREM is the
effective temperature, Tα(H;λα) = [∂wα/∂H]−1, which com-
pletely determines the generalized sampling weight up to aconstant through the inverse mapping relation
∫= − ′ λ′α
α αW H
T HH( ) ln
1( ; )
d(2)
where λα is a set of parameters characterizing the effectivetemperature. It is possible to identify conditions for theeffective temperature ensuring that the underlying unstablestate will be transformed into the stable enthalpy state with aunimodal PDF, Pα(H).A necessary and sufficient condition on Tα(H;λα) is derived
by identifying an extremum, Hα*, of a generalized free enthalpydensity, β α(H) = S(H) − wα(H),
* λ = * = *α α α α αT H T H T( ; ) ( )S (3)
where TS(H) = [∂S/∂H]−1 is the statistical temperature inenthalpy analogous to the statistical temperature in themicrocanonical ensemble, and Hα* is the crossing pointbetween Tα(H) and TS(H). By identifying a stability condition
β ″ * = γ − γ *α α α αH T( ) ( )/S2
(4)
where γs = TS′(Hα*), γα = Tα′(Hα*), and the prime denotesdifferentiation with respect to H, we find that a unimodal PDFcan arise about the unique crossing point, Hα*, between TS(H)and Tα(H;λα), subject to the condition that γα(Hα*) < γS(Hα*).In the isothermal−isobaric gREM, exchange between
neighboring replicas is performed where replicas representnoncanonical ensembles characterized by the effective temper-ature Tα(H;λα)(α = 1, 2, ..., M). As the parameter λα varies,Tα(H;λα) covers a range of temperature between T1 and TM,the lowest and highest temperature, respectively. On the basisof the one-to-one correspondence, the sampling weightWα(H,λα) is completely determined by the inverse mappingin eq 2.The simplest parametrization scheme for forming stable
crossing points between Tα(H;λα) and TS(H) is to align lineareffective temperatures in parallel with the constant slope, γ, as
λ = λ + γ −α α αT H H H( ; ) ( )0 (5)
the control parameter λα being the T-intercept at an arbitrarilychosen H0. To form the unique stable crossing point Hα* ineach replica, γ must be less than the minimum slope γS
min, γSmin =
min{TS′(H)} being the minimum slope of TS(H) for thesampled enthalpy region. Since TS(H) monotonically increasesexcept for the phase change region, in most cases a proper γ iseasily guessed from the approximate TS(H) by connecting a fewpoints of [H(T),T], H(T) being an average enthalpy of a shortcanonical run at T. For example, γ can be simply chosen as γ =(TM − T1)/ (H1 − HM), T1 and TM being the lowest andhighest temperature, and Hα = H(Tα).Once γ is fixed, the dynamic range of λα is determined to
cover the interesting temperature range between T1 and TM asλ1 = T1 and λM = TM − γ(HM − H1), with H0 = H1. The firstand Mth effective temperatures are chosen to cross [H1,T1] and[HM, TM], respectively. The intermediate values of λα (1 < α <M) are determined by equally dividing the parameter space as
λ = λ + α − Δλα ( 1)1 (6)
and Δλ = (λM − λ1)/(M − 1).Interestingly, the linear effective temperature of eq 5
produces a generic form of the Tsallis weight20−22
λ ∼ λ + γ −α α α− γW H H H( ; ) [ ( )]0
1/(7)
Identifying γ and λα by (q − 1) and βα−1, respectively, q being
the nonextensivity parameter, recovers the original form of theTsallis weight proposed in nonextensive statistical mechanics.20
The gREM with a linear effective temperature of eq 5 isequivalent to the Tsallis-weight-based REM, which has beenexploited previously in the form of the generalized paralleltempering (GPT),23 q-REM,24 and Tsallis-REM algorithms.25
Detailed simulation protocols of the gREM are defined bythe following three steps:(i) Perform short canonical runs at several temperatures
between T1 and TM to determine the data set, [Hα, Tα]. Select aproper γ to be less than γS
min, and determine λα by employing eq6 between λ1 = T1 and λM = TM − γ(HM − H1), with H0 = H1.(ii) Run the gREM simulation in each replica by making trial
moves in configuration space with the acceptance probability
→ ′ = ′−α αA x x( ) min[1, e ]w H w Hintra
( ) ( )(8)
Every fixed time step, attempt a replica exchange betweenneighboring replicas with the acceptance
α ′ = ΔαA xx( ; ) min[1, exp( )]inter (9)
Δα = wα+1(H′) − wα+1(H) + wα(H) − wα(H′).(iii) Once a sufficiently long production run has been
performed, calculate the entropy estimate S (H) by joiningmultiple generalized ensemble runs via the weighted histogramanalysis method (WHAM)26 or the recently developedstatistical temperature weighted histogram analysis method(ST-WHAM).27
In the canonical MC runs, the temperatures of the replicasare uniformly distributed between the lowest and highesttemperature T1 and TM. The initial configurations for eachreplica are prepared by first equilibrating the system at hightemperature, and then gradually cooling the system until itreaches the temperature of that replica. In other words, insteadof one initial structure for all replicas, a set of initial structures isused according to the temperature of each replica.
The Journal of Physical Chemistry B Article
dx.doi.org/10.1021/jp300406c | J. Phys. Chem. B 2012, 116, 8654−86618655
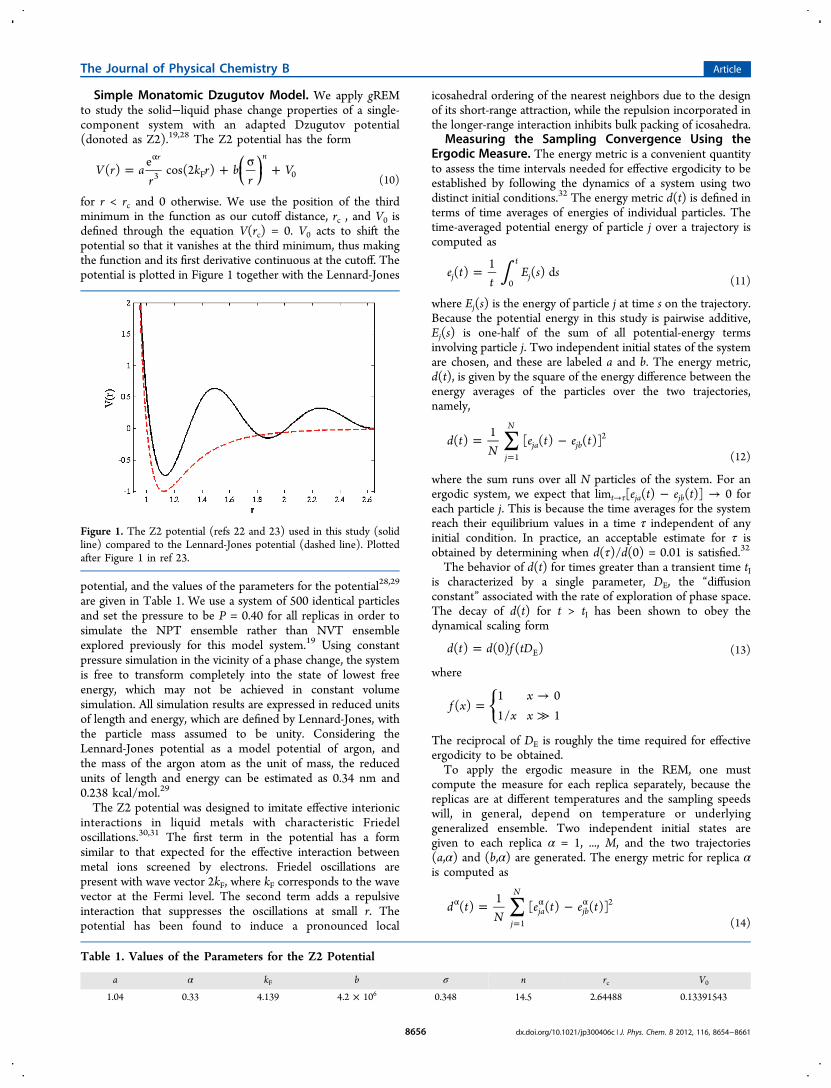
Simple Monatomic Dzugutov Model. We apply gREMto study the solid−liquid phase change properties of a single-component system with an adapted Dzugutov potential(donoted as Z2).19,28 The Z2 potential has the form
= + σ +α
⎜ ⎟⎛⎝
⎞⎠V r a
rk r b
rV( )
ecos(2 )
r n
3 F 0 (10)
for r < rc and 0 otherwise. We use the position of the thirdminimum in the function as our cutoff distance, rc , and V0 isdefined through the equation V(rc) = 0. V0 acts to shift thepotential so that it vanishes at the third minimum, thus makingthe function and its first derivative continuous at the cutoff. Thepotential is plotted in Figure 1 together with the Lennard-Jones
potential, and the values of the parameters for the potential28,29
are given in Table 1. We use a system of 500 identical particlesand set the pressure to be P = 0.40 for all replicas in order tosimulate the NPT ensemble rather than NVT ensembleexplored previously for this model system.19 Using constantpressure simulation in the vicinity of a phase change, the systemis free to transform completely into the state of lowest freeenergy, which may not be achieved in constant volumesimulation. All simulation results are expressed in reduced unitsof length and energy, which are defined by Lennard-Jones, withthe particle mass assumed to be unity. Considering theLennard-Jones potential as a model potential of argon, andthe mass of the argon atom as the unit of mass, the reducedunits of length and energy can be estimated as 0.34 nm and0.238 kcal/mol.29
The Z2 potential was designed to imitate effective interionicinteractions in liquid metals with characteristic Friedeloscillations.30,31 The first term in the potential has a formsimilar to that expected for the effective interaction betweenmetal ions screened by electrons. Friedel oscillations arepresent with wave vector 2kF, where kF corresponds to the wavevector at the Fermi level. The second term adds a repulsiveinteraction that suppresses the oscillations at small r. Thepotential has been found to induce a pronounced local
icosahedral ordering of the nearest neighbors due to the designof its short-range attraction, while the repulsion incorporated inthe longer-range interaction inhibits bulk packing of icosahedra.
Measuring the Sampling Convergence Using theErgodic Measure. The energy metric is a convenient quantityto assess the time intervals needed for effective ergodicity to beestablished by following the dynamics of a system using twodistinct initial conditions.32 The energy metric d(t) is defined interms of time averages of energies of individual particles. Thetime-averaged potential energy of particle j over a trajectory iscomputed as
∫=e tt
E s s( )1
( ) dj
t
j0 (11)
where Ej(s) is the energy of particle j at time s on the trajectory.Because the potential energy in this study is pairwise additive,Ej(s) is one-half of the sum of all potential-energy termsinvolving particle j. Two independent initial states of the systemare chosen, and these are labeled a and b. The energy metric,d(t), is given by the square of the energy difference between theenergy averages of the particles over the two trajectories,namely,
∑= −=
d tN
e t e t( )1
[ ( ) ( )]j
N
ja jb1
2
(12)
where the sum runs over all N particles of the system. For anergodic system, we expect that limt→τ[eja(t) − ejb(t)] → 0 foreach particle j. This is because the time averages for the systemreach their equilibrium values in a time τ independent of anyinitial condition. In practice, an acceptable estimate for τ isobtained by determining when d(τ)/d(0) = 0.01 is satisfied.32
The behavior of d(t) for times greater than a transient time tIis characterized by a single parameter, DE, the “diffusionconstant” associated with the rate of exploration of phase space.The decay of d(t) for t > tI has been shown to obey thedynamical scaling form
=d t d f tD( ) (0) ( )E (13)
where
=→≫
⎧⎨⎩f xx
x x( )
1 01/ 1
The reciprocal of DE is roughly the time required for effectiveergodicity to be obtained.To apply the ergodic measure in the REM, one must
compute the measure for each replica separately, because thereplicas are at different temperatures and the sampling speedswill, in general, depend on temperature or underlyinggeneralized ensemble. Two independent initial states aregiven to each replica α = 1, ..., M, and the two trajectories(a,α) and (b,α) are generated. The energy metric for replica αis computed as
∑= −α
=
α αd tN
e t e t( )1
[ ( ) ( )]j
N
ja jb1
2
(14)
Figure 1. The Z2 potential (refs 22 and 23) used in this study (solidline) compared to the Lennard-Jones potential (dashed line). Plottedafter Figure 1 in ref 23.
Table 1. Values of the Parameters for the Z2 Potential
a α kF b σ n rc V0
1.04 0.33 4.139 4.2 × 10⁶ 0.348 14.5 2.64488 0.13391543
The Journal of Physical Chemistry B Article
dx.doi.org/10.1021/jp300406c | J. Phys. Chem. B 2012, 116, 8654−86618656
where ejaα is the time averaged energy of particle j, computed
using eq 11, and the superscript α indicates replica α.Probing Structure Change Using Pair Distribution
Functions. The radial distribution function is computed fromthe simulation trajectories as
∑ ∑=ρ
δ −= ≠
g rN
r r( )1
( )i j i
ij0 1 (15)
where ρ0 is the bulk density, rij is the distance between atom iand j, and ⟨···⟩ denotes an ensemble average.Let us denote the first minimum of g(r) as r1. The
coordination number, which is the average number ofneighbors, CN, up to a distance r1, can be computed as33
∫= πρCN r g r r4 ( ) dr
0 0
2c
(16)
since the area under the first peak of g(r) is proportional to thenumber of particles in the first coordination shell.The static structure factor S(Q) is the Fourier transform of
the radial distribution function g(r)34,35 according to
∫= + πρ −⎛⎝⎜
⎞⎠⎟S Q r
QrQr
g r r( ) 1 4sin( )
[ ( ) 1] dL
0 0
2
(17)
The wave vector Q is defined as Q = 2πk/L, where k is aninteger that ranges from 1 to N, N is the total number ofparticles, and L is the length of the periodic boundary box.S(Q) provides a measure of the correlation length of thedensity fluctuations.Identifying Structural Symmetry through Bond
Orientational Order Parameters. Bond orientational orderparameters36−38 based on spherical harmonics, also known asSteinhardt order parameters, are often used to determinecrystal structures in molecular simulations. In computationalstudies of crystallization from an undercooled liquid, one mustdistinguish particles that are part of the crystal from those thatbelong to the liquid. Ideally, such an assignment is based on thelocal environment of the particles only. One method, which isindependent of the specific crystal structure and does notrequire the definition of a reference frame, is provided by thefollowing algorithm based on spherical harmonics.The complex vector qlm(i) of particle i is defined as qlm(i) =
1/(Nb(i))∑j=1Nb(i)Ylm(rij), where, Nb(i) is the number of nearest
neighbors of particle i, the functions Ylm(rij) are the sphericalharmonics, and rij is the vector from particle i to particle j. Tomake the order parameters invariant with respect to rotations ofthe reference frame, the third-order invariants are defined as
∑=+ + =
⎛⎝⎜
⎞⎠⎟w i
l l lm m m q i q i q i( ) ( ) ( ) ( )l
m m mlm lm lm
0 1 2 31 2 3
1 2 3
(18)
where the coefficients (···) are the Wigner 3j symbols. We referto the normalized quantity
≡∑ | |
wwq( )l
l
m lm2 3/2
(19)
Using this approach, one can determine the type of crystallinestructure occurring around each individual particle.Determining Thermodynamic Quantities Using ST-
WHAM Analysis. We employ a recently developed iteration-free approach to solve the WHAM equations in terms of
intensive variables. This numerical approach, the ST-WHAM,27
yields the inverse temperature βS = ∂S/∂H directly from a novelform of the WHAM equations. The statistical temperature isthen computed as TS = 1/βS. Thermodynamic quantitiesincluding the entropy can be evaluated upon numericalintegration of this statistical temperature. Once the entropy isdetermined, all other canonical thermodynamic properties canbe computed, including the specific heat Cp, which can becomputed as Cp = T(∂S/∂T)p.
■ RESULTS AND DISCUSSIONEffective Temperatures and Generalized Ensemble
Distributions. To determine the dynamic range of λα and theoptimal value of γ, we first performed short canonical MCsimulations for 2 × 10⁴ MC sweeps (MCS), at T1 = 0.3 and TM= 0.6, which determine H1 = −0.7157 and HM = 2.0128. OneMCS includes N trial moves, N is also the same as the numberof particles, and M is the total number of replicas (M = 31).The value of γ is computed as γ = (TM − T1)/(H1 − HM) ≈−0.11. Setting H0 = H1 in eq 5, the dynamic range of λα,between λ1 = T1 and λM = TM − γ(HM − H1), depends on γ.For γ = −0.11, λ1 ≈ 0.30 and λM ≈ 0.72.The generalized sampling weights can be determined by eq 7
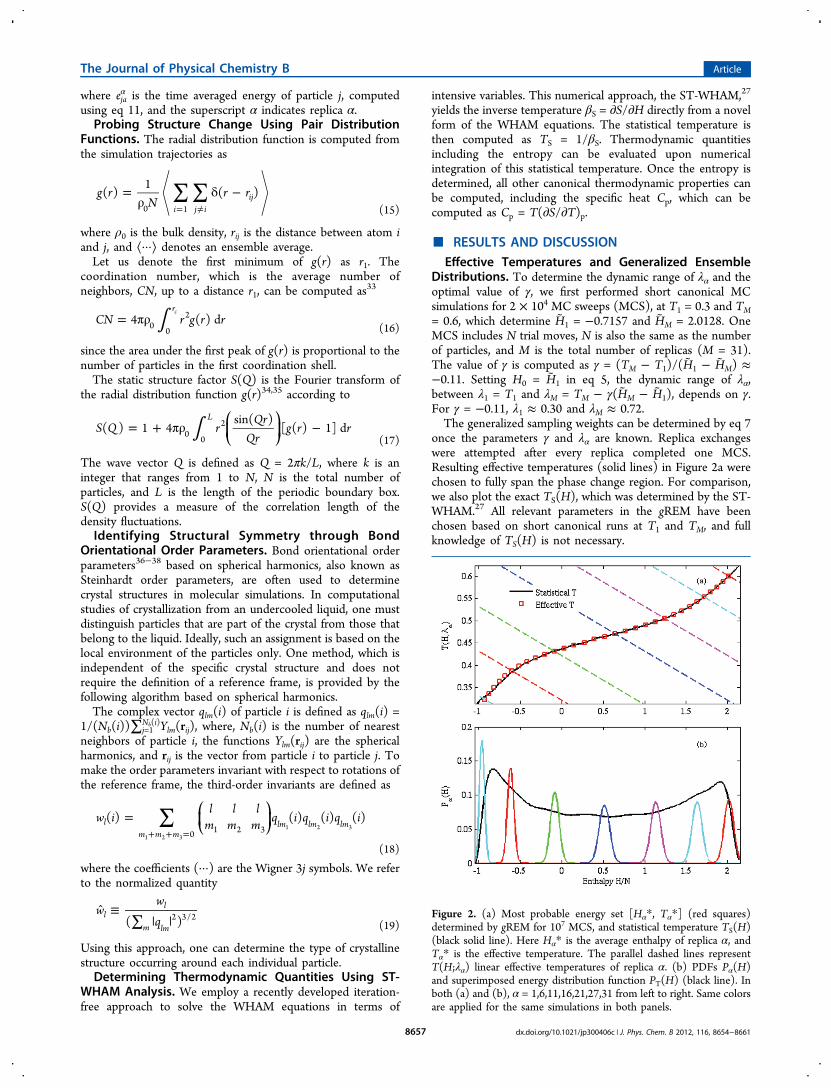
once the parameters γ and λα are known. Replica exchangeswere attempted after every replica completed one MCS.Resulting effective temperatures (solid lines) in Figure 2a werechosen to fully span the phase change region. For comparison,we also plot the exact TS(H), which was determined by the ST-WHAM.27 All relevant parameters in the gREM have beenchosen based on short canonical runs at T1 and TM, and fullknowledge of TS(H) is not necessary.
Figure 2. (a) Most probable energy set [Hα*, Tα*] (red squares)determined by gREM for 107 MCS, and statistical temperature TS(H)(black solid line). Here Hα* is the average enthalpy of replica α, andTα* is the effective temperature. The parallel dashed lines representT(H;λα) linear effective temperatures of replica α. (b) PDFs Pα(H)and superimposed energy distribution function PT(H) (black line). Inboth (a) and (b), α = 1,6,11,16,21,27,31 from left to right. Same colorsare applied for the same simulations in both panels.
The Journal of Physical Chemistry B Article
dx.doi.org/10.1021/jp300406c | J. Phys. Chem. B 2012, 116, 8654−86618657
Since Tα(H;λα) was designed to form a unique, stablecrossing point, Hα*, with TS(H), the resulting PDFs in Figure2b are rapidly localized around a given Hα* with a Gaussianshape, and naturally bridge between ordered and disorderedphases with unimodal energy distributions across the changeregion. Since Pα(H) is sharply peaked at Hα*, T(Hα*, λα) =TS(Hα*), the set of most probable energies, [Hα*, Tα*],asymptotically converges toward a locus of TS(H). Indeed, theprofile of [Hα*, Tα*] shows a perfect coincidence with TS(H)determined by ST-WHAM, and exactly corresponds to crossingpoints between TS(H) and Tα(H;λα) in Figure 2a. Forconvenience, the most probable energy Hα* was approximatedby the average energy summed over the αth replica.For each individual replica, the enthalpy distribution function
Pα(H) has a single peak around Hα* with a Gaussian shape.However, the superimposed enthalpy distribution, PT(H) = (1/M)∑αPα(H), shown in Figure 2b as a black curve, displays abimodal distribution. The locations of the two peakscorrespond to the solid state and liquid state, respectively.Despite the existence of the two peaks, PT(H) is flattened in theentire enthalpy range, which ensures a comprehensive samplingfor phase change region.Sampling Speed Evaluated Using the Ergodic Meas-
ure. We have demonstrated the effectiveness of gREM toachieve comprehensive sampling. In this section we examinethe sampling efficiency of gREM compared with traditionaltREM using ergodic measure to quantify the sampling speedand rate of convergence of thermodynamic averages.The energy metric and reciprocal metric are computed using
eqs 11 and 12 by following two sets of energy trajectories withtwo independent initial conditions. As stated earlier, the energymetric for an ergodic system is expected to behave as d(t)/d(0)= 1/DEt so that the reciprocal metric scales as d(0)/d(t) = DEt.The diffusion constant, DE, measures the sampling speed inphase space. Our results in Figure 3 confirm that the reciprocal
metric is a linear function of time for both tREM and gREM,and the slope of the reciprocal metric of gREM, which gives thediffusion constant DE, is nearly 2 times greater than that oftREM.We computed the diffusion constants DE(α) of all replicas (α
= 1, ..., M) for tREM and gREM. In tREM, the temperature of
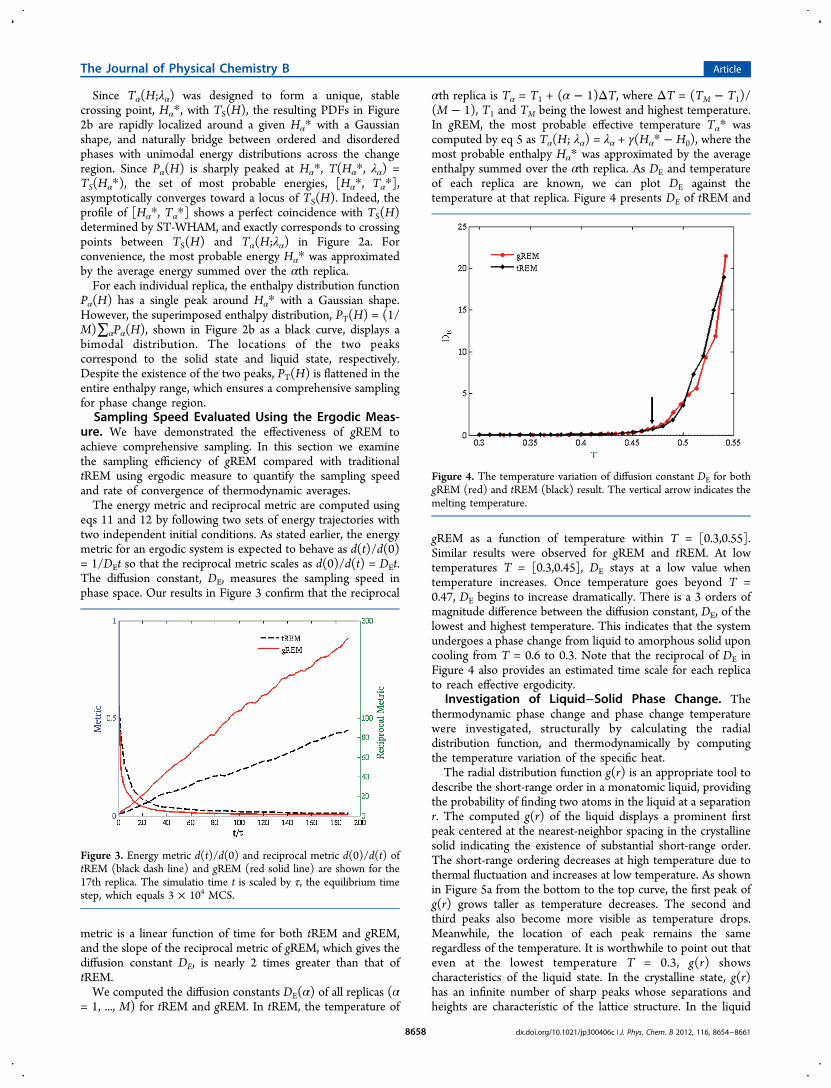
αth replica is Tα = T1 + (α − 1)ΔT, where ΔT = (TM − T1)/(M − 1), T1 and TM being the lowest and highest temperature.In gREM, the most probable effective temperature Tα* wascomputed by eq 5 as Tα(H; λα) = λα + γ(Hα* − H0), where themost probable enthalpy Hα* was approximated by the averageenthalpy summed over the αth replica. As DE and temperatureof each replica are known, we can plot DE against thetemperature at that replica. Figure 4 presents DE of tREM and
gREM as a function of temperature within T = [0.3,0.55].Similar results were observed for gREM and tREM. At lowtemperatures T = [0.3,0.45], DE stays at a low value whentemperature increases. Once temperature goes beyond T =0.47, DE begins to increase dramatically. There is a 3 orders ofmagnitude difference between the diffusion constant, DE, of thelowest and highest temperature. This indicates that the systemundergoes a phase change from liquid to amorphous solid uponcooling from T = 0.6 to 0.3. Note that the reciprocal of DE inFigure 4 also provides an estimated time scale for each replicato reach effective ergodicity.
Investigation of Liquid−Solid Phase Change. Thethermodynamic phase change and phase change temperaturewere investigated, structurally by calculating the radialdistribution function, and thermodynamically by computingthe temperature variation of the specific heat.The radial distribution function g(r) is an appropriate tool to
describe the short-range order in a monatomic liquid, providingthe probability of finding two atoms in the liquid at a separationr. The computed g(r) of the liquid displays a prominent firstpeak centered at the nearest-neighbor spacing in the crystallinesolid indicating the existence of substantial short-range order.The short-range ordering decreases at high temperature due tothermal fluctuation and increases at low temperature. As shownin Figure 5a from the bottom to the top curve, the first peak ofg(r) grows taller as temperature decreases. The second andthird peaks also become more visible as temperature drops.Meanwhile, the location of each peak remains the sameregardless of the temperature. It is worthwhile to point out thateven at the lowest temperature T = 0.3, g(r) showscharacteristics of the liquid state. In the crystalline state, g(r)has an infinite number of sharp peaks whose separations andheights are characteristic of the lattice structure. In the liquid
Figure 3. Energy metric d(t)/d(0) and reciprocal metric d(0)/d(t) oftREM (black dash line) and gREM (red solid line) are shown for the17th replica. The simulatio time t is scaled by τ, the equilibrium timestep, which equals 3 × 10⁴ MCS.
Figure 4. The temperature variation of diffusion constant DE for bothgREM (red) and tREM (black) result. The vertical arrow indicates themelting temperature.
The Journal of Physical Chemistry B Article
dx.doi.org/10.1021/jp300406c | J. Phys. Chem. B 2012, 116, 8654−86618658
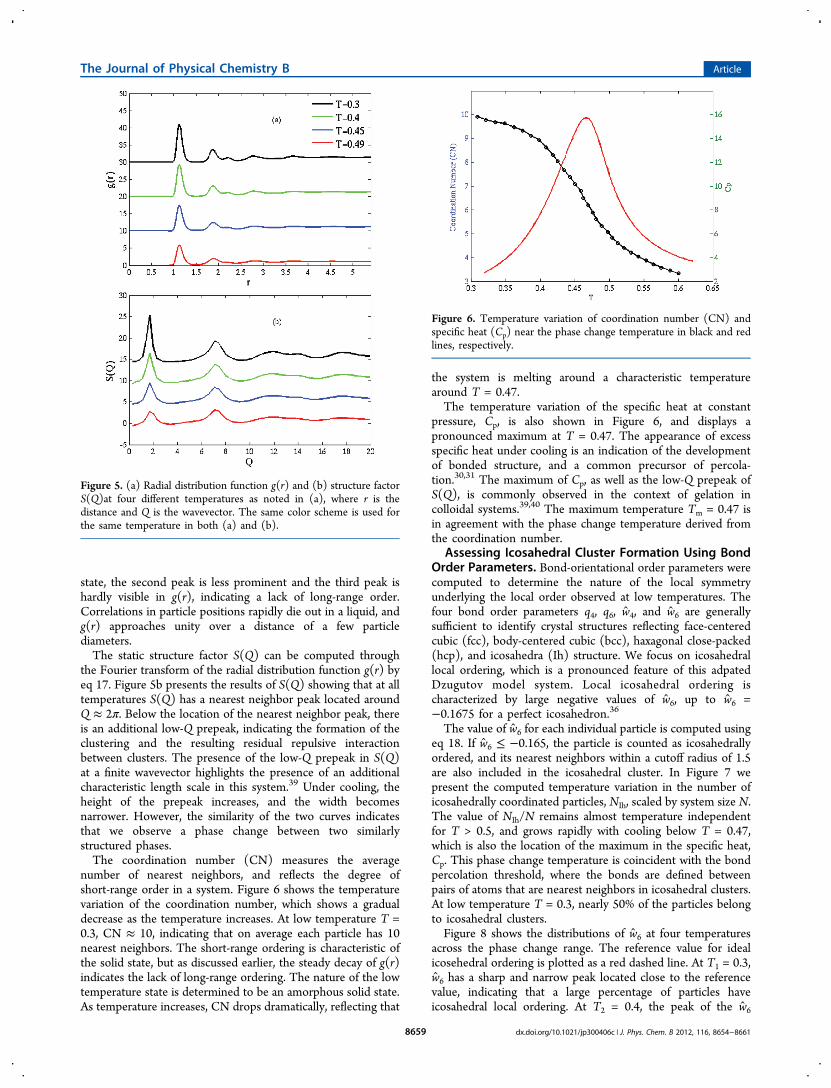
state, the second peak is less prominent and the third peak ishardly visible in g(r), indicating a lack of long-range order.Correlations in particle positions rapidly die out in a liquid, andg(r) approaches unity over a distance of a few particlediameters.The static structure factor S(Q) can be computed through
the Fourier transform of the radial distribution function g(r) byeq 17. Figure 5b presents the results of S(Q) showing that at alltemperatures S(Q) has a nearest neighbor peak located aroundQ ≈ 2π. Below the location of the nearest neighbor peak, thereis an additional low-Q prepeak, indicating the formation of theclustering and the resulting residual repulsive interactionbetween clusters. The presence of the low-Q prepeak in S(Q)at a finite wavevector highlights the presence of an additionalcharacteristic length scale in this system.39 Under cooling, theheight of the prepeak increases, and the width becomesnarrower. However, the similarity of the two curves indicatesthat we observe a phase change between two similarlystructured phases.The coordination number (CN) measures the average
number of nearest neighbors, and reflects the degree ofshort-range order in a system. Figure 6 shows the temperaturevariation of the coordination number, which shows a gradualdecrease as the temperature increases. At low temperature T =0.3, CN ≈ 10, indicating that on average each particle has 10nearest neighbors. The short-range ordering is characteristic ofthe solid state, but as discussed earlier, the steady decay of g(r)indicates the lack of long-range ordering. The nature of the lowtemperature state is determined to be an amorphous solid state.As temperature increases, CN drops dramatically, reflecting that
the system is melting around a characteristic temperaturearound T = 0.47.The temperature variation of the specific heat at constant
pressure, Cp, is also shown in Figure 6, and displays apronounced maximum at T = 0.47. The appearance of excessspecific heat under cooling is an indication of the developmentof bonded structure, and a common precursor of percola-tion.30,31 The maximum of Cp, as well as the low-Q prepeak ofS(Q), is commonly observed in the context of gelation incolloidal systems.39,40 The maximum temperature Tm = 0.47 isin agreement with the phase change temperature derived fromthe coordination number.
Assessing Icosahedral Cluster Formation Using BondOrder Parameters. Bond-orientational order parameters werecomputed to determine the nature of the local symmetryunderlying the local order observed at low temperatures. Thefour bond order parameters q4, q6, w4, and w6 are generallysufficient to identify crystal structures reflecting face-centeredcubic (fcc), body-centered cubic (bcc), haxagonal close-packed(hcp), and icosahedra (Ih) structure. We focus on icosahedrallocal ordering, which is a pronounced feature of this adpatedDzugutov model system. Local icosahedral ordering ischaracterized by large negative values of w6, up to w6 =−0.1675 for a perfect icosahedron.36
The value of w6 for each individual particle is computed usingeq 18. If w6 ≤ −0.165, the particle is counted as icosahedrallyordered, and its nearest neighbors within a cutoff radius of 1.5are also included in the icosahedral cluster. In Figure 7 wepresent the computed temperature variation in the number oficosahedrally coordinated particles, NIh, scaled by system size N.The value of NIh/N remains almost temperature independentfor T > 0.5, and grows rapidly with cooling below T = 0.47,which is also the location of the maximum in the specific heat,Cp. This phase change temperature is coincident with the bondpercolation threshold, where the bonds are defined betweenpairs of atoms that are nearest neighbors in icosahedral clusters.At low temperature T = 0.3, nearly 50% of the particles belongto icosahedral clusters.Figure 8 shows the distributions of w6 at four temperatures
across the phase change range. The reference value for idealicosehedral ordering is plotted as a red dashed line. At T1 = 0.3,w6 has a sharp and narrow peak located close to the referencevalue, indicating that a large percentage of particles haveicosahedral local ordering. At T2 = 0.4, the peak of the w6
Figure 5. (a) Radial distribution function g(r) and (b) structure factorS(Q)at four different temperatures as noted in (a), where r is thedistance and Q is the wavevector. The same color scheme is used forthe same temperature in both (a) and (b).
Figure 6. Temperature variation of coordination number (CN) andspecific heat (Cp) near the phase change temperature in black and redlines, respectively.
The Journal of Physical Chemistry B Article
dx.doi.org/10.1021/jp300406c | J. Phys. Chem. B 2012, 116, 8654−86618659
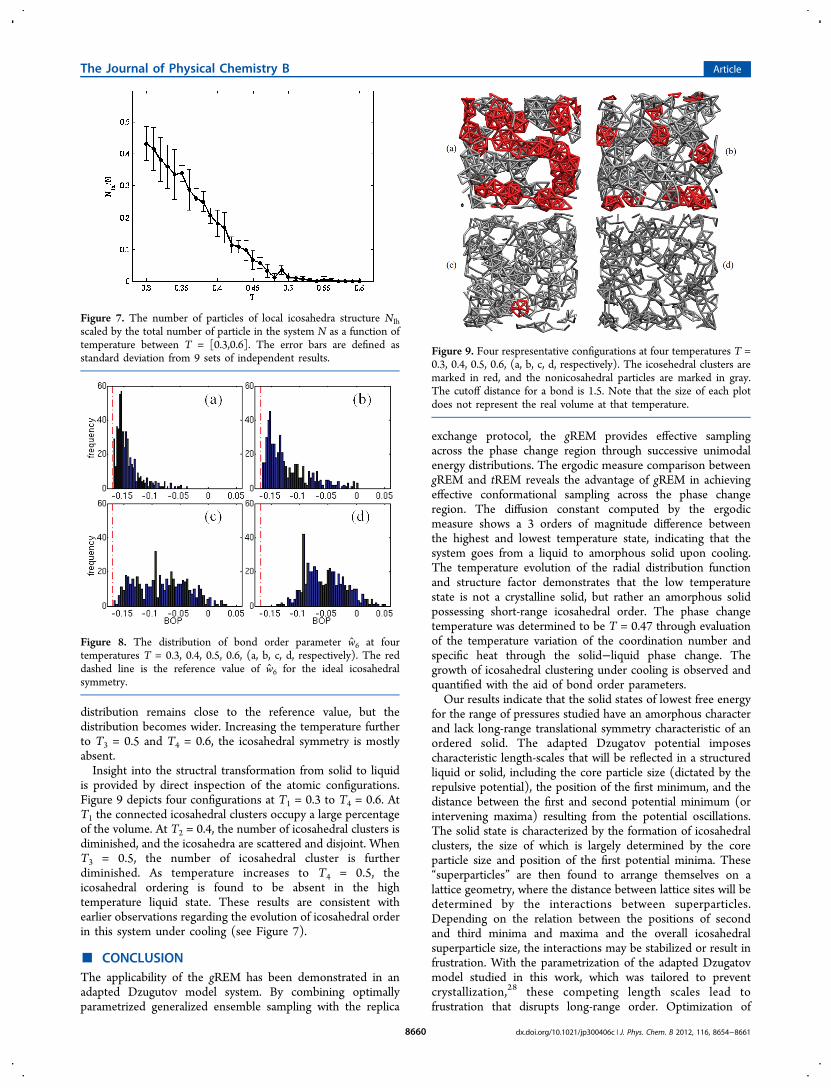
distribution remains close to the reference value, but thedistribution becomes wider. Increasing the temperature furtherto T3 = 0.5 and T4 = 0.6, the icosahedral symmetry is mostlyabsent.Insight into the structral transformation from solid to liquid
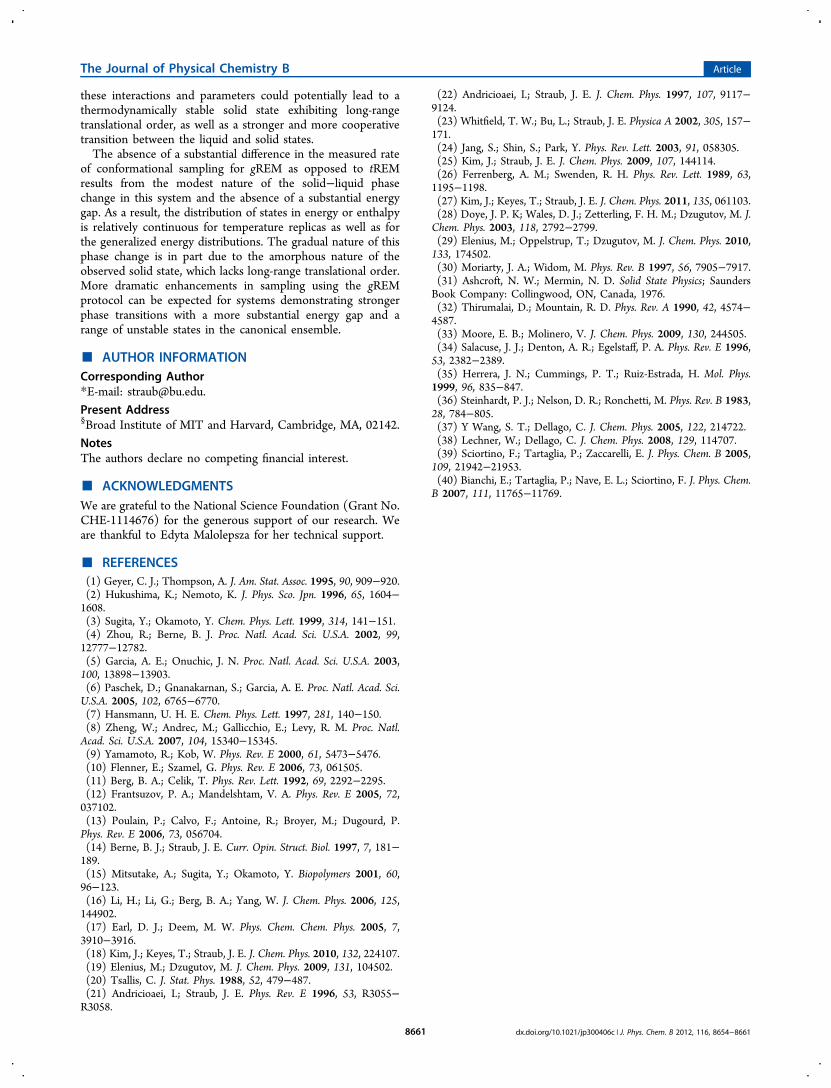
is provided by direct inspection of the atomic configurations.Figure 9 depicts four configurations at T1 = 0.3 to T4 = 0.6. AtT1 the connected icosahedral clusters occupy a large percentageof the volume. At T2 = 0.4, the number of icosahedral clusters isdiminished, and the icosahedra are scattered and disjoint. WhenT3 = 0.5, the number of icosahedral cluster is furtherdiminished. As temperature increases to T4 = 0.5, theicosahedral ordering is found to be absent in the hightemperature liquid state. These results are consistent withearlier observations regarding the evolution of icosahedral orderin this system under cooling (see Figure 7).
■ CONCLUSIONThe applicability of the gREM has been demonstrated in anadapted Dzugutov model system. By combining optimallyparametrized generalized ensemble sampling with the replica
exchange protocol, the gREM provides effective samplingacross the phase change region through successive unimodalenergy distributions. The ergodic measure comparison betweengREM and tREM reveals the advantage of gREM in achievingeffective conformational sampling across the phase changeregion. The diffusion constant computed by the ergodicmeasure shows a 3 orders of magnitude difference betweenthe highest and lowest temperature state, indicating that thesystem goes from a liquid to amorphous solid upon cooling.The temperature evolution of the radial distribution functionand structure factor demonstrates that the low temperaturestate is not a crystalline solid, but rather an amorphous solidpossessing short-range icosahedral order. The phase changetemperature was determined to be T = 0.47 through evaluationof the temperature variation of the coordination number andspecific heat through the solid−liquid phase change. Thegrowth of icosahedral clustering under cooling is observed andquantified with the aid of bond order parameters.Our results indicate that the solid states of lowest free energy
for the range of pressures studied have an amorphous characterand lack long-range translational symmetry characteristic of anordered solid. The adapted Dzugatov potential imposescharacteristic length-scales that will be reflected in a structuredliquid or solid, including the core particle size (dictated by therepulsive potential), the position of the first minimum, and thedistance between the first and second potential minimum (orintervening maxima) resulting from the potential oscillations.The solid state is characterized by the formation of icosahedralclusters, the size of which is largely determined by the coreparticle size and position of the first potential minima. These“superparticles” are then found to arrange themselves on alattice geometry, where the distance between lattice sites will bedetermined by the interactions between superparticles.Depending on the relation between the positions of secondand third minima and maxima and the overall icosahedralsuperparticle size, the interactions may be stabilized or result infrustration. With the parametrization of the adapted Dzugatovmodel studied in this work, which was tailored to preventcrystallization,28 these competing length scales lead tofrustration that disrupts long-range order. Optimization of
Figure 7. The number of particles of local icosahedra structure NIhscaled by the total number of particle in the system N as a function oftemperature between T = [0.3,0.6]. The error bars are defined asstandard deviation from 9 sets of independent results.
Figure 8. The distribution of bond order parameter w6 at fourtemperatures T = 0.3, 0.4, 0.5, 0.6, (a, b, c, d, respectively). The reddashed line is the reference value of w6 for the ideal icosahedralsymmetry.
Figure 9. Four respresentative configurations at four temperatures T =0.3, 0.4, 0.5, 0.6, (a, b, c, d, respectively). The icosehedral clusters aremarked in red, and the nonicosahedral particles are marked in gray.The cutoff distance for a bond is 1.5. Note that the size of each plotdoes not represent the real volume at that temperature.
The Journal of Physical Chemistry B Article
dx.doi.org/10.1021/jp300406c | J. Phys. Chem. B 2012, 116, 8654−86618660
these interactions and parameters could potentially lead to athermodynamically stable solid state exhibiting long-rangetranslational order, as well as a stronger and more cooperativetransition between the liquid and solid states.The absence of a substantial difference in the measured rate
of conformational sampling for gREM as opposed to tREMresults from the modest nature of the solid−liquid phasechange in this system and the absence of a substantial energygap. As a result, the distribution of states in energy or enthalpyis relatively continuous for temperature replicas as well as forthe generalized energy distributions. The gradual nature of thisphase change is in part due to the amorphous nature of theobserved solid state, which lacks long-range translational order.More dramatic enhancements in sampling using the gREMprotocol can be expected for systems demonstrating strongerphase transitions with a more substantial energy gap and arange of unstable states in the canonical ensemble.
■ AUTHOR INFORMATIONCorresponding Author*E-mail: [email protected] Address§Broad Institute of MIT and Harvard, Cambridge, MA, 02142.NotesThe authors declare no competing financial interest.
■ ACKNOWLEDGMENTSWe are grateful to the National Science Foundation (Grant No.CHE-1114676) for the generous support of our research. Weare thankful to Edyta Malolepsza for her technical support.
■ REFERENCES(1) Geyer, C. J.; Thompson, A. J. Am. Stat. Assoc. 1995, 90, 909−920.(2) Hukushima, K.; Nemoto, K. J. Phys. Sco. Jpn. 1996, 65, 1604−1608.(3) Sugita, Y.; Okamoto, Y. Chem. Phys. Lett. 1999, 314, 141−151.(4) Zhou, R.; Berne, B. J. Proc. Natl. Acad. Sci. U.S.A. 2002, 99,12777−12782.(5) Garcia, A. E.; Onuchic, J. N. Proc. Natl. Acad. Sci. U.S.A. 2003,100, 13898−13903.(6) Paschek, D.; Gnanakarnan, S.; Garcia, A. E. Proc. Natl. Acad. Sci.U.S.A. 2005, 102, 6765−6770.(7) Hansmann, U. H. E. Chem. Phys. Lett. 1997, 281, 140−150.(8) Zheng, W.; Andrec, M.; Gallicchio, E.; Levy, R. M. Proc. Natl.Acad. Sci. U.S.A. 2007, 104, 15340−15345.(9) Yamamoto, R.; Kob, W. Phys. Rev. E 2000, 61, 5473−5476.(10) Flenner, E.; Szamel, G. Phys. Rev. E 2006, 73, 061505.(11) Berg, B. A.; Celik, T. Phys. Rev. Lett. 1992, 69, 2292−2295.(12) Frantsuzov, P. A.; Mandelshtam, V. A. Phys. Rev. E 2005, 72,037102.(13) Poulain, P.; Calvo, F.; Antoine, R.; Broyer, M.; Dugourd, P.Phys. Rev. E 2006, 73, 056704.(14) Berne, B. J.; Straub, J. E. Curr. Opin. Struct. Biol. 1997, 7, 181−189.(15) Mitsutake, A.; Sugita, Y.; Okamoto, Y. Biopolymers 2001, 60,96−123.(16) Li, H.; Li, G.; Berg, B. A.; Yang, W. J. Chem. Phys. 2006, 125,144902.(17) Earl, D. J.; Deem, M. W. Phys. Chem. Chem. Phys. 2005, 7,3910−3916.(18) Kim, J.; Keyes, T.; Straub, J. E. J. Chem. Phys. 2010, 132, 224107.(19) Elenius, M.; Dzugutov, M. J. Chem. Phys. 2009, 131, 104502.(20) Tsallis, C. J. Stat. Phys. 1988, 52, 479−487.(21) Andricioaei, I.; Straub, J. E. Phys. Rev. E 1996, 53, R3055−R3058.
(22) Andricioaei, I.; Straub, J. E. J. Chem. Phys. 1997, 107, 9117−9124.(23) Whitfield, T. W.; Bu, L.; Straub, J. E. Physica A 2002, 305, 157−171.(24) Jang, S.; Shin, S.; Park, Y. Phys. Rev. Lett. 2003, 91, 058305.(25) Kim, J.; Straub, J. E. J. Chem. Phys. 2009, 107, 144114.(26) Ferrenberg, A. M.; Swenden, R. H. Phys. Rev. Lett. 1989, 63,1195−1198.(27) Kim, J.; Keyes, T.; Straub, J. E. J. Chem. Phys. 2011, 135, 061103.(28) Doye, J. P. K; Wales, D. J.; Zetterling, F. H. M.; Dzugutov, M. J.Chem. Phys. 2003, 118, 2792−2799.(29) Elenius, M.; Oppelstrup, T.; Dzugutov, M. J. Chem. Phys. 2010,133, 174502.(30) Moriarty, J. A.; Widom, M. Phys. Rev. B 1997, 56, 7905−7917.(31) Ashcroft, N. W.; Mermin, N. D. Solid State Physics; SaundersBook Company: Collingwood, ON, Canada, 1976.(32) Thirumalai, D.; Mountain, R. D. Phys. Rev. A 1990, 42, 4574−4587.(33) Moore, E. B.; Molinero, V. J. Chem. Phys. 2009, 130, 244505.(34) Salacuse, J. J.; Denton, A. R.; Egelstaff, P. A. Phys. Rev. E 1996,53, 2382−2389.(35) Herrera, J. N.; Cummings, P. T.; Ruiz-Estrada, H. Mol. Phys.1999, 96, 835−847.(36) Steinhardt, P. J.; Nelson, D. R.; Ronchetti, M. Phys. Rev. B 1983,28, 784−805.(37) Y Wang, S. T.; Dellago, C. J. Chem. Phys. 2005, 122, 214722.(38) Lechner, W.; Dellago, C. J. Chem. Phys. 2008, 129, 114707.(39) Sciortino, F.; Tartaglia, P.; Zaccarelli, E. J. Phys. Chem. B 2005,109, 21942−21953.(40) Bianchi, E.; Tartaglia, P.; Nave, E. L.; Sciortino, F. J. Phys. Chem.B 2007, 111, 11765−11769.
The Journal of Physical Chemistry B Article
dx.doi.org/10.1021/jp300406c | J. Phys. Chem. B 2012, 116, 8654−86618661