SLUDGE -SOLID -LIQUID
42
AN ABSTRACT OF THE THESIS OF CHARLES WILLIAM CODDINGTON for the M. S. in Civil Engineering (Name) (Degree) (Major) Date thesis is presented A 1 f / i,75' Title HIGH -SHEAR AND PRESSURE ACTIVATED SLUDGE TREAT- MENT- SOLID -LIQUID SEPARATION Abstract approved (Major professor) Since the development of the activated sludge process in 1913 many attempts have been made to improve it. One approach has been to increase the oxygen available to the bio -mass. This study com- bined the use of elevated pressure and high -shear mixing to increase the oxygen transfer. The conventional method of separating activated sludge has been flocculation followed by sedimentation. High -shear mixing breaks up the bio -mass thus hindering flocculation. Flotation, a method of solid -liquid separation used in industrial processes, could utilize the dissolved air released when the elevated pressure is released. A laboratory -scale, activated sludge treatment unit was operated at various combinations of pressure and mixing. The solid -liquid separation characteristics of the mixed liquor were studied. Separa- tion by settling was investigated when the unit was operated at atmos- pheric pressure and separation by flotation was investigated when the
Transcript of SLUDGE -SOLID -LIQUID

AN ABSTRACT OF THE THESIS OF
CHARLES WILLIAM CODDINGTON for the M. S. in Civil Engineering (Name) (Degree) (Major)
Date thesis is presented A 1 f / i,75'
Title HIGH -SHEAR AND PRESSURE ACTIVATED SLUDGE TREAT-
MENT- SOLID -LIQUID SEPARATION
Abstract approved (Major professor)
Since the development of the activated sludge process in 1913
many attempts have been made to improve it. One approach has been
to increase the oxygen available to the bio -mass. This study com-
bined the use of elevated pressure and high -shear mixing to increase
the oxygen transfer.
The conventional method of separating activated sludge has been
flocculation followed by sedimentation. High -shear mixing breaks up
the bio -mass thus hindering flocculation. Flotation, a method of
solid -liquid separation used in industrial processes, could utilize
the dissolved air released when the elevated pressure is released.
A laboratory -scale, activated sludge treatment unit was operated
at various combinations of pressure and mixing. The solid -liquid
separation characteristics of the mixed liquor were studied. Separa-
tion by settling was investigated when the unit was operated at atmos-
pheric pressure and separation by flotation was investigated when the

unit was operated at an elevated pressure of 30 psig.
It was concluded from these tests that: (1) the effluent provided
by sedimentation and flotation following medium and high -shear mixing
is not adequate for discharge to most water -courses. (2) Flotation
does not yield as clear an effluent as sedimentation. (3) Suspended
solids removal by flotation requires a shorter detention time than by
sedimentation. (4) Flotation yields a denser sludge than sedimenta-
tion. (5) In the flotation process no advantage was found by using a
pressure release of more than 20 psi.

HIGH -SHEAR AND PRESSURE ACTIVATED SLUDGE TREATMENT -SOLID -LIQUID SEPARATION
by
CHARLES WILLIAM CODDINGTON
A THESIS
submitted to
OREGON STATE UNIVERSITY
in partial fulfillment of the requirements for the
degree of
MASTER OF SCIENCE
August 1964

APPROVED:
Associate Professor of Civil Engineering
In_ Charge of Major
Head of Department of Civil Engineering
IMIMIMllijll- Dean of Graduate School
Date thesis is presented A
Typed by Lucinda Nyberg
cc,7

ACKNOWLEDGEMENTS
The writer wishes to express his appreciation for the assistance
given in the preparation of this thesis, especially to Associate Pro-
fessor Donald C. Phillips, Professor Fred Merryfield and Professor
Fred Burgess for their guidance, suggestions and inspiration through-
out the year. Thanks are also due the U.S. Department of Health,
Education and Welfare for their traineeship through the Public Health
Service which enabled the writer to do graduate work at Oregon State
University.

INTRODUCTION
THEORY
TABLE OF CONTENTS
Page
1
3
METHOD OF STUDY 9
Apparatus 9
Analytical Methods 12 Experimental Procedures 14
RESULTS 17
CONCLUSIONS 29
RECOMMENDATIONS FOR FURTHER STUDY 30
BIBLIOGRAPHY 31
APPENDIX TABLE I. DAILY SUMMARY OF SUSPENDED SOLIDS
CONCENTRATIONS, INCREASE IN SUSPENDED SOLIDS CONCENTRATION, pH AND TEMPERATURE 33

LIST OF FIGURES
Figure
1 Graphic representation of the solid -liquid inter-
Page
face descend 5
2 Experimental apparatus . 10
3 Experimental apparatus . 11
4 Sedimentation -- No mixing during treatment . 23
5 Sedimentation -- Medium -shear mixing during treatment 24
6 Sedimentation -- High -shear mixing during treat- ment 25
7 Flotation -- No mixing during treatment 26
8 Flotation -- Medium -shear mixing during treat- ment 27
9 Flotation -- High -shear mixing during treatment . 28
. . . .

LIST OF TABLES
Table Page
I SYNTHETIC FEED FORMULATION 14
II WEEKLY AVERAGES OF MLSS, DAILY GROWTH RATE, pH, TEMPERATURE, BOD AND COD RE- MOVALS 19
III SUMMARY OF SEDIMENTATION TESTS . 19
IV SUMMARY OF FLOTATION TESTS 20
. .

HIGH -SHEAR AND PRESSURE ACTIVATED SLUDGE TREATMENT -SOLID -LIQUID SEPARATION
INTRODUCTION
The activated sludge process for sewage treatment was unchanged
for almost 30 years after its development in England in 1913. Since
World War II many modifications of the original process have been
made to increase the efficiency and capacity. Many of these changes
were made by plant operators in an effort to solve operational prob-
lems. Laboratory studies have investigated the utilization of tonnage
oxygen to increase the oxygen availability. The use of high -shear
mixing to increase oxygen transfer has also been investigated. A
possible method of increasing the efficiency of the process would be
to place the system under pressure and introduce high -shear mixing.
According to Henry's Law the ability of a gas to dissolve in a
fluid is a function of the partial pressure of the gas in the two media.
The elevated pressure would thus increase the partial pressure of
oxygen and thus the ability to be dissolved. The high -shear mixing
would serve to keep the oxygen dispersed evenly throughout the sys-
tem and prevent the biota from flocculating, thus increasing the sur-
face area available for transfer of oxygen and dissolved organic
matter.
As bacterial cells can be held in suspension by Brownian

2
movement, flocculation must take place for sedimentation to occur.
The effects of high -shear mixing may thus make conventional sedi-
mentation an ineffective method of removing the bio -mass. The
dissolved air in the system may possibly be used to separate sus-
pended solids from the clear liquor. Releasing the elevated pressure
will cause the air to come out of solution. As the air comes out of
solution, fine bubbles will become attached to the suspended solids
and cause the solids to float to the surface.
The purpose of this thesis is to study the separation character-
istics of activated sludge under various mixing and pressure condi-
tions. The research was carried on in conjunction with a study of
oxygen uptake of the bio -mass under the same conditions.
A laboratory model activated sludge plant was operated under
various pressure and shear conditions with the aeration rate, organic
loading, temperature and pH held constant. The system was operated
at zero, medium and high -shear levels at both atmospheric and 30
psig pressure. The settling characteristics were observed when the
system was under atmospheric pressure and the flotation character-
istics when under elevated pressure. The types of biological growths
as well as the biological oxygen demand and chemical oxygen demand
removals were determined at each operating condition.

3
THEORY
In the activated sludge process the waste water is mixed with an
active biological growth and aerated for six to eight hours, to stabilize
the dissolved organic matter. This mixture then flows to a sedimen-
tation tank where the biological growth flocculates and settles out,
leaving a clear effluent to be discharged. The settled growth, called
activated sludge, is recycled as needed for seeding the influent and
the remainder is wasted to a digester or other method of disposal.
Activated sludge consists of bacteria, fungi, protozoa, rotifers,
and other higher forms of microscopic life. The bacteria is the
most important group as they are primarily responsible for the
stabilization of the organic matter and floc formation. The ratio of
available food to the bio -mass is of importance in floc formation.
Flocculation will not take place when this ratio is high. As the ratio
decreases, the bacteria lack the energy to separate after colliding and
thus flocculate readily.
Until Hazen's (13, p. 45 -88) classical paper in 1904, sedimen-
tation basins were designed on the basis of experience. Hazen's
analysis, based on discrete particles, showed that the surface area
of the basin was the controlling factor for clarifying the liquid over -
stream rather than detention time. The later works of Camp (6, p.
445 -486), Coe and Clevenger (3, p. 1 -7) confirmed Hazen's work.

4
Many mathematical formulas have been proposed to explain sedimen-
tation of discrete solids. These empirical relationships are modifi-
cations of Stoke's Law and take the basic form of:
settling velocity = (constant)(particle size)(density difference) viscosity
Activated sludge is not made of discrete particles and the settling
properties do not follow these mathematical relationships. Instead
the settleability is influenced greatly by physical and chemical char-
acteristics of the process.
A measure of the settleability of activated sludge was conceived
by Theriault (10, p. 214) in 1920 and is called the sludge volume in-
dex (SVI). He defined the sludge volume index as the percent sludge
by volume that settles in a specific length of time divided by the per-
cent sludge concentration.
Fitch (17, p. 159 -169) divided settling into four types; (1) clarifi-
cation-class-1, (2) clarification - class-2, (3) zone settling and
(4) compression. Class -1 clarification occurs with particles in a
dilute suspension having little tendency to flocculate during settling.
If the particles flocculate during settling it is referred to as class -2
clarification. Zone settling takes place when the mass of particles
subside as a unit. Compression takes place when the particles are
mechanically supported by lower particles. This thesis will be con-
cerned with only the last two.

5
When activated sludge is allowed to settle under quiet conditions
a distinct interface forms between the clear liquor and suspended
solids. Under conditions of zone settling the interface descends at a
uniform velocity, which is a function of the initial solids concentration
and flocculation characteristics. Simultaneously a compression zone
builds up from the bottom. The settling velocity remains constant
until the transition zone is reached. Here, the settling velocity de-
creases due to the increased density and viscosity of the mixture until
mechanical support is provided by lower solids in the compression
zone. Once again the settling velocity becomes constant but of very
low magnitude. Stirring sludge in compression increases the settling
velocity by allowing the trapped water to escape. Figure 1 shows the
path of a liquid -solid interface as it descends.
TOP
BOTTOM TIME
Figure 1. Graphic representation of the solid -liquid interface descend.

6
In Figure 1 the curve between A and B represents zone settling.
At point B the transition zone is entered and the interface starts de-
celeration. Somewhere between B and D the settling material becomes
part of the sludge deposit. This is the compression point and is shown
as C. At D the solids are given mechanical support from below and
are in the compression zone.
The slope of a tangent to the curve at any point is the settling
velocity at that point. The compression point (C) is approximately
the intersection of the settling curve and the bisector of the angle
formed by the tangents of the zone settling (A -B) and compression
zones (D -E). The tangent to the compression point below that point
is the locus of the detention times and the corresponding sludge depth
to provide a desired concentration. The concentration in the com-
pression zone can be determined by multiplying the initial concen-
tration by the ratio of the initial height to the sludge height.
To develop a design criteria the settling characteristics may be
evaluated by batch settling tests in a graduated container. Kammermey
(3, p. 7) gave experimental evidence that a minimum diameter of
1. 57 inches is sufficient while Coe and Clevenger (3, p. 7) recom-
mended a minimum of 2. 5 inches and George (3, p. 7) suggested
a 4 inch diameter settling tube. The results from these tests yield
a curve similar to Figure 1. From this curve the settling velocity
of the sludge and theoretical percent removal can be calculated

7
provided the initial solids concentration of the mixed liquor, as well
as the solids content of the clear liquor after settling, are known.
Flotation as a method of concentrating solids has been used for
over 60 years by the mining industry. In the late 19Z0's the Scandi-
navian paper industry developed a flotation process to recover paper
fibers from waste water. The search for improved sewage and in-
dustrial waste treatment methods has resulted in an increasing in-
terest in dissolved -air flotation.
In this method the air is dissolved under elevated pressure and
released by removing the pressure. Minute bubbles form in much
the same manner as when a carbonated soft drink is opened. The
bubbles attach to the suspended solids causing them to float to the
surface to be collected as a scum. Flotation aids may be used to
alter the surface adsorptive properties of the suspended matter thus
increasing their capacity to entrap the released air bubbles.
The amount of pressure needed to dissolve the air is a function
of the detention time under pressure and mixing. Recent experi-
ments on air solubility in water show that the pressure -solubility
relationship varies from Henry's Law, depending on the constituents
of the mixed liquor. Pure saturated water at 30 psig pressure will
release 3. 8 x 10 -4 pounds of air per gallon. This decreases with an
increase in concentration of dissolved matter.
Flotation is evaluated the same as zone settling sedimentation

8
except the direction of solids flow is reversed. The rising velocity is
a function of the air - solids ratio, so by increasing the air - solids ratio
the rising velocity can be increased. With this control the detention
time required for a given concentration can be less for flotation than
sedimentation.
In general, a flotation system does not produce as high a quality
effluent as a sedimentation system. However, in systems where the
density of suspended solids is very close to that of the mixed liquor,
flotation is the only practical method of separation.

9
METHOD OF STUDY
Separation characteristics of the activated sludge operated at at-
mospheric and 30 psig pressure in combination with zero, medium
and high -shear were observed. The aeration rate, organic loading,
temperature and pH were held constant. A sufficient period of time
was allowed for the system to become acclimated to the particular op-
erating conditions.
Apparatus
A laboratory activated sludge unit as shown in Figures 2 and 3
was developed for this experiment. The aeration chamber consisted
of a 4 inch diameter acrylic tube 14 inches long. The bottom formed
a cone with a one inch diameter porous plate for air diffusion. The
entire unit was immersed in a water bath to provide temperature con-
trol. A thermometer, a sampling tube, and a pressure gauge were
placed in the cover. The pressure gauge manufactured by Marshall
Town Manufacturing Company was calibrated in four psi intervals.
The depth of the sampling tabe could be varied to facilitate with-
drawing from any level in the aeration chamber. The aeration rate
was measured with a Roger Gilmont Instruments flowmeter. A 2 inch
by 1/2 inch mixing paddle pitched 15 degrees from vertical was lo-
cated 4 inches above the bottom of the aeration chamber. Provisions

10
Activated Sludge Unit
Separation Tubes
Figure 2. Experimental apparatus
ti
J U
o
7
. 1
.... - _mar

METRIC SCALE
AIR EQUALIZING LINE
SEPARATION TUBE
1.3 LITERS
SAMPLE
PORTS
FEED
CHAMBER
2 LITERS
FEED
PRESSURE GAUGE
NEEDLE VALVE
AIR w r---1' SAFETY VALSE
SAMPLE LINE
BELT
SRI L
ELECTRIC MOTOR
REACTION
CH AMBER
2 LITERS L- IMPELLER
C7 z
POROUS DIFFUSER STONE
DP AIN low
Figure 3. Experimental apparatus.
PRESSURE
CONTROL VALVE
11
FLOWMETER
VALVE
/
i
®,
\
Ì
tAIR-

12
were made to drive this paddle at 500 rpm for medium -shear and 1100
rpm for high- shear.
A feed chamber, similar in size to the aeration chamber, was
used to maintain the elevated pressure in the aeration chamber during
feeding and clarification of mixed liquor.
The separation characteristics were studied in three, 2 inch
diameter acrylic tubes 25 inches long. A metric scale was attached
for measuring the solid interface height. A pressure gauge and needle
valve were provided for pressure control. Sampling ports were lo-
cated to facilitate sample removal from the top, the midpoint, and
the bottom of the sample. This apparatus is shown in Figures 2 and 3.
Analytical Methods
Unless otherwise stated all analytical methods are those found
in Standard Methods for the Examination of Water and Wastewater
(1).
The five -day BOD (biological oxygen demand) was determined by
the dilution method using settled raw sewage from the Corvallis sew-
age treatment plant as seed. The dissolved oxygen was measured
by the Alsterberg (sodium azide) modification of the Winkler method.
The effluent from the aeration was filtered through Whatman No.
40 filter paper before measuring the BOD. All samples were done
in triplicate.
unit

13
The standard COD (chemical oxygen demand) test using O. 25 N
potassium dichromate solution was used. The effluent from the aera-
tion unit was filtered through Whatman No. 40 filter paper before
measuring the COD. All COD samples were done in triplicate.
pH determinations were made with a Beckman glass electrode pH
meter, Model No. 2. It was frequently standardized against a pH
7. 0 buffer solution.
The microscopic observations were conducted with a Spencer
monocular microscope at 100 X and 430 X.
The suspended solids concentration of the activated sludge was
determined by the Residue Test (Nonfiltrable Residue). A fiberglass
filter pad (Hurlbut Paper Company) placed in a Gooch crucible with
25 ml of 5 gm /1 suspension of Celite (Johns - Mansville Celite Analyti-
cal filter -aid) drawn through under suction, was substituted for the
asbestos filter media. A 25 ml sample of the mixed liquor was mixed
with 10 ml of 25 mg /1 suspension of Celite and drawn through the
filter media under suction. This was dried at 103° C for an hour,
cooled to room temperature in a desiccator and weighed. All tests
were run in duplicate.
The growth rates were determined from the daily increase in
suspended solids concentration. Clarification of the effluent was de-
termined by suspended solids samples before and after solid -liquid
separation.

14
Experimental Procedures
The activated sludge unit, operated on a batch basis, was fed a
BOD loading of 860 mg /1 twice a day. The feed was a synthetic waste
with approximately the same chemical composition as domestic sewage.
Table I shows the formulation of the feed. In addition, a silicone de-
foamer, Antifoam "A" Spray, by Dow Corning was added as needed to
supress foaming. Sodium bicarbonate was added to maintain alka -
linity as well as providing a buffer for pH control. An air flow rate of
1,000 ml /min.measured at room temperature and operation pressure
provided adequate mixing under no- shear.
TABLE I. SYNTHETIC FEED FORMULATION
Nutrient Broth 12. 18 gm /1
Dextrose 17. 60 gm /1
Urea 5. 00 gm /1
NaC1 8. 00 gm /1
KC1 4. 00 gm /1
MgSO4 2. 00 gm /1
KH2PO4 1. 73 gm /1
Castile Soap 2. 13 gm /1
Once a day 60 ml to 250 ml of mixed liquor was wasted to deter-
mine the suspended solids and maintain the solids level as close to

15
3, 000 mg /1 as possible. The activated sludge was allowed to settle
under pressure in the aeration chamber, and the clear liquor wasted
until a liter remained in the chamber. Feed was then added and the
system brought to volume by the addition of distilled water.
The daily suspended solids concentration of the mixed liquor was
kept between 2, 300 and 4, 800 mg /1. When the separation character-
istics were to be tested the suspended solids were adjusted to 3, 000
mg /1 by dilution or concentration.
The separation characteristic tests were conducted during a
period three to six hours after feeding. Three or more tests were run
at each condition during this three hour interval. The mixed liquor
was sampled for suspended solids before each test. Sedimentation
tests were conducted when the activated sludge unit was operating
under atmospheric pressure and flotation tests when under 30 psig
pres sure.
For sedimentation tests the mixed liquor was forced into the
separation columns by a five psig pressure applied to the surface of
the activated sludge unit. After a height of 300 mm (606 ml) was
reached in the tube the flow was stopped and the tube inverted ten
times to insure complete mixing. The height of the solid -liquid
interface was measured at one minute intervals until the compression
zone was entered, thereafter the time intervals increased. The clear
liquor was sampled for suspended solids concentration before the

16
solids were resuspended and returned to the aeration chamber. Thirty
minutes of aeration was allowed before another test was started.
In the flotation tests the mixed liquor was released into a separa-
tion column where either atmospheric, 10, or 20 psig pressure was
maintained. The flow rate was controlled to prevent undue agitation
and consequently the loss of dissolved air. When the mixed liquor
reached a height of 300 mm the flow was stopped. The height of the
solid -liquid interface was measured at one minute intervals until
entering the compression zone, whereon the time intervals increased.
The clear liquor was sampled for suspended solids concentration at
the end of each test. The solids were resuspended and returned to
the aeration chamber where 30 minutes of aeration was allowed be-
fore the test was repeated.

17
RESULTS
Testing was conducted during the period from April 5 through
June 6. It was originally planned to use the same culture through the
entire period. Due to a build -up and subsequent sloughing of an an-
aerobic sludge from the cover of the chamber, the chamber had to be
cleaned and new bio -mass introduced following each set of test condi-
tions. Various difficulties were encountered in keeping the system
operable. Therefore tests were made only after maintaining the
system in a satisfactory operating condition for a period of one week.
Twice each week microscopic examinations were made of the
bio -mass in the mixed liquor. Under conditions of no -shear and at-
mospheric pressure stalked ciliates, free swimming ciliates, flagel-
lates, "water bears ", and a filamentous bacterial growth were noted.
Rotifers were not observed and free bacteria were few. Under condi-
tions of no -shear and 30 psi pressure the only changes were that
there was less filamentous bacterial growth and a nematode was ob-
served. Under conditions of medium -shear and atmospheric pressure
the stalked ciliates were more numerous than free swimming ciliates
and a few more single bacteria were present. With the addition of
30 psi pressure the stalked ciliates and flagellates were less numer-
ous, and the bacteria appeared in small groups rather than in fila-
mentous masses. Under conditions of high -shear and atmospheric

18
pressure the biota was similar to that found at medium -shear and 30
psig pressure. The addition of 30 psi pressure showed a greater
number of single bacteria and bacteria in small groups. The free
swimming ciliates were scarce while the number of stalked ciliates
were moderate. The varying shear conditions appeared to have a
greater effect on the type of biological growth than the pressure
change.
The weekly averages of growth rates, pH and temperature under
the various conditions are shown in Table II. The weekly average of
the daily growth rate varied from a maximum of 21. 3% per day at
conditions of medium -shear and atmospheric pressure to a minimum
of 14.8% per day at conditions of medium - shear, and 30 psig pressure.
The higher growth rates tended to be at atmospheric pressure. The
daily average temperature ranged from 18° to 23° C with a weekly
average of 20° C. The pH ranged from 7. 9 to 8. 8. The daily
record showing the suspended solids concentration in the mixed
liquor (SSML), the increase of SSML, pH and temperature is in Table
I of the Appendix.

19
TABLE II. WEEKLY AVERAGES OF MLSS, DAILY GROWTH RATE, pH, TEMPERATURE, BOD AND COD REMOVALS
Shear Level None None Medium Medium High High Pressure (psig) 0 30 0 30 0 30
Average MLSS (mg /1) 3753 3613 3558 2950 3700 3271 Daily Growth Rate (% /day) 16. 3 18. 7 21. 3 14. 8 20. 3 15. 5
pH 8. 5 7. 9 8. 7 8. 4 8. 8 8. 2
Temperature ( °C) 20. 6 20. 0 20.4 19.7 20. 6 20. 3
BOD removal ( %) 97 98 82 98 98 97 COD removal ( %) 63 75 55 70 68 71
Table III summarizes the results of the sedimentation tests under
the various mixing conditions. Figures 4, 5 and 6 are the settling
curves of the solid -liquid interface. The results from the flotation
tests under the different mixing conditions and pressure releases are
shown in Table IV. The flotation curves with pressure releases of
30, 20 and 10 psi are shown in Figures 7, 8 and 9. The results of
no mixing are shown in Figures 4 and 7, medium -shear mixing con-
ditions in Figures 5 and 8. Figures 6 and 9 show the high -shear mix-
ing conditions.
TABLE III. SUMMARY OF SEDIMENTATION TESTS
Shear Level None Medium High Settling Velocity mm/min. 115 79 94 Suspended Solids of
mixed liquor mg /1 3296 3560 3270 Percent removal of
suspended solids 98 87 92

20
Conventional activated sludge treatment (no mixing and atmos-
pheric pressure) had the highest settling velocity, 115 mm /min. , and
the highest removal of suspended solids, 98% after 63 minutes deten-
tion. The application of medium -shear mixing provided the slowest
settling velocity, 79 mm /min. and the poorest removal of suspended
solids at 87% after 80 minutes detention. This can be attributed to a
27% increase in suspended solids in the 24 hours prior to testing, in-
dicating that anaerobic sludge build -up on the cover of the aeration
chamber sloughed off causing a "sick" sludge. High -shear mixing
resulted in a settling velocity of 94 mm /min.with 92% removal of sus-
pended solids after 30 minutes detention.
TABLE IV. SUMMARY OF FLOTATION TESTS (30 psig pressure in aeration chamber)
Shear Level None Medium High
Pressure Released psi 30 30 30 Rising Velocity mm /min. 288 137 131 Suspended Solids of
Mixed Liquor mg /1 2418 2860 3521 Percent Removal of
Suspended Solids 85 85 86
Pressure Released psi 20 20 20 Rising Velocity mm min, 283 134 130 Percent Removal of
Suspended Solids 95 93 86
Pressure Released psi 10 10 10 Rising Velocity mm /min, 71 46 83 Percent Removal of
Suspended Solids 82 86 82
,
21
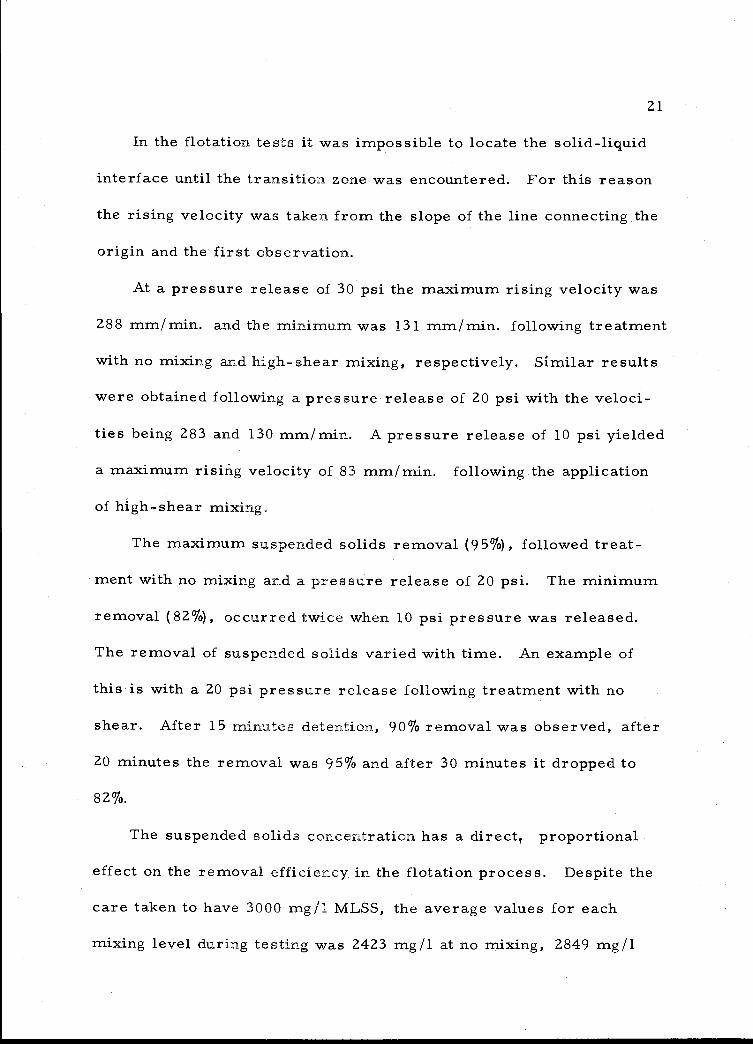
In the flotation tests it was impossible to locate the solid -liquid
interface until the transition zone was encountered. For this reason
the rising velocity was taken from the slope of the line connecting the
origin and the first observation.
At a pressure release of 30 psi the maximum rising velocity was
288 mm /min. and the minimum was 131 mm /min. following treatment
with no mixing and high -shear mixing, respectively. Similar results
were obtained following a pressure release of 20 psi with the veloci-
ties being 283 and 130 mm /min. A pressure release of 10 psi yielded
a maximum rising velocity of 83 mm /min. following the application
of high -shear mixing.
The maximum suspended solids removal (95 %), followed treat-
ment with no mixing and a pressure release of 20 psi. The minimum
removal (82 %), occurred twice when 10 psi pressure was released.
The removal of suspended solids varied with time. An example of
this is with a 20 psi pressure release following treatment with no
shear. After 15 minutes detention, 90% removal was observed, after
20 minutes the removal was 95% and after 30 minutes it dropped to
82 %.
The suspended solids concentration has a direct/ proportional
effect on the removal efficiency in the flotation process. Despite the
care taken to have 3000 mg /1 MLSS, the average values for each
mixing level during testing was 2423 mg /1 at no mixing, 2849 mg /1

22
at medium -shear mixing and 3447 mg /1 at high -shear mixing. This
undoubtedly caused the removal following treatment by high -shear
mixing to be higher than it would have been at 3000 mg /1, and the re-
moval following treatment with no mixing to be lower. The magnitude
of this effect cannot be determined with the available data.
Solid- liquid separation by flotation consistently provided a denser
sludge compared to that provided by sedimentation. Following treat-
ment with no mixing, sedimentation provided a sludge concentration of
16, 700 mg /1 after 10 minutes detention and 21, 500 after 15 minutes
detention. Flotation following the same treatment provided 36, 300
mg /1 and 38,400 mg /1 when 20 psi pressure was released for the same
detention times and when 30 psi pressure was released the values were
33, 000 and 35, 000 mg /1. This also illustrates that releasing more
than 20 psi pressure does not improve the results.

Height of Interface - mm
300
250
200
150
100
50
0
SEDIMENTATION
Operating Pressure - atmospheric Shear Level - None Settling Velocity - 115 mm /min. Compression Point - 6.6 min and 68 mm Slope of Tangent at Compression Point - 2.8 mm /min. Suspended Solid Concentration - 3296 mg /1
Percent Solids Removal - 98% at 63 min. 0
1 o
O
1
b / 11gg- 8o -o- e /12g
0 o d 9 o vo g-o
0 10 20 30 40 Time - minutes
Figure 4. Sedimentation -- No mixing during treatment.
50 60 70
o
0 i
.--rA v o.
E
z
1
B

300
250
100
50
SEDIMENTATION
Pressure - atmospheric Shear Level - Medium Settling Velocity - 79 mm /min. Compression Point - 6. 4 min. and 54 mm Slope of Tangent at Compression Point - 2. 2 mm /min. Suspended Solid Concentration - 3560 mg /1
Percent Solids Removal - 87% at 80 min.
Operating
fl
0 8
'8
a5208_8_$_$-- A
8 A co
0 10 20 30 40 Time - minutes
50 60
Figure 5. Sedimentation -- Medium -shear mixing during treatment.
70 80
200
150
8
E E
6'
-8 B

Height of Interface - mm
300
250
200
150
100
50
0
° SEDIMENTATION
Operating Pressure - atmospheric Shear Level - High Settling Velocity - 94 mm /min. Compression Point - 6. 3 min and 56 mm Slope of Tangent at Compression Point - 3.6 mm /min. Suspended Solid Concentration - 3270 mg /1 Percent Solids Removal - 92g at 80 min.
.Jo Edo -8 -0 -0 0- -o mo0-- 0- o 0-o--o o-. - - CG
10 20 30 40 Time - minutes
50
Figure 6. Sedimentation -- High -shear mixing during treatment.
60 70 80
0
0
9
v
0 / om 0

325
300
275
250
E E 325
v O
300
o
-c4 275
325
300
275
0.0 0 0'4
o ---c
0 10 20 Time - minutes
30
0 0 0 0 0 0 0 a 70
, 5 $
00c. o O C 0 000 o O O
10 20 Time - minutes
30
0 0 0 0 0 000
0 O
C o
0
0
C
C
0 0 0 0 O 0 0 C
o o (1°..9 o O
0 C
0 10
Time - minutes 20 30
Pressure released Rising Velocity Suspended Solids Concentration Percent Solid Removal
Pressure released Rising Velocity Suspended Solids Concentration Percent Solid Removal
Pressure released Rising Velocity Suspended Solids Concentration Percent Solid Removal
10 psi 71 mm /min. 2426 mg /1 82 at 17 min. 80 at 30 min.
20 psi 283 mm /min. 2426 mg /1 90 at 15 min. - 95 at 20 min. - 82 at 30 min.
30 psi 288 mm /min. 2418 mg /1 82 at 10 min. - 85 at 24 min. - 79 at 30 min.
Figure 7. Flotation -- No mixing during treatment.
á ...
0
S.9.9.8.42%-- a.gg o_ .4
p 0
i

300
275
250
225
E E
ro 310
v 300
250
325
300
275 0
V 4 4 V V v v v.+ V, v v v V v V y V
O O O OJ ' O O O
G^ O o
o 0
c
O O M O
o O
0 10 20 30 Time - minutes
40 50 60
oococccoc-c 00000000c C o o 0 o o c
o c o o o
o-OO
o
O
c
°, o 0 o 0 o a o ©gG6E-ooo
80 8
o 10 20 30
Time - minutes 40 50 60
0000 OOOOO o o 0 o o O o o
dooß000
0 o ó 8-0----oro-8-8'
.,. f- °
o o-8 8 8
10 20 30 Time - minutes
40 50
Pressure released 10 psi
Rising Velocity 46 mm /min. MLSS 2860 mg /1
Percent Solid Removal 86 at SS min.
Pressure released 20 psi
Rising Velocity 134 mm /min. MLSS 2828 mg /1 Percent Solid Removal 93 at 60 min.
Pressure released 30 psi
Rising Velocity 137 mm /min. MLSS 2860 mg /1 Percent Solid Removal 85 at 50 min.
60
Figure 8. Flotation -- Medium -shear mixing during treatment.
á
o
ó0 275
X
- ,
l'
! --0
0
- -e 0 0 o 0 /
- -

310
300
275
250
225
310
'a' 300
250 0
000 OC: 0 "4.;v 0 O O caA., - -
o 0
- -
0
_
o O 0
O° o
00 o o o 000eBOO 0
10 20 30 Time - minutes
40 50 60
o o--o o RP,ßP,o©RA-
0o c
000 -0(-)
o O O
a-O
o o
c,o
o
n
z. °
00
O° O
O° o 0 0 6
310
300
275
250
10 20 30 Time - minutes
40 50 60
-O-c CtmonnOnooOn00^O-O-c-
A°ó O o-OO o
o _oo_S_.28_o 8800 000 O
O _0 o
o 10 20 30
Time - minutes 40 50
Figure 9. Flotation -- High -shear mixing during treatment.
60
Pressure released 10 psi Rising Velocity 83 mm /min. MLSS 3361 mg /1
Percent Solids Removal 82 at 37 min.
Pressure released 20 psi Rising Velocity 130 mm /min. MLSS 3460 mg /1
Percent Solids Removal 86 at 49 min. 82 at 57 min.
Pressure released 30 psi
Rising Velocity 131 mm /min. MLSS 3521 mg /1
Percent Solids Removal 86 at 39 min. 82 at 55 min.
N CO
r ° , e-
O O C
E o E
_
)
U O
U
.
275
o

29
CONCLUSIONS
1. The effluent provided by sedimentation and flotation following
medium and high -shear mixing of activated sludge is not adequate
for discharge to most water -courses.
2. Flotation does not yield as clear an effluent as sedimentation.
3. Suspended solids removal by flotation requires a shorter detention
time than by sedimentation.
4. Flotation yields a denser sludge than sedimentation.
5. In the flotation process no advantage was found by using a pressure
release of more than 20 psi.

30
RECOMMENDATIONS FOR FURTHER STUDY
1. Determine the clarifying ability of the combination of
sedimentation and flotation.
2. Repeat the investigation at higher mixed liquor suspended
solids concentrations.

31
BIBLIOGRAPHY
1. American Public Health Service. Standard methods for the examination of water and waste water. 11th ed. New York, 1960. 626 p.
2. Analysis of flotation thickening of waste activated sludge. Water and Sewage Works 111:68 -69. Jan. 1964.
3. Behn, Vaughn C. Settling behavior of waste suspensions. Pro- ceeding of the American Society of Civil Engineers 83(SÁ5): Paper 1423. Oct. 1957.
4. Bloodgood, D. E. , W V. Boegly, Jr. and E. E. Smith. Sedi- mentation studies. Proceeding of the American Society of Civil Engineers 82(SA5):Paper No. 1083. Oct. 1956.
5. Bond, A. W. Behavior of suspension. Proceeding of the Ameri- can Society of Civil Engineers 86(SA3) :57 -85. May 1960.
6. Camp, Thomas R. Sedimentation and the design of settling tanks. Proceedings of the American Society of Civil Engineers 71 :445 -486. April 1945.
7. Chase, E. Sherman. Flotation treatment of sewage and in- dustrial wastes. Sewage and Industrial Wastes 30:783 -791. June 1958.
8. Eckenfelder, W. W. , Jr. and Norman Melbinger. Settling and compaction characteristics of biological sludges. Sewage and Industrial Wastes 29 :1114 -1122. Oct. 1957.
9. Eckenfelder, W. W. , Jr. and D. J. O'Conner. Biological waste treatment. New York, Pergamon Press, 1961. 299 p.
10. Finch, John, and Harold Ives. Settlement of activated sludge. Waste Engineering 25 :214 -216. May 1954.
11. Gaudin, A. M. , Norman S. Davis and Sonia E. Bangs. Flota- tion of Escherichia coli with sodium chloride. Biotechnology and Bioengineering 4:211-222. 1962.
12. Hay, Thomas T. Air flotation studies of sanitary sewage. Sewage and Industrial Wastes 28:100 -106. Jan. 1956.

32
13. Hazen, Allen. On sedimentation. Transaction of the American Society of Civil Engineers 53:45 -88. 1904.
14. Katz, William J. Adsorption - secret of success in separating solids by air flotation. Waste Engineering 30:374 -379. July 1959.
15. Keefer, C. E. Relationship of sludge density index to the acti- vated sludge process. Water Pollution Control Federation Journal 35 :1166 -1175. Sept. 1963.
16. McCabe, Joseph and W. W. Eckenfelder, Jr. (eds.) Biological treatment of sewage and industrial wastes. Vol. 1. New York, Reinhold, 1958. 393 p.
17. McCabe, Joseph and W. W. Eckenfelder, Jr. (eds.) Biological treatment of sewage and industrial wastes. Vol. 2. New York, Reinhold, 1958. 330 p.
18. McKinney, Rose E. Microbiology for sanitary engineers. New York, McGraw -Hill, 1960. 367 p.
19. Rich, Linvil G. Unit operation of sanitary engineering. New York, Wiley, 1961. 308 p.
20. Sawyer, Clair N. Chemistry for sanitary engineers. New York, McGraw -Hill, 1960. 367 p.

APPENDIX

33
TABLE I. DAILY SUMMARY OF SUSPENDED SOLIDS CONCENTRATIONS, INCREASE IN SUSPENDED SOLIDS CONCENTRATION H AND TEMPERATURE
Date Operating Condition
MLSS in
Morning m2 /1
Increase in MLSS
mg /1 pH
Temp. oC
April 26 medium -shear 3164 864 8.6 21
27 atmospheric 3557 375 8.6 20 28 pressure 3274 1146 8.6 21
29 2500 836 8.7 20 30 3017 647 8.8 20
May 1 3406 - 8. 9 20 2 - 9.0 21
3 3100 768 9.0 19
4 high -shear 2978 1262 8,4 22
5 atmospheric 3920 528 8.6 21
6 pressure 3710 542 8.8 20
7 3401 1027 8.8 20
8 2840 376 8.9 21
9 2740 8. 7 21
17 medium-shear 3252 176 - 20 18 30 psig 3229 8. 5 20 19 8. 5 20 20 2740 252 8.4 20 21 2572 144 8.3 20 22 2360 1180 8.4 18
23 3000 8.4 20
17 2730 722 - 20
18 no -shear 3279 165 8.5 20
19 atmospheric 3275 1073 -
20 pressure 4130 682 8.7 23
21 4090 450 8.5 23
22 3178 582 8.5 18
23 3000 - 8.0 20
24 2817 291 8.3 19
25 high -shear 2825 791 8.4 22
26 30 psig 3104 864 8.2 21
27 3423 41 7.8 21
28 2938 538 8.1 20 29 2996 524 8.1 18
30 2864 - 8.3 21
31
June 1 no-shear 2302 598 7.5 20
2 30 psig 2683 301 8.0 20
3 1522 1026 8.1 20
4 2387 245 7.8 20
5 2485 1199 8.1 20
6 3463 - 7.8 20
-
-
- -
-