Exploring the Influence of National Culture on Performance ...
175
Exploring the Influence of National Culture on Performance Management Systems Ihssan Maamoun Jwijati Submitted for the degree of Doctor of Philosophy Heriot-Watt University School of Social Sciences January 2017 The copyright in this thesis is owned by the author. Any quotation from the thesis or use of any of the information contained in it must acknowledge this thesis as the source of the quotation or information.
Transcript of Exploring the Influence of National Culture on Performance ...
Exploring the Influence of National Culture on Performance Management
Systems
Ihssan Maamoun Jwijati
Submitted for the degree of Doctor of Philosophy
Heriot-Watt University
School of Social Sciences
January 2017
The copyright in this thesis is owned by the author. Any quotation from the
thesis or use of any of the information contained in it must acknowledge
this thesis as the source of the quotation or information.
ii
Abstract
Globalisation has resulted in the increase of internationalisation for large and small
organisations alike. Since Performance Management Systems (PMS) are vitally used by
top management to make them aware of their attainment of the planned organisational
goals, their use has become widespread in most companies (Speckbacher et al., 2003).
At the same time, the expansion of organisations outside their birthplaces has compelled
top managers to use their home developed Performance Management Systems in
different cultures. Each national culture has its unique combination of National Culture
dimensions, which had originally emerged from the anthropology field (Nardon &
Steers, 2009, House et al., 2004). This phenomenon prompted scholars to call for the
investigation of the impact of national culture on performance management systems
(Otley, 2003). Therefore, the aim of the study is to investigate the impact of national
culture on the design and use of Performance Management Systems. The researcher first
reviewed published literature in performance measurement and management control
systems, but found it to be scarce and fragmented; an inductive case study design was
employed to collect data from four diverse national cultures to bridge the knowledge
gap. Four national cultures were tested: China, Italy, Qatar and the UK. The researcher
used Hofstede’s (1980) framework of national culture to map the relationship between
the design and use of Performance Management System in different national cultures.
The research findings confirmed that national culture dimensions of Power Distance
(PD) and Uncertainty Avoidance (UA) impact the design and use of Performance
Management Systems individually or combined. PD dimension influence starting a
balanced PMS, the degree of collaboration in Performance Management Systems’
design, the intended aim of Performance Management Systems’ implementation, type of
performance measures employed, Performance Management Systems’ adoption and the
frequency of Performance Management Systems’ use. While UA dimension influences
information accessibility and collaboration patterns in PMS use. The research also
identified different moderators that affect the action of national culture dimensions such
as leaders’ age, and education and innovation based goods.
iii
Dedication
My family had been my greatest supporters starting with my father who had been the
bedrock as he supported this research project relentlessly and efficiently. My mother,
whose love and prayers have kept the project rolling, and she kept kindling the flame of
the project motivation throughout. My wife, whom we carried out much of the burden
of this long journey, especially during my home absence periods, and who could
accommodate the transfer to a new country and culture of the UK. My children:
Sawsan, Huda, Sara and our newest addition to our small family: Maamoun and Ghalia
whom I borrow their enthusiasm and spirit when needed. My brothers and sisters
Asmaa, Aref, Nusaiba, Husna, Iqbal, Mustapha, and Aisha, who sustained their
affection and support to my family and me despite their heavy responsibilities. My in-
laws Khalid, Anas and Yazan, who have supported my efforts. I wish to thank my
uncles, aunts: Zuhair, Haifa, Rashad, Adel, Abdul Munem, Ahmad, Nadwa, Nashwa,
Sabwa, Fatema, Maisoon and their families who kept motivating me and caring about
us. I also wish to acknowledge motivation and support from my wife’s family who took
care of our family during the early research period and were of great help. Finally, I
dedicate my work to my dearest friends whom I consider them as my family: Mr & Mrs
Hamid of London, whose friendship I always honour and cherish.
iv
Acknowledgements
The first person to be acknowledged is my supervisor Prof. Umit Bititci for his
generosity, encouragement, advice and constructive criticism. His style of hard, selfless
work was vital to uplift the research, his subtlety in directing needed comments, and
imparting leadership by example is the best. Also, I would like to greatly thank my
second supervisors Nigel Caldwell for his kind support, help and especially his
constructive critical comments, which had enriched this work.
I would like to thank researchers, previous lecturers, colleagues and friends who
enriched the research with contributions, suggestions, encouragement, inspirations or
even criticism: Ahmad Maher, Andy Neely, Fayez Kiwan, Gavin Lawrie, late Goni
Alkali, Kepa Mendibil, Mike Bourne, Mohamed Shehata, Mohamed Zabadne, late
Mustapha Bulama, Osama Al Asheq, Paola Cocca, Pietro Micheli, Sai Nudurupati and
Veronica Martinez.
I thank Heriot-Watt University colleagues for their support through the PhD process:
Amos Haniff, Caroline Murray, Jiju Antony, Kate Sang, Kevin O’Gorman, and Robert
MacIntosh. From University of Strathclyde: Caroline McGuire, Dora Scholarios, Ian
Whitfield, Janice Rodger, John Quigley, Jonathan Corney, Kepa Mendibil, Nuran Acur,
Spiros Gounaris, Stephen Tagg, Victor Dorfler and Winifred Ijomah,
I wish to express my thanks to my colleagues who deserve much credit for guiding and
backing me in good and bad times: Abigail Hird, Anjar Priyono, Aylin Ates, Jose
Hernandez, Sarina Lim, Ross Curran, Isi Osagie, Gurkan Inan, Rafal Sitko, Pam
Marshal and Saja Albawi.
My friends from outside my department who provided their advice: Mohammad Shaker
Ali Agha, Moutaz Hamdan, Muftooh Ur Rehman Siddiqi, Chadi Khirallah, Wael
Darwich, Omar Daoudi, Ibrahim Abdallah, and Muhammad Jawad Qarni.
Finally, I wish to thank the friends who assisted during the process of the case research:
Brian Kennedy, Dan Wang, Gilad Tiefenbrun, Linda Wallace, Khalil Daaboul,
Mutassem Daaboul and Patricia Garengo.
To all those above, I present a big thank you.
v
ACADEMIC REGISTRY
Research Thesis Submission
Name: Ihssan Maamoun Jwijati
School/PGI: School of Social Sciences
Version: (i.e. First,
Resubmission, Final) Final Degree Sought
(Award and Subject
area)
PhD in Management
Declaration In accordance with the appropriate regulations, I hereby submit my thesis, and I declare that:
1) the thesis embodies the results of my own work and has been composed by myself 2) where appropriate, I have made acknowledgement of the work of others and have made reference
to work carried out in collaboration with other persons 3) the thesis is the correct version of the thesis for submission and is the same version as any
electronic versions submitted*. 4) my thesis for the award referred to, deposited in the Heriot-Watt University Library, should be made
available for loan or photocopying and be available via the Institutional Repository, subject to such conditions as the Librarian may require
5) I understand that as a student of the University I am required to abide by the Regulations of the University and to conform to its discipline.
* Please note that it is the responsibility of the candidate to ensure that the correct version of the
thesis is submitted.
Signature of Candidate:
Date:
Submission
Submitted By (name in capitals):
Signature of Individual Submitting:
Date Submitted:
For Completion in the Student Service Centre (SSC)
Received in the SSC by (name in
capitals):
Method of Submission
(Handed into SSC; posted through internal/external mail):
E-thesis Submitted (mandatory for
final theses)
Signature:
Date:
vi
Table of Contents
Title Page........................................................................................................................... i
Abstract ............................................................................................................................ ii
Dedication ....................................................................................................................... iii
Acknowledgements ......................................................................................................... iv
Table of Contents ........................................................................................................... vi
Lists of Figures ............................................................................................................... xi
Lists of Tables ................................................................................................................ xii
List of Publications by the Candidate ......................................................................... xv
Chapter 1 Introduction ................................................................................................... 1
1.1. Research Overview .......................................................................................................1
1.2. Method Employed in the Research ...............................................................................3
1.3. Significance of the Research ........................................................................................3
1.4. Research Outline ..........................................................................................................4
Chapter 2 Literature Review ......................................................................................... 6
2.1. Introduction ..................................................................................................................6
2.2. Definition of Performance Management Systems (PMS) ............................................6
2.3. Historical Evolution of Performance Measurement .....................................................7
2.3.1. Factors influencing Performance Management System implementation ............................................ 10
2.3.2. Research trends in Performance Management System ....................................................................... 11
2.4. Performance Management System Lifecycle .............................................................14
2.4.1. Performance Management System Design ......................................................................................... 14
2.4.2. Performance Management System Implementation............................................................................ 17
2.4.3. Performance Management System Use .............................................................................................. 18
2.4.4. Performance Management System Review ......................................................................................... 20
2.5. Culture .......................................................................................................................21
2.5.1. Introduction ........................................................................................................................................ 22
2.5.2. National Culture Frameworks ............................................................................................................ 23
2.5.3. National Culture Models .................................................................................................................... 23
2.5.4. Hofstede National Culture Framework .............................................................................................. 25
2.6. The Influence of Culture on Performance Management Systems ..............................26
2.6.1. The Influence of National Culture on PMS; Systematic Literature Review ........................................ 26
2.6.2. Theoretical Findings of the Systematic Literature ............................................................................. 27
vii
2.7. Conclusion of literature review ..................................................................................28
2.8. Designing Theoretical Model .....................................................................................31
2.8.1. Investigating the maturity of PMS design ........................................................................................... 33
2.8.2. Investigating the maturity of PMS use ................................................................................................ 34
Chapter 3 Management Research Methods ............................................................... 36
3.1. Research Philosophies ................................................................................................36
3.2. Ontology .....................................................................................................................37
3.3. Epistemology ..............................................................................................................38
3.3.1. Positivism ........................................................................................................................................... 38
3.3.2. Interpretivism/constructionism ........................................................................................................... 39
3.3.3. Critical realism .................................................................................................................................. 40
3.4. Methodology ...............................................................................................................41
3.5. Research Approach .....................................................................................................42
3.6. Research Methods and Techniques ............................................................................42
3.6.1. Experimental Designs ........................................................................................................................ 43
3.6.2. Survey Research Design ..................................................................................................................... 45
3.6.3. Archival Research .............................................................................................................................. 46
3.6.4. Mixed Methods ................................................................................................................................... 47
3.6.5. Ethnography ....................................................................................................................................... 47
3.6.6. Action Research ................................................................................................................................. 48
3.6.7. Grounded Theory ............................................................................................................................... 48
3.6.8. Narrative Inquiry................................................................................................................................ 49
3.7. Case Study Research ..................................................................................................50
3.7.1. Designing Case Study ......................................................................................................................... 52
3.7.2. Conducting the Case Study ................................................................................................................. 53
3.8. Collecting Data for Case Study Research ...................................................................53
3.9. Data Analysis of Case Study Research .......................................................................55
3.9.1. Data reduction ................................................................................................................................... 55
3.9.2. Data Display ...................................................................................................................................... 56
3.9.3. Data Analysis ..................................................................................................................................... 57
3.10. Criteria for Judging the Quality of Research Design ..................................................59
3.10.1. Maintaining Validity of the Research ................................................................................................. 59
3.11. Summary of Chapter 3 ................................................................................................61
Chapter 4 Research Design .......................................................................................... 62
4.1. Research design addressing this study ........................................................................62
4.2. Philosophical Underpinnings ......................................................................................63
4.2.1. Methodology ....................................................................................................................................... 64
viii
4.1. Case Research Design ................................................................................................65
4.1.1. Selecting Cases ................................................................................................................................... 66
4.1.2. Determining data collection ............................................................................................................... 68
4.1.3. Data collection methods ..................................................................................................................... 68
4.2. Data Analysis ..............................................................................................................70
4.2.1. Data display and coding..................................................................................................................... 71
4.2.2.. Data analysis ...................................................................................................................................... 71
4.1. Ethics ..........................................................................................................................73
4.1. Quality of this research ...............................................................................................74
4.1.1. Construct validity ............................................................................................................................... 74
4.1.2. Internal validity .................................................................................................................................. 74
4.1.3. External validity ................................................................................................................................. 77
4.14. Reliability ........................................................................................................................................... 77
4.1.5. Appropriateness of the methodological approach .............................................................................. 77
4.1.6. Contribution to knowledge/theory ...................................................................................................... 78
4.2. Summary of Chapter Four ..........................................................................................78
Chapter 5 Empirical Findings ..................................................................................... 79
5.1. UK national culture – First Case (UK1) .....................................................................79
5.1.1. UK1 Contextual conditions ................................................................................................................ 79
5.1.2. The influence of national cultures on Performance Management System design in UK1 .................. 83
5.1.3. The influence of national culture on Performance Management System use in the UK1 ................... 81
5.2. UK national culture – Second Case (UK2).................................................................83
5.2.1. UK2 Contextual conditions ................................................................................................................ 83
5.2.2. The influence of national cultures on Performance Management System design in UK2 .................. 83
5.2.3. The influence of national culture on Performance Management System use in UK2 ......................... 84
5.3. Italian National Culture- First Case (IT1) ..................................................................86
5.3.1. Contextual conditions of IT1 .............................................................................................................. 86
5.3.2. The influence of national culture on the Performance Management System design of IT1 ................ 86
5.3.3. The influence of national culture on the Performance Management System use of IT1 ..................... 88
5.4. Italy National Culture – Second Case (IT2) ...............................................................89
5.4.1. Contextual conditions of IT2 .............................................................................................................. 89
5.4.2. The influence of national culture on Performance Management System design at ............................ 90
5.4.3. The Influence of national culture on Performance Management System use at IT2 ........................... 91
5.5. China National Culture – First Case (CH1) ................................................................93
5.5.1. Contextual conditions of CH1 ............................................................................................................ 93
5.5.2. The influence of national culture on Performance Management System design in CH1 .................... 93
5.5.3. The influence of national culture on Performance Management System use in CH1 ......................... 94
5.6. China National Culture – Second Case Company (CH2) ...........................................95
ix
5.6.1. Contextual conditions at CH2 ............................................................................................................ 95
5.6.2. The influence of national culture on Performance Management System design at CH2 .................... 96
5.6.3. The influence of national culture on Performance Management System use at CH2 ......................... 96
5.7. Qatar National Culture – First Case (QA1) ................................................................98
5.7.1. Contextual conditions of QA1 ............................................................................................................ 98
5.7.2. The influence of national culture on Performance Management System design at QA1 .................... 98
5.7.3. The influence of national culture on Performance Management System use at QA1 ......................... 99
5.8. Qatar National Culture – Second Case (QA2) ..........................................................101
5.8.1. Contextual conditions of QA2 .......................................................................................................... 101
5.8.2. The influence of national culture on Performance Management System design at QA2 .................. 101
5.8.3. The influence of national culture on Performance Management System use at QA2 ....................... 102
5.10. Cross-case analysis ...................................................................................................106
5.10.1. The Influence of National Culture on the Design of Performance Management System .................. 106
5.10.2. The Influence of National Culture on the Use of Performance Management System ....................... 107
5.11. Summary of the Findings .........................................................................................113
5.11.1. Proposition 1 - When Power Distance is Low .................................................................................. 113
5.11.2. Proposition 2 – When the Power Distance is High .......................................................................... 113
5.11.3. Proposition 3 – When Uncertainty Avoidance is Low ...................................................................... 113
5.11.4. Proposition 4 – When Uncertainty Avoidance is High ..................................................................... 113
Chapter 6 Discussion and Conclusion ....................................................................... 114
6.1. The influence of single national culture dimension ..................................................116
6.1.1. Low PD SMEs prefer employing traditional PM .............................................................................. 120
6.1.2. Moderated low PD SMEs prefer non-traditional PMS adoption ...................................................... 120
6.1.3. Low PD SMEs prefer to adopt purposeful PMS ............................................................................... 121
6.1.4. Moderated low PD SMEs prefer employing learning and growth oriented PM ............................... 121
6.1.5. Low PD SMEs prefer collaboration in PMS design between leaders and managers ....................... 122
6.1.6. Moderated low PD SMEs extend collaboration in PMS design to managers and employees .......... 122
6.1.7. High PD SMEs prefer to adopt emergent PMS ................................................................................ 122
6.1.8. High PD SMEs prefer the centralisation of Performance Management System design ................... 123
6.1.9. Low PD SMEs prefer PMS’s aim to be communication and attention focusing ............................... 123
6.1.10. Moderated Low PD SMEs prefer PMS’s aim to be employee engagement as well as communication.............. 124
6.1.11. Low PD SMEs prefer to employ objective PM ................................................................................. 124
6.1.12. High PD SMEs prefer to employ subjective PM ............................................................................... 124
6.2. The influence of combined national culture dimensions ..........................................125
6.2.1. High UA & Low PD SMEs prefer involving managers partially in the PMS design ........................ 125
6.2.2. High UA impact High PD SMEs to collaborate with managers in target setting ............................. 126
6.2.3. High PD and UA SMEs prefer PMS’s aim to be monitoring and control ........................................ 127
6.2.4. Low UA and high PD SMEs prefer PMS’s aim to be communication and attention focusing as well as monitoring .............. 127
6.2.5. Low PD and UA SMEs prefer need-based use of PMS and open sharing of PMS results ................ 128
6.2.6. Moderated Low PD and UA SMEs prefer regular PMS use and open sharing of performance reports ............ 128
x
6.2.7. Low PD and high UA SMEs prefer need basis PMS use, and limited performance information sharing at departmental level ....................... 129
6.2.8. Moderated low PD and high UA SMEs prefer regular PMS use and accessible sharing of performance data ..................... 129
6.2.9. High PD and low UA SMEs prefer regular PMS use and share the PMS results ............................ 130
6.2.10. High PD and UA SMEs prefer systematic PMS use, but limit the sharing of PMS reports ............. 130
6.3. Summary of the findings ..........................................................................................131
6.3.1. How does National Culture impact on the Performance Management System design? ................... 131
6.3.2. How does National Culture impact on the use of Performance Management System? .................... 132
6.4. Conclusion ................................................................................................................132
6.4.1. Theoretical implications ................................................................................................................... 133
6.4.2. Contribution to Practice ................................................................................................................... 136
6.4.3. Limitations ....................................................................................................................................... 138
6.5. Future Research ........................................................................................................139
6.6. Personal reflections ..................................................................................................139
References………………………………………………………………………..……143
Appendix A…………………………………………………………………………….160
Appendix B…………………………………………………………………….………163
Appendix C…………………………………………………………………………….177
xi
Lists of Figures
Figure 2.1 Theoretical Framework Building Blocks....................................................... 31
Figure 2.2 Theoretical Framework-NC and PMS design and use .................................. 32
Figure 2.3 Theoretical Framework ................................................................................. 32
Figure 3.1 Research Design Map ................................................................................... 36
Figure 3.2 Differences Between Induction and Deduction Approaches ........................ 43
Figure 3.3 Constructionist Case study research framework .......................................... 54
Figure 4.1 Research Design Activity Map ..................................................................... 62
Figure 4.2 Quadrants of the Research Method............................................................... 65
Figure 4.3 Displaying National Culture Scores for the Selected Cases ......................... 67
Figure 4.4 List of Codes Used in the Study ................................................................... 72
Figure 4.5 Steps to Arrive at the Research Propositions ................................................ 75
Figure 5.1 The Technical Controls of Performance Management System Design ...... 109
Figure 5.2 The Cultural Controls of Performance Management System Design ........ 110
Figure 5.3 The Technical Controls of Performance Management System Use ........... 111
Figure 5.4 The Cultural Controls of Performance Management System Use.............. 112
xii
Lists of Tables
Table 1.1 The Thesis Structure ........................................................................................ 5
Table 2.1 Types of Performance Management System Implementation Factors .......... 12
Table 2.2 Common Themes in National Culture Frameworks ...................................... 24
Table 2.3 Result of the Systematic Literature Review Paper........................................ 29
Table 2.4 Systematic Literature Review Findings ........................................................ 30
Table 2.5 Maturity of PMS Design ................................................................................ 34
Table 2.6 Maturity of PMS Use ..................................................................................... 35
Table 3.1 Summary of Four Different Ontologies ......................................................... 38
Table 3.2 Summary of Positivist Epistemology Characteristics .................................... 40
Table 3.3 Comparison between Ontologies and Epistemologies ................................... 41
Table 3.4 Case Study Tactics for Four Design Tests ..................................................... 60
Table 4.1 Comparing Ethnography, Action Research, and Case Study Research Methods..... 65
Table 4.2 National Culture Scores for the Selected Cultures......................................... 67
Table 4.3 Summary of the Cases Activities ................................................................... 67
Table 4.4 Interview Details ............................................................................................ 69
Table 4.5 Summary of Evaluation of Research Quality Criteria ................................... 76
Table 5.1 Summary of UK1 Findings ............................................................................ 81
Table 5.2. Summary of UK2 Findings ............................................................................ 85
Table 5.3 Summary of IT1 Findings .............................................................................. 89
Table 5.4 Summary of IT2 Findings .............................................................................. 92
Table 5.5 Summary of CH1 Findings ............................................................................ 95
Table 5.6 Summary of CH2 Findings ............................................................................ 97
Table 5.7 Summary of QA1 Findings .......................................................................... 100
Table 5.8 Summary of QA2 Findings .......................................................................... 103
Table 5.9 Summary of within-case analysis ................................................................ 105
Table 6.1 Summary of the Propositions………….……………….…..........…………115
Table 6.2 Findings and published literature ................................................................. 117
xiii
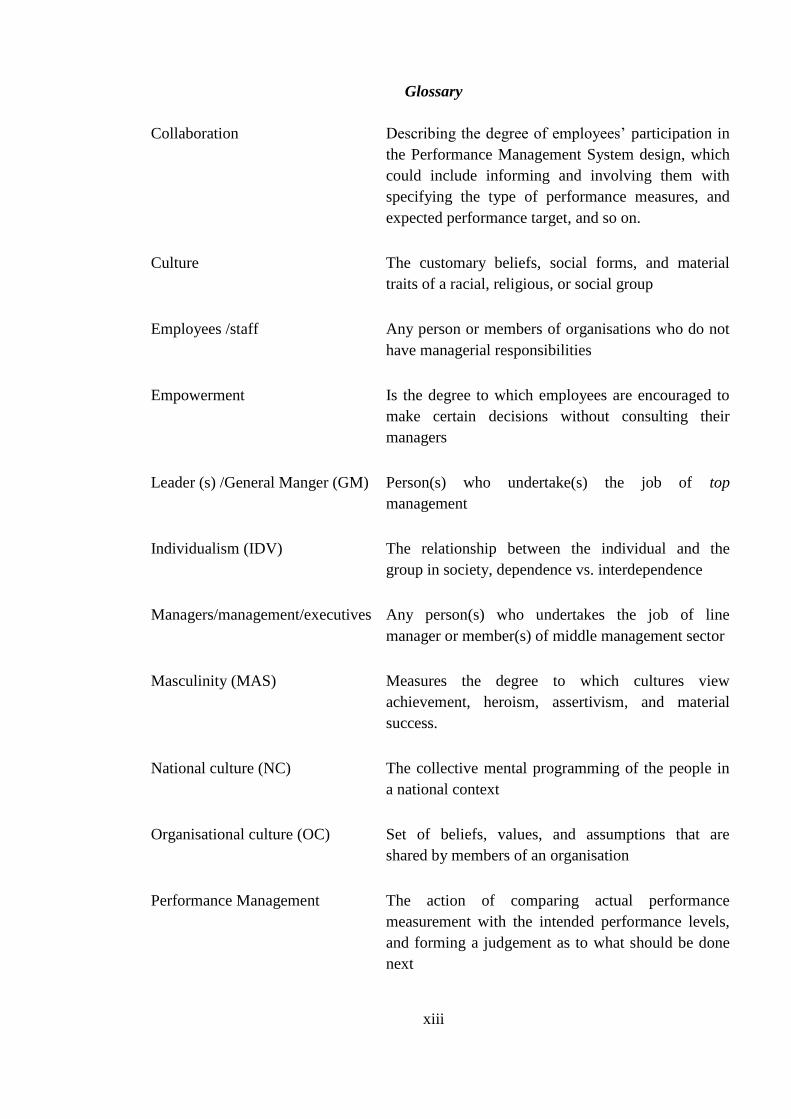
Glossary
Collaboration Describing the degree of employees’ participation in
the Performance Management System design, which
could include informing and involving them with
specifying the type of performance measures, and
expected performance target, and so on.
Culture The customary beliefs, social forms, and material
traits of a racial, religious, or social group
Employees /staff Any person or members of organisations who do not
have managerial responsibilities
Empowerment Is the degree to which employees are encouraged to
make certain decisions without consulting their
managers
Leader (s) /General Manger (GM) Person(s) who undertake(s) the job of top
management
Individualism (IDV) The relationship between the individual and the
group in society, dependence vs. interdependence
Managers/management/executives Any person(s) who undertakes the job of line
manager or member(s) of middle management sector
Masculinity (MAS) Measures the degree to which cultures view
achievement, heroism, assertivism, and material
success.
National culture (NC) The collective mental programming of the people in
a national context
Organisational culture (OC) Set of beliefs, values, and assumptions that are
shared by members of an organisation
Performance Management The action of comparing actual performance
measurement with the intended performance levels,
and forming a judgement as to what should be done
next
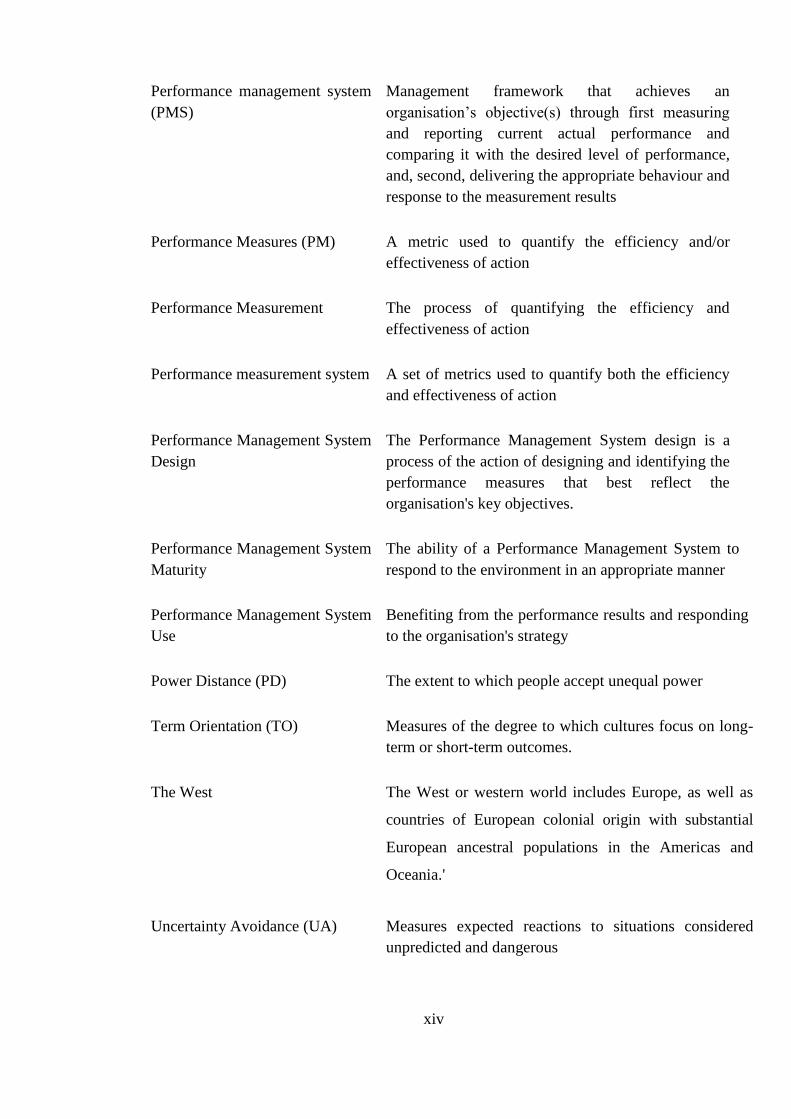
xiv
Performance management system
(PMS)
Management framework that achieves an
organisation’s objective(s) through first measuring
and reporting current actual performance and
comparing it with the desired level of performance,
and, second, delivering the appropriate behaviour and
response to the measurement results
Performance Measures (PM) A metric used to quantify the efficiency and/or
effectiveness of action
Performance Measurement The process of quantifying the efficiency and
effectiveness of action
Performance measurement system A set of metrics used to quantify both the efficiency
and effectiveness of action
Performance Management System
Design
The Performance Management System design is a
process of the action of designing and identifying the
performance measures that best reflect the
organisation's key objectives.
Performance Management System
Maturity
The ability of a Performance Management System to
respond to the environment in an appropriate manner
Performance Management System
Use
Benefiting from the performance results and responding
to the organisation's strategy
Power Distance (PD) The extent to which people accept unequal power
Term Orientation (TO) Measures of the degree to which cultures focus on long-
term or short-term outcomes.
The West The West or western world includes Europe, as well as
countries of European colonial origin with substantial
European ancestral populations in the Americas and
Oceania.'
Uncertainty Avoidance (UA) Measures expected reactions to situations considered
unpredicted and dangerous
xv
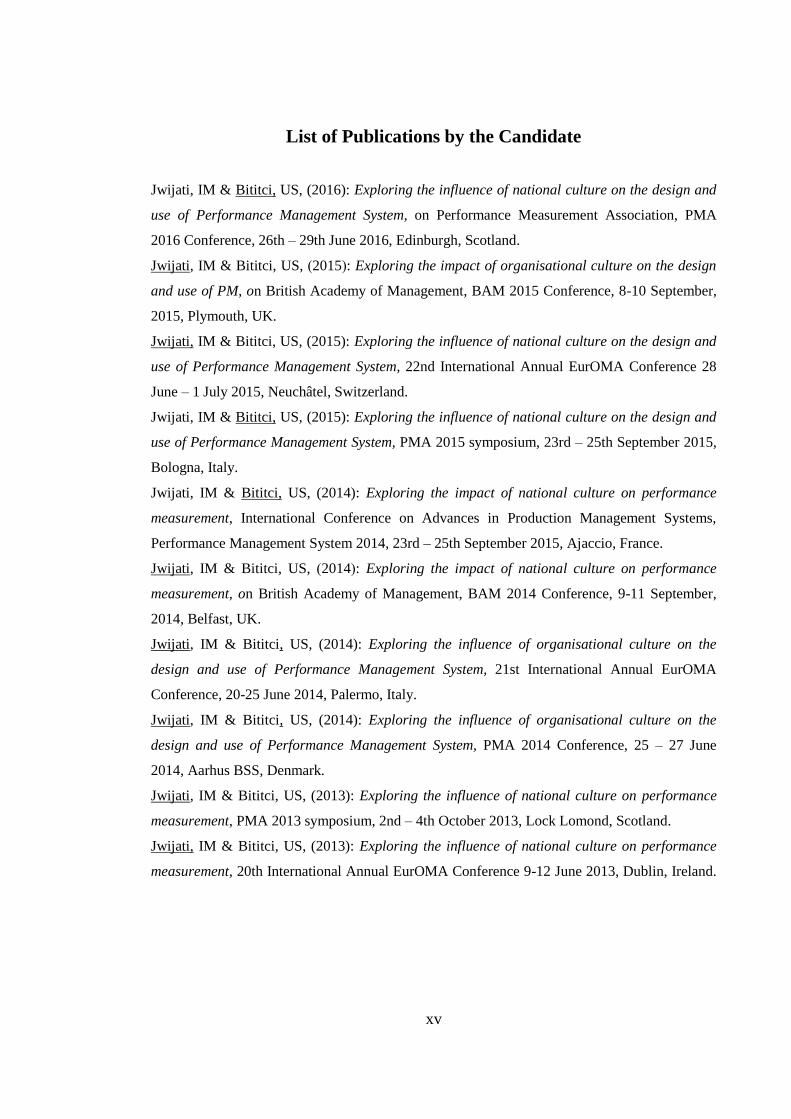
List of Publications by the Candidate
Jwijati, IM & Bititci, US, (2016): Exploring the influence of national culture on the design and
use of Performance Management System, on Performance Measurement Association, PMA
2016 Conference, 26th – 29th June 2016, Edinburgh, Scotland.
Jwijati, IM & Bititci, US, )2015(: Exploring the impact of organisational culture on the design
and use of PM, on British Academy of Management, BAM 2015 Conference, 8-10 September,
2015, Plymouth, UK.
Jwijati, IM & Bititci, US, (2015): Exploring the influence of national culture on the design and
use of Performance Management System, 22nd International Annual EurOMA Conference 28
June – 1 July 2015, Neuchâtel, Switzerland.
Jwijati, IM & Bititci, US, (2015): Exploring the influence of national culture on the design and
use of Performance Management System, PMA 2015 symposium, 23rd – 25th September 2015,
Bologna, Italy.
Jwijati, IM & Bititci, US, (2014): Exploring the impact of national culture on performance
measurement, International Conference on Advances in Production Management Systems,
Performance Management System 2014, 23rd – 25th September 2015, Ajaccio, France.
Jwijati, IM & Bititci, US, )2014(: Exploring the impact of national culture on performance
measurement, on British Academy of Management, BAM 2014 Conference, 9-11 September,
2014, Belfast, UK.
Jwijati, IM & Bititci, US, (2014): Exploring the influence of organisational culture on the
design and use of Performance Management System, 21st International Annual EurOMA
Conference, 20-25 June 2014, Palermo, Italy.
Jwijati, IM & Bititci, US, (2014): Exploring the influence of organisational culture on the
design and use of Performance Management System, PMA 2014 Conference, 25 – 27 June
2014, Aarhus BSS, Denmark.
Jwijati, IM & Bititci, US, (2013): Exploring the influence of national culture on performance
measurement, PMA 2013 symposium, 2nd – 4th October 2013, Lock Lomond, Scotland.
Jwijati, IM & Bititci, US, (2013): Exploring the influence of national culture on performance
measurement, 20th International Annual EurOMA Conference 9-12 June 2013, Dublin, Ireland.
1
Chapter 1 Introduction
1.1. Research Overview
The rate at which organisations have been adopting performance measurement has been
accelerating over the last two decades, and it has become one of the most widespread
organisational management practices (Kennerley & Neely, 2003). The efficient use of
Performance Management Systems has seen to facilitate better communication with
employees, testing the effectiveness of existing strategies and motivating employees.
The use of balanced performance management systems has being acknowledged to
present an advantage more than traditional financial performance management systems
(Davis & Albright, 2004).
As the 21st century progresses, globalisation and information technologies are
advancing at rapidly increasing rates, leading to record levels of internationalisation and
collaboration across different cultures. Cross-cultural expansion has previously been
restricted to large multinationals only; this is no longer the case, as smaller
organisations are expanding across cultural boundaries to access new markets and
opportunities. Organisations are purchasing materials and services, developing value
networks, and differentiating the design of their products to sell in different geographic
regions (Pagell et al., 2005; Hansen & Birkinshaw, 2007; Pisano & Verganti, 2008;
Chesbrough & Garman, 2009). Otley, 2003 asked whether Performance Management
Systems that are efficient in one national culture would be similarly effective if used in
others. What are the likely outcomes when new operations initiated in new locations
and national cultures use Performance Management Systems that were designed to be
used by parent companies in probably different cultures? Some scholars have called for
further research in this area, stressing the need to understand the influence of national
culture on management systems (Tayeb, 1995; O’Connor, 1995; Otley, 2003).
Clearly, there is a certain degree of recognition that behavioural elements emanating
from employees, managers and other stakeholder tend to influence Performance
Management Systems (Simons, 2000; Otley, 2003; de Waal, 2003). Thus, some had
called to create alignment between performance measurement systems and the people
embedded cultural elements (Bourne, 2005; Mendibil and MacBryde, 2006). Since,
2
national culture is considered one of the known behavioural elements, its impact has
been investigated by Lindholm, 2000; Lau & Chong, 2002; Chow et al., 1999.
However, there appears to be a scarcity of knowledge on “HOW” national culture
shapes and influences Performance Management Systems, i.e. a specific understanding
of how a national culture dimension(s) may affect the attitude to performance measures,
what is measured, and how these metrics are reported, shared and acted. Thus, the
initial research question of this research is “how do national culture influence
Performance Management Systems, if at all?”
The literature review first explored the performance measurement and national culture
literature in general. Then conducted a systematic literature review exploring the impact
of national culture on Performance Management Systems. The resulting conclusion was
that although the impact of national culture on Performance Management System is a
well-recognised phenomenon, there is a scarcity of research that provides insights on
how National Culture (NC) affects Performance Management Systems, which indicates
a clear gap in knowledge. Also, the literature reveals that National Culture may impact
on Performance Management System in different ways depending on the Performance
Management System Lifecycle, i.e. design, implement, use and review (design and use
for short). This leads to the development of two specific research questions, as follows:
How does National Culture impact on the design of Performance Management
System?
How does National Culture impact on the use of Performance Management
System?
The Literature Review also concluded that the current state of knowledge is not
sufficient to construct a deductive conceptual model that can be tested in an empirical
study, thus reinforcing the need for and inductive study to explore the above research
questions. The literature review led to the construction of a theoretical model, based on
organisational control theory, as an exploratory research instrument to enable this
inductive study, which is then used to conduct eight case studies representing four
national cultures.
The thesis contributes to the organisational control theory in general and the
Performance Measurement (PM) body of knowledge in particular by explicating the
impact of National Culture (NC) in the design and use of Performance Management
3
System. Broadly, Power Distance (PD) and Uncertainty Avoidance (UA) dimensions of
national culture emerge as the most significant characteristics of national culture that
influence the design and use of performance measurement systems. The findings were
reported in the form of seven propositions that explains How National Culture impacts
on the Performance Management Systems Design and Use (PMSs). In doing so, the
research contributes specifically to the body of knowledge in the field of Performance
Management Systems and Performance Measurement as well as providing a new
research instrument, based on organisational control theory, for further such studies.
1.2. Method Employed in the Research
The thesis employed an inductive approach using eight fine ingrained cases studies
from four diverse national cultures. The research design investigated in-depth
qualitative data because the understanding of cases’ context helps to answer the research
question. Data were gathered using semi-structured interviews, observations and the
analysis of documents.
1.3. Significance of the Research
Globalisation has encouraged organisations, including SMEs, to expand worldwide in
looking for new sources or entering new markets. A performance management system is
a management framework used for communicating strategy, motivating employees, and
as a management decision-making tool. However, following global expansion,
organisations must implement their Performance Management Systems in different
national cultures, which may differ significantly from the original national culture.
Considering present knowledge of the importance of organisational culture to
Performance Management Systems, and knowing that national culture has an influence
on organisational culture, a question arises regarding the degree to which national
culture affects individual preferences for, and reactions to, Performance Management
Systems. Thus, there is a need to understand whether Performance Management
Systems and management practices proven to be effective in one environment, might be
ineffective, or even dysfunctional, in other settings.
Every culture is unique and people as consumers or employees differ by their
surroundings and cultural orientation. Hence, it is necessary to understand the effect of
national culture on the Performance Management Systems Design and Use could help
identify motivations for employees in different cultures, and guide managers to shape
4
organisational interests. The findings of this research would also be helpful to
academics, who are looking to understand the impact of different cultures on the design
and use of Performance Management Systems. Practitioners as well, findings can
inform them of ways in which national culture influences the design and use of
Performance Management Systems. Understanding the effect of national culture would
help to reduce cultural deployment errors about Performance Management Systems, and
reduce the emotional and material losses associated with failed Performance
Management Systems (PMS) implementations.
1.4. Research Outline
The aim of the study is to understand and explore national culture dimensions impact on
the Performance Management Systems design and use. A systematic literature review
was conducted to identify previous research on the topic. However, it became apparent
that most previous research has been carried out from an accountancy perspective;
therefore, an inductive qualitative case study research was designed to investigate the
effect of national culture on the use of Performance Management Systems. The
following section outlines the composition of the present thesis; it is comprised of six
chapters, arranged as follows:
Chapter One outlines the background to the research, the research objectives, the
findings and the significance of the study. Chapter Two contains an exploratory
literature review explaining the concept of a performance management system, defining
culture, and specifically the national and organisational culture. The literature review
found a gap in the literature, and stated the research aim and mentioned the research
questions. Chapter Three describes the research philosophy, justify the different
research methods used to address the various research questions, and explain the
different philosophical assumptions and methodologies used to study management
topics. Chapter Four presents the research method used to answer the research
questions based upon the researcher’s philosophical assumptions; this chapter also
provides detail regarding the field work and the preparations for the study, such as the
research protocol, data reduction, data display, and other steps. Chapter Five reports
the findings of the undertaken case studies. Chapter Six, contains the listed research
propositions and tends to discuss them in contrast to other published literature;
presenting the contribution of the study, as well as confirming the finding with
5
previously published literature. An assessment of the quality of the research is
presented. The conclusion present theoretical and practical contributions, limitations
and recommendation for future studies. The final part of the thesis contains three
appendices: Appendix A is a table stating the differences between existing national
culture frameworks. Appendix B contains the reports written for the eight cases studies.
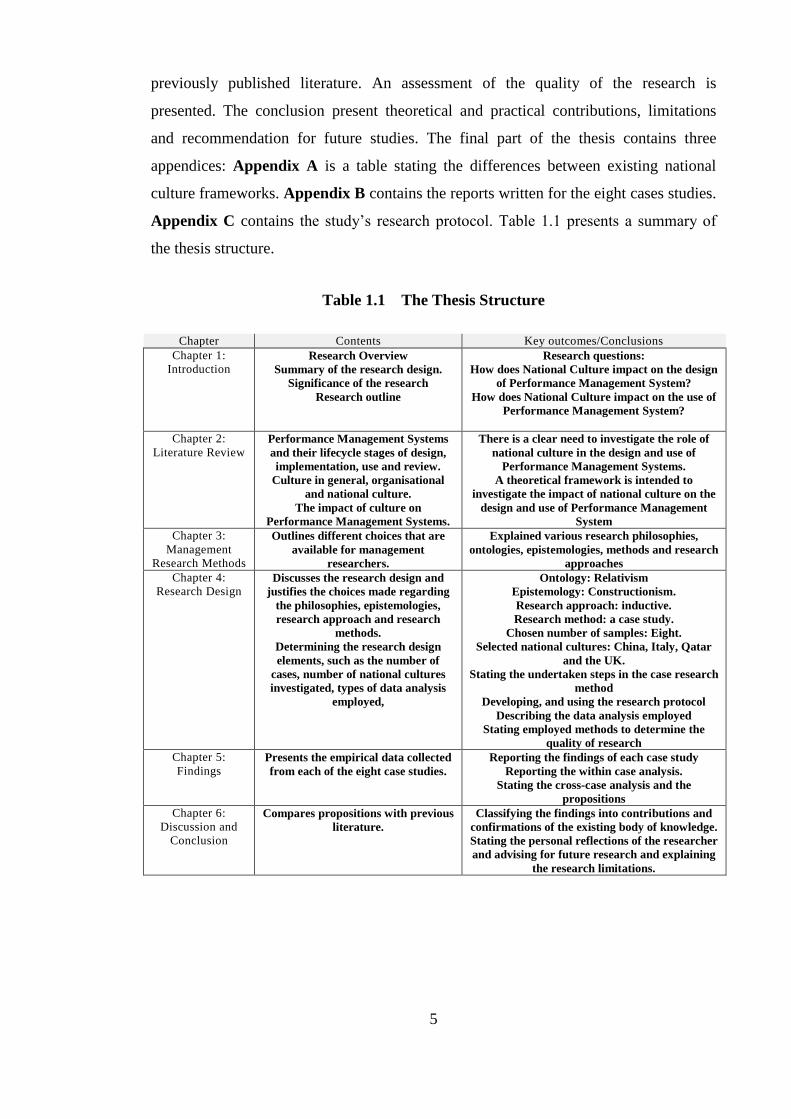
Appendix C contains the study’s research protocol. Table 1.1 presents a summary of
the thesis structure.
Table 1.1 The Thesis Structure
Chapter Contents Key outcomes/Conclusions
Chapter 1:
Introduction Research Overview
Summary of the research design.
Significance of the research
Research outline
Research questions:
How does National Culture impact on the design
of Performance Management System?
How does National Culture impact on the use of
Performance Management System?
Chapter 2:
Literature Review Performance Management Systems
and their lifecycle stages of design,
implementation, use and review.
Culture in general, organisational
and national culture.
The impact of culture on
Performance Management Systems.
There is a clear need to investigate the role of
national culture in the design and use of
Performance Management Systems.
A theoretical framework is intended to
investigate the impact of national culture on the
design and use of Performance Management
System
Chapter 3:
Management
Research Methods
Outlines different choices that are
available for management
researchers.
Explained various research philosophies,
ontologies, epistemologies, methods and research
approaches
Chapter 4:
Research Design Discusses the research design and
justifies the choices made regarding
the philosophies, epistemologies,
research approach and research
methods.
Determining the research design
elements, such as the number of
cases, number of national cultures
investigated, types of data analysis
employed,
Ontology: Relativism
Epistemology: Constructionism.
Research approach: inductive.
Research method: a case study.
Chosen number of samples: Eight.
Selected national cultures: China, Italy, Qatar
and the UK.
Stating the undertaken steps in the case research
method
Developing, and using the research protocol
Describing the data analysis employed
Stating employed methods to determine the
quality of research
Chapter 5:
Findings Presents the empirical data collected
from each of the eight case studies.
Reporting the findings of each case study
Reporting the within case analysis.
Stating the cross-case analysis and the
propositions
Chapter 6:
Discussion and
Conclusion
Compares propositions with previous
literature.
Classifying the findings into contributions and
confirmations of the existing body of knowledge.
Stating the personal reflections of the researcher
and advising for future research and explaining
the research limitations.
6
Chapter 2 Literature Review
2.1. Introduction
The objective of this research is to contribute to the existing body of knowledge by
seeking to examine and account for the effect of national culture on the Performance
Management Systems Design and Use (Performance Management System). Thus, the
purpose of the literature review is twofold. First, to set boundaries around the field of
Performance Management System by examining the field in general and developing the
key definitions. Second, to explore the current state of knowledge about the research
question. The literature review provides a comprehensive background to Performance
Management System, explaining key definitions, describing the historical evolution of
Performance Management System, explaining the factors affecting the successful
implementation of Performance Management System, highlighting some of the current
trends in performance measurement research and the Performance Management System
Lifecycle.
The second section introduces the concept of culture, in general, explaining
organisational and national culture, and briefly comparing various types of national
cultural frameworks. The third section presents findings of systematic literature reviews
concerning the effect of national culture on Performance Management Systems. The
fourth section summarises the results of the literature review, and the fifth section
presents the theoretical framework designed to investigate the impact of national
cultures on the design and use of Performance Management Systems.
2.2. Definition of Performance Management Systems (PMS)
There are several terms in performance measurement that should be defined, such as
performance measure or metric, performance measurement, performance measurement
system, and performance management systems. Neely et al. (1995, pp. 81-82) define a
performance measure and performance measurement system as:
“A performance measure can be defined as a metric used to quantify the efficiency and
effectiveness of action”.
7
“Performance measurement can be defined as the process of quantifying the efficiency
and effectiveness of action..."
“A performance measurement system can be defined as the set of metrics used to
quantify both the efficiency and effectiveness of action”.
The metrics used in a performance measurement system, refer to a set of different
performance measures, which include financial, non-financial, internal and external
measures of performance (Bourne et al., 2003). While performance measurement
concerns are quantifying performance, performance management describes the action of
comparing actual performance measurement with the intended performance levels and
forming a judgement as to what should be done next (Adair et al., 2003). Activities
necessary to achieve the successful deployment of performance measurement systems,
such as shared organisational vision, teamwork, incentives, a degree of employee
involvement, communication activities, efficient management style, and so on, are
essential components of a performance management system (Lebas, 1995). Therefore,
combining the above descriptions, a performance management system can be defined as
a management framework that achieves an organisation’s objective(s) through first
measuring and reporting current actual performance. The next stage is to compare these
results with the desired level of performance; and, then deliver the appropriate
behaviour and response to the measurement results (Pavlov & Bourne, 2011; Bititci et
al., 2012; Melnyk et al., 2014).
The definitions above are alike in their recognition that there are certain behavioural
influences on the Performance Management System, which implies that the process of
using a Performance Management System is not merely a mechanical process. In fact,
the behavioural aspect of Performance Management Systems has been mentioned by
many scholars (de Waal, 2002; de Waal, 2006; Henri, 2006; Franco-Santos et al., 2012).
2.3. Historical Evolution of Performance Measurement
This section discusses the development of performance measurement, beginning with
the contributions of early authors who advocated the use of ‘performance
measurement’. Although the notion of performance measurement and management has
been around for some time, it was Johnson and Kaplan’s (1987) who popularised it by
their seminal publication, Management Accounting; Relevance Lost. Since then the
theory and practice of performance measurement and management have attracted
8
significant attention from both researchers and practitioners. In fact, (Neely, 1999, p.
207) identified a “performance measurement revolution,” counting 3,615 papers on
performance measurement published between 1994 and 1996. Research on performance
measurement and management over the past twenty years has evolved from
understanding and developing the techniques of measurement, to discovering the effect
of using performance measurement in attaining strategic objectives, that is, management
(Neely et al., 2005; Bititci et al., 2014). Later, the concept of balanced performance
measures gained prominence (Eccles, 1991; Dixon et al., 1990; Kaplan & Norton, 1992;
Neely et al., 1996). Several balanced performance frameworks emerged, such as: the
performance measurement matrix (Keegan et al., 1989), performance pyramid system
(Lynch & Cross, 1991), result and determinants framework (Fitzgerald et al., 1991;
Fitzgerald & Moon, 1996), balanced scorecard (Kaplan & Norton 1992, 1996),
integrated performance measurement system (Bititci et al., 1997), and performance
prism (Neely et al., 2002), some of which are being briefly described below.
A performance measurement matrix (Keegan et al., 1989) is a framework that
helps an organisation define its strategic objectives and translate these aims into
performance measures, using a hierarchical and integrated approach. A two-by-
two matrix combines cost and non-cost perspectives with external and internal
perspectives. It is flexible and straightforward, though its simplicity is criticised
for ignoring some important indicators seen in other frameworks.
A performance pyramid system (Lynch & Cross, 1991) model is a pyramid built
on four levels, illustrating the links between corporate strategy, strategic
business units and operations. The strategic objectives are located at the top of
the prism. The framework measures stakeholder satisfaction and operational
activity. The model describes both the relationship between different indicators
and the management process.
A results and determinants framework (Fitzgerald et al., 1991; Fitzgerald &
Moon 1996) focuses on the relationship between results and determinants. Six
dimensions are divided into results (competitiveness, financial performance) and
determinants of these results (quality of service, flexibility, resource utilisation
and innovation). This framework introduces a link between performance
indicators and performance objectives. Also, the framework links all aspects
with competitiveness.
9
The balanced scorecard (Kaplan & Norton 1992, 1996, 2001; Bhagwat &
Sharma, 2007) is one of most popular management frameworks. It aims to
provide management with balanced measures according to four perspectives:
financial, customer, internal processes, and learning and growth. The financial
aspect measures the organisation’s ability to make a profit through measures
such as profitability, cash flow, and return on capital. The customer measure
indicators include market share, customer retention, customer perception and
satisfaction. The internal process aspect measures key processes that the
organisation depends upon to compete, providing an overall picture of the
organisation’s efficiency. Finally, the learning and growth aspect measures the
organisation’s ability to add value using continuing learning.
An integrated performance measurement system (Bititci et al., 1997) is an
information system that enables the performance management process to
function effectively and efficiently. The framework underlines two main facets
of the Performance Management Systems: integrity, which is the ability of the
Performance Management System to promote the integration of various areas of
business; and deployment, which refers to the deployment of business objectives
via four levels, where the higher levels become stakeholders in, the lower level.
This model is based on four levels (corporate, business units, business processes
and activities) and at each of these levels, five key factors are considered
(stakeholders, control criteria, external measures, improvement objectives and
internal measures). This classification makes it possible to define the most
appropriate types of the performance system. The classification enables one to
build a design that suits internal, external, capability and learning measures.
The performance prism (Neely et al., 2002; Neely et al., 2001) is a five-
dimensional model that aims to measure the performance of the whole
organisation. The five prism faces correspond to stakeholder satisfaction,
strategies, processes, capabilities and stakeholder contribution. Stakeholder
satisfaction measures explain the identity of interested parties and their similar
needs. The strategy measures describe the approaches required to satisfy the
wants and needs of stakeholders. In processes, information about critical process
requirements is needed to execute strategies. Capabilities refer to the magnitude
of the required contributions from stakeholders to maintain and develop planned
capabilities.
10
The above frameworks attempt to balance performance measures by introducing non-
financial measures, and measuring expected as well as past performances to give
stakeholders more ability to control and improve performance. However, despite the
wide variety of methods used, and the different performance dimensions utilised in the
above performance measurement frameworks, they lack three essential aspects. First,
the performance measurement frameworks listed above do not include implementation
routines in their design; and it is noted that the application has proven to be vital, as
high rates of implementation failures have been reported (McCunn, 1998). Second, the
frameworks were designed in the West1, and are based on Western management
knowledge and culture; further research is needed to understand the influence of these
management tools in different national cultures, which is the aim of this study. Third, in
turbulent environments, which are now widespread (Harrington et al., 2011), there is a
need to mitigate such disruptions by designing flexible systems that ensure the
attainment of organisational objectives without collapsing under turbulence related
pressures.
2.3.1. Factors influencing Performance Management System implementation
The mentioned performance revolution has resulted in the extensive development of
various performance measurement frameworks, and researchers have debated different
techniques and methods for deploying Performance Management System (Meekings,
1995; Bourne et al., 2000; Neely et al., 2000). However, researchers have also observed
high rates of implementation failures (McCunn, 1998). Various factors have been
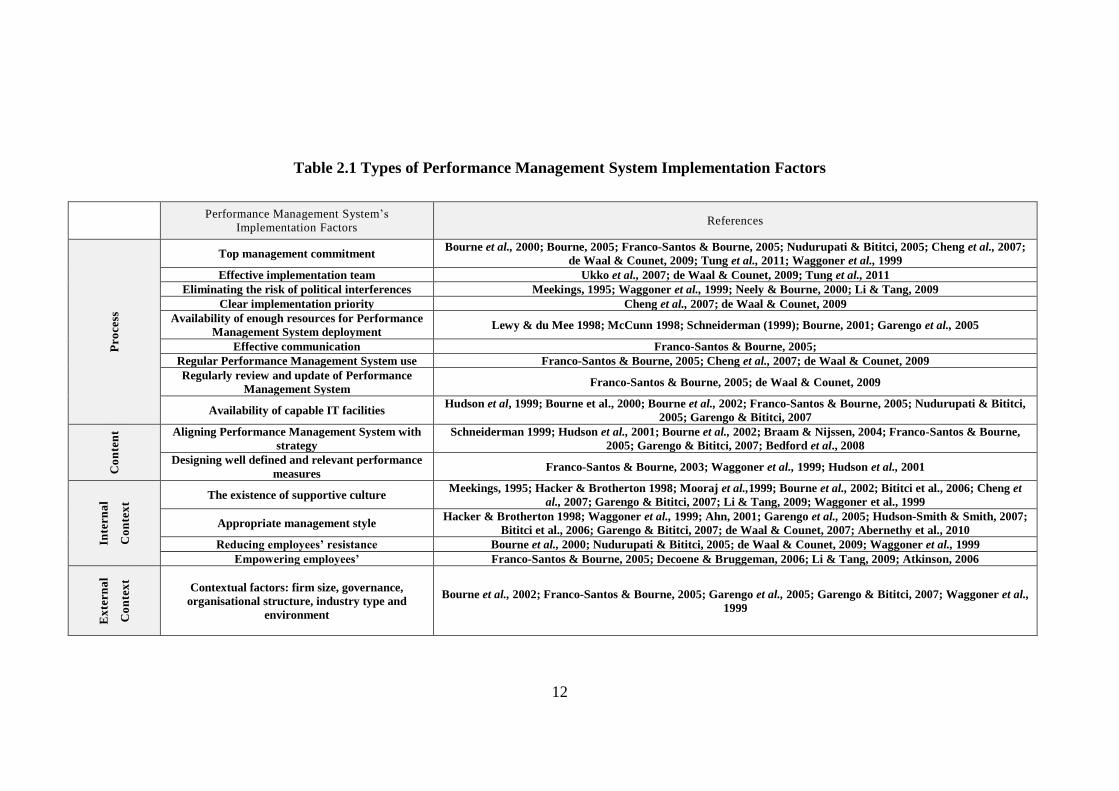
attributed to successful implementation are shown in Table 2.1. These factors are
grouped using (Pettigrew, 1987) framework of process, content and context. ‘Process
factors’ refer to the processes of design, implementation, and use, such as ensuring
1 ‘The West or western world includes Europe, as well as countries of European
colonial origin with substantial European ancestral populations in the Americas and
Oceania’ (Thomson & Hickey, 2005).
11
implementation priority, appropriate management capacity, ensuring top management
commitment and availability of resources, prioritising regular reviews and updates,
communicating vertically through the organisation, and more.
‘Content factors’ relate to the suitability of the performance metrics to their intended
purpose, and to the alignment between the performance management system and the
applied strategy. Contextual factors are divided into internal and external factors;
internal contextual factors include the availability of a supportive organisational culture,
reducing employee resistance to the implementation of performance measures, the
availability of an appropriate management style, empowering employees and so on.
External contextual factors include organisational size, governance structure, industry
type and the nature of the environment.
Table 2.1 shows that contextual, process, and content factors which influence the
Performance Management Systems implementation. Contextual factors are:
organisational culture (Bititci et al., 2004, 2006; Henri, 2006), organisation size (Hoque
& James, 2000), organisation and governance type (Garengo & Bititci, 2007), nature of
industry and external environment (Perrow, 1967; Khandwalla, 1972; Gordon &
Narayanan, 1984; Simons, 1987; Govindarajan, 1988; Firth, 1996; Chow et al., 1999;
O’Connor et al., 2004).
2.3.2. Research trends in Performance Management System
Recent studies seem to direct our attention towards investigating the impact of context,
PMS users’ behaviour towards Performance Measurement and the impact of new forms
of organisations. New structures which resulted from globalisation and the accelerating
rate of change contributed to having new environments which are prompting researchers
to investigate its impact on performance measurement.
Previous research had explored the implications of particular contextual factors on
Performance Measurement such as: large organisations (Kaplan & Norton, 1996),
SMEs (Hudson et al., 2001; Taylor & Taylor, 2014), public organisations (Poister &
Streib, 1999; Carmona & Granlund, 2003; Greatbanks & Tapp, 2007), and not-for-profit
organizations (Aidemark, 2001; Kershaw & Kershaw, 2001; Brewer, 2002). Their
findings indicate that applicability of Performance Management System in any context,
though the PMS design and implementation should be considered in different contexts.
12
Table 2.1 Types of Performance Management System Implementation Factors
Performance Management System’s
Implementation Factors References
Pro
cess
Top management commitment Bourne et al., 2000; Bourne, 2005; Franco-Santos & Bourne, 2005; Nudurupati & Bititci, 2005; Cheng et al., 2007;
de Waal & Counet, 2009; Tung et al., 2011; Waggoner et al., 1999
Effective implementation team Ukko et al., 2007; de Waal & Counet, 2009; Tung et al., 2011
Eliminating the risk of political interferences Meekings, 1995; Waggoner et al., 1999; Neely & Bourne, 2000; Li & Tang, 2009
Clear implementation priority Cheng et al., 2007; de Waal & Counet, 2009
Availability of enough resources for Performance
Management System deployment Lewy & du Mee 1998; McCunn 1998; Schneiderman (1999); Bourne, 2001; Garengo et al., 2005
Effective communication Franco-Santos & Bourne, 2005;
Regular Performance Management System use Franco-Santos & Bourne, 2005; Cheng et al., 2007; de Waal & Counet, 2009
Regularly review and update of Performance
Management System Franco-Santos & Bourne, 2005; de Waal & Counet, 2009
Availability of capable IT facilities Hudson et al, 1999; Bourne et al., 2000; Bourne et al., 2002; Franco-Santos & Bourne, 2005; Nudurupati & Bititci,
2005; Garengo & Bititci, 2007
Co
nte
nt Aligning Performance Management System with
strategy
Schneiderman 1999; Hudson et al., 2001; Bourne et al., 2002; Braam & Nijssen, 2004; Franco-Santos & Bourne,
2005; Garengo & Bititci, 2007; Bedford et al., 2008
Designing well defined and relevant performance
measures Franco-Santos & Bourne, 2003; Waggoner et al., 1999; Hudson et al., 2001
Inte
rn
al
Co
nte
xt
The existence of supportive culture Meekings, 1995; Hacker & Brotherton 1998; Mooraj et al.,1999; Bourne et al., 2002; Bititci et al., 2006; Cheng et
al., 2007; Garengo & Bititci, 2007; Li & Tang, 2009; Waggoner et al., 1999
Appropriate management style Hacker & Brotherton 1998; Waggoner et al., 1999; Ahn, 2001; Garengo et al., 2005; Hudson-Smith & Smith, 2007;
Bititci et al., 2006; Garengo & Bititci, 2007; de Waal & Counet, 2007; Abernethy et al., 2010
Reducing employees’ resistance Bourne et al., 2000; Nudurupati & Bititci, 2005; de Waal & Counet, 2009; Waggoner et al., 1999
Empowering employees’ Franco-Santos & Bourne, 2005; Decoene & Bruggeman, 2006; Li & Tang, 2009; Atkinson, 2006
Ex
tern
al
Co
nte
xt
Contextual factors: firm size, governance,
organisational structure, industry type and
environment
Bourne et al., 2002; Franco-Santos & Bourne, 2005; Garengo et al., 2005; Garengo & Bititci, 2007; Waggoner et al.,
1999
13
The impact of Behavioural attributes of PMS users have been acknowledged (Otley
1999; Bourne et al. 2005; Bititci et al. 2012; Neely et al., 2005). Simons, 2000
suggested that behavioural attributes such as users’ desire to contribute to where they
work, their eagerness to learn, and their intent to achieve and innovate matter to
performance measurement. Therefore, to ensure the effective design and use of
Performance Management Systems, organisations should consider the possible effects
of behavioural factors of PMS users.
In the past five years, research on performance measurement has reached a “crossroads”
(Bourne et al., 2014; p. 117). Several issues are still far from being understood, such as
the effect of globalisation, the impact of pervasive high-speed internet connectivity, and
the implications of highly turbulent environments (Harrington et al., 2011); all pose
implications for Performance Management System. Bititci et al., 2012 called to
investigate the role of culture, collaborative organisations, autopoietic networks,
dynamic environment, open innovation, sustainability, servitization and project
management on performance measurement. Melnyk et al. (2014) have argued that the
effect of globalisation and the impact of high-speed connectivity, coupled with a
turbulent environment, has resulted in the emergence of complex and demanding
customers, which creates more risk in business transactions. Consequently, they express
the need to incorporate risk management into performance management. Changes in
behaviours and the interactions between people and performance require cultural
sensitivity or, what Bourne et al. (2014, p.118) call “subtlety” in using performance
measures to manage an organisation. New realities have made waves in the business
world, such as the increased focus on innovation (Pink, 2005). Stakeholders now need
specific performance measurements to measure the outputs and outcomes of creativity
(Melnyk et al., 2014).
Most important is the question of whether performance measurement is robust enough
to reliably predict and prevent crises of the magnitude of the 2008 banking crisis (Bititci
et al., 2012; Bourne et al., 2014). The pattern of change has been observable in the
contextual environments surrounding organisations, how will PMSs evolve in response?
There need to study the change and to prepare Performance Management Systems to
respond to these extremely dynamic and changing customer requirements.
14
2.4. Performance Management System Lifecycle
Mintzberg & Walters, (1985) classified change as emergent and planned in response to
external stimuli. For this research, and in this context, the introduction of Performance
Management System in an organisation can be both planned and emergent. When an
organisation purposefully sets out to design and implement a performance management
system and, over time, it purposefully reviews, redesigns, implements and uses a
performance management system; it would be considered that the Performance
Management System Lifecycle was planned. Similarly, if an organisation introduces
new measures and changes existing measures in response to external stimuli (e.g.
customer demand, parent company requirements and so on), its performance
management system are considered emergent. Thus, it is argued that all Performance
Management System lifecycles be ‘cybernetic,’ whether planned or emergent.
Performance Management System Lifecycle contains four stages: Design,
implementation, use and review stages (Bourn & Neely, 2000; Kennerley & Neely,
2003; Nudurupati & Bititci, 2005; Bititci et al., 2006). Research has found that the
influence of organisational culture is different depending on Performance Management
System Lifecycle phase (Bourne et al., 2003; Bititci et al., 2006). Therefore, to better
understand the influence of national culture on Performance Management Systems,
there is a need to explain the concept of the Performance Management System Lifecycle
further.
2.4.1. Performance Management System Design
The Performance Management System’s design stage is preceded by the stakeholders
establishing and determining the organisation’s aims and objectives. The design process
is the action of designing and identifying the performance measures that best reflect the
organisation’s key objectives (Bourne et al., 2000). The characteristic of useful
performance measures are: derived from strategy, clearly defined, relevant and easy to
maintain, simple to understand and use, provide fast and accurate feedback, and
stimulate continuous improvement (Neely et al., 1996; Lynch & Cross, 1991).
The design stage is comprised of clarifying the strategy of the organisation, describing
the processes needed to determine the strategy, identifying the measures required to
determine the success or failure of the processes, designing the performance measures,
deciding the range of targets associated with excellent, acceptable and bad performance
15
and, finally, defining the reporting and collection methods (Cross & Lynch, 1988/1989;
Kaplan & Norton, 1992; Neely et al., 1996; Neely et al., 2001; Garengo et al., 2005;
Pun & White, 2005; Nudurupati & Bititci, 2005; Mettänen, 2005; Shepherd & Gunter,
2006).
Bourne et al. (2000) reported that there is a consensus among researchers that
performance measures should be linked to strategy (Mintzberg, 1983; Keegan et al.,
1989; Dixon et al., 1990; Kaplan & Norton, 1992). There are some different design
approaches; a non-collaborative approach involves design by leaders only or managers
only (Agostino & Arnaboldi, 2011), while a collaborative approach involves leaders and
managers and, possibly, everybody in the organisation (Agostino & Arnaboldi, 2011). A
non-collaborative approach can be top down or bottom up. In the top-down approach,
managers simply receive objective performance metrics and targets from the leaders2,
and their job is, ultimately, to implement these. In such cases, managers would likely
not understand the aim behind special performance reports, and there might be
resistance and disengagement with the measurement process. In the bottom-up
approach, the top management supports the process but is not involved in the design
(Braam & Nijssen, 2004). In such cases, managers design their metrics for their
departments; in these instances, performance measures are usually simply operational
targets, while leaders retain the use of traditional financial measures (Kleingeld et al.,
2004; Ferreira & Otley, 2009; Agostino & Arnaboldi, 2011).
In the collaborative approach, managers participate in the Performance Management
System design process. Typically, they consult with their subordinates, accepting
contributions from the bottom of the hierarchy to the top. Some scholars consider
employee participation to be positive, as it assists in reducing resistance and improves
motivation (Otley, 1999; Franco & Bourne, 2003; Garengo & Biazzo, 2012). However,
most of these studies are based on research activities carried out in the Western world,
2 Leaders in this research refer to any person(s) who undertakes the job of top
management, while manager(s) refers to a line manager or member(s) of middle
management, and employees refer to members of organisations who do not have
managerial responsibilities.
16
which raises the issue of whether Performance Management System design practices
will work in other parts of the world.
Regarding what is being measured, different taxonomies have been suggested for
performance measures or metrics. Performance Measures had been classified based on
audience, (Braam and Nijssen, 2004), performance measure function (Merchant, 1998;
Chenhall, 2003; Ferreira & Otley, 2009), or the maturity of the performance measures
(Speckbacher et al., 2003).
The audience could be local, corporate and joint. Local measures are operational
performance measures that deal with departmental operational performance targets,
such as the number of complaints and process completion time, among other objectives.
Corporate measures are more externally-oriented performance measures aimed at
benchmarking performance measures to competitors, such as sales, market share, and
percentage of market growth. Joint performance measures are internally-oriented
performance measures designed to comparing departments and units within the
organisation on matters such as budget variance and absence through illness (Braam and
Nijssen, 2004). This classification is practical and assists internal and external
benchmarking, but it has a disadvantage in that it was difficult to find comparable
entities across the whole organisation. Some departments have different characteristics
and cannot be compared to the rest of the organisation; furthermore, the obvious
comparison is difficult in some industries, because of data secrecy, different accounting
systems, various external factors and other factors.
Function based performance measures could be result, action, or personnel/culture
performance measures. Result measures control numerical targets, such as the expected
output. Hence it is measurable and definable. Meanwhile, action controls measure
behaviour rather than value or result. They refer to the expected behaviour, by
monitoring and direct observation. Therefore there is an element of subjectivity in these
measures. Lastly, personnel/cultural measures focus on training, job design, and
recruitment, thus relying on promoting shared norms and values to induce self-control
among employees. Cultural/personnel measures are sometimes called upon because they
ensure that employees behave culturally in the same way as other employees (Merchant,
1998; Merchant & Van der Stede, 2003).
Subjectivity and objectivity are used as classifications by Chenhall (2003) and Ferreira
and Otley, (2009), where objective measures are those based on facts and quantifiable
figures, and can be independently observed. By contrast, subjective measures are based
17
on opinions and perceptions, which make the task of verifying them difficult
(Nudurupati et al., 2011). Despite the appeal of this classification, subjective measures
can be difficult to define, especially in multiple activities, and combining objective and
subjective measures could be hard to deploy for managers who have varied
responsibilities.
Speckbacher et al. (2003) classify Performance Management Systems according to the
maturity of the performance measures used. First, Type I, which is described as the
most basic performance measurement system, is comprised of financial and non-
financial measures only. Type II Performance Management System links strategy to
Type I Performance Management System, regarding cause-and-effect relationships.
Type III Performance Management System, which is in addition to Type II Performance
Management System, has an elaborate implementation plan and connects incentives
with Performance Management System results. Speckbacher et al.’s 2003 typology is
helpful, but it looks at measures only from this perspective, even though there are other
possible perspectives; also, it assumes that the three types are ‘incrementally related,’
which might not always be the case (Franco-Santos et al., 2012).
Despite the importance of these taxonomies, there are other different types of
performance measures, such as direct and indirect, leading and lagging, monetary and
non-monetary and result and cause. In conclusion, business leaders should try to have
similar Performance Measures, to all easy benchmarking. It seems likely that there is
occasionally need to combine all the taxonomies to produce a practical and useful
performance framework.
2.4.2. Performance Management System Implementation
The implementation stage of Performance Management System is the process where the
designed metrics or performance measures and procedures are put in place to collect
and process data regularly and reliably (Chesley & Wenger, 1999; Van der Zee & de
Jong 1999; Bourne et al., 2000; Ittner & Larker, 2003). Implementation is considered
successful when the system becomes stable with fixed performance measures,
information system data, and target levels (Smith, 2007; Vike, 2007). This process
includes practical steps to ensure the success of the implementation, such as data
creation, data collection, and data analysis (Nudurupati & Bititci, 2005). Also, it
involves determining the best routes to achieve the implementation process, that is, HR
18
planning, training and other possible changes, such as financial, technological, and other
resources, the cost of implementation, and the reward and sanctions offered (Meekings,
1995). Failures could damage implementation, and many reasons could underlie the
collapse of the measurement process, such as the behaviour of employees, which is one
of the leading causes of implementation failure (Neely et al., 2000). Thus,
understanding the factors contributing to the failure of Performance Management
System is helpful in reducing the chance of failure and avoiding financial and emotional
losses accompanying it.
2.4.3. Performance Management System Use
The use stage of Performance Management System is the stage where the stakeholders
benefit from the performance measurement results and assess the implementation of
their strategies, and challenge their current strategic assumptions. Performance
Management System use is discussed regarding two specific areas, the first is how the
measures are reported and reviewed, and the second is the role or style in which
Performance Management System is deployed.
The PMS aim of use differs between organisations (Meekings, 1995; Atkinson et al.,
1997; Bourne et al., 2000; Malmi, 2001; Merchant & Van der Stede, 2007), though
Choong, (2013) suggested that there is no consensus regarding the preferred format to
use. There are various descriptions of the likely role of performance management use.
Simons (1990), Malmi (2001) and Henri (2006), among others, have defined the aims of
Performance Management Systems to be: monitoring, attention focusing, and engaging.
Here, the monitoring means comparing actual and planned performance. Top
management communicates the expected performance levels to the employees, and
observe the real level. After that, senior management learns about the accomplishments
and failures of employees. When the aim of the performance management system is
monitoring, control is sought, communication is mainly characterised by vertical
communication between managers and subordinates; subordinates are informed of their
managers’ expectations, held accountable and, in return, they expect to be told whether
they have succeeded or failed. When the aim is monitoring, the overall performance
information is retained by senior management, and performance reviews are conducted
by leaders on a one-to-one basis with managers (Malmi, 2001; Henri, 2006).
19
The attention focusing style of Performance Management System is characterised by
management typically indicating its strategic orientation and communicating it through
performance measures. Recommended behaviour is rewarded through key success
factors, targets. Performance Management Systems enhance communication within the
organisation, and initiate dialogue (Henri, 2006). Employee engagement is a higher
order of attention focusing that aims at increasing the involvement of employees
through activities such as participation in the design and use of performance measures
and encouraging a conversation where they can provide feedback, which could lead to a
continuous exchange of information between employees at different organisational
levels.
Performance Management System communication can be described by four attributes
such as First, type of media employed in reporting performance data: meetings or
reporting form. Meetings or workshops (Meekings, 1995; Bourne et al., 2000) are
popular due to their spontaneity in the delivery of the message and the speed of
feedback. Meetings could be formal or informal; typically, SMEs have simple
management structures (Garengo & Biazzo, 2012). The size of the audience attending a
meeting also differs; it could include only two participants, a one-to-one meeting, or
several participants in executive boards; Furthermore, the number could contain
employees from departments. The structure of meetings involves various components,
such as the status of the performance in comparison to previously set targets, lessons
learnt, reasons for poor performance and discussion of proposed plans for future action
(Alsada, 2010).
Written media is also used to communicate performance data (Taylor & Taylor, 2014).
It can be achieved in different formats, such as standard and electronic reports, and
more visual methods. Reports have the benefit of being able to present different data
taken from various resources (Nudurupati et al., 2011), delivering reliable and credible
data and facilitating easy information access (Taylor & Taylor, 2014). Reports are an
excellent communication format as they can reach wider audiences than meetings;
however, their disadvantage is the lack of a spontaneous response.
Visual methods can represent data, information and knowledge in a graphic format
(Bititci et al., 2015). They include strategy charts and road mapping. Strategy charts
illustrate objectives, decisions, and events, and are connected by arrows to show causal
relationships. Road mapping, a visual technique that supports strategic planning.
Adding visuals to words improves learning by 23% and the transfer of learning by 89%
20
(Meyer, 1997). Despite the clear advantages of visual methods, there is a real risk of
misinterpretation which should be avoided (Ibid.).
Second, is the degree of performance data accessibility. Typically, information is either
transmitted to stakeholders (push) or accessed by them when it is needed (pull).
Accessibility to performance reports could be restricted by hierarchical positions
(Ferreira & Otley, 2009; Cocca & Alberti, 2010), or it could be allowed to all
stakeholders (Cocca & Alberti, 2010). Some writers have identified a link between free
access to information and employee empowerment (Ciuzaite, 2008) and restricted
access to “distrust, dissatisfaction and demotivation” among employees (Franco-Santos
et al., 2012; 96). This link is simplistic and implicit to this study is the argument that
more research should be undertaken before concluding which method is more
conducive to the efficient use of Performance Management System. Other factors must
be considered, such as the size and nature of the industry, the hierarchical level of
employees, employment history and other cultural factors within the organisation.
Third, the frequency of reporting is a part of successful Performance Management
System implementation; this could simply be ad-hoc with no regular pattern of
transmission, or it could occur at regular intervals. Less efficient performance reporting
is when performance results are rarely communicated (Cocca & Alberti, 2010), while
regular reporting of performance data is considered to be successful. These intervals
could be daily (Meekings, 2005; Bititci et al., 2014), weekly (Meekings, 2005), monthly
(Meekings, 2005; Dossi & Patelli, 2010), or even quarterly (Malmi, 2001). Despite
these different options, it is important in some cases to have information shared at the
beginning of the implementation process, at close intervals, so that users become
connected to the data (Meekings, 2005). The frequency of meetings could vary
depending on hierarchical level; for example, the board could have meetings every
month, while executive management could have weekly meetings (de Waal & Frijns,
2011). Again, management frequency of intervention varies in different sectors. In
stable organisations, change is not anticipated. Thus the frequency of intervals is low.
While in dynamic and unstable organisations, shorter intervals are required to allow
diligent actions to be taken.
2.4.4. Performance Management System Review
The review process relates to the strategic objectives being examined and updated
(Bititci et al., 2000; Ittner & Larcker, 2003; Kennerley & Neely 2003). The system
21
metrics should reflect the revised objectives and priorities, as changes in the
environment and organisational needs could cause it to lose effectiveness; hence, it
requires review and possible redesign (Bourne et al., 2005). PMSs review is checking
the relevance of the performance measures according to the needs of both the
organisation and users. In some cases, after careful consideration, and after many
performance management periods, the strategic assumptions can be questioned and
different strategies implemented. Change in strategies should result in newly designed
performance measures, which can then be reviewed to check their validity.
2.5. Culture
Culture simply is the distinctive pattern of thinking, perception and possible behaviour
that every person or group has. Hofstede described this pattern of thinking as ‘software
of the mind’ (Hofstede & Hofstede, 2005). Culture is ‘the customary beliefs, social
forms, and material traits of a racial, religious, or social group’. Culture can be
described by acting: to solve a problem (Deal & Kennedy, 1982), or ‘glue’ that holds
together an organisation (Trompenaars, 1993). What distinguishes culture is its
common, unique and pervasive nature as it is the ability to differentiate one group from
others (Adler and Bartholomew, 1992). It is derived from the environment, unlike the
personality of a person, which is partly derived from someone’s genes (Hofstede &
Hofstede, 2005).
Culture can influence values in change management behaviour (Kirkman et al., 2004),
conflict management behaviour (Gabrielidis et al., 1997), reward allocation (Gomez et
al., 2000), decision making (Mitchell et al., 2000), leadership behaviour (Chan and
Drasgow, 2001), personality (Tafarodi et al., 1999) and work-related emotions (Harpaz
et al., 2002).
Culture is pervasive, affecting everything in society, start to influence from the stage of
education and continue with him in life. Culture’s influence can be felt in values, ideas,
beliefs, expectations, patterns of behaviour, communication style, style of management,
how life is perceived, and what influences thinking about ourselves and our
environment, be it work or leisure (Bahagat, et al., 2012).
Tayeb (1988) has voiced his concerns about national culture measurement drawbacks,
such as: First, disentangling organisation’s culture and national culture. However, this
drawback had been avoided by Hofstede’s study as he studied variations in national
culture in one organisation. Second, when measuring national culture, little efforts had
22
been made to investigate the impact of peoples’ values and attitudes. Third, most of the
national culture frameworks assume homogeneity and unity of one country’s national
culture, and this could affect the validity of national culture studies. Now, despite these
concerns, it should be noted that the strength in national culture frameworks is the fact
that most researchers had experienced the difference in values, attitudes, and behaviours
of individual members of societies and cultures (Minkov & Hofstede, 2011). Thus, this
criticism and concerns, national culture continue to be used in academic research.
Moreover, it is observed that new research is progressing in National Culture, and hence
it could be advised for new research to analyse the work using newer national culture
frameworks.
In the next section, the researcher explains national culture and then presents the
findings of the systematic literature review, which had investigated earlier works
regarding the influence of national culture on the Performance Management Systems.
2.5.1. Introduction
National culture is the set of common beliefs that distinguish people of one nationality
from those of another (Hofstede, 1980). National culture is embedded deeply in
everyday life and is relatively impervious to change; it affects the way employees
understand their work and the way they expect to be treated. When management
practices are inconsistent with these deeply held values, employees are likely to feel
disenfranchised and distracted. Thus, it may affect their performance (Newman &
Nollen, 1996).
The national culture characteristics have evolved from different sources such as
religion, education systems, political systems, and economic development (Inglehart,
2008). The current type of economy, technology and even the physical environment
such as climate (Minkov, 2011). Though religion creates different cultural values, the
cultural differences between religions are far less influential than the differences
between national cultures Minkov (2011). The education and political system have a
two-way and complicated relationship with culture, but time is needed to produce
massive cultural change, which makes the notion of convergence of national cultures as
non-feasible (Minkov, 2011).
23
2.5.2. National Culture Frameworks
Before the existence of national culture frameworks, it was difficult for researchers to
compare national cultures. The development of national culture frameworks offered
dimensions with statistical indicators representing various national cultures and enabled
comparing any number of national cultures. The researcher has compared the most
prominent national culture frameworks: Kluckhohn and Strodtbeck (1961), Hofstede
(2001), Hall (1976), Trompenaars (1993), Schwartz (1994) and GLOBE, House, et al.,
(2004); see Table 2.2. These frameworks have common themes such as the distribution
of power/authority, the relationship between groups or individuals, the relationship with
the environment, use of time. The researcher has laid out the differences between the
six frameworks in Appendix A.
2.5.3. National Culture Models
National culture models offer templates for comparing differences between different
national cultures. The different models unbundle various national cultures to several
variables, thus allowing researchers to break different cultures into various National
Culture dimensions, which helps to simplify the comparison process. Some National
Culture models use non-numerical national culture dimension (Kluckhohn, &
Strodtbeck, 1961; Hall, 1976; Trompenaars & Hampden-Turner, 2012), while other
models represent national culture dimensions by numerical values (Hofstede &
Hofstede, 2005; House et al., 2004). However, Harrison and McKinnon, 1999 noticed
some methodological weaknesses in the dimension systems. Such as treating the
dimensions equally important in all nations, ignoring in effect the intensity of cultural
norms and values, or assuming ‘uniformity’ of dimensions. Selecting some values or
dimensions and ignoring others lead many studies in the opinion of (Harrison and
McKinnon, 1999, p. 502) to failure. Despite these methodological weaknesses, there is
a consensus that differences between national cultures exist and these differences have
an impact on some managerial practices.
It should be noted that national cultural frameworks had been criticised (Harrison and
McKinnon (1999: p 483) for several weaknesses. These methodical weaknesses are the
failure to consider the ‘totality’ of the cultural domain, and the ‘tendency not to consider
explicitly the differential intensity of cultural norms and values across nations’.
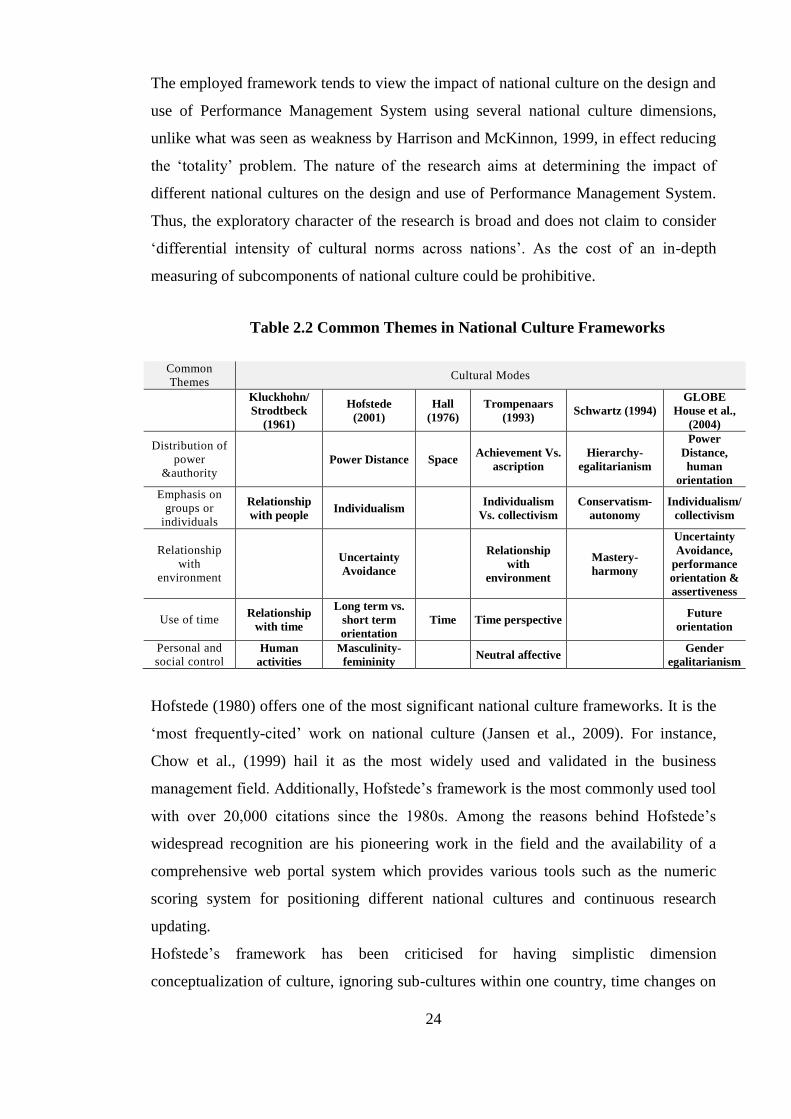
24
The employed framework tends to view the impact of national culture on the design and
use of Performance Management System using several national culture dimensions,
unlike what was seen as weakness by Harrison and McKinnon, 1999, in effect reducing
the ‘totality’ problem. The nature of the research aims at determining the impact of
different national cultures on the design and use of Performance Management System.
Thus, the exploratory character of the research is broad and does not claim to consider
‘differential intensity of cultural norms across nations’. As the cost of an in-depth
measuring of subcomponents of national culture could be prohibitive.
Table 2.2 Common Themes in National Culture Frameworks
Common
Themes Cultural Modes
Kluckhohn/
Strodtbeck
(1961)
Hofstede
(2001)
Hall
(1976)
Trompenaars
(1993) Schwartz (1994)
GLOBE
House et al.,
(2004)
Distribution of
power
&authority Power Distance Space
Achievement Vs.
ascription
Hierarchy-
egalitarianism
Power
Distance,
human
orientation
Emphasis on
groups or
individuals
Relationship
with people Individualism
Individualism
Vs. collectivism
Conservatism-
autonomy
Individualism/
collectivism
Relationship
with
environment
Uncertainty
Avoidance
Relationship
with
environment
Mastery-
harmony
Uncertainty
Avoidance,
performance
orientation &
assertiveness
Use of time Relationship
with time
Long term vs.
short term
orientation
Time Time perspective Future
orientation
Personal and
social control Human
activities
Masculinity-
femininity Neutral affective
Gender
egalitarianism
Hofstede (1980) offers one of the most significant national culture frameworks. It is the
‘most frequently-cited’ work on national culture (Jansen et al., 2009). For instance,
Chow et al., (1999) hail it as the most widely used and validated in the business
management field. Additionally, Hofstede’s framework is the most commonly used tool
with over 20,000 citations since the 1980s. Among the reasons behind Hofstede’s
widespread recognition are his pioneering work in the field and the availability of a
comprehensive web portal system which provides various tools such as the numeric
scoring system for positioning different national cultures and continuous research
updating.
Hofstede’s framework has been criticised for having simplistic dimension
conceptualization of culture, ignoring sub-cultures within one country, time changes on
25
his findings, the validity of his measures (McSweeney, 2002; Baskerville-Morley,
2005). Despite this criticism, Hofstede’s research had influenced subsequent research
efforts such as House et al., (2004), and Trompenaars & Hampden-Turner, (2012) as
they employed similar themes. Despite the apparent differences between them, they
agree on several dimension scores, which support the validity of Hofstede’s research.
In fact, following models after Hofstede’s add value to facilitate the understanding of
global management (Steers et al., 2009). For simplicity and accessibility, the thesis will
adopt Hofstede’s national culture framework as the source for national culture scores
and definitions. Further, the criticism made against Hofstede framework is unlikely to
have an impact on the findings of the research.
2.5.4. Hofstede National Culture Framework
Hofstede's national culture framework is based on differences in values and beliefs in
individuals’ goals and, thus, guides business by providing empirical explanations
between national and work culture. Hofstede uses five empirically identified dimensions
to describe national cultures; the first four cultural value dimensions were found in a
study of thirty-nine IBM subsidiaries throughout the world. Later research by Hofstede
and other collaborators added more national culture dimensions to the original study
and introduced a fifth cultural dimension. These values address issues of Power
Distance (PD); Uncertainty Avoidance; (UA); individualism/collectivism (IDV);
masculinity/femininity (MAS); and Term Orientation (TO).
Power Distance ‘expresses the degree to which the less powerful members of a society
accept and expect that power is distributed unequally’. Societies characterised with high
Power Distance accept unequal distribution of power in return for being granted a place
in the community. In low Power Distance cultures, people look for equality and expect
the actions of leaders to be justified. Individualism describes a society where individuals
are prepared to care for themselves and their immediate associates. On the other hand,
collectivist societies are comprised of tightly knit connected members who depend on
and loyal to each other. Masculine is a culture, which advocates achievement,
assertiveness, and competition, while a feminine culture prefers cooperation, caring and
quality of life. High Uncertainty Avoidance cultures are not comfortable with vagueness
and uncertainty. Therefore, they tend to use rigid codes of behaviour, while low
Uncertainty Avoidance cultures are comfortable with uncertainty and ambiguity. Long-
26
term orientation cultures take a pragmatic approach towards their actions. They plan for
future, and they view change positively. While short-term orientation cultures view
changes with scepticism and respect the past and ‘time-honoured traditions’ (Hofstede,
2016).
2.6. The Influence of Culture on Performance Management Systems
The research objective is to explore the impact of national culture on the design and use
Performance Management System. A systematic literature review was undertaken to
investigate past contributions. A systematic literature review was chosen to avoid bias
and increase rigour in the process. It differs from a traditional literature review in
adopting replicable and transparent process (Tranfield et al., 2003). In the next section,
the researcher reports the findings of the systematic literature review on the influence of
national culture on the design and use of Performance Management Systems.
2.6.1. The Influence of National Culture on PMS; Systematic Literature Review
The key words used in the systematic literature review were “national culture” AND
“performance management system(s)”, “performance measurement system(s)”, OR
“balanced scorecard”, OR “management control system(s)”, OR “managerial
accounting system(s)”. The research criteria included balanced scorecard, management
accounting systems and management control system to capture the widest possible
scores of publications. The search period was chosen from 1992, which was the date of
Kaplan and Norton’s publication concerning the balanced scorecard (Kaplan & Norton,
1992) until 2016. Google Scholar and ProQuest search engines were employed to look
for journals which had an impact factor of at least two stars according to the
classification made by the ABS (2010) in the fields of accountancy, general
management, strategic management and operations, technology & management, and
management science. Multinational organisations were not included because research
showed that in large organisations as the impact of organisational routines and
organisation cultures could be more influential than any possible influence of national
culture (Merchant & Van der Stede, 2003 and de Waal, 2006). Also, papers which
discussed the influence of national culture on purely accounting objectives, such as pay,
reward systems, incentives, compensation, budgets, transfer pricing, and papers
discussing the influence of national culture on performance only were also excluded.
27
Therefore, 17 papers remained from 2,510 papers after implementing the exclusion
criteria as shown in Table 2.3.
2.6.2. Theoretical Findings of the Systematic Literature
The results of the literature review on the impact of national culture were mostly from
management accounting literature (Awasthi et al., 1998; Harrison, 1992, 1993; Ueno &
Wu, 1993, Chow et al., 1994, 1996, 1999; Harrison & McKinnon, 1994; Efferin &
Hopper, 2007; Li & Tang, 2009; Tsui, 2001, Carmona et al., 2011; Etemadi et al., 2009;
Chenhall, 2003 and Harrison et al., 1999). Only two papers were found from a
managerial perspective (Mooraj et al., 1999; Peterson et al., 2002). Indicating a need for
research to be taken from performance measurement perspective to feel the knowledge
gap. Also, the papers argued whether national culture does had any impact at all. Also,
the evidence of some papers was based on anecdotal evidence (Mooraj et al., 1999)
indicating the need for empirical work.
It could be guessed that the reason behind the scant published articles in management
related journals, could be the attention given to performance measurement and
multinational organisations, joint ventures, and expatriate managers which were
excluded from the systematic literature review criteria.
There is disagreement whether national culture resulted in a permanent impact
on performance measurement, as some agreed, while others did not find
conclusive evident national culture’s impact (Awasthi et al., 1998; Harrison,
1992; Chow et al., 1994).
Second, the majority of the empirical papers employed survey-based research
methods, which was criticised by (Harrison & McKinnon, 1999) as inefficient in
capturing national culture impact on subjects. There is a need to have more
qualitative based research to enrich findings of a national culture. Third, most of
the reviewed papers were empirical (Table 2.3). However, the researchers have
not indicated a specific preference for a research method, and hence different
research methods were employed such as behavioural experiments, surveys,
ethnography, and mixed methods. Again, the action of comparing different
works is difficult because of the different research method employed.
Most of the papers belong to management accounting dealing with topics such
as budget control practices, data manipulation, organisation design and planning
28
and control and budgetary participation. The few papers which were dealing
with the performance management system were few and did not sufficiently
answer the research questions.
Many papers did not provide sufficient details about Performance Management
Systems design such as the type of PM measures used. Just, some papers
discussed subjective or objective performance measures (Efferin & Hopper,
2007), or long/ short-term impact of measures (Ueno & Wu, 1993).
The scope of the national culture investigated by researchers mostly covered
European, North American, China or Japan. Some regions such as the Middle
East were not discussed.
The number of countries described varied in the reviewed papers. Some
concentrated in one country, and describe Performance Management Systems
design and from a specific national cultural dimension perspective (Li & Tang,
2009), making the process of comparing Performance Management System
practices with other countries difficult.
Few reviewed papers investigated the impact of national culture on Performance
Management System use.
In Table 2.3, the researcher presented a summary of the reviewed papers. The findings
of the literature review are summarised in the next section.
2.7. Conclusion of literature review
The research questions are how does National Culture impact on the design and use of
Performance Management Systems? The findings of the literature review in Table 2.4
demonstrated that reviewed literature does not answer the research questions, for several
reasons shown the previous section.
From the above, it can be concluded that the findings of national culture impact on the
Performance Management Systems Design and Use are fragmented, but enough to
construct an inductive theoretical framework. Therefore, research is needed to close the
existing gap of knowledge because previous literature does not answer the ‘how’
question. In the next section, a theoretical framework will be constructed to evaluate the
influence of national culture in different organisations operating in different nations.
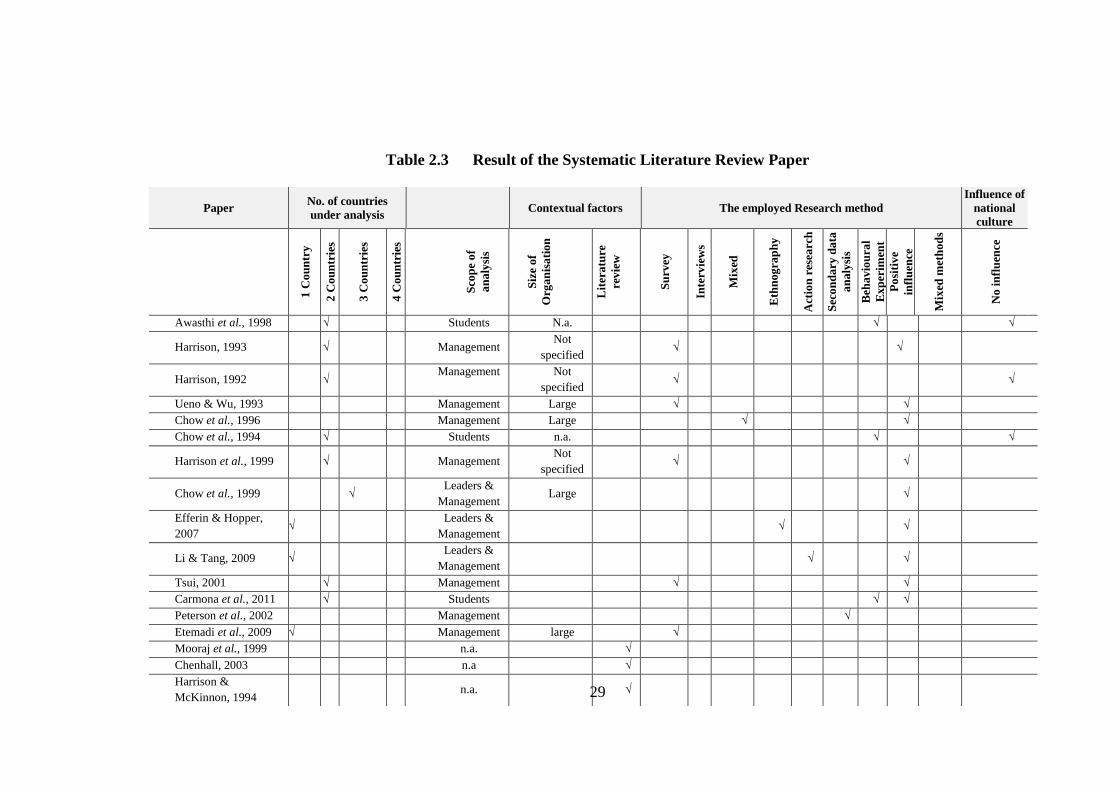
29
Table 2.3 Result of the Systematic Literature Review Paper
Paper No. of countries
under analysis Contextual factors The employed Research method
Influence of
national
culture
1 C
ou
ntr
y
2 C
ou
ntr
ies
3 C
ou
ntr
ies
4 C
ou
ntr
ies
Sco
pe
of
an
aly
sis
Siz
e o
f
Org
an
isa
tio
n
Lit
era
ture
rev
iew
Su
rvey
Inte
rvie
ws
Mix
ed
Eth
nog
rap
hy
Act
ion
res
earc
h
Sec
on
da
ry d
ata
an
aly
sis
Beh
av
iou
ral
Ex
per
imen
t
Po
siti
ve
infl
uen
ce
Mix
ed m
eth
od
s
No
in
flu
ence
Awasthi et al., 1998 √ Students N.a. √ √
Harrison, 1993 √ Management Not
specified √ √
Harrison, 1992 √ Management Not
specified √ √
Ueno & Wu, 1993 Management Large √ √
Chow et al., 1996 Management Large √ √
Chow et al., 1994 √ Students n.a. √ √
Harrison et al., 1999 √ Management Not
specified √ √
Chow et al., 1999 √ Leaders &
Management Large √
Efferin & Hopper,
2007 √
Leaders &
Management √ √
Li & Tang, 2009 √ Leaders &
Management √ √
Tsui, 2001 √ Management √ √
Carmona et al., 2011 √ Students √ √
Peterson et al., 2002 Management √
Etemadi et al., 2009 √ Management large √
Mooraj et al., 1999 n.a. √
Chenhall, 2003 n.a √
Harrison &
McKinnon, 1994 n.a. √
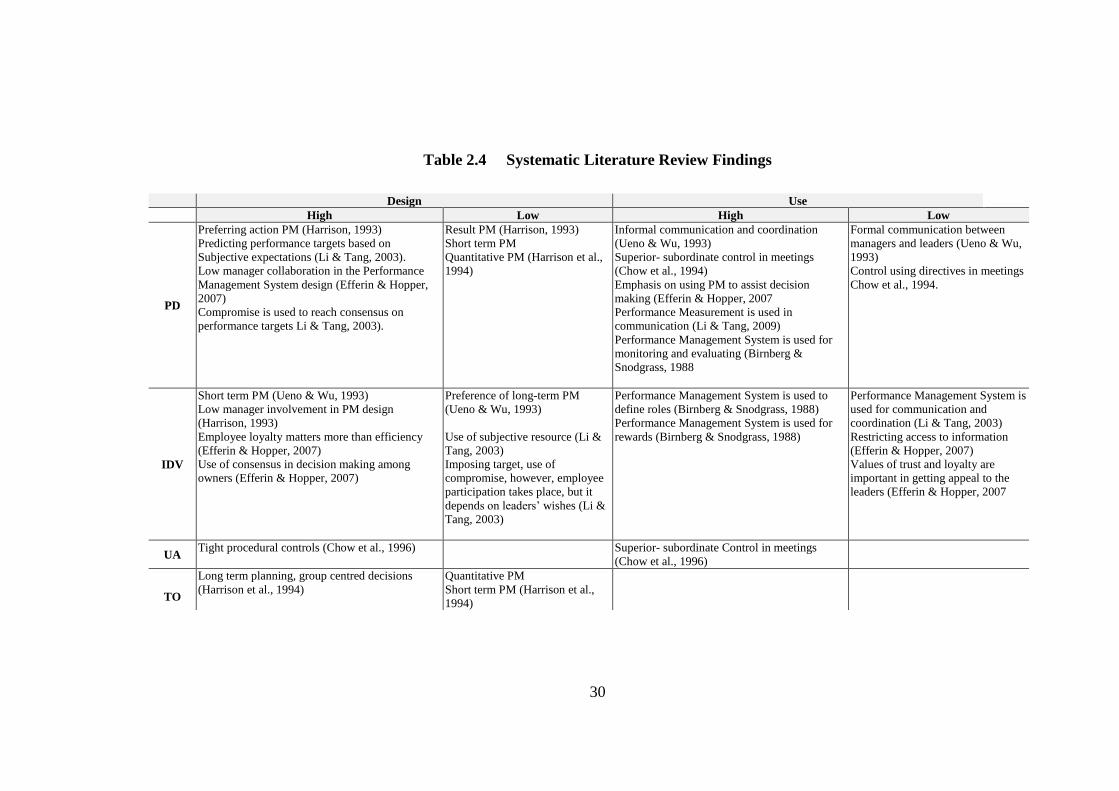
30
Table 2.4 Systematic Literature Review Findings
Design Use
High Low High Low
PD
Preferring action PM (Harrison, 1993)
Predicting performance targets based on
Subjective expectations (Li & Tang, 2003).
Low manager collaboration in the Performance
Management System design (Efferin & Hopper,
2007)
Compromise is used to reach consensus on
performance targets Li & Tang, 2003).
Result PM (Harrison, 1993)
Short term PM
Quantitative PM (Harrison et al.,
1994)
Informal communication and coordination
(Ueno & Wu, 1993)
Superior- subordinate control in meetings
(Chow et al., 1994)
Emphasis on using PM to assist decision
making (Efferin & Hopper, 2007
Performance Measurement is used in
communication (Li & Tang, 2009)
Performance Management System is used for
monitoring and evaluating (Birnberg &
Snodgrass, 1988
Formal communication between
managers and leaders (Ueno & Wu,
1993)
Control using directives in meetings
Chow et al., 1994.
IDV
Short term PM (Ueno & Wu, 1993)
Low manager involvement in PM design
(Harrison, 1993)
Employee loyalty matters more than efficiency
(Efferin & Hopper, 2007)
Use of consensus in decision making among
owners (Efferin & Hopper, 2007)
Preference of long-term PM
(Ueno & Wu, 1993)
Use of subjective resource (Li &
Tang, 2003)
Imposing target, use of
compromise, however, employee
participation takes place, but it
depends on leaders’ wishes (Li &
Tang, 2003)
Performance Management System is used to
define roles (Birnberg & Snodgrass, 1988)
Performance Management System is used for
rewards (Birnberg & Snodgrass, 1988)
Performance Management System is
used for communication and
coordination (Li & Tang, 2003)
Restricting access to information
(Efferin & Hopper, 2007)
Values of trust and loyalty are
important in getting appeal to the
leaders (Efferin & Hopper, 2007
UA Tight procedural controls (Chow et al., 1996) Superior- subordinate Control in meetings
(Chow et al., 1996)
TO
Long term planning, group centred decisions
(Harrison et al., 1994)
Quantitative PM
Short term PM (Harrison et al.,
1994)
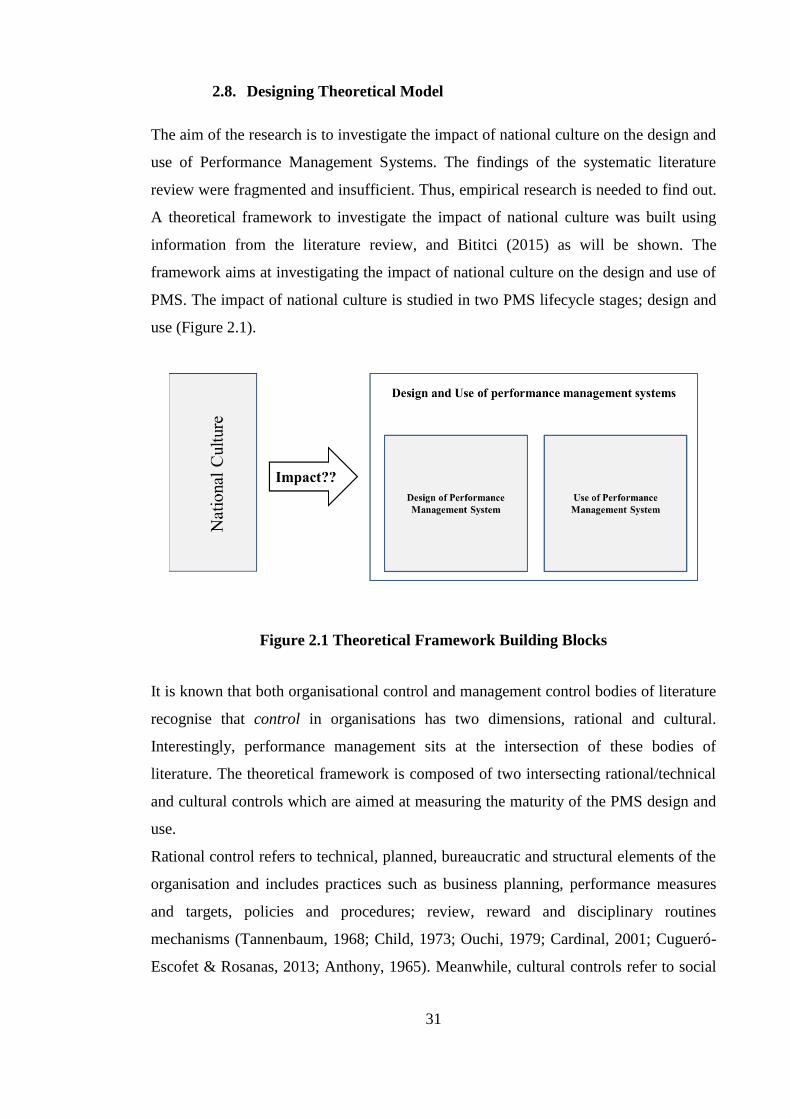
31
2.8. Designing Theoretical Model
The aim of the research is to investigate the impact of national culture on the design and
use of Performance Management Systems. The findings of the systematic literature
review were fragmented and insufficient. Thus, empirical research is needed to find out.
A theoretical framework to investigate the impact of national culture was built using
information from the literature review, and Bititci (2015) as will be shown. The
framework aims at investigating the impact of national culture on the design and use of
PMS. The impact of national culture is studied in two PMS lifecycle stages; design and
use (Figure 2.1).
Figure 2.1 Theoretical Framework Building Blocks
It is known that both organisational control and management control bodies of literature
recognise that control in organisations has two dimensions, rational and cultural.
Interestingly, performance management sits at the intersection of these bodies of
literature. The theoretical framework is composed of two intersecting rational/technical
and cultural controls which are aimed at measuring the maturity of the PMS design and
use.
Rational control refers to technical, planned, bureaucratic and structural elements of the
organisation and includes practices such as business planning, performance measures
and targets, policies and procedures; review, reward and disciplinary routines
mechanisms (Tannenbaum, 1968; Child, 1973; Ouchi, 1979; Cardinal, 2001; Cugueró-
Escofet & Rosanas, 2013; Anthony, 1965). Meanwhile, cultural controls refer to social
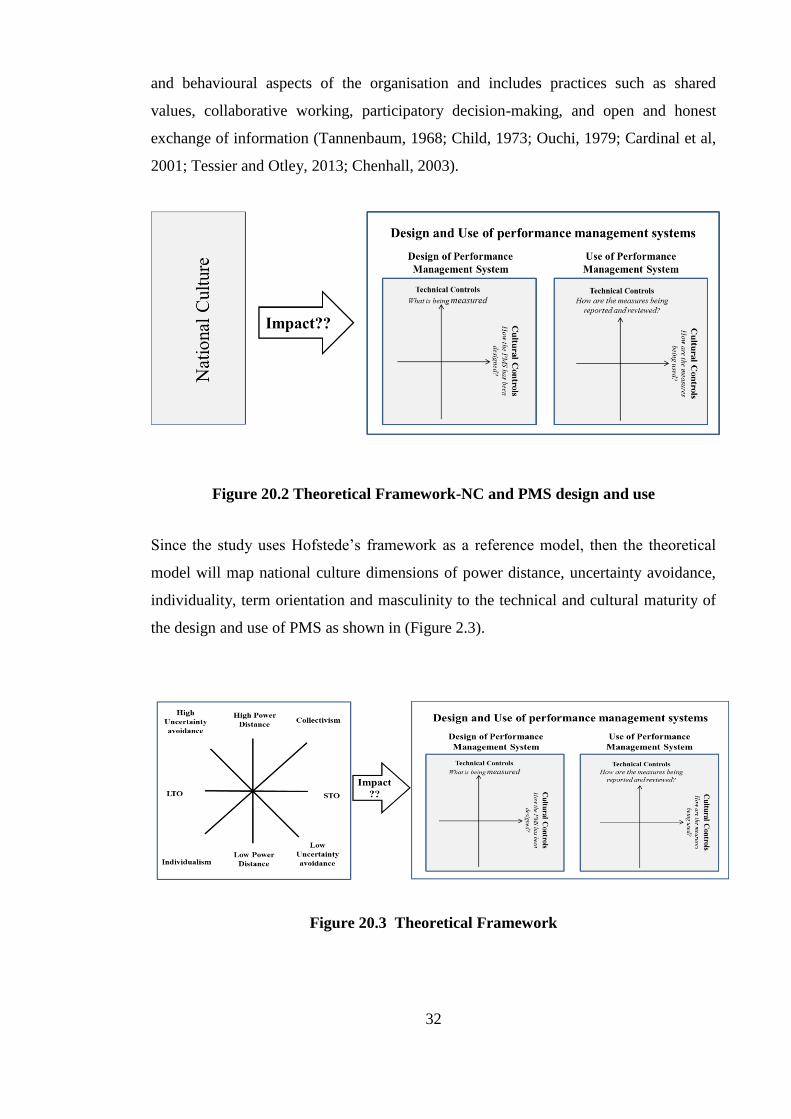
32
and behavioural aspects of the organisation and includes practices such as shared
values, collaborative working, participatory decision-making, and open and honest
exchange of information (Tannenbaum, 1968; Child, 1973; Ouchi, 1979; Cardinal et al,
2001; Tessier and Otley, 2013; Chenhall, 2003).
Figure 20.2 Theoretical Framework-NC and PMS design and use
Since the study uses Hofstede’s framework as a reference model, then the theoretical
model will map national culture dimensions of power distance, uncertainty avoidance,
individuality, term orientation and masculinity to the technical and cultural maturity of
the design and use of PMS as shown in (Figure 2.3).
Figure 20.3 Theoretical Framework
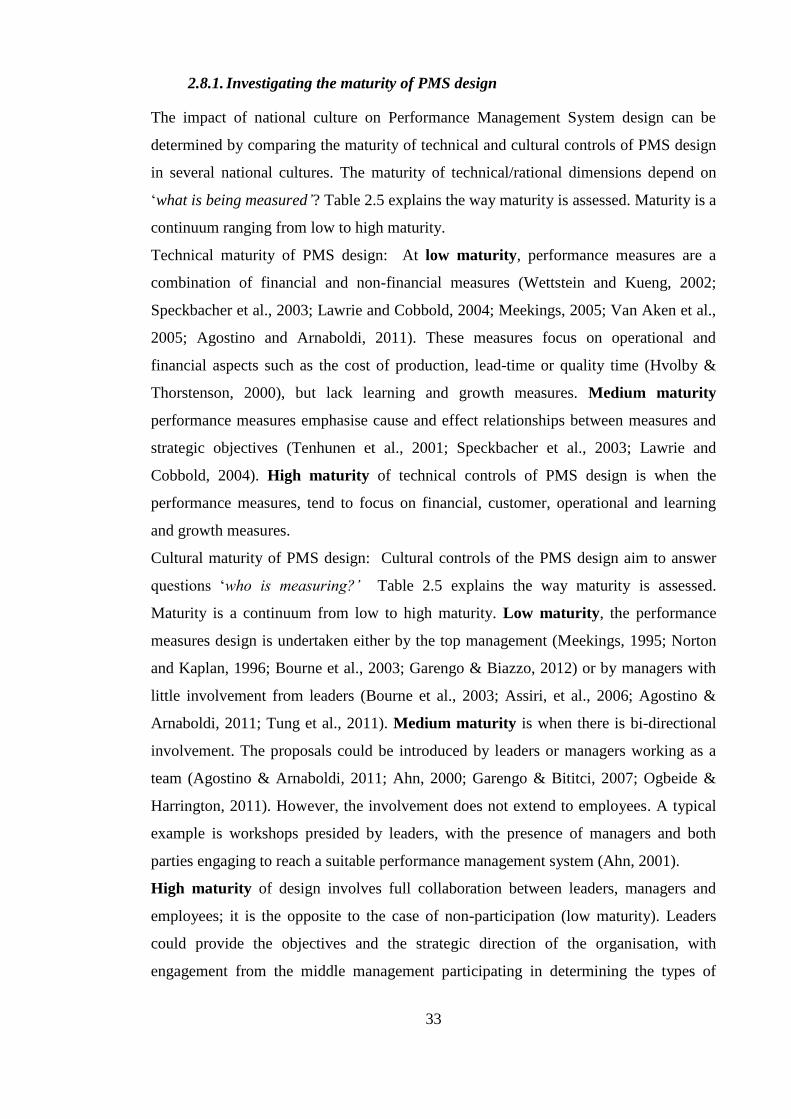
33
2.8.1. Investigating the maturity of PMS design
The impact of national culture on Performance Management System design can be
determined by comparing the maturity of technical and cultural controls of PMS design
in several national cultures. The maturity of technical/rational dimensions depend on
‘what is being measured’? Table 2.5 explains the way maturity is assessed. Maturity is a
continuum ranging from low to high maturity.
Technical maturity of PMS design: At low maturity, performance measures are a
combination of financial and non-financial measures (Wettstein and Kueng, 2002;
Speckbacher et al., 2003; Lawrie and Cobbold, 2004; Meekings, 2005; Van Aken et al.,
2005; Agostino and Arnaboldi, 2011). These measures focus on operational and
financial aspects such as the cost of production, lead-time or quality time (Hvolby &
Thorstenson, 2000), but lack learning and growth measures. Medium maturity
performance measures emphasise cause and effect relationships between measures and
strategic objectives (Tenhunen et al., 2001; Speckbacher et al., 2003; Lawrie and
Cobbold, 2004). High maturity of technical controls of PMS design is when the
performance measures, tend to focus on financial, customer, operational and learning
and growth measures.
Cultural maturity of PMS design: Cultural controls of the PMS design aim to answer
questions ‘who is measuring?’ Table 2.5 explains the way maturity is assessed.
Maturity is a continuum from low to high maturity. Low maturity, the performance
measures design is undertaken either by the top management (Meekings, 1995; Norton
and Kaplan, 1996; Bourne et al., 2003; Garengo & Biazzo, 2012) or by managers with
little involvement from leaders (Bourne et al., 2003; Assiri, et al., 2006; Agostino &
Arnaboldi, 2011; Tung et al., 2011). Medium maturity is when there is bi-directional
involvement. The proposals could be introduced by leaders or managers working as a
team (Agostino & Arnaboldi, 2011; Ahn, 2000; Garengo & Bititci, 2007; Ogbeide &
Harrington, 2011). However, the involvement does not extend to employees. A typical
example is workshops presided by leaders, with the presence of managers and both
parties engaging to reach a suitable performance management system (Ahn, 2001).
High maturity of design involves full collaboration between leaders, managers and
employees; it is the opposite to the case of non-participation (low maturity). Leaders
could provide the objectives and the strategic direction of the organisation, with
engagement from the middle management participating in determining the types of
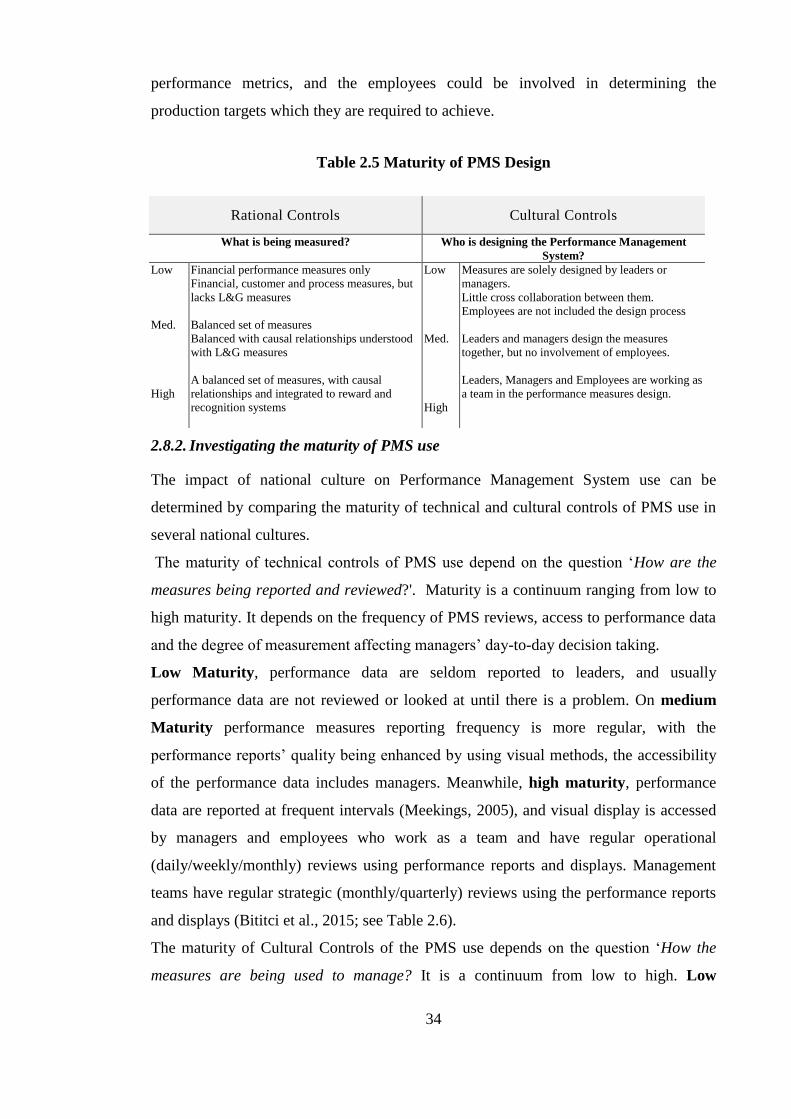
34
performance metrics, and the employees could be involved in determining the
production targets which they are required to achieve.
Table 2.5 Maturity of PMS Design
Rational Controls Cultural Controls
What is being measured? Who is designing the Performance Management
System?
Low
Med.
High
Financial performance measures only
Financial, customer and process measures, but
lacks L&G measures
Balanced set of measures
Balanced with causal relationships understood
with L&G measures
A balanced set of measures, with causal
relationships and integrated to reward and
recognition systems
Low
Med.
High
Measures are solely designed by leaders or
managers.
Little cross collaboration between them.
Employees are not included the design process
Leaders and managers design the measures
together, but no involvement of employees.
Leaders, Managers and Employees are working as
a team in the performance measures design.
2.8.2. Investigating the maturity of PMS use
The impact of national culture on Performance Management System use can be
determined by comparing the maturity of technical and cultural controls of PMS use in
several national cultures.
The maturity of technical controls of PMS use depend on the question ‘How are the
measures being reported and reviewed?'. Maturity is a continuum ranging from low to
high maturity. It depends on the frequency of PMS reviews, access to performance data
and the degree of measurement affecting managers’ day-to-day decision taking.
Low Maturity, performance data are seldom reported to leaders, and usually
performance data are not reviewed or looked at until there is a problem. On medium
Maturity performance measures reporting frequency is more regular, with the
performance reports’ quality being enhanced by using visual methods, the accessibility
of the performance data includes managers. Meanwhile, high maturity, performance
data are reported at frequent intervals (Meekings, 2005), and visual display is accessed
by managers and employees who work as a team and have regular operational
(daily/weekly/monthly) reviews using performance reports and displays. Management
teams have regular strategic (monthly/quarterly) reviews using the performance reports
and displays (Bititci et al., 2015; see Table 2.6).
The maturity of Cultural Controls of the PMS use depends on the question ‘How the
measures are being used to manage? It is a continuum from low to high. Low
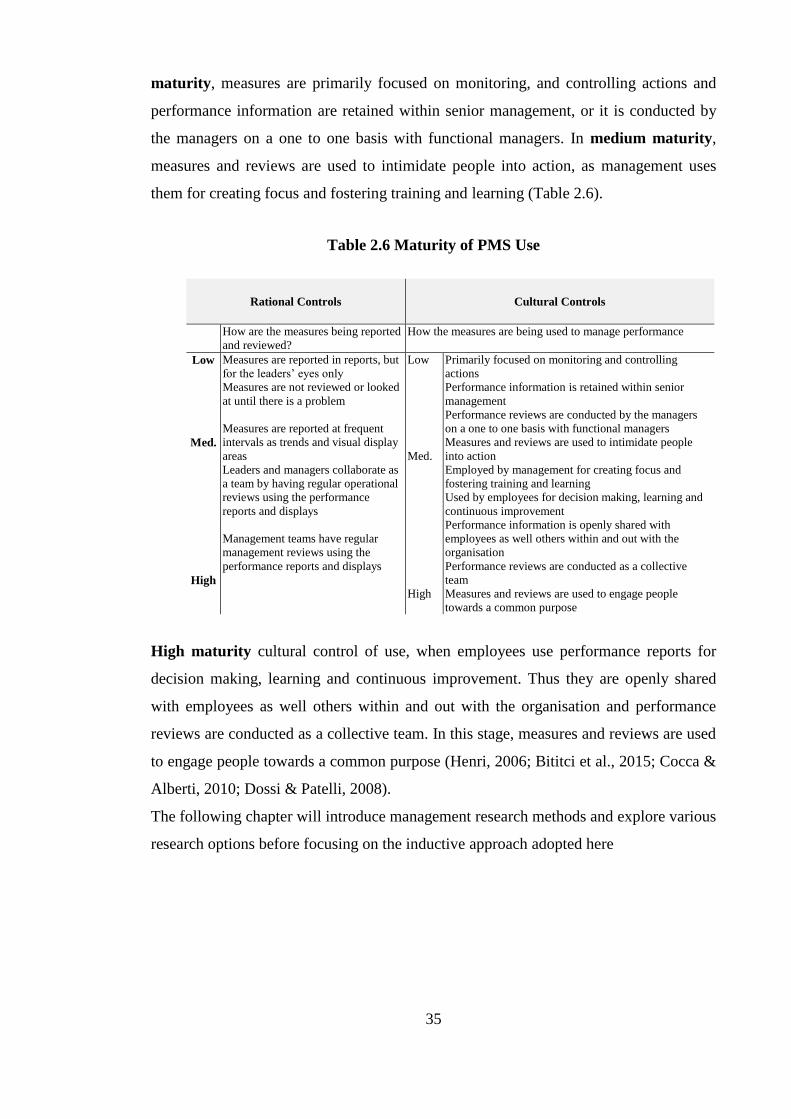
35
maturity, measures are primarily focused on monitoring, and controlling actions and
performance information are retained within senior management, or it is conducted by
the managers on a one to one basis with functional managers. In medium maturity,
measures and reviews are used to intimidate people into action, as management uses
them for creating focus and fostering training and learning (Table 2.6).
Table 2.6 Maturity of PMS Use
Rational Controls Cultural Controls
How are the measures being reported
and reviewed?
How the measures are being used to manage performance
Low
Med.
High
Measures are reported in reports, but
for the leaders’ eyes only
Measures are not reviewed or looked
at until there is a problem
Measures are reported at frequent
intervals as trends and visual display
areas
Leaders and managers collaborate as
a team by having regular operational
reviews using the performance
reports and displays
Management teams have regular
management reviews using the
performance reports and displays
Low
Med.
High
Primarily focused on monitoring and controlling
actions
Performance information is retained within senior
management
Performance reviews are conducted by the managers
on a one to one basis with functional managers
Measures and reviews are used to intimidate people
into action
Employed by management for creating focus and
fostering training and learning
Used by employees for decision making, learning and
continuous improvement
Performance information is openly shared with
employees as well others within and out with the
organisation
Performance reviews are conducted as a collective
team
Measures and reviews are used to engage people
towards a common purpose
High maturity cultural control of use, when employees use performance reports for
decision making, learning and continuous improvement. Thus they are openly shared
with employees as well others within and out with the organisation and performance
reviews are conducted as a collective team. In this stage, measures and reviews are used
to engage people towards a common purpose (Henri, 2006; Bititci et al., 2015; Cocca &
Alberti, 2010; Dossi & Patelli, 2008).
The following chapter will introduce management research methods and explore various
research options before focusing on the inductive approach adopted here
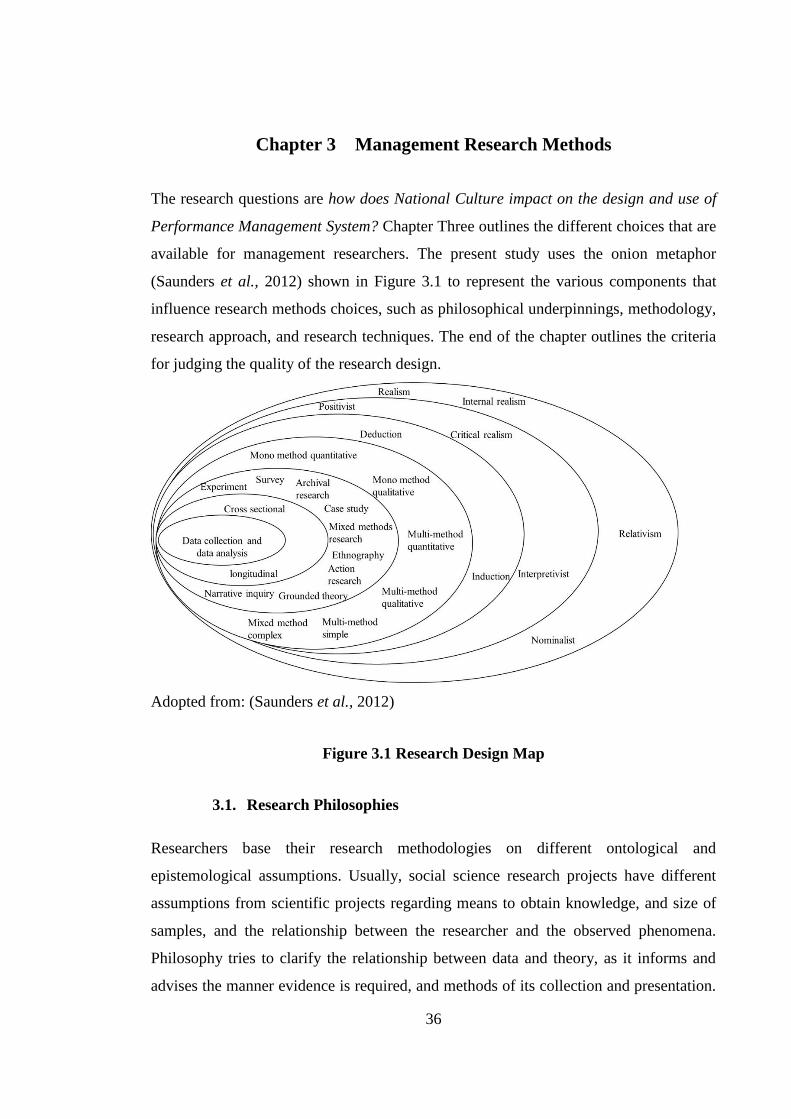
36
Chapter 3 Management Research Methods
The research questions are how does National Culture impact on the design and use of
Performance Management System? Chapter Three outlines the different choices that are
available for management researchers. The present study uses the onion metaphor
(Saunders et al., 2012) shown in Figure 3.1 to represent the various components that
influence research methods choices, such as philosophical underpinnings, methodology,
research approach, and research techniques. The end of the chapter outlines the criteria
for judging the quality of the research design.
Adopted from: (Saunders et al., 2012)
Figure 3.1 Research Design Map
3.1. Research Philosophies
Researchers base their research methodologies on different ontological and
epistemological assumptions. Usually, social science research projects have different
assumptions from scientific projects regarding means to obtain knowledge, and size of
samples, and the relationship between the researcher and the observed phenomena.
Philosophy tries to clarify the relationship between data and theory, as it informs and
advises the manner evidence is required, and methods of its collection and presentation.
37
Management and business-related research deals with social issues and, as such,
involves human interaction, which requires data collection methods that are different to
those used in scientific research. Research philosophy advises researchers who are
investigating human interaction and provides frameworks that set out the ground rules
and guide the researcher in determining how the evidence should be collected,
interpreted and analysed. Philosophy provides a framework to acknowledge valid
research. For management researchers, philosophy tends to be simplified to a
dichotomy: objective and subjective; or: philosophy of science or philosophy of social
science (Collis & Hussey, 2011). The objective or scientific, philosophy presumes that
there is only one reality, which is independent of the researcher; while in subjective
philosophy, reality is socially constructed. These different assumptions can be explained
by four factors: ontology, epistemology, methodology, and methods/techniques
(Easterby-Smith et al., 2012).
In this section, ontology and epistemology are explained, summarising the current
debate and exploring these dimensions, which is followed by a discussion of the
assumptions made by this research relating to the chosen research paradigm.
3.2. Ontology
Ontology as defined as one’s understanding of the “nature of reality and existence”
(Easterby-Smith et al., 2012; p. 17). When conducting research, scholars should draw
on different ontological assumptions to improve the quality of research; these
assumptions can be simply represented on a continuum, from realism to relativism and
nominalism. Realism assumes that truth is singular, that the world is concrete and
external and that science can only progress through observations that directly
correspond to the phenomena being investigated. Realist scientists assume that the truth
of scientific laws is independent of the process of discovery (Easterby-Smith et al.,
2012).
Internal realism assumes that there is a single reality, but that it is impossible to observe
it directly; rather, it is only possible to gather ‘indirect’ evidence of the phenomena
under investigation. Internal realists accept scientific laws as absolute and independent
of further observations. However, relativists believe that scientific laws are not simply
there to be discovered, but are created by people (Easterby-Smith et al., 2012).
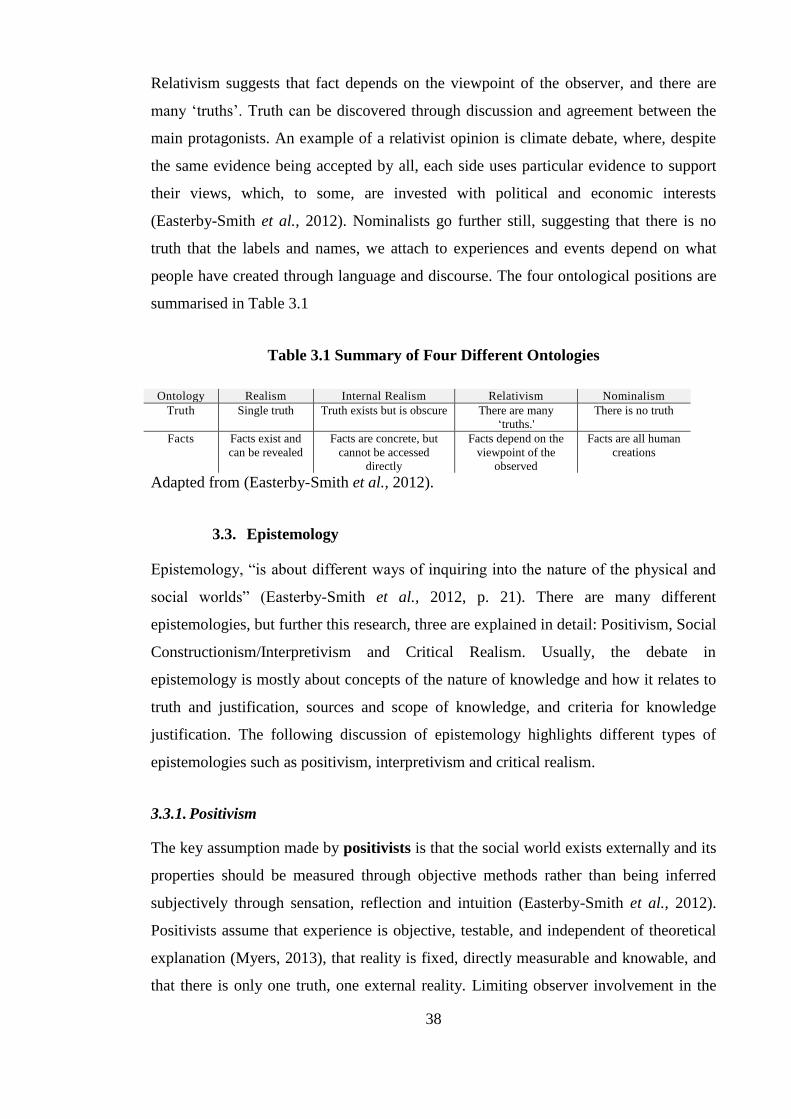
38
Relativism suggests that fact depends on the viewpoint of the observer, and there are
many ‘truths’. Truth can be discovered through discussion and agreement between the
main protagonists. An example of a relativist opinion is climate debate, where, despite
the same evidence being accepted by all, each side uses particular evidence to support
their views, which, to some, are invested with political and economic interests
(Easterby-Smith et al., 2012). Nominalists go further still, suggesting that there is no
truth that the labels and names, we attach to experiences and events depend on what
people have created through language and discourse. The four ontological positions are
summarised in Table 3.1
Table 3.1 Summary of Four Different Ontologies
Ontology Realism Internal Realism Relativism Nominalism
Truth Single truth Truth exists but is obscure There are many
‘truths.'
There is no truth
Facts Facts exist and
can be revealed
Facts are concrete, but
cannot be accessed
directly
Facts depend on the
viewpoint of the
observed
Facts are all human
creations
Adapted from (Easterby-Smith et al., 2012).
3.3. Epistemology
Epistemology, “is about different ways of inquiring into the nature of the physical and
social worlds” (Easterby-Smith et al., 2012, p. 21). There are many different
epistemologies, but further this research, three are explained in detail: Positivism, Social
Constructionism/Interpretivism and Critical Realism. Usually, the debate in
epistemology is mostly about concepts of the nature of knowledge and how it relates to
truth and justification, sources and scope of knowledge, and criteria for knowledge
justification. The following discussion of epistemology highlights different types of
epistemologies such as positivism, interpretivism and critical realism.
3.3.1. Positivism
The key assumption made by positivists is that the social world exists externally and its
properties should be measured through objective methods rather than being inferred
subjectively through sensation, reflection and intuition (Easterby-Smith et al., 2012).
Positivists assume that experience is objective, testable, and independent of theoretical
explanation (Myers, 2013), that reality is fixed, directly measurable and knowable, and
that there is only one truth, one external reality. Limiting observer involvement in the
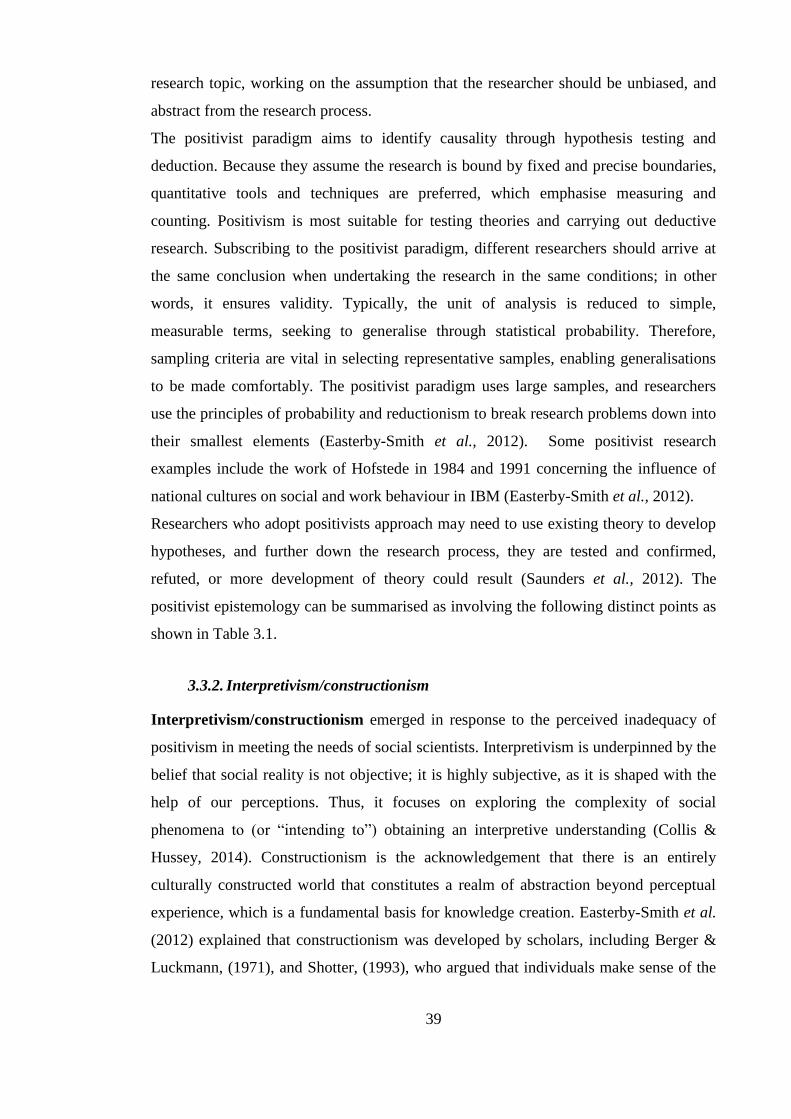
39
research topic, working on the assumption that the researcher should be unbiased, and
abstract from the research process.
The positivist paradigm aims to identify causality through hypothesis testing and
deduction. Because they assume the research is bound by fixed and precise boundaries,
quantitative tools and techniques are preferred, which emphasise measuring and
counting. Positivism is most suitable for testing theories and carrying out deductive
research. Subscribing to the positivist paradigm, different researchers should arrive at
the same conclusion when undertaking the research in the same conditions; in other
words, it ensures validity. Typically, the unit of analysis is reduced to simple,
measurable terms, seeking to generalise through statistical probability. Therefore,
sampling criteria are vital in selecting representative samples, enabling generalisations
to be made comfortably. The positivist paradigm uses large samples, and researchers
use the principles of probability and reductionism to break research problems down into
their smallest elements (Easterby-Smith et al., 2012). Some positivist research
examples include the work of Hofstede in 1984 and 1991 concerning the influence of
national cultures on social and work behaviour in IBM (Easterby-Smith et al., 2012).
Researchers who adopt positivists approach may need to use existing theory to develop
hypotheses, and further down the research process, they are tested and confirmed,
refuted, or more development of theory could result (Saunders et al., 2012). The
positivist epistemology can be summarised as involving the following distinct points as
shown in Table 3.1.
3.3.2. Interpretivism/constructionism
Interpretivism/constructionism emerged in response to the perceived inadequacy of
positivism in meeting the needs of social scientists. Interpretivism is underpinned by the
belief that social reality is not objective; it is highly subjective, as it is shaped with the
help of our perceptions. Thus, it focuses on exploring the complexity of social
phenomena to (or “intending to”) obtaining an interpretive understanding (Collis &
Hussey, 2014). Constructionism is the acknowledgement that there is an entirely
culturally constructed world that constitutes a realm of abstraction beyond perceptual
experience, which is a fundamental basis for knowledge creation. Easterby-Smith et al.
(2012) explained that constructionism was developed by scholars, including Berger &
Luckmann, (1971), and Shotter, (1993), who argued that individuals make sense of the
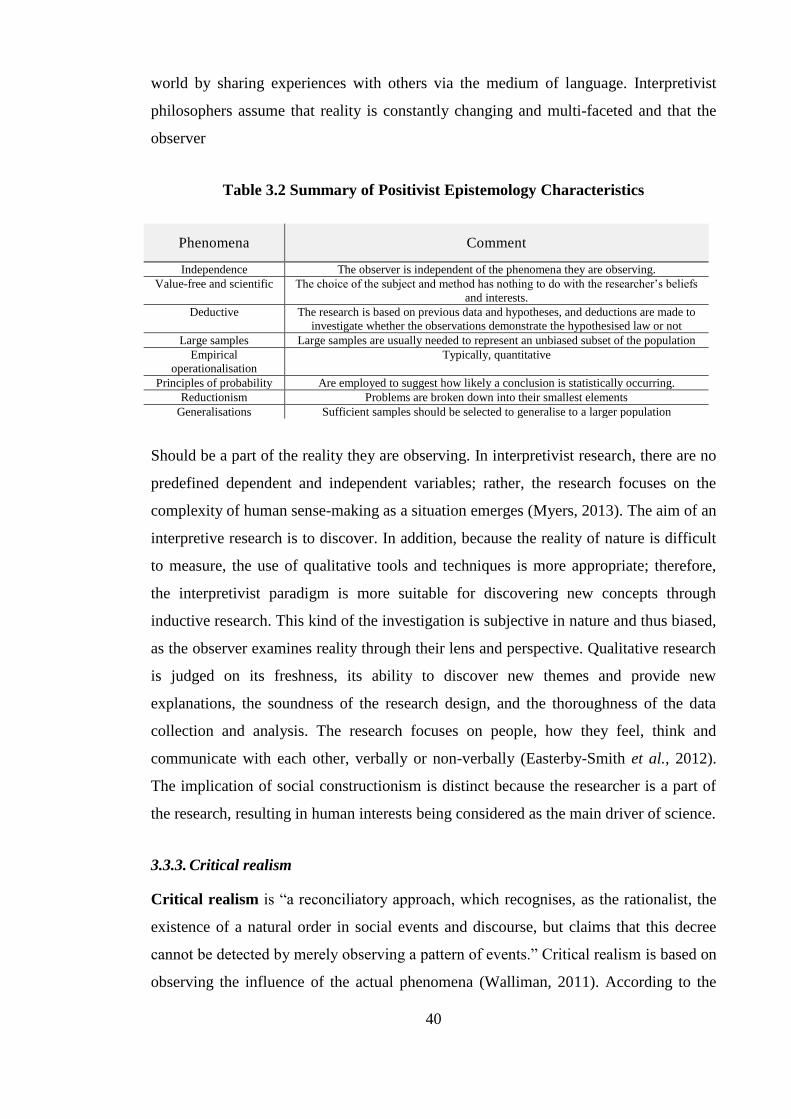
40
world by sharing experiences with others via the medium of language. Interpretivist
philosophers assume that reality is constantly changing and multi-faceted and that the
observer
Table 3.2 Summary of Positivist Epistemology Characteristics
Phenomena Comment
Independence The observer is independent of the phenomena they are observing.
Value-free and scientific The choice of the subject and method has nothing to do with the researcher’s beliefs
and interests.
Deductive The research is based on previous data and hypotheses, and deductions are made to
investigate whether the observations demonstrate the hypothesised law or not
Large samples Large samples are usually needed to represent an unbiased subset of the population
Empirical
operationalisation
Typically, quantitative
Principles of probability Are employed to suggest how likely a conclusion is statistically occurring.
Reductionism Problems are broken down into their smallest elements
Generalisations Sufficient samples should be selected to generalise to a larger population
Should be a part of the reality they are observing. In interpretivist research, there are no
predefined dependent and independent variables; rather, the research focuses on the
complexity of human sense-making as a situation emerges (Myers, 2013). The aim of an
interpretive research is to discover. In addition, because the reality of nature is difficult
to measure, the use of qualitative tools and techniques is more appropriate; therefore,
the interpretivist paradigm is more suitable for discovering new concepts through
inductive research. This kind of the investigation is subjective in nature and thus biased,
as the observer examines reality through their lens and perspective. Qualitative research
is judged on its freshness, its ability to discover new themes and provide new
explanations, the soundness of the research design, and the thoroughness of the data
collection and analysis. The research focuses on people, how they feel, think and
communicate with each other, verbally or non-verbally (Easterby-Smith et al., 2012).
The implication of social constructionism is distinct because the researcher is a part of
the research, resulting in human interests being considered as the main driver of science.
3.3.3. Critical realism
Critical realism is “a reconciliatory approach, which recognises, as the rationalist, the
existence of a natural order in social events and discourse, but claims that this decree
cannot be detected by merely observing a pattern of events.” Critical realism is based on
observing the influence of the actual phenomena (Walliman, 2011). According to the
41
critical realist stance, there are three domains of ‘ontological positions’ (Easterby-Smith
et al., 2012, p. 29): real, actual, and empirical. First, ‘reality’ is constituted by causal
powers and mechanisms and cannot be detected by human faculties. Second, ‘actuality’,
comprises events and actions that take place as a result of the ‘aforementioned’ causal
powers and mechanisms; this could be seen or not seen, depending on conditions. Third,
the empirical domain comprises the experiences and perceptions people have as a result
of, or in response to, the actual phenomena.
Table 3.3 Comparison between Ontologies and Epistemologies
These three levels of domains together make up a structured ontology. These domains
correspond approximately to the three ontological positions, respectively, realism,
internal realism, and relativism (Easterby-Smith et al., 2012).
3.4. Methodology
The methodology is the “approach and strategy used to conduct research” (Wilson,
2010: p. 3). It is concerned with the overall approach to the research process; this
includes theoretical application, collection and data analysis. They can be either
deductive or inductive. There is a relationship between particular ontologies,
epistemologies and methods. For example, realist and internal realist ontologies lend
themselves to positivist epistemologies and research methods, such as survey and
experiments, while constructionism is linked to internal realist and relevant ontologies,
and the utilisation of research methods such as interviews and archival research (Collis
& Hussey, 2014). Table 3.2 shows the methodological implications of different
Ontologies Realism Internal Realism Relativism Nominalism
Epistemology
Methodology Strong Positivism Positivism Constructionism
Strong
Constructionism
Aim Discovery Exposure Convergence Invention
Starting Point Hypotheses Propositions Questions Critique
Design(s) Experiment Large surveys; multi
cases Cases and surveys
Engagement and
reflexivity
Data types Numbers and facts Numbers and words Words and numbers Discourse and
experiences
Analysis/
Interpretation
Verification/
Falsification
Correlations and
regression
Triangulation and
comparison
Sense-making;
understanding
Outcomes Confirmation of theories Theory testing and
generation Theory generation
New insights and
actions
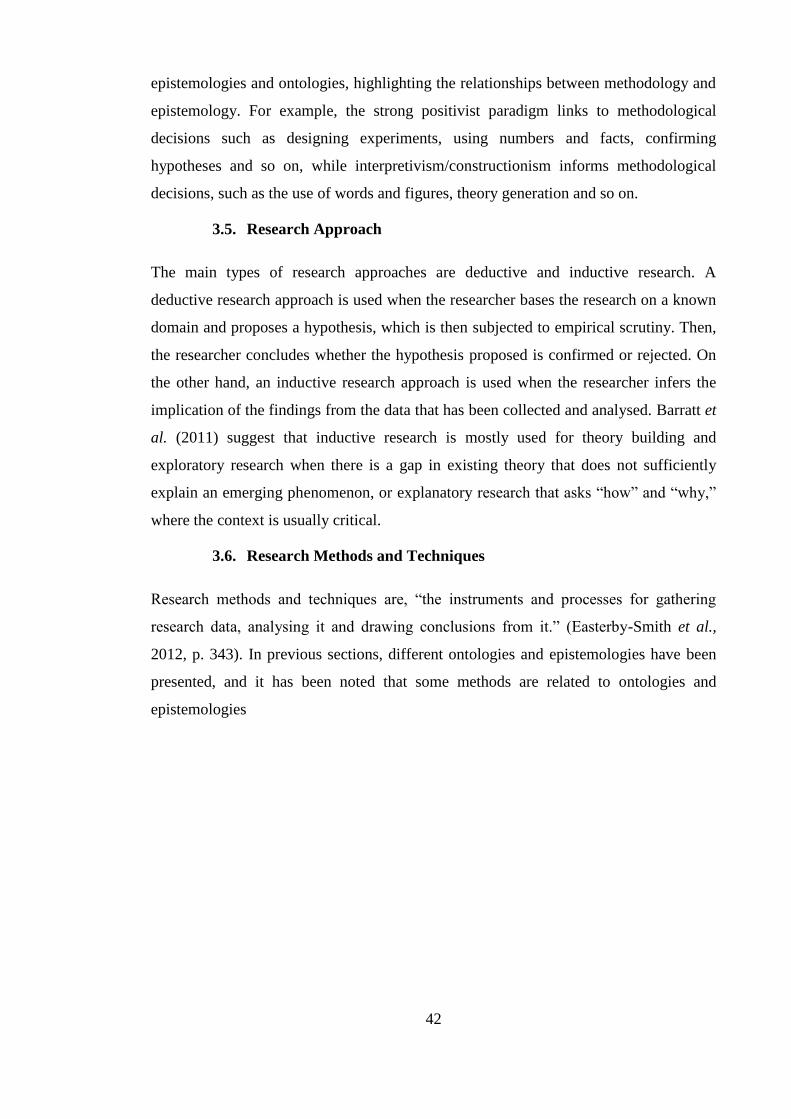
42
epistemologies and ontologies, highlighting the relationships between methodology and
epistemology. For example, the strong positivist paradigm links to methodological
decisions such as designing experiments, using numbers and facts, confirming
hypotheses and so on, while interpretivism/constructionism informs methodological
decisions, such as the use of words and figures, theory generation and so on.
3.5. Research Approach
The main types of research approaches are deductive and inductive research. A
deductive research approach is used when the researcher bases the research on a known
domain and proposes a hypothesis, which is then subjected to empirical scrutiny. Then,
the researcher concludes whether the hypothesis proposed is confirmed or rejected. On
the other hand, an inductive research approach is used when the researcher infers the
implication of the findings from the data that has been collected and analysed. Barratt et
al. (2011) suggest that inductive research is mostly used for theory building and
exploratory research when there is a gap in existing theory that does not sufficiently
explain an emerging phenomenon, or explanatory research that asks “how” and “why,”
where the context is usually critical.
3.6. Research Methods and Techniques
Research methods and techniques are, “the instruments and processes for gathering
research data, analysing it and drawing conclusions from it.” (Easterby-Smith et al.,
2012, p. 343). In previous sections, different ontologies and epistemologies have been
presented, and it has been noted that some methods are related to ontologies and
epistemologies
43
Figure 3.2 Differences Between Induction and Deduction Approaches
The following section provides a brief description of different types of research
methods. Rather than explaining all known research methods, only those deemed most
commonly used or relevant to this research are discussed. The chosen methods include
experimental design, quasi-experimental design, survey research design, action
research, case studies, ethnography and grounded theory.
3.6.1. Experimental Designs
Experimental design involves the random allocation of subjects to either a control or
experimental groups. Typically, the conditions of the experimental group are reworked
(independent variable(s), and the effects that arise due to the alterations are assessed
(dependent variable(s), leading the hypotheses to be confirmed, or not. This approach is
used in medical or natural science research, although it is sometimes used about
organisational behaviour. The advantages of experimental design include allowing other
researchers to duplicate its steps, as it has a clear experimental design that is easy to
replicate. However, they are not always practical and sometimes subjected to ethical
disadvantages, such as the risk of unethical experiments where the participants are
harmed by the altered conditions, for instance, harmful drug tests. There are different
44
types of experimental designs such as classical experiments and quasi-experiments. In
management research, classical experiments are rare because randomly assigned
variables are hard to obtain; therefore, quasi-experimental methods are used to
circumvent the problem of random assignment.
Usually, positivists research designs presume that they come out with true answers, and
the researchers start using a hypothesis, then seek to confirm or reject it. The ideal
setting for such design is experimental or quasi-experimental. Experiments can be
undertaken in a controlled setting which enables the researcher to eliminate certain
variables and keep other variables constant. A sample of participants is selected and
then randomly assigned to either an experimental group or to the control group.
Intervention is usually planned for the experimental group, while the control group is
not projected to any change. Random assignment implies that there is no difference
between both groups. Thus, resulting in strengthening the internal validity of the
research setting. Different types of field experiments include repeated measures design,
independent sample design, matched-pairs design, and single subject design. Repeated
measures design is when the experiment is repeated under different conditions, while
the independent-sample design is when two groups are selected, allowing two
impending groups to be compared. Matched-pairs design is a more rigorous approach,
which attempts to eliminate other differences between the two groups by matching pairs
of employees and allocating one to each other. Finally, a single-subject design is when
several subjects are available; however, this makes it difficult to generalise.
Nevertheless, despite this disadvantage, findings produced by single-subject research
could be useful in providing knowledge about the phenomena under study in that
context (Collis & Hussey, 2014).
In a quasi-experimental design, the grouping of the experimental group and the control
group is not undertaken using random selection. Usually, participants are grouped using
pre-formed groups, which could be based on some other criterion. Certain designs could
involve ‘pre-test/post-test comparison design’. Despite quasi-experiments having
clarity, transparency and repeatability, the validity of inference is affected (Saunders et
al., 2012).
Many research papers, use laboratory or behavioural experiments (Carmona et al.,
2011). Despite their advantage of having control, internal validity, measurement
precision and replicability (Awasthi et al., 1998). However, laboratory experiments
45
present non-representative samples and possible instrumentation effects (Carmona et al.,
2011). Awasthi et al., 1998 suggested that laboratory experiments occur in an artificial
environment, and miss the rich environment where all factors present a unique context
and more complicated than laboratory experiments.
3.6.2. Survey Research Design
Surveys are usually associated with a deductive and positivistic research approaches
(Saunders et al., 2012). It is usually used to answer research questions such as ‘what’,
‘who’, ‘how much’, and ‘how many’, thus mainly used for exploratory and descriptive
research questions. In a dataset that is assumed to have a regular pattern of human and
organisational data, but that 's hard to predict due to a large volume of data and
variables, then a survey methodology enables multiple factors to be measured
simultaneously to allow examination of the potential relationships between variables
(Easterby-Smith et al., 2012). Survey is collecting data through asking questions to
respondents trying to capture facts, opinions, attitudes, and even behaviours (Collis, et
al., 2011). Statistical methods are used to analyse the data and generalise the results to a
population. To some significant populations, a random sample is chosen to provide an
unbiased subset of the population, and statistical methods are used to test the likelihood
that the characteristics of the sample also can be found in the larger population (Collis
& Hussey, 2014). Surveys tend to use cross-sectional designs with larger samples to
enable multiple factors to be measured simultaneously and potential relationships to be
examined. There are three types of surveys: factual, inferential, and exploratory.
Factual surveys are associated with and involve collecting and collating relatively
‘factual’ data, such as opinion polls and market research from different groups of people
(Easterby-Smith, 2012, 43). Thus, the researcher seeks the percentage of people that
satisfy the research criteria. Data collection can be conducted by different means, such
as postal questionnaires or structured interviews. However, the validity of structured
interviews could be affected by factors such as social desirability. Inferential surveys
are used in the fields of strategy, marketing or psychology in academic management
research; they are aimed at establishing relationships between variables and concepts,
regardless of prior assumptions or hypotheses. The process begins by isolating the
factors or variables that appear to be involved in a relationship with other concepts, and
identifying dependent variables or predictor variables and measuring subject responses.
Finally, exploratory surveys can be used to study a new phenomenon and patterns in the
46
data. Typically, the process begins by isolating the factors that appear to be involved
and then determining their causation. Hence, the researcher should be able to identify
the dependent and predictor variables. Exploratory surveys use factor analysis and
cluster analysis techniques to investigate possible patterns and relationships between
data variables and constructs, such as the surveys designed by Hofstede to investigate
national culture dimensions (Easterby-Smith et al., 2012).
Survey research activities define the purpose and scope of the survey, depending on the
research objectives and questions, and whether the research is descriptive or analytical,
cross-sectional or longitudinal. The survey instrument should be constructed with the all
the key constructs operationalised. The sampling strategy involves defining the
population and deciding on the sampling frame. The survey administration and data
collection strategy follows, which includes printing and distributing the survey, gaining
access to the respondents, persuading them to respond, and tracking response rates. The
collected quantitative data are usually analysed quantitatively using descriptive and
inferential statistics. The collected data could suggest possible relationships between
different variables.
Surveys have been used in several cultural related types of research such as (Van der
Stede, 2003; O’Connor, 1995; de Waal, 2006; Schneider & de Meyer, 1991). Survey
questionnaires are subjected to several disadvantages, such as the subjects being
selected at random, casting doubt on generalising the results. Respondents to the
questionnaire use their perceptions to measure the variables which are not objective.
3.6.3. Archival Research
Sometimes, archival research is about the use of records and documents as a prime
source of data (Saunders et al., 2012). The researcher may base his research project on
data which was gathered without any direct interaction with organisations or people as
research could be undertaken by analysing documents, which could be company
publications, records or other resources. The data usually are historical, textual
information and its analysis, and some of these organisations which provided this
information may even have ceased to exist. So, research which uses only secondary
data, which is mainly sourced from documents is called archival research (Collis et al.,
2011). This type of the investigation is detached and mainly subjective. In business and
management research, previous annual reports provide rich data together with outline
plans and priorities for future years (Easterby-Smith et al., 2012). Additionally, the
47
collected information is constrained by the limited information found in the documents,
which could fail to include the complete scope of the research objectives. Other
constraints include accessibility, data censorship, or confidentiality issues (Saunders et
al., 2012). Awasthi, et al., 1998 suggested using archival methods with other methods
while studying the impact of culture to enable researchers more understanding as
different may interact in complex ways. Thus external validity is increased.
3.6.4. Mixed Methods
Mixed methods research is informed by both positivist and constructionist
epistemologies, and combines qualitative and quantitative methods in the same study.
Those in favour of using mixed methods speak of its ability to increase the validity and
generalisability of results, and the potential theoretical contribution, while sceptics point
to practical limitations, such as researcher competence and possible contradicting
paradigms (Easterby-Smith et al., 2012).
The combination of qualitative and quantitative methods in mixed methods research is
discussed regarding sequencing and dominance. Sequencing refers to which method is
pursued first, while the dominance, refers to which methods would be more significant
regarding resources, and time (Easterby-Smith et al., 2012). Mixed methods had been
advocated by Awasthi et al., (1998) to improve the external validity of the findings.
3.6.5. Ethnography
Ethnography means “nation writing” (Baker & Foy, 2003, p. 146). It entails
observation, yet it is not a mere outside observation; rather, the researcher becomes
immersed in the setting and becomes part of the group under study, to understand the
meaning and significance that individuals assign to their behaviour and that of others.
The main purpose of ethnographic research in business is to obtain a deep
understanding of people and their behaviour. The difference between simple
observation and ethnography is the researcher’s involvement with the group they are
observing. Simple observation, on the other hand, is detached and ‘objective’.
Ethnography is more of an open-ended as ethnographers could start not with a research
question in mind. Ethnographers are usually subjective, and findings are shaped by their
perceptions (Collis et al., 2011).
Some issues influence the role of the researcher in ethnographic research: is the research
overt or covert? How much access is awarded? What kind of role is played by the
48
researcher? What method of data collection and recording was used? Moreover, how
was the collected data analysed? (Baker & Foy, 2003). A distinction must also be made
between emic and etic perspectives. “’Emic’ initially referred to the sounds within a
language that can only be distinguished by speakers of that language, and ‘etic’ refers to
features of a language that are easily identified by outsiders, but are largely inaudible to
people who speak that language”. However, later on emic and etic referred to insider/
outsider perspectives. (Easterby-Smith et al., 2012, p. 51).
The main difference between ethnographic research and case study research is the
length of time the researcher is required to spend in the field, and the extent to which
they have an obligation to be immersed in the activities of the organisation(s) under
study. The advantage of ethnography is the depth of knowledge acquired by the
researcher, by the time spent in the organisation. However, ethnography takes longer
than any other research method, not only for data collection but also to analyse the data
that are collected.
3.6.6. Action Research
Action research aims to solve current practical problems while expanding scientific
knowledge (Myers, 2013). Action research is an ‘iterative process of inquiry that is
designed to develop solutions to real organisation problems through participative and
collaborative approach’ (Saunders et al., 2012, p. 183). Action research has the
distinctive characteristics of combined intervention and research activities by the
researcher. Unlike consultancy, the action researcher can change the methodology, or
add to it and publish the findings. The action research process starts with a diagnostic
stage involving collaborative analysis of the current situation, followed by the
therapeutic stage, where changes are introduced, and the effects studied (Myers, 2013).
The main advantage of action research is that it helps in making management research
relevant to practice. Additionally, action research provides an excellent opportunity for
the researcher to gain insights that could be difficult to obtain by other research
methods, and the chance to observe the process of change closely (Li & Tang, 2009).
3.6.7. Grounded Theory
Grounded theory can be used to refer to a methodological approach, a method of inquiry
and the result of a research process (Saunders et al., 2012). In its purest application,
grounded theory presents an attempt at completely unstructured observations, whereby
49
the researcher starts with no preconceived, planned idea about the aim of the study, but
simply gathers data as it emerges. After laborious systematic analysis, a theory could
come out of the data obtained (Baker & Foy, 2003). Grounded theory in management
research is useful in capturing the complexities of the context in which action unfolds,
enabling researchers to understand deeper substantive issues better. Additionally,
ethnography, participant observation and discourse analysis are methods that are
commonly used alongside grounded theory. Discourse analysis focuses on language,
conversation, speech, acts and emotions. Narrative analysis refers to stories, which are
often used as explanations; they may reveal more regarding the storytelling than the
apparent subject. Therefore, they might contain structures of thought and have
implications for roles, actions and expectations. In short, grounded theory is a
qualitative research method that seeks to develop a theory that is grounded in data that
has been systematically gathered and analysed (Myers, 2013).
Grounded theory was formulated by Glaser & Strauss, (1968) who suggest that the task
of research is to develop a theory through a ‘comparative method’, which involves
comparing incidents or situations in different contexts and, subsequently, developing a
theory. Glaser & Strauss, (1968) differ from each other in some respects, such as the
researcher’s presuppositions, and the role of theory. These differences could be related
to the philosophical positions of the two authors, as Glaser’s ontology is that of a realist,
whereas Strauss is more inclined towards a nominalist ontology (Easterby-Smith et al.,
2012). The difference between the two authors extends to epistemology, also, as Strauss
supports weak positivist assumptions, while Glaser is more inclined toward
constructionism. This philosophical distinction influences the analysis of qualitative
data. If constructionist assumptions are upheld, then an inductive, intuitive
interpretation of data could follow. By contrast, a deductive interpretation is sought by
converting qualitative data into quantitative data using content analysis (Baker & Foy,
2003). The use of ground theory in national culture research is rare, due to the costs and
the degree of access involved. However, they provide richer contexts and deeper
insights than other research methods (Efferin & Hopper, 2007).
3.6.8. Narrative Inquiry
A Narrative is ‘a story or a personal account which interprets an event or a sequence of
events’ (Saunders et al., 2012, p. 183). Narrative inquiry is a constructionist, qualitative
research design. Stories from a dominant element of organisational reality and these
50
stories cannot be overlooked in comprehensive studies. Information that is acquired via
stories cannot typically be retrieved using other, more conventional methods.
Participant observation could be involved in communicating and constructing stories, or
stories could be collected via interviews, by requesting individuals to repeat stories that
they heard, or narrate an event. In the narrative enquiry, the position of the narrator and
the role of the analyst are critical. Despite their similarity to other qualitative collected
data, narratives are classified by their all-inclusive perspectives on organisational
behaviour; thus, they are useful in developing social histories of identities. Narrative
research could be detached or involved, depending on the researcher’s role in
encouraging participants to tell new stories that illustrate their feelings (Easterby-Smith
et al., 2012). Narrative inquiry may be used in different ways, it may be used with a
slight number of participants, or it could be employed with larger samples, where
narrative interviews are conducted with or even observations made by participant
observations across an organisation (Saunders et al., 2012).
3.7. Case Study Research
A case study is an “empirical inquiry that investigates a contemporary phenomenon (the
“case”) in depth and within its real-world context, especially when the boundaries
between phenomenon and context may not be clearly evident” (Yin, 2014, p. 16). The
stated definition stresses the presence of a firm or an organisation and distinguishes case
study research from ethnographic research, which does not typically involve participant
observation of fieldwork, whereas a case study looks in depth at one, or a small number
of organisations, events or individuals more generally, over time. Case study research
in business uses empirical evidence from one or more organisations, where an attempt is
made to examine the subject matter in context. Multiple sources of evidence are used,
although most of the evidence is derived from interviews and documents (Myers, 2013).
Case studies provide rich data regarding how groups and individuals behave. Unlike
action research method, the researcher in the case study has no control over the context
setup. Case studies are usually the preferred method for answering how and why
research questions, when the researcher is not involved in the running of affairs and
when the phenomena under investigation are immersed in a real-life context.
The main advantage of a case study is its ‘face validity’, where a well-written case
explains a topic that is well known by many researchers, which gives it credibility.
However, most case studies do not have the rigour of national scientific design; their
51
findings are rarely generalizable, and enormous and diverse volumes of data produced
allow different researchers to arrive at different interpretations. These accusations are
partly correct; therefore, care should be taken, ensuring there is a clear design before
data is collected. Typically, data are collected through direct observation, personal
contact and interviews. The data collection period could extend over a significant
period, it could be achieved through live observation, and even retrospective accounts of
past events could be recorded. Additionally, the unit of analysis could be either
individual or specific events within the organisation. Additionally, gaining access to
organisations can be difficult, which sometimes prevents researchers from studying
interesting organisations.
The philosophical underpinnings of case studies are not always constructionist; they
could rely on positivist assumptions or fall somewhere between the two stances. Case
studies develop theory inductively through description and analysis of new and
emerging phenomena. They differ from grounded theory in that one does not start from
the position of ignorance regarding the research question of the research. The
researchers bring prior knowledge and understanding of the observations, and so
combine induction and deduction in selecting and interpreting data.
The main stages in a case study include selecting the case, preliminary investigations,
data collection, data analysis and, finally, writing the report. First, selecting the cases
does not follow the same criteria as surveys. However, when investigating a set of
circumstances, the choice of cases should adequately reflect the research question.
Second, in initial investigations the researcher should be familiar with the context that
they are investigating. Collis & Hussey, (2014) have indicated a fear of creating implicit
opinions, which might influence the results of the investigation. Therefore, reflecting on
philosophical assumptions could guide best practice. Third, in the data collection stage,
the researcher should determine how, where and when to collect data. Some of the
possible methods include documentary analysis, interviews, questionnaires, and
observation. Evidence could be qualitative, quantitative or both.
There are different types of case studies: explanatory/cause, descriptive, exploratory and
theory building (Voss et al., 2002). In explanatory case studies, the aim is to investigate
the causality between variables, where the researcher tries to determine whether event x
led to event y. The descriptive case study is used in histories and surveys to outline a
sequence over time or portray context and so on. The exploratory case study is used to
develop a hypothesis and make propositions for further investigation.
52
3.7.1. Designing Case Study
The main purpose of design is to ensure that the designed case study addresses the
intended research objective. Usually components of research design are the case study
research objectives and unit of analysis. Research design refers to the general approach
to answering the research question. It should contain the direction of data collection,
which should fit with the philosophical and practical realities. There are significant
overlaps in management research methods, therefore the most appropriate research
method, or a mix of methods, should be chosen and justified (Easterby-Smith et al.,
2012). The choice of the investigation method should be advantageous and relate to the
research problem, regarding: The nature of the research problem under study and the
kind of output required, which affects the choice of philosophical paradigm. The
amount of time the researcher has dedicated to the research process. The investigator’s
involvement affects the sample size and type of research approach employed. Figure 3.3
and Table 3.2 summarises some of the choices; researchers must make depending on the
nature of the problem and their preferences.
When research is planned, it should include decisions on whether data is being collected
to test or to build a theory. A theory is an explanation of observed regularities. Some
research projects are based on expanding the middle range or grand theories, while
others are based on an “interrogation of the literature”, that is, by the illumination of a
research issue or problem, where the theory is usually “latent” in the literature (Bryman
& Bell, 2011). Resulting in a further argument, regarding whether the theory emanates
from existing theories. Alternatively, does theory arise from the process of data
collection and the analysis of data associated with a research project? It is important
also to note that the researcher is sometimes required to make certain trade-offs between
the best research design, their degree of involvement and the resources at their disposal.
One of the important considerations regarding research design is the determination of
the unit of analysis, which could be individuals, dyads, groups, organisations, or
industries. For example, research could explore individual measures of job satisfaction.
For dyads, the research would be about exploring two personal interactions, such as
supervisor-subordinate relationships. In groups, the unit of analysis is at the group level,
such as group effectiveness or cohesiveness. The unit of analysis about organisations
concerns an investigation about a company or institution. Finally, industries could also
53
serve as a unit of analysis if the research is a whole industry, not just a single
organisation (Tharenou et al., 2007).
In designing case studies, the researcher should identify the most suitable research
design. There are broadly two types of case study design: single and multiple case
studies. The single case study is, “an appropriate design under several circumstances,
and five single case rationale – that is, having a critical, unusual, common, revelatory,
or a longitudinal case (Yin, 2014, p. 51). In multiple case studies, several cases are
examined to understand the similarities and differences between cases. The evidence
from multiple cases usually adds to the validity.
In longitudinal case study designs, data are collected with an intervening time, typically
before and after the application of a cause of an influence, to report on the influence
(Saunders et al., 2012). On the other hand, in a cross-sectional design, data is collected
at one time. When the aim of the research is to understand the process of change over
time, then it is necessary to adopt a longitudinal design (Saunders et al., 2012).
Additionally, the decision regarding the timing depends on the nature of the research
and its boundaries. Cross-sectional designs have an advantage in the sense that they can
describe attributes of significant data about people or organisations, although they are
limited by their inability to describe processes over a period or explain the mechanisms
or processes underlying change in attributes.
3.7.2. Conducting the Case Study
About the analysis above, a case study was selected to achieve the research objective.
The main steps involved in case study research are data collection, data reduction, data
display, and data analysis. Usually, a case study protocol is prepared, and it is more than
a prepared question list, it contains the procedures and rules that should be followed
during the interview. It helps in increasing the reliability of case study research and is
planned to allow to communicate to another researcher steps taken to ensure uniform
data collection if the interviews are to be repeated by other researchers (Yin, 2014). In
the following subsections, more detailed explanations of these steps would be provided.
3.8. Collecting Data for Case Study Research
Different data collection techniques were applied, to a significant part to ensure
information validity. Documentation, archival records, interviews, direct observations,
participant observation and physical artefacts (Yin, 2014) were used.
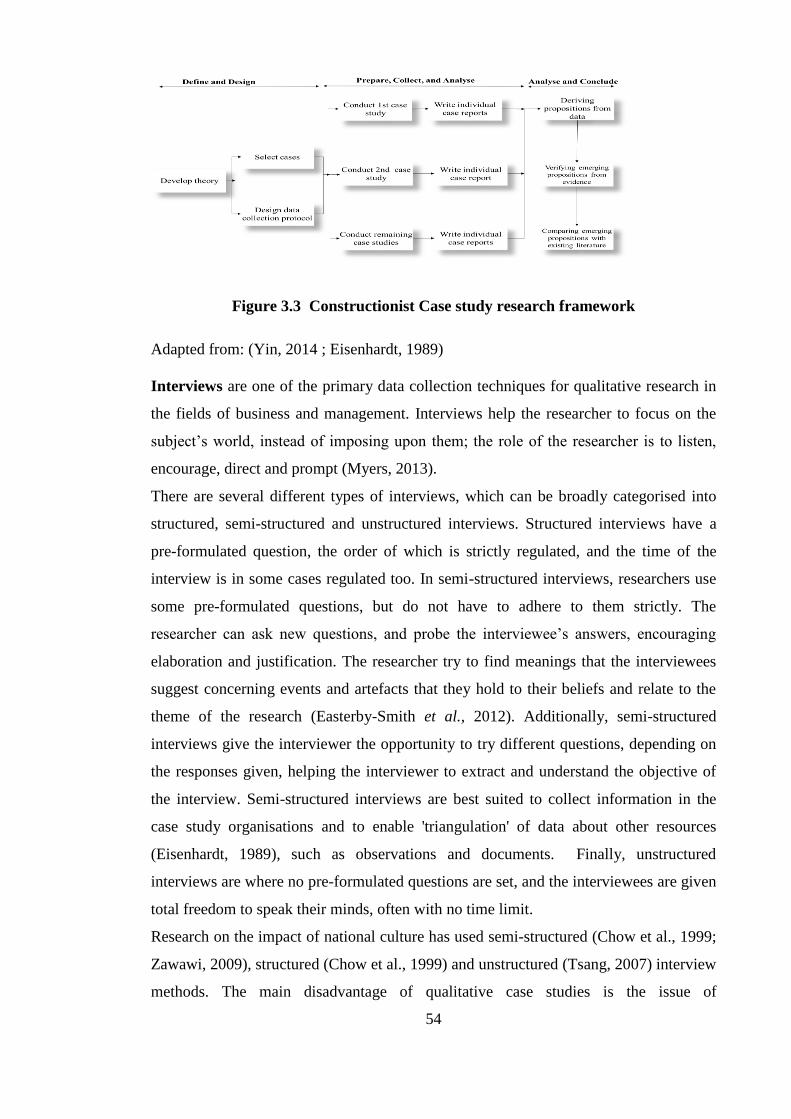
54
Figure 3.3 Constructionist Case study research framework
Adapted from: (Yin, 2014 ; Eisenhardt, 1989)
Interviews are one of the primary data collection techniques for qualitative research in
the fields of business and management. Interviews help the researcher to focus on the
subject’s world, instead of imposing upon them; the role of the researcher is to listen,
encourage, direct and prompt (Myers, 2013).
There are several different types of interviews, which can be broadly categorised into
structured, semi-structured and unstructured interviews. Structured interviews have a
pre-formulated question, the order of which is strictly regulated, and the time of the
interview is in some cases regulated too. In semi-structured interviews, researchers use
some pre-formulated questions, but do not have to adhere to them strictly. The
researcher can ask new questions, and probe the interviewee’s answers, encouraging
elaboration and justification. The researcher try to find meanings that the interviewees
suggest concerning events and artefacts that they hold to their beliefs and relate to the
theme of the research (Easterby-Smith et al., 2012). Additionally, semi-structured
interviews give the interviewer the opportunity to try different questions, depending on
the responses given, helping the interviewer to extract and understand the objective of
the interview. Semi-structured interviews are best suited to collect information in the
case study organisations and to enable 'triangulation' of data about other resources
(Eisenhardt, 1989), such as observations and documents. Finally, unstructured
interviews are where no pre-formulated questions are set, and the interviewees are given
total freedom to speak their minds, often with no time limit.
Research on the impact of national culture has used semi-structured (Chow et al., 1999;
Zawawi, 2009), structured (Chow et al., 1999) and unstructured (Tsang, 2007) interview
methods. The main disadvantage of qualitative case studies is the issue of
55
generalizability of the research findings. To have an in-depth research means small
sample size, which reduces the external validity (Merchant et. al., 1995)
Participant observation, data is collected through the observation of people in situ;
finding them where they are, staying with them in some role which. If it is acceptable to
them, will allow both close observations of particular parts of their behaviour and in
reporting it in ways useful to social science but not harmful to those observed (Myers,
2013). The researcher should be careful not to be led into areas not related to the main
research topic; it is also important to maintain records of the events being observed, as
careful planning of the observation and record keeping is a key aspect of direct
observations (Yin, 2014).
Triangulation as a way of providing enhanced research validity and reliability by
deploying more than one research method and tool so that the study findings are not
biased, to increase the validity and richness of the data collected and the researchers’
confidence in the results (Yin, 2014). Finally, care must be taken not to jump to
conclusions without the support of sufficient data, or be unfairly influenced by better-
written cases before considering all possibilities. Findings from one form of data should
be corroborated by findings from other types of evidence.
3.9. Data Analysis of Case Study Research
3.9.1. Data reduction
It is important to reduce the collected raw data to make it manageable to analyse.
Additionally, the data should be transformed, so that it can be understood by the target
audience. There are different ways of analysing qualitative data, such as through
hermeneutics and coding. When data are collected, it is organised and reduced. The data
reduction process involves selecting, simplifying and transforming the data to make it
manageable, and controllable. The use of coding is advisable (Miles & Huberman,
1994; Glaser & Strauss, 1968), as the data is at this moment reduced into categories.
One of the disadvantages of qualitative research is the accumulation of large amounts of
data. Therefore, it is paramount that the researcher reduces the data in a structured and
coherent way so that it can be more easily understood and interpreted. Two methods are
typically used: documentation and coding, and these would be explained in the
upcoming sub-sections.
56
Several formats can be used to document qualitative data, such as document summary
forms, contact summary sheets, sitting in on analysis meetings, and interim site
summaries. The researcher should ensure that these forms have coherent formats, and
any missing elements should be clear to the researcher to assist completion (Miles &
Huberman, 1994). Analysing qualitative data are at the heart of most qualitative
research, but analysing evidence in a multiple case study design is different if the design
is more qualitative rather than quantitative. First, the data is unstructured and requires
different techniques, such as pattern matching, explanation building, time-series
analysis, logic models, and cross-case synthesis (Yin, 2104).
Coding refers to associating specific codes or numbers to particular words or phrases.
Allowing the researcher to reduce data into categories (Miles & Huberman, 1994).
When coding, incidents of phenomena in the data are arranged according to categories
and each incident is compared with previous incidents in the same category, enabling
the researcher to identify patterns of data, which can inform theoretical developments
(Miles & Huberman, 1994).
There are three methods for creating codes; the first is when a provisional list of codes
is created before fieldwork being conducted. Predictably, these codes are derived from
the conceptual framework of the study, the research questions, research problem, and
other variables that are vital to the research. The advantage of this method is that it
forces the researcher to link the key components of the study with the data. The second
method involves taking a ‘grounded’ approach, where the researcher does not create
codes until the data has been collected so that a more open-minded and context-
sensitive approach can be adopted during data analysis (Miles & Huberman, 1994). The
third method involves a mixture of the previous methods, where the researcher defines
general areas of interest, to which codes can be assigned inductively later on. Axial
coding involves putting the data together in new ways, where the objective is to
rearrange categories in a rational manner. Finally, selective coding involves selecting a
core category and relating it to other categories.
3.9.2. Data Display
Data display goes a step beyond data reduction, by organising information in such a
way to facilitate the analysis process and reach a conclusion. The display could take
many forms, but it would be “a visual format that presents information systematically,
so the user can draw valid conclusions and take needed actions” (Miles & Huberman,
57
1994). The action of viewing a full data set condensed from the field notes in one place
and arranged in a systematic manner helps the researcher to find the answer to the
research question. Different forms of listing include event listings, critical incidents
chart and matrices (Miles & Huberman, 1994).
The diary is a method which is about maintaining a narrative and timeline of the
research process, such as observations, personal reflections, new ideas, events, and so
on. It is relevant especially when undertaking action research. Documentation involves
creating a detailed report of a site visit. After collecting data on site visits, the first step
is to build a comprehensive report. The format of this report can be the same as the
structure of the research protocol so that data is organised in a coherent and structured
format. The advantage of using one common format is that it is helpful in a comparison
across different cases. It is vital that this task be carried out as soon as possible after the
site visit(s), to maximise recall and to fill any gaps in the data (Voss et al., 2002).
Documentation can take various forms, such as memoranda, minutes of meetings,
proposals, annual report emails, web pages and newspapers. The use of documentation
includes corroborating information from other sources, making inferences that lead to
further investigation, and verifying small details (Yin, 2014). The researcher has
referred to companies’ web pages to provide a richer picture of cases before and after
the visits; this clarifies organisations’ activities and vital for good visit preparation.
Documents such as emails, web pages, newspapers and corporate documents can
provide a richer picture than what could be obtained by fieldwork or interviews alone
(Myers, 2013).
3.9.3. Data Analysis
Data analysis is a vital aspect of most research works and by far the most difficult stage
of the research process (Eisenhardt, 1989). The objective of qualitative data analysis is
to identify, examine, compare, and interpret patterns and themes. It is an iterative
process. Analysing qualitative data are at the heart of most qualitative research.
Analysing evidence in multiple case study design is different in qualitative and
quantitative research designs. First, the data is unstructured and requires different
techniques, such as pattern matching, explanation building, time-series analysis, logic
models, and cross-case synthesis (Yin, 2104). Qualitative data analysis involves “data
collection, data display, data reduction and drawing and verifying conclusions,” and
these steps take place concurrently (Miles & Huberman, 1994).
58
Drawing and verifying conclusions, the initial step in the qualitative analysis, requires
the careful reading of the interview reports, or the transcripts of interviews if applicable,
documents collected, and observation notes. Two types of analysis are usually
undertaken here: within-case and cross-case.
The objective of the within-case analysis is to gain an understanding of a case and to
identify unique patterns that emerge before generalising patterns across cases
(Eisenhardt, 1989). The researcher should look for explanations and causalities within
the case (Miles & Huberman, 1994). Four methods can be used to understand and look
for emerging patterns: an explanatory effect matrix, dynamic case matrices, causal
networks, and making and testing predictions. An explanatory effect matrix presents a
set of forces for change and traces the critical processes and outcomes. A causal
network displays the most relevant independent and dependent variables in a field study,
and the relationships among these variables. The last method is making predictions and
using data from the case studies, and testing these predictions Miles and Huberman
(1994).
The cross - case analysis looks to identify patterns among several cases. Miles and
Huberman (1994) suggest several approaches facilitate cross-cases analysis; the first is
to order displays. Further displaying the data, by the concept, by the case or by time,
could help in comparing and analysing the findings. Non-parametric statistics can also
be used to test and explore patterns, even with relatively small sample sizes. The cross-
case analysis would help researchers improve internal validity. Propositions are
developed from the cross-case results, which is then followed by process of testing the
hypotheses (Eisenhardt, 1989).
Different methods can be used to increase the internal validity of a study and the
potential to generalise its findings. Among the common methods of cross-case analysis
is the construction of a chart containing an array of case study data, and then selecting a
category or dimension and looking for similarities and differences within the category.
Another method is to select pairs of cases and look for similarities and differences
between cases.
59
3.10. Criteria for Judging the Quality of Research Design
The objective of any good research is to find the right answers to the research questions.
Ensuring that the proper research process has been carried out requires constructing
research quality criteria (Easterby-Smith et al., 2012; Yin, 2014; Eisenhardt, 1989).
Researchers using positivist designs are primarily concerned with maximising internal
validity (systematic errors) and external validity (generalisability). Maximising internal
validity is achieved by eliminating all plausible alternative explanations for any
differences observed between groups. Achieving through random assignment to control
and experimental groups, and ensuring that experiments were undertaken are identical
in all steps. Among threats to internal validity include variability in history, maturation,
or mortality. External validity refers to the generalizability of the results beyond their
immediate application. Access and sampling, and ensuring similar contextual factors,
such as size and history, are necessary to ensure improved generalisation. Reliability in
constructionist research is about ensuring that when another researcher is having similar
observations when repeating the research process. In positivist, research reliability is
about ensuring that measures yield the same results when research is repeated in other
instances (Easterby-Smith et al., 2012, p. 71).
The quality criteria are used to guide the research methodology choices and to ensure a
reliable, consistent and systematic process. The criteria include factors that help to
identify as data/research evidence, identify which research findings could be
contributing to knowledge and practice. Additionally, it includes notes about internal
and external validity, construct validity and reliability (Table 3.3).
3.10.1. Maintaining Validity of the Research
Irrespective of the qualitative method employed, four key issues should be addressed by
the researcher (Table 3.4). What the researcher is specifically investigating; how and in
what form the observations and interviews are to be recorded; how to maintain accuracy
and consistency in recording the interviews; and, finally, how the relationship between
the researcher and interviewer would be established and controlled (Baker & Foy,
2003).
To ensure the logical coherence of the research, four tests are commonly used to
establish the quality of any empirical social research. If the chosen research method is a
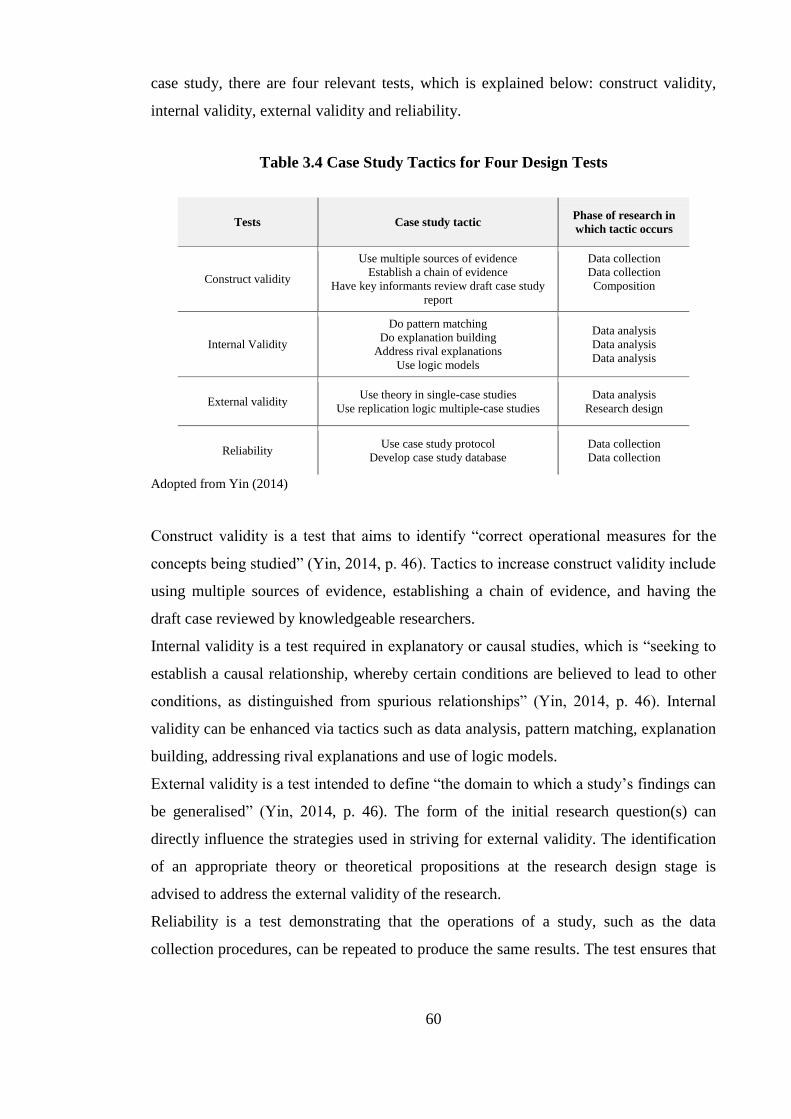
60
case study, there are four relevant tests, which is explained below: construct validity,
internal validity, external validity and reliability.
Table 3.4 Case Study Tactics for Four Design Tests
Tests Case study tactic Phase of research in
which tactic occurs
Construct validity
Use multiple sources of evidence
Establish a chain of evidence
Have key informants review draft case study
report
Data collection
Data collection
Composition
Internal Validity
Do pattern matching
Do explanation building
Address rival explanations
Use logic models
Data analysis
Data analysis
Data analysis
External validity Use theory in single-case studies
Use replication logic multiple-case studies
Data analysis
Research design
Reliability Use case study protocol
Develop case study database
Data collection
Data collection
Adopted from Yin (2014)
Construct validity is a test that aims to identify “correct operational measures for the
concepts being studied” (Yin, 2014, p. 46). Tactics to increase construct validity include
using multiple sources of evidence, establishing a chain of evidence, and having the
draft case reviewed by knowledgeable researchers.
Internal validity is a test required in explanatory or causal studies, which is “seeking to
establish a causal relationship, whereby certain conditions are believed to lead to other
conditions, as distinguished from spurious relationships” (Yin, 2014, p. 46). Internal
validity can be enhanced via tactics such as data analysis, pattern matching, explanation
building, addressing rival explanations and use of logic models.
External validity is a test intended to define “the domain to which a study’s findings can
be generalised” (Yin, 2014, p. 46). The form of the initial research question(s) can
directly influence the strategies used in striving for external validity. The identification
of an appropriate theory or theoretical propositions at the research design stage is
advised to address the external validity of the research.
Reliability is a test demonstrating that the operations of a study, such as the data
collection procedures, can be repeated to produce the same results. The test ensures that
61
error and bias are minimised. This can be achieved by documenting the procedure that
is followed, and case study protocol can help in the documentation process.
3.11. Summary of Chapter 3
The objective of this chapter was to explain different philosophies, epistemologies,
research methods. Furthermore, the chapter explained what warrants the choice of a
research method and technique, and the epistemological implications of these options.
Additionally, the chapter presented criteria to assess the quality of the resultant research.
The next chapter uses the information provided in this chapter to justify the
methodological choices made by the researcher.
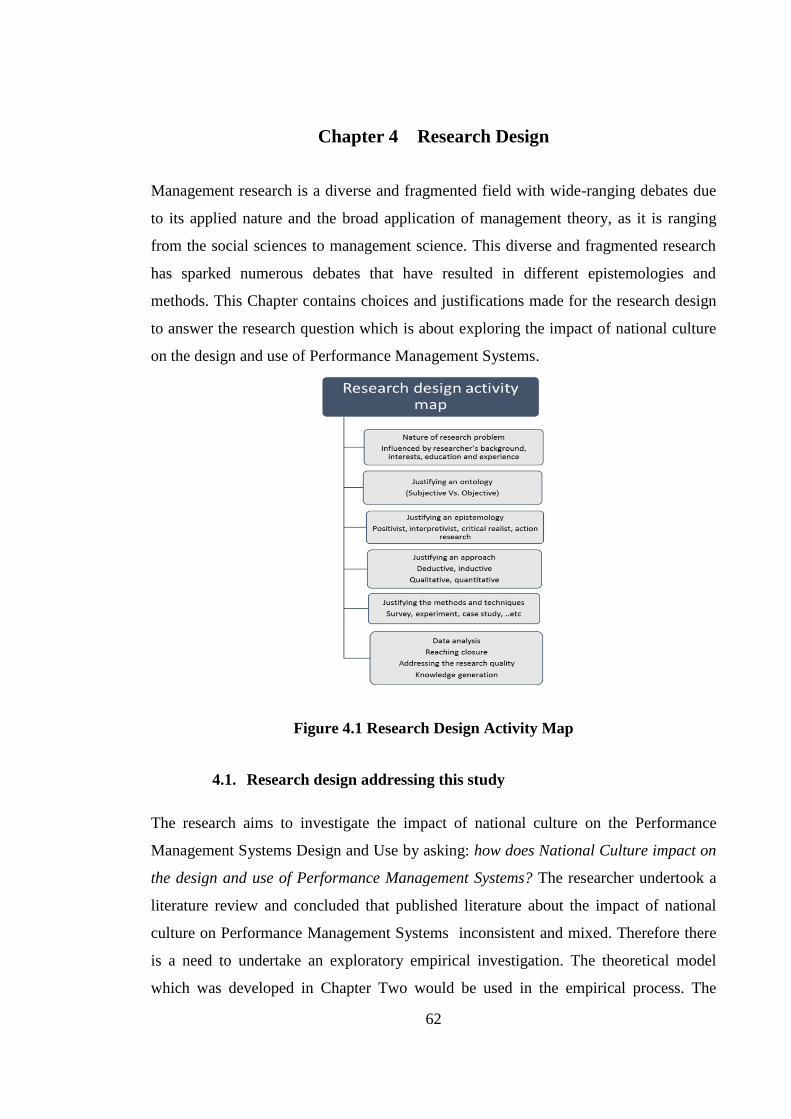
62
Chapter 4 Research Design
Management research is a diverse and fragmented field with wide-ranging debates due
to its applied nature and the broad application of management theory, as it is ranging
from the social sciences to management science. This diverse and fragmented research
has sparked numerous debates that have resulted in different epistemologies and
methods. This Chapter contains choices and justifications made for the research design
to answer the research question which is about exploring the impact of national culture
on the design and use of Performance Management Systems.
Figure 4.1 Research Design Activity Map
4.1. Research design addressing this study
The research aims to investigate the impact of national culture on the Performance
Management Systems Design and Use by asking: how does National Culture impact on
the design and use of Performance Management Systems? The researcher undertook a
literature review and concluded that published literature about the impact of national
culture on Performance Management Systems inconsistent and mixed. Therefore there
is a need to undertake an exploratory empirical investigation. The theoretical model
which was developed in Chapter Two would be used in the empirical process. The
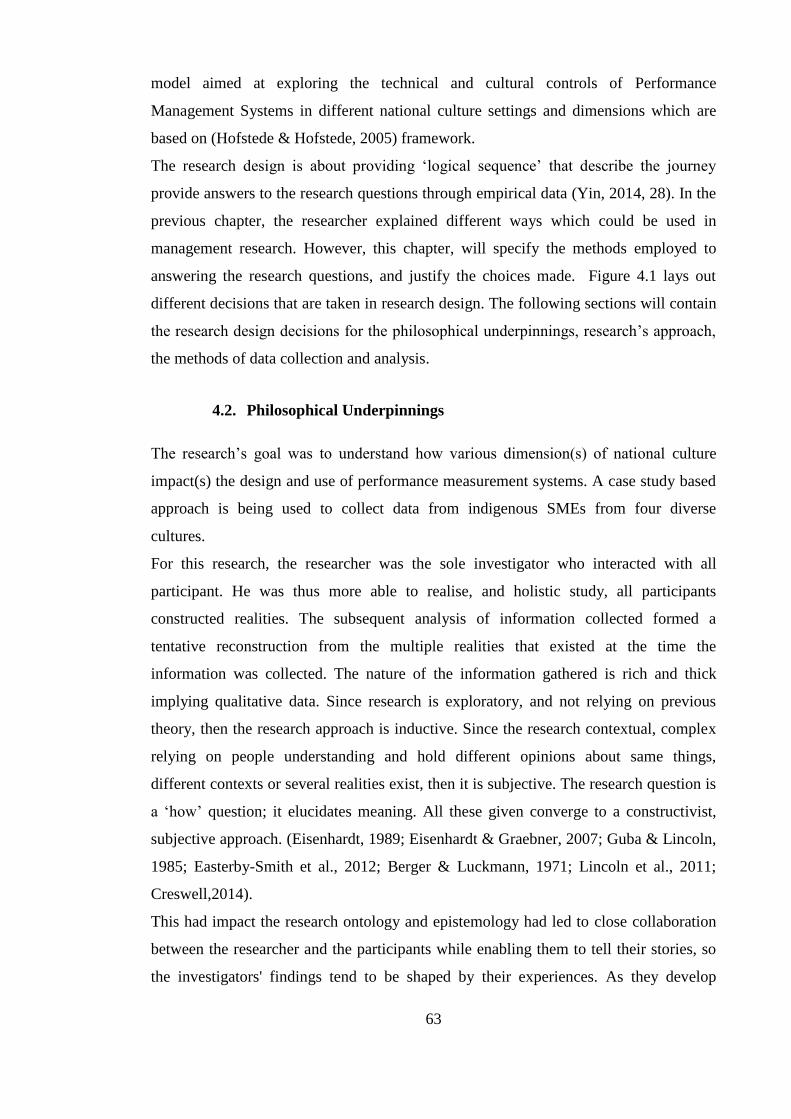
63
model aimed at exploring the technical and cultural controls of Performance
Management Systems in different national culture settings and dimensions which are
based on (Hofstede & Hofstede, 2005) framework.
The research design is about providing ‘logical sequence’ that describe the journey
provide answers to the research questions through empirical data (Yin, 2014, 28). In the
previous chapter, the researcher explained different ways which could be used in
management research. However, this chapter, will specify the methods employed to
answering the research questions, and justify the choices made. Figure 4.1 lays out
different decisions that are taken in research design. The following sections will contain
the research design decisions for the philosophical underpinnings, research’s approach,
the methods of data collection and analysis.
4.2. Philosophical Underpinnings
The research’s goal was to understand how various dimension(s) of national culture
impact(s) the design and use of performance measurement systems. A case study based
approach is being used to collect data from indigenous SMEs from four diverse
cultures.
For this research, the researcher was the sole investigator who interacted with all
participant. He was thus more able to realise, and holistic study, all participants
constructed realities. The subsequent analysis of information collected formed a
tentative reconstruction from the multiple realities that existed at the time the
information was collected. The nature of the information gathered is rich and thick
implying qualitative data. Since research is exploratory, and not relying on previous
theory, then the research approach is inductive. Since the research contextual, complex
relying on people understanding and hold different opinions about same things,
different contexts or several realities exist, then it is subjective. The research question is
a ‘how’ question; it elucidates meaning. All these given converge to a constructivist,
subjective approach. (Eisenhardt, 1989; Eisenhardt & Graebner, 2007; Guba & Lincoln,
1985; Easterby-Smith et al., 2012; Berger & Luckmann, 1971; Lincoln et al., 2011;
Creswell,2014).
This had impact the research ontology and epistemology had led to close collaboration
between the researcher and the participants while enabling them to tell their stories, so
the investigators' findings tend to be shaped by their experiences. As they develop
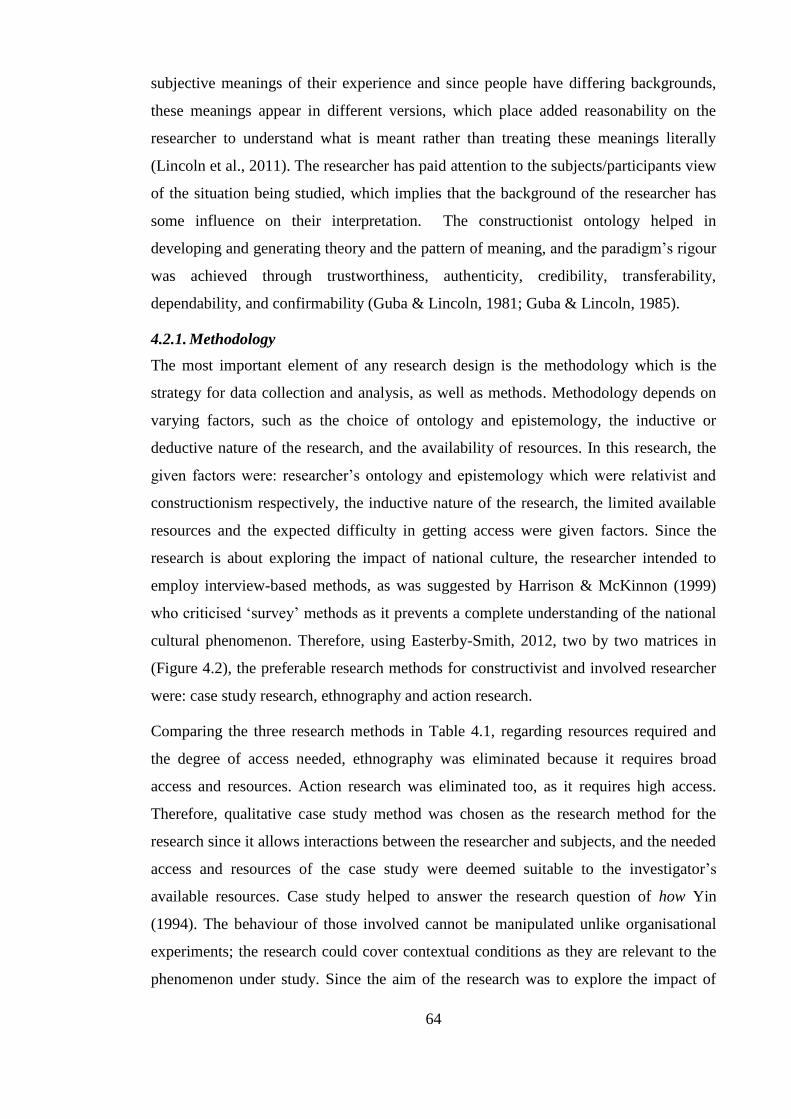
64
subjective meanings of their experience and since people have differing backgrounds,
these meanings appear in different versions, which place added reasonability on the
researcher to understand what is meant rather than treating these meanings literally
(Lincoln et al., 2011). The researcher has paid attention to the subjects/participants view
of the situation being studied, which implies that the background of the researcher has
some influence on their interpretation. The constructionist ontology helped in
developing and generating theory and the pattern of meaning, and the paradigm’s rigour
was achieved through trustworthiness, authenticity, credibility, transferability,
dependability, and confirmability (Guba & Lincoln, 1981; Guba & Lincoln, 1985).
4.2.1. Methodology
The most important element of any research design is the methodology which is the
strategy for data collection and analysis, as well as methods. Methodology depends on
varying factors, such as the choice of ontology and epistemology, the inductive or
deductive nature of the research, and the availability of resources. In this research, the
given factors were: researcher’s ontology and epistemology which were relativist and
constructionism respectively, the inductive nature of the research, the limited available
resources and the expected difficulty in getting access were given factors. Since the
research is about exploring the impact of national culture, the researcher intended to
employ interview-based methods, as was suggested by Harrison & McKinnon (1999)
who criticised ‘survey’ methods as it prevents a complete understanding of the national
cultural phenomenon. Therefore, using Easterby-Smith, 2012, two by two matrices in
(Figure 4.2), the preferable research methods for constructivist and involved researcher
were: case study research, ethnography and action research.
Comparing the three research methods in Table 4.1, regarding resources required and
the degree of access needed, ethnography was eliminated because it requires broad
access and resources. Action research was eliminated too, as it requires high access.
Therefore, qualitative case study method was chosen as the research method for the
research since it allows interactions between the researcher and subjects, and the needed
access and resources of the case study were deemed suitable to the investigator’s
available resources. Case study helped to answer the research question of how Yin
(1994). The behaviour of those involved cannot be manipulated unlike organisational
experiments; the research could cover contextual conditions as they are relevant to the
phenomenon under study. Since the aim of the research was to explore the impact of
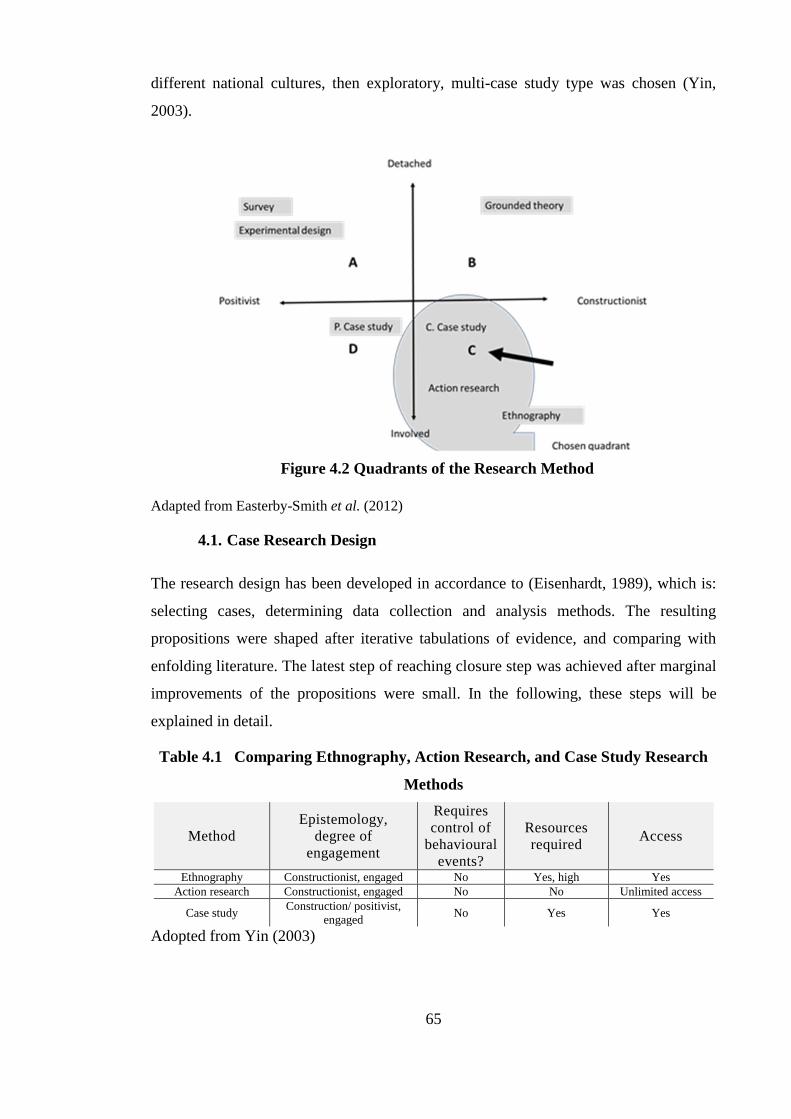
65
different national cultures, then exploratory, multi-case study type was chosen (Yin,
2003).
Adapted from Easterby-Smith et al. (2012)
4.1. Case Research Design
The research design has been developed in accordance to (Eisenhardt, 1989), which is:
selecting cases, determining data collection and analysis methods. The resulting
propositions were shaped after iterative tabulations of evidence, and comparing with
enfolding literature. The latest step of reaching closure step was achieved after marginal
improvements of the propositions were small. In the following, these steps will be
explained in detail.
Table 4.1 Comparing Ethnography, Action Research, and Case Study Research
Methods
Method
Epistemology,
degree of
engagement
Requires
control of
behavioural
events?
Resources
required Access
Ethnography Constructionist, engaged No Yes, high Yes
Action research Constructionist, engaged No No Unlimited access
Case study Construction/ positivist,
engaged No Yes Yes
Adopted from Yin (2003)
Figure 4.2 Quadrants of the Research Method
66
4.1.1. Selecting Cases
To explore the impact of national culture, and using the theoretical framework, a multi-
case research design was chosen (Eisenhardt, 1989; Stake, 2005). The research
questions are: how does National Culture impact on the design and use of Performance
Management System? The research design aims to investigate the Performance
Management Systems by comparing the technical and cultural controls in different
national cultures in accordance with the theoretical model developed in Chapter Two.
Multi-case study design was employed. The process of selection various national
cultures, it was ensured that the compared cases exhibited the least amount of cultural
contamination by various contextual conditions. Therefore, all the cases were selected
to exhibit the same size, same sector, and lead by indigenous members of the national
culture. As large corporations were found to impact the national culture (Merchant &
Van der Stede, 2003). Therefore, small size organisations were all chosen from one
business sector. The selected sector was manufacturing, because of the availability of
access. The unit of analysis is Performance Management Systems in manufacturing
SMEs, who are managed by leaders from the same national culture.
Usually, in qualitative research, small samples are used (Miles et al., 2014), the chosen
number of cases was designed in a way striking a balance between enhancing the
validity and reducing bias, and at the same time ensured obtaining in-depth information
(Voss et al., 2002). The number of investigated national culture was chosen to be four
national cultures, and from each national culture, two cases were examined. Making the
total number of eight cases. Thus, the unit of analysis of the research is Performance
Management Systems in small manufacturing organisations.
Sampling was theoretical (Glaser & Strauss, 1968), by choosing national culture with
polar characteristics based on the Power Distance and Uncertainty Avoidance scores, as
suggested Hofstede & Hofstede, (2005), who thought that organisation's behaviour
differ depending on their PD and UA scores. Thus, the chosen cases were selected with
opposing PD and UA scores: UK, China, Italy and Qatar (Table 4.2). Ideally, Germany
would have been a better choice than Italy because of its low PD, and high UA, but due
to access issues, Italy was chosen, despite having moderate PD. It should be noted that
Qatar’s score was based on their similarity to the Arab sub-region (Hofstede &
Hofstede, 2005; House et al. 1994)
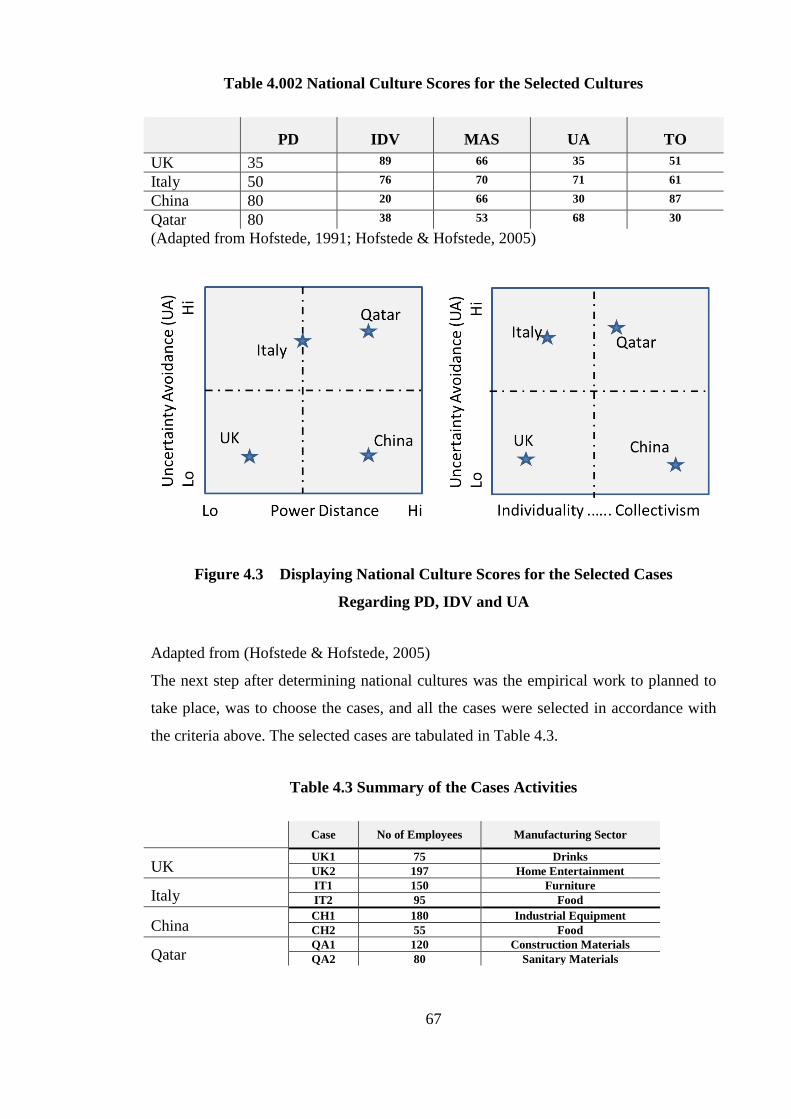
67
Table 4.002 National Culture Scores for the Selected Cultures
PD IDV MAS UA TO
UK 35 89 66 35 51
Italy 50 76 70 71 61
China 80 20 66 30 87
Qatar 80 38 53 68 30
(Adapted from Hofstede, 1991; Hofstede & Hofstede, 2005)
Figure 4.3 Displaying National Culture Scores for the Selected Cases
Regarding PD, IDV and UA
Adapted from (Hofstede & Hofstede, 2005)
The next step after determining national cultures was the empirical work to planned to
take place, was to choose the cases, and all the cases were selected in accordance with
the criteria above. The selected cases are tabulated in Table 4.3.
Table 4.3 Summary of the Cases Activities
Case No of Employees Manufacturing Sector
UK UK1 75 Drinks
UK2 197 Home Entertainment
Italy IT1 150 Furniture
IT2 95 Food
China CH1 180 Industrial Equipment
CH2 55 Food
Qatar QA1 120 Construction Materials
QA2 80 Sanitary Materials
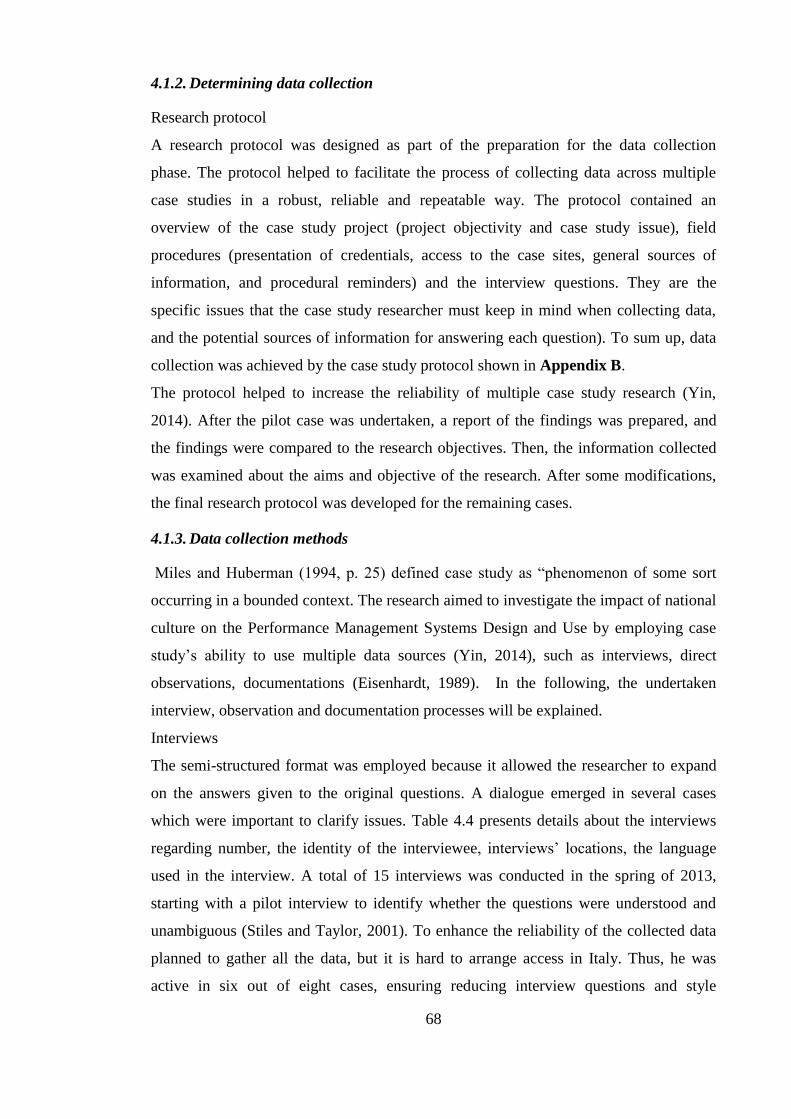
68
4.1.2. Determining data collection
Research protocol
A research protocol was designed as part of the preparation for the data collection
phase. The protocol helped to facilitate the process of collecting data across multiple
case studies in a robust, reliable and repeatable way. The protocol contained an
overview of the case study project (project objectivity and case study issue), field
procedures (presentation of credentials, access to the case sites, general sources of
information, and procedural reminders) and the interview questions. They are the
specific issues that the case study researcher must keep in mind when collecting data,
and the potential sources of information for answering each question). To sum up, data
collection was achieved by the case study protocol shown in Appendix B.
The protocol helped to increase the reliability of multiple case study research (Yin,
2014). After the pilot case was undertaken, a report of the findings was prepared, and
the findings were compared to the research objectives. Then, the information collected
was examined about the aims and objective of the research. After some modifications,
the final research protocol was developed for the remaining cases.
4.1.3. Data collection methods
Miles and Huberman (1994, p. 25) defined case study as “phenomenon of some sort
occurring in a bounded context. The research aimed to investigate the impact of national
culture on the Performance Management Systems Design and Use by employing case
study’s ability to use multiple data sources (Yin, 2014), such as interviews, direct
observations, documentations (Eisenhardt, 1989). In the following, the undertaken
interview, observation and documentation processes will be explained.
Interviews
The semi-structured format was employed because it allowed the researcher to expand
on the answers given to the original questions. A dialogue emerged in several cases
which were important to clarify issues. Table 4.4 presents details about the interviews
regarding number, the identity of the interviewee, interviews’ locations, the language
used in the interview. A total of 15 interviews was conducted in the spring of 2013,
starting with a pilot interview to identify whether the questions were understood and
unambiguous (Stiles and Taylor, 2001). To enhance the reliability of the collected data
planned to gather all the data, but it is hard to arrange access in Italy. Thus, he was
active in six out of eight cases, ensuring reducing interview questions and style
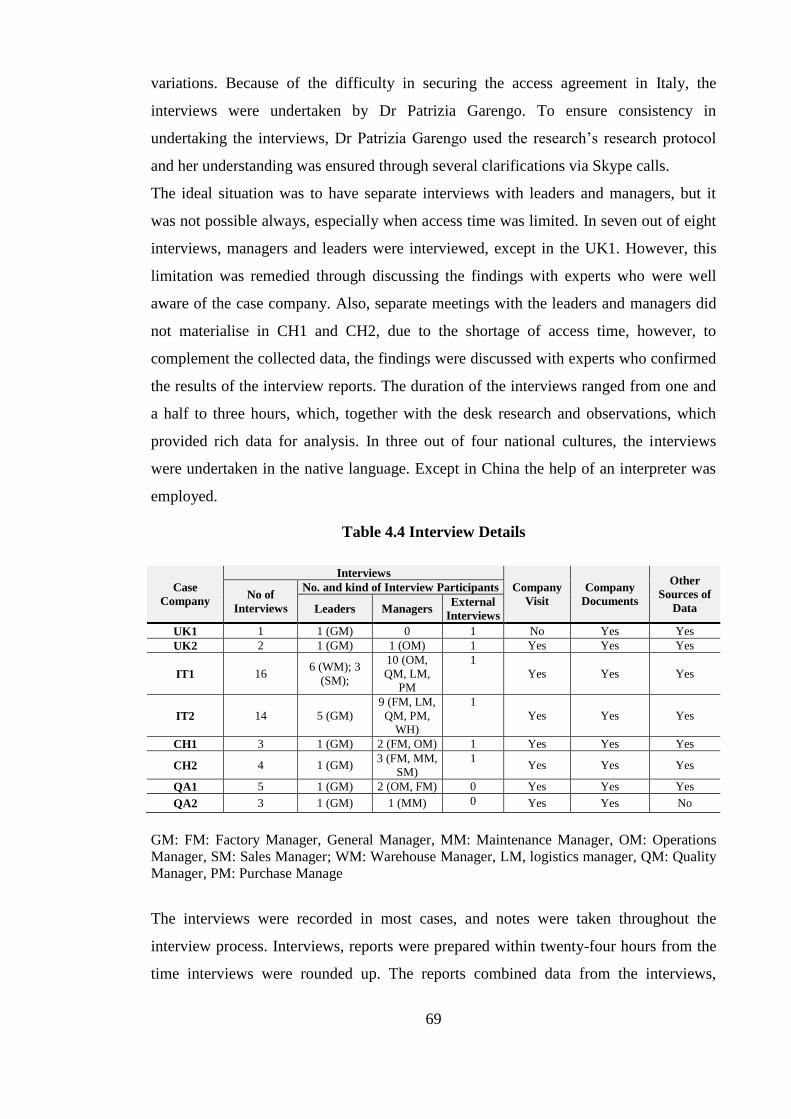
69
variations. Because of the difficulty in securing the access agreement in Italy, the
interviews were undertaken by Dr Patrizia Garengo. To ensure consistency in
undertaking the interviews, Dr Patrizia Garengo used the research’s research protocol
and her understanding was ensured through several clarifications via Skype calls.
The ideal situation was to have separate interviews with leaders and managers, but it
was not possible always, especially when access time was limited. In seven out of eight
interviews, managers and leaders were interviewed, except in the UK1. However, this
limitation was remedied through discussing the findings with experts who were well
aware of the case company. Also, separate meetings with the leaders and managers did
not materialise in CH1 and CH2, due to the shortage of access time, however, to
complement the collected data, the findings were discussed with experts who confirmed
the results of the interview reports. The duration of the interviews ranged from one and
a half to three hours, which, together with the desk research and observations, which
provided rich data for analysis. In three out of four national cultures, the interviews
were undertaken in the native language. Except in China the help of an interpreter was
employed.
Table 4.4 Interview Details
Case
Company
Interviews
Company
Visit
Company
Documents
Other
Sources of
Data
No of
Interviews
No. and kind of Interview Participants
Leaders Managers External
Interviews
UK1 1 1 (GM) 0 1 No Yes Yes
UK2 2 1 (GM) 1 (OM) 1 Yes Yes Yes
IT1 16 6 (WM); 3
(SM);
10 (OM,
QM, LM,
PM
1
Yes Yes Yes
IT2 14 5 (GM)
9 (FM, LM,
QM, PM,
WH)
1
Yes Yes Yes
CH1 3 1 (GM) 2 (FM, OM) 1 Yes Yes Yes
CH2 4 1 (GM) 3 (FM, MM,
SM)
1 Yes Yes Yes
QA1 5 1 (GM) 2 (OM, FM) 0 Yes Yes Yes
QA2 3 1 (GM) 1 (MM) 0 Yes Yes No
GM: FM: Factory Manager, General Manager, MM: Maintenance Manager, OM: Operations
Manager, SM: Sales Manager; WM: Warehouse Manager, LM, logistics manager, QM: Quality
Manager, PM: Purchase Manage
The interviews were recorded in most cases, and notes were taken throughout the
interview process. Interviews, reports were prepared within twenty-four hours from the
time interviews were rounded up. The reports combined data from the interviews,
70
observations and archival documents. The reports were clarified with experts who had
detailed knowledge of the organisations and are established in their academic careers
such as Dr Patrizia Gargano, and Professor Dan Wang.
Direct observations
In seven out of eight cases, interviews took place in the cases’ headquarters. This
helped in adding personal observations to the collected data from interviews and thus
enriched the findings. The limitation for UK1 was treated through validating the
findings with experts. Observations included noting the leaders and managers’
meetings, sitting arrangements, the layout of leaders and managers’ offices, the leaders’
accessibility and so on.
Documentations
The web pages of the investigated cases provided rich information about the
organisations, products, markets, size of business, and so on, thus it helped in providing
the researcher with sufficient data about the cases, giving him the opportunity to
increase the efficiency of the interview times. Some deemed relevant publications and
documents were requested from the organisations.
Validity of the interview
The validity of the interviews was achieved through confirming the interview reports
with experts who have in-depth information about the case organisations. Moreover,
triangulating the different sources of information obtained. Findings obtained from
interviews were compared with information obtained from direct observations and
documentation.
4.2. Data Analysis
The data analysis was undertaken in accordance to (Eisenhardt, 1989; Miles &
Huberman, 1994; Miles et al., 2014). The aim of data analysis was to interpret collected
data to provide an answer to the research questions. The data analysis process involved
data display and analysis to arrive at conclusions (Miles & Huberman, 1994). The data
collected from the case study organisations were analysed individually (within-case
analysis), then collectively (cross-case analysis) and finally, propositions were initiated
and compared with limited findings from the literature and discussed together in
Chapter Six.
71
The data included in the analysis was collected through interviews, from case
organisations' websites, and observations carried out during company visits. The
researcher examined the scope and content of the data collected, reflecting on the data
while sifting through it and noting any emerging concepts or questions, and discussing
the data with colleagues. A tabular format was used to display data. Tables were
arranged with a description of Performance Management System processes of design
and use on the rows, and in the columns, observations were tabulated.
4.2.1. Data display and coding
Displaying data are meant to illustrate and visualise information and evidence gathered
from case studies to draw explanations and predictions towards conclusions. It helps to
describe and predict themes and patterns emerging in the research (Miles & Huberman,
1994).
Qualitative data result in obtaining huge amounts of unstructured data. The data was
tidied and reduced to help the researcher in interpreting and understanding it. In this
study, case study reports Appendix C documented the data in a consistent and coherent
format so the researcher can extract data across case studies (Miles & Huberman, 1994).
Coding is a measure categorising technique which allows condensing the data into
categories (Glaser & Strauss, 1968; Miles & Huberman, 1994). There were codes which
initially from the theoretical framework and those codes which emerged during the
coding process. The original codes are: identifying different types of operating
performance measures, methods of performance management system design, ways used
in Performance Management System use, and noting the aim of using Performance
Management System. While the emerged codes: the types of performance management
system implementation, the use of traditional or balanced Performance Management
Systems, age and education of leaders and the use of objective or subjective
Performance Management Systems in Figure 4.4.
4.2.1. Data analysis
Data analysis was undertaken using Eisenhardt’ s (1989) work on building theory from
case qualitative case studies. Three steps were used in reaching the final conclusions.
The first stage involved within case analysis, the second stage was undertaking cross-
case analysis and arriving at the propositions after numerous iterative attempts of
analysing data. The third stage involved validating that the emerging propositions with
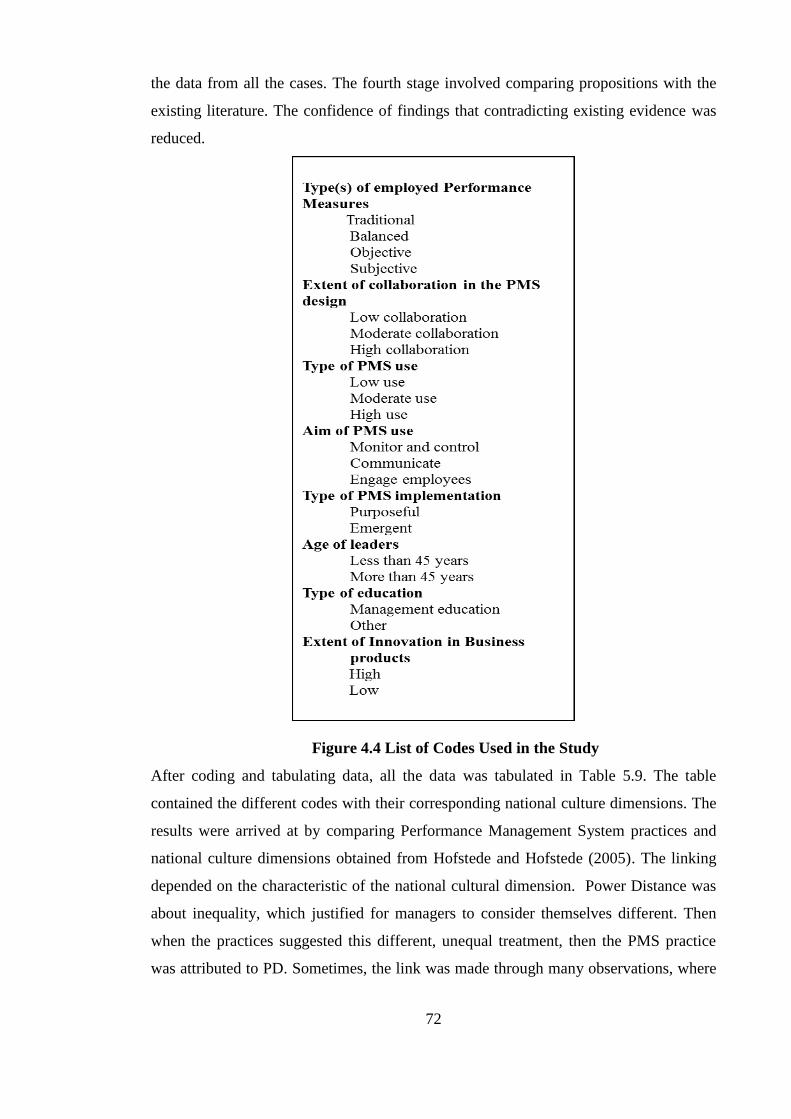
72
the data from all the cases. The fourth stage involved comparing propositions with the
existing literature. The confidence of findings that contradicting existing evidence was
reduced.
After coding and tabulating data, all the data was tabulated in Table 5.9. The table
contained the different codes with their corresponding national culture dimensions. The
results were arrived at by comparing Performance Management System practices and
national culture dimensions obtained from Hofstede and Hofstede (2005). The linking
depended on the characteristic of the national cultural dimension. Power Distance was
about inequality, which justified for managers to consider themselves different. Then
when the practices suggested this different, unequal treatment, then the PMS practice
was attributed to PD. Sometimes, the link was made through many observations, where
Figure 4.4 List of Codes Used in the Study
73
PM practices occurred in similar national cultural dimension, implying some
relationship. For example, in low power distance cultures, the use of traditional
performance management system was observed, and in high power distance cultures,
the use of the balanced performance management system was observed. Implying some
relationship between the use of traditional performance management system and power
distance cultures.
Cross-case analysis was undertaken to find the type of relationships that exist between
national culture dimension(s) in the different countries and the technical and cultural
controls of the used PMS. First, data was analysed for individual cases, and possible
relations between national culture dimensions were noted (Table 5.1- 5.8). Then data
from all the cases were arranged in one table, and within the case, the analysis was
undertaken (Table 5.9). Finally, the cross-case analysis was conducted through
undertaking several iterations, using flow/logical diagrams and other visual techniques
(Fig 5.1-5.4). Propositions emerged the resulting four figures by grouping similar
practices and noting national culture dimensions. Several analysis trials were attempted
until the closure point was reachedThe analysis was closer to grounded theory, and only
MS software was used. Moreover, the main conclusions were presented and discussed
in the major events, such as the PMA Conference held in Denmark in 2014, and the
PMA Symposium held at Loch Lomond in 2013, where suggestions from participants
contributed to debates and inputs from researchers were noted discussed.
Figure 4.5, presents the journey from the theoretical framework to the final propositions
through phases represented by letters from A to F. In A, the theoretical framework
developed in Chapter Two. B accounts for the developed criteria from the literature to
position case study companies along the axis of the theoretical framework. C represents
tables 5.1- 5.8 which is a summary of the with-in case analysis. D represents Table 5.9,
where all with-in case analysis are combined in one table. E accounts for the undertaken
analysis leading to cross case analysis. Finally, F accounts for the propositions of the
research, which arrived at step E.
4.1. Ethics
Codes of ethics are the conventional formats of moral principles. Christians, 2005 had
suggested four concepts to direct researchers in their endeavours. These are informed
consent, deception, privacy, confidentiality, and accuracy. In compliance with Mill and
74
Weber tradition, the research subjects were informed about the nature and consequences
of the research. Access was allowed, and leaders agreed voluntarily to
participate. No known forms of deception were used in the undertaking the
research. The participating organisations and person's identity were protected to satisfy
against any unwanted exposure. The collected data was ensured to be accurate. No
fabrications, fraudulent materials, omissions were allowed.
4.1. Quality of this research
This section evaluates the quality of the present research from the perspective of the
validity of findings, appropriateness of the methodological approach and the limitations
of the study. Table 4.5 summarises the practices taken to ensure the findings meet the
specified criteria for quality.
4.1.1. Construct validity
The construct validity test focuses on the appropriateness of the constructs studied, to
answer the research questions. The approach of investigating elements of Performance
Management System design and use of the eight cases allowed the findings to be
discussed and analysed. Moreover, use of multiple sources of evidence, establishing a
chain of proof, have significant informants review draft case study report. Data
triangulation was undertaken through different interviews with leaders and managers,
data from internet sites, and data provided by the management, and discussing the
findings with academics who were quite aware of the existing Performance
Management System practices with case organisations.
4.1.1. Internal validity
Internal validity is a test of explanations produced by the data analysis and any causal
relationships identified. In this research, internal validity was achieved by ensuring that
explanations were supported by evidence from multiple interviews for all case studies.
The findings were also discussed with other researchers who have experience with the
case study organisations, to validate the explanations. Cause and effect relationships
were not identified in this work, but rather perceived influences, associations, and
influencing factors were discussed and justified with evidence drawn from the interview
reports. The chain of proof from the discussions back though findings, cross-case
analysis, within-case analysis, case study reports, and interview data is clear and
logically ordered in this thesis.
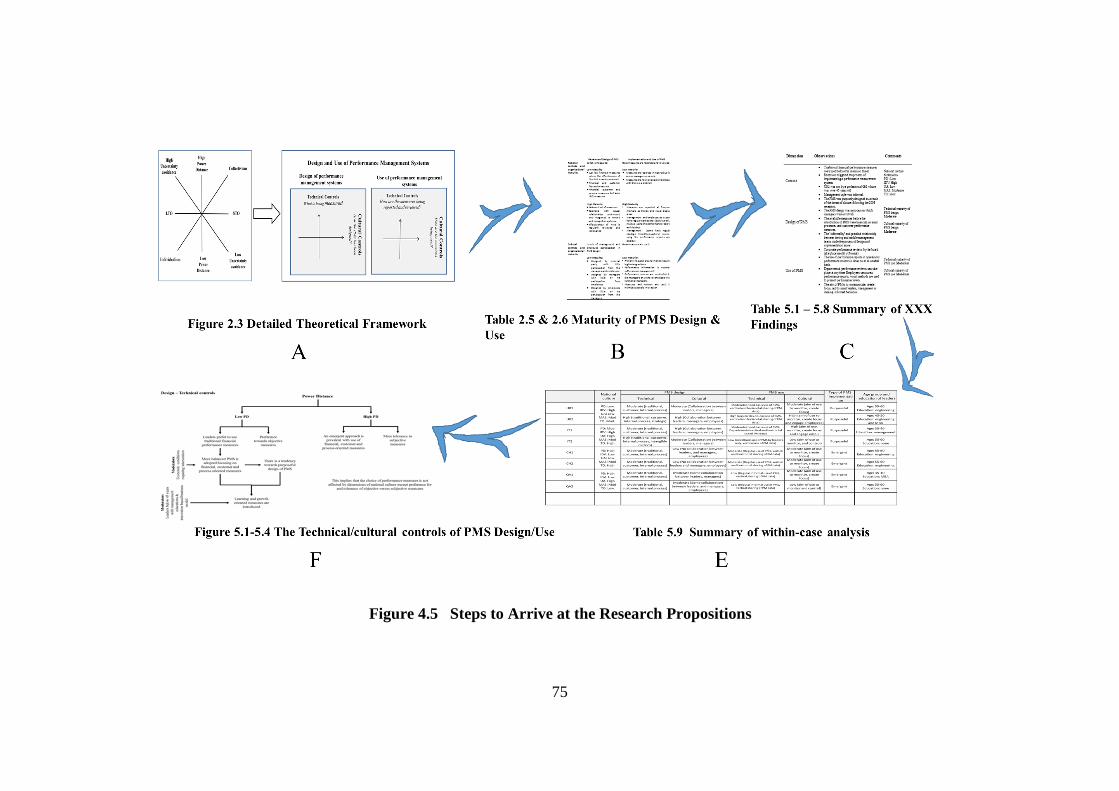
75
Figure 4.5 Steps to Arrive at the Research Propositions
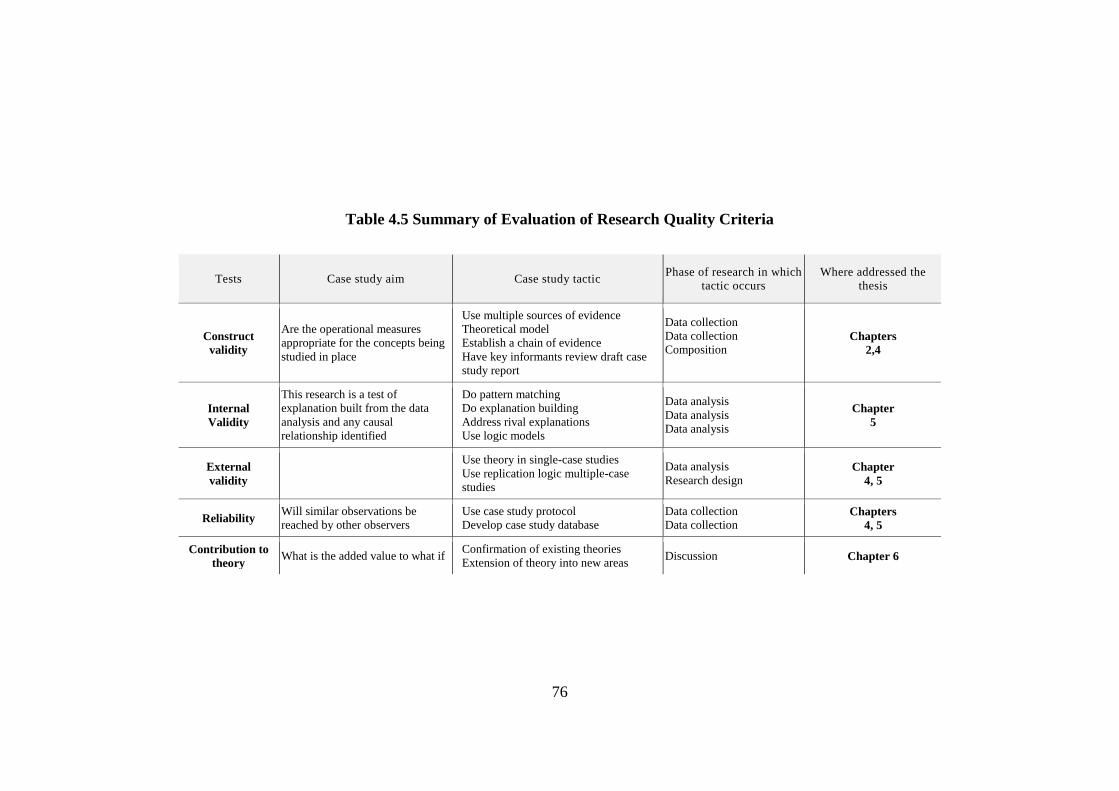
76
Table 4.5 Summary of Evaluation of Research Quality Criteria
Tests Case study aim Case study tactic Phase of research in which
tactic occurs
Where addressed the
thesis
Construct
validity
Are the operational measures
appropriate for the concepts being
studied in place
Use multiple sources of evidence
Theoretical model
Establish a chain of evidence
Have key informants review draft case
study report
Data collection
Data collection
Composition
Chapters
2,4
Internal
Validity
This research is a test of
explanation built from the data
analysis and any causal
relationship identified
Do pattern matching
Do explanation building
Address rival explanations
Use logic models
Data analysis
Data analysis
Data analysis
Chapter
5
External
validity
Use theory in single-case studies
Use replication logic multiple-case
studies
Data analysis
Research design Chapter
4, 5
Reliability Will similar observations be
reached by other observers
Use case study protocol
Develop case study database
Data collection
Data collection Chapters
4, 5
Contribution to
theory What is the added value to what if
Confirmation of existing theories
Extension of theory into new areas Discussion Chapter 6
77
4.1.2. External validity
The test considers the context to which the findings from this work are applicable in
other contexts. Clearly, evidence from eight manufacturing SMEs is context specific,
and the research results may lack generalizability, but due to the similarity of the
findings to other researchers’ work, they can be considered a strong basis for future
action. Some steps were taken to increase the external validity, such as seeking
feedback from colleagues who had experience in most of the case organisations. In all
the eight case studies, the same conceptual framework and pattern searching in different
SMEs carried out through replication logic. The findings were discussed at several
conferences, such PMA 2014 and PMA Symposium 2013.
4.1.3. Reliability
The reliability test assesses whether the same results can be produced by replicating the
methods used in the current study. One tactic employed to increase reliability was the
use of a case study protocol for collecting data, which was developed and applied in this
research, as shown in Appendix B. Furthermore, the use of a theoretical framework for
analysing the case study data, coupled with the provision of explicit definitions for each
construct, enables replication. The structured method for analysing the data, using tables
and influence diagrams, provides a chain of evidence for reaching the conclusions of
this work, adding to their reliability.
4.1.4. Appropriateness of the methodological approach
This work employed a case study methodology and qualitative methods of data
collection, namely semi-structured interviews, secondary documentation, and general
observations; and for data analysis, namely narrative analysis and coding. The methods
used in this research have proved appropriate for understanding the influence of national
culture. In regards to secondary documentation, internet sites provided supporting
evidence for contextual factors and factual information about the investigated
organisations. Also, the researcher’s observations on visiting the sites, as well as having
an informal conversation with employees, helped to provide an insight into certain
intangible elements of these organisations.
78
4.1.5. Contribution to knowledge/theory
It is expected that high-quality research would contribute knowledge regarding offering
originality and value to the scientific community. This contribution can take many
shapes, such as confirmation of existing theories, extending theories into new areas, or
applying existing theories in new disciplines. The contribution could be adding new
methodologies, or making new uses of existing methodologies, generating hypotheses,
generating theory, or generating insights. Lastly, a contribution can be made by
disproving an existing theory. On the other hand, if the research is applied, contribution
to practice is one of the criteria for high-quality studies; this contribution can take the
form of the research being helpful to policy makers or practitioners in decision-making.
In this research, the contribution to theory and practice will be evaluated in Chapter Six.
4.2. Summary of Chapter Four
The stated aim of the research was to investigate the impact of national culture on the
design and use of Performance Management Systems. In this chapter, the choice of
research design, philosophical paradigm and the assumptions underlying the research
were justified, as well as the use of case study method. Finally, a framework to test for
the quality of this research was outlined.
79
Chapter 5 Empirical Findings
The aim of the chapter is to present the empirical data collected from each of the eight
case studies, and discuss it concerning the theoretical framework developed in Chapter
Two to answer the research question of how does National Culture impact on the design
and use of Performance Management Systems? Sections 5.1 to 5.8 reports on each
national culture case study and at the end of the second case from each national culture,
a dedicated subsection provides general observations relating to each national culture.
Section 5.9 presents a cross-case analysis of these findings, and, in the end, the
propositions of this research are presented. It should be noted that national culture
dimension of low, high, or indeterminate was based on the score in Table and
considering PD< 50 is Low; PD= 50 is Moderate; PD> 50 is High; IDV< 50 is Low;
IDV > 50 High, UA< 50 is Low, UA> 50 is High; MAS > 50 is high, TO <50 is short;
TO> 50 is Long.
5.1. UK national culture – First Case (UK1)
5.1.1. UK1 Contextual conditions
UK1 is an SME, which was founded in 1988 to offer warehousing capacity to
producers, exporters and importers of alcoholic products. Their staff requirement is
variable depending on their production schedule, but usually reaching one-hundred and
twenty employees at peak times. UK1 has informal organisation culture, with secure
communication channels between leaders, managers and staff. When the owners
identified a gap in the market, they diversified to offer a co-packing service, and later
provided a bottling function. Packing is a labour-intensive job, and the majority of
drinks producers outsource this service. Co-packing involves placing the core product
inside the special packaging, while bottling is a service that involves mixing drinks to a
particular ratio, bottling and packing them at the same time. To control the two separate
streams efficiently, the management of UK1 separated the two value streams into two
factories. The management team were experienced engineers with more than 45 years of
age, with a substantial engineering background. The organisational culture is informal.
Table 5.1 presents a summary of the case details.
80
5.1.2. The national culture influence on Performance Management System
design in the UK1
Initially, the organisation was managed using traditional financial performance
measures.
“initially we did not have performance management system.”
GM, UK1 interviews, 2013
However, economic conditions forced the owners to become more competitive, by
reducing costs and introducing a more advanced performance management system to
communicate this new strategy to their managers and employees. The new performance
management system is comprised of financial, customer, and internal operations
performance measures. Financial performance measures include reports such as the
balance sheet, earnings statement, and cash flow. The designed measures can be divided
into two parts: sales and cost of operation. Internal operations performance reports
outline metrics such as productivity, and overhead costs. The productivity measure
relates to the efficiency of filling operations, while the overhead costs of packaging are
measured regarding cost incurred during the packaging processes. The Performance
Management System design process benefits from the vast experience of both the board
members and the management team. Leaders of UK1 involved managers in the
Performance Management System design process. The employed measures are mostly
objective. The design process is a consultative process between the leaders and the
managers.
UK1 is characterised with the UK’s national cultural dimensions of low Power
Distance, Low Uncertainty Avoidance, high individualism, and indeterminate term
orientation. In the following, the influence of national culture is observed as follows:
First, low Power Distance/individualism cultures influence: a) the initial use of
Financial Performance Management System. It is thought that due to critical economic
conditions, new Performance Management System design, implementation and use was
triggered. B) The preference of objective performance measures. Second, due to low
Power Distance/Individuality and low Uncertainty Avoidance: a,) collaboration in the
Performance Management System design was extended to managers. Third, no
influence was observed due to term orientation, and masculinity.
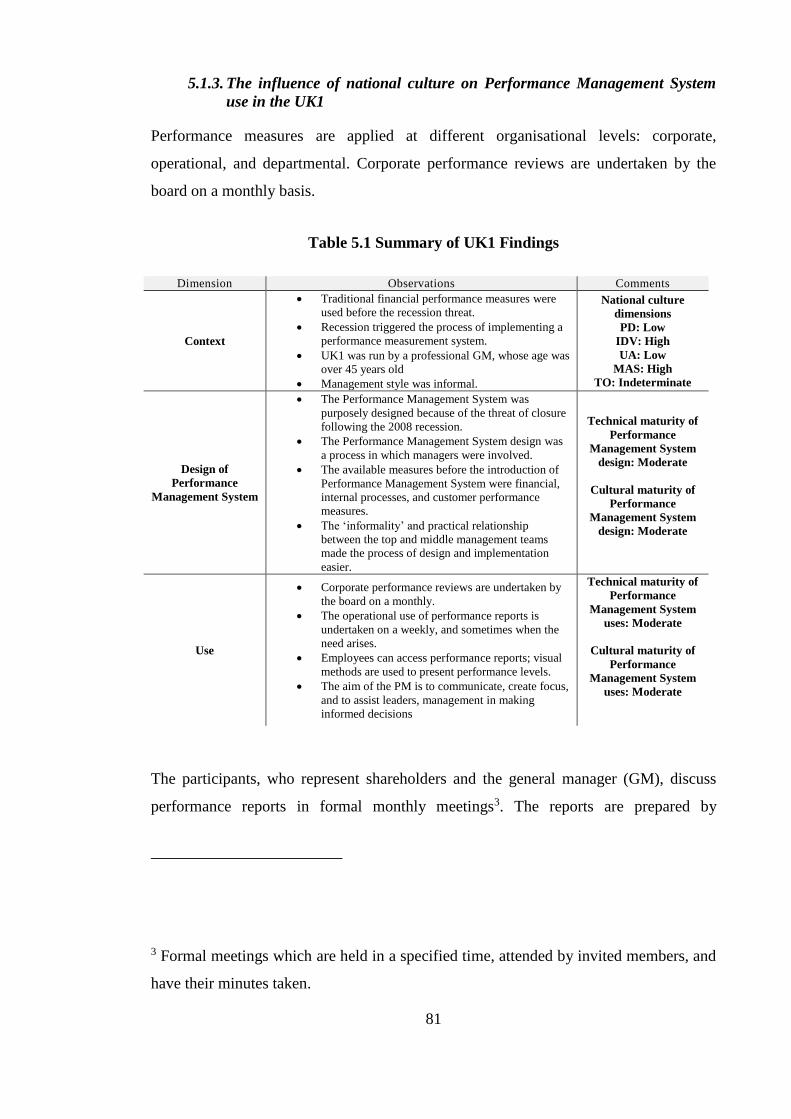
81
5.1.3. The influence of national culture on Performance Management System
use in the UK1
Performance measures are applied at different organisational levels: corporate,
operational, and departmental. Corporate performance reviews are undertaken by the
board on a monthly basis.
Table 5.1 Summary of UK1 Findings
Dimension Observations Comments
Context
Traditional financial performance measures were
used before the recession threat.
Recession triggered the process of implementing a
performance measurement system.
UK1 was run by a professional GM, whose age was
over 45 years old
Management style was informal.
National culture
dimensions
PD: Low
IDV: High
UA: Low
MAS: High
TO: Indeterminate
Design of
Performance
Management System
The Performance Management System was
purposely designed because of the threat of closure
following the 2008 recession.
The Performance Management System design was
a process in which managers were involved.
The available measures before the introduction of
Performance Management System were financial,
internal processes, and customer performance
measures.
The ‘informality’ and practical relationship
between the top and middle management teams
made the process of design and implementation
easier.
Technical maturity of
Performance
Management System
design: Moderate
Cultural maturity of
Performance
Management System
design: Moderate
Use
Corporate performance reviews are undertaken by
the board on a monthly.
The operational use of performance reports is
undertaken on a weekly, and sometimes when the
need arises.
Employees can access performance reports; visual
methods are used to present performance levels.
The aim of the PM is to communicate, create focus,
and to assist leaders, management in making
informed decisions
Technical maturity of
Performance
Management System
uses: Moderate
Cultural maturity of
Performance
Management System
uses: Moderate
The participants, who represent shareholders and the general manager (GM), discuss
performance reports in formal monthly meetings3. The reports are prepared by
3 Formal meetings which are held in a specified time, attended by invited members, and
have their minutes taken.
82
professional accountants who are in direct contact with the executives. Operational
performance reviews are carried out via meetings when needed between the General
Manager and his deputies, with no predetermined appointments, and no minutes taken,
in the form of on the spot discussions followed by decisions.
“We discuss performance reports, and what should be taken at any
time of the day”.
GM, UK1 interviews, 2013
Departmental performance reviews are held weekly, and are used to make employees
aware of the performance results; the use of visual reporting methods was employed,
and the reports can be accessed by all employees. The General Manager answered when
asked about the accessibility of employees to information:
“all performance reports are accessible to employees to read and
analyse.”
GM, UK1 interviews, 2013
Also, employee feedback is encouraged, and two-way communication takes place
between managers and staff, leading to information sharing that enhances organisational
learning. Leaders in UK1 also use Performance Management System to reduce costs, by
communicating to employees the vital need to cut costs.
UK1 is characterised with UK’s national cultural dimensions of low Power Distance,
Low Uncertainty Avoidance, high individualism, indeterminate term orientation. In the
following, the influence of national culture dimensions is observed as follows: First,
low Uncertainty Avoidance culture influence: a) the need-based Performance
Management System use. B) The open sharing of performance results across to
managers and colleagues. Second, low Power Distance/Individuality influence: the aim
of measurement which is communication and attention focusing. Third, no influence
was observed due to term orientation, and masculinity
83
5.2. UK national culture – Second Case (UK2)
5.2.1. UK2 Contextual conditions
UK2 is a privately owned, medium-sized enterprise operating in the business-to-
consumers sector, and is known for its innovation-based business model and products.
They manufacture hi-fi products that consumers consider to be of the highest quality in
their particular market niche. UK2 was founded 40 years ago, by an entrepreneur, but
overexpansion caused a financial crisis. Shareholders changed the leadership and
brought in a new General Manager, who was younger and more educated in
management theory. The new management consolidated previous successes and re-
defined the product offering. However, some managers resisted the new plans, and
eventually they resigned. After the upheavals of implementing new management
structure, remaining managers and newly employed managers formed by the top
management open and independent relationship. Consequently, the new management
continued efforts to restructure and improve the efficiency of operations through the
utilisation of an advanced performance management system. Allowing the organisation
to rebound and overcome their financial difficulty. Shareholders constitute a
professional board that governs operations through monthly meetings. Executive
managers gather for a daily meeting, which is preceded by a daily departmental
meeting. Moreover, the company has developed highly integrated research,
development, and manufacturing processes to align and test their strategy continuously.
Table 5.2 presents a summary of the case details.
5.2.2. The influence of national cultures on Performance Management System
design in UK2
The performance management system utilised in UK2 was developed about various
internal KPIs, related to the different company departments, and measures external KPIs
such as customer satisfaction, brand awareness and market share. For example, in the
Marketing department, among the performance measures used are web visits, the
number of demo bookings, and some demos attended. In the Sales department, the
performance measures include some orders, order value, daily orders, and total orders.
Among the financial performance measures are cash, net sales, credits, and margin.
Similarly, different performance measures were observed in other departments, such as
the Service, Manufacturing and purchasing departments.
84
The process of designing performance measures was collaborative, and the leader
invited managers and employees to participate in the design of strategy and performance
measures.
“In our meetings, we discuss strategy, and discuss measures that help
us to reach that strategy, and every manager attends that meeting.
Again, in each department, they discuss performance measures and
jointly develop it and review it”. OM, UK2 interviews, 2013
UK2 is characterised with UK’s national cultural dimensions of low Power Distance,
Low Uncertainty Avoidance, high individualism, indeterminate term orientation. From
the context surrounding the Performance Management System design, some moderators
were observed, namely: being under 45 years old, the management education of leaders
and a business model based on innovation. In the following the influence of national
culture and moderators is observed as follows: First, low Power Distance/individualism
cultures influence: a) the initial use of Financial Performance Management System. It is
thought that due to critical economic conditions, new Performance Management System
design, implementation and use was triggered. B) The preference of objective
performance measures. Second, due to low Power Distance/Individuality, Low
Uncertainty Avoidance and moderators: a,) collaboration in the Performance
Management System design was extended to managers and employees. Third, low
Power Distance and moderators: a) the design of performance measures was enhanced
to include the design of learning and growth measures. Fourth, no influence was
observed due to: term orientation, and masculinity.
5.2.3. The influence of national culture on Performance Management System
use in UK2
Performance reviews are undertaken at different levels. The first level is the board, a
group of experienced professionals. They reviewed actual performance versus planned
in their monthly meetings, and the General Manager explained performance
discrepancies. Operational level performance reviews are regular one-hour meetings
held daily, in an open format, attended by all department managers or their
representatives. The performance measures reviews are displayed on whiteboards, the
results shared horizontally by all managers, and performance indicators are open to
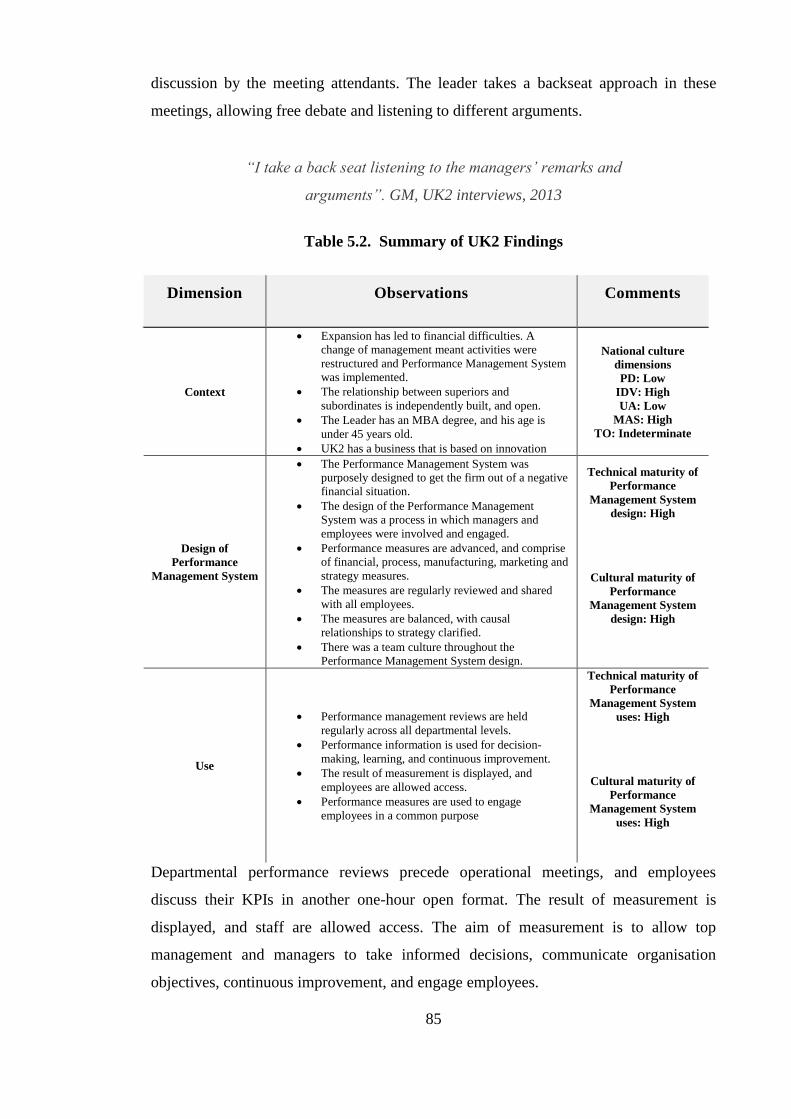
85
discussion by the meeting attendants. The leader takes a backseat approach in these
meetings, allowing free debate and listening to different arguments.
“I take a back seat listening to the managers’ remarks and
arguments”. GM, UK2 interviews, 2013
Table 5.2. Summary of UK2 Findings
Dimension Observations Comments
Context
Expansion has led to financial difficulties. A
change of management meant activities were
restructured and Performance Management System
was implemented.
The relationship between superiors and
subordinates is independently built, and open.
The Leader has an MBA degree, and his age is
under 45 years old.
UK2 has a business that is based on innovation
National culture
dimensions
PD: Low
IDV: High
UA: Low
MAS: High
TO: Indeterminate
Design of
Performance
Management System
The Performance Management System was
purposely designed to get the firm out of a negative
financial situation.
The design of the Performance Management
System was a process in which managers and
employees were involved and engaged.
Performance measures are advanced, and comprise
of financial, process, manufacturing, marketing and
strategy measures.
The measures are regularly reviewed and shared
with all employees.
The measures are balanced, with causal
relationships to strategy clarified.
There was a team culture throughout the
Performance Management System design.
Technical maturity of
Performance
Management System
design: High
Cultural maturity of
Performance
Management System
design: High
Use
Performance management reviews are held
regularly across all departmental levels.
Performance information is used for decision-
making, learning, and continuous improvement.
The result of measurement is displayed, and
employees are allowed access.
Performance measures are used to engage
employees in a common purpose
Technical maturity of
Performance
Management System
uses: High
Cultural maturity of
Performance
Management System
uses: High
Departmental performance reviews precede operational meetings, and employees
discuss their KPIs in another one-hour open format. The result of measurement is
displayed, and staff are allowed access. The aim of measurement is to allow top
management and managers to take informed decisions, communicate organisation
objectives, continuous improvement, and engage employees.
86
UK2 is characterised with UK’s national cultural dimensions of low Power Distance,
Low Uncertainty Avoidance, high individualism, indeterminate short-term orientation.
From the context surrounding the Performance Management System use, some
moderators were observed, namely: being under 45 years old, management education of
leaders and a business based on innovation. In the following, the influence of national
culture dimensions and moderators is observed as follows: First, low Uncertainty
Avoidance culture and moderators influence: a) the degree of Performance Management
System use which is found to be regular. B) The open sharing of performance results
across to managers and colleagues. Second, low Power Distance/Individuality and
moderators influence the aim of Performance Management Systems’ use to be
employee engagement. Third, no influence was observed due to term orientation, and
masculinity.
5.3. Italian National Culture- First Case (IT1)
5.3.1. Contextual conditions of IT1
IT1 is an organisation that manufactures furniture and is known for innovative products.
However, when it was founded at the end of 1900, by the grandfather of the current
owners, it was just a workshop that produced wood products. At the end of the 1990s,
the new owner introduced some changes, such as producing innovative products, but
retaining the company’s core values. IT1 began to produce furniture under the umbrella
of an unknown brand, but later became widely known due to its innovative products.
Thus, IT1 has witnessed changes in two ways: in its leadership, and in integrating
innovative practices within the organisation. Currently, the company has around 170
employees. The leaders of IT1 are young and educated in management. IT1 has an
innovation-based business model aimed at creating furniture. The relationship between
leadership and managers is based on trust, with a flat hierarchy and open access
relationship. Table 5.3 presents a summary of the case details.
5.3.2. The influence of national culture on the Performance Management
System design of IT1
There were two levels of Performance Management System design, corporate and
operational. On the corporate level, leaders designed financial and customer
performance measures. On the other hand, at the operational level, department managers
87
designed their performance metrics to measure their departments’ internal operations
processes. The subjectivity of measures could be observed when leaders expressed that
they were concerned with ‘positive behaviour’, and not with just achieving predefined
targets.
“The IT1’s performance management system is not well formalised
but aligned with IT1 values. Three main drivers were considered are
time to market, IT1 values and quality”.
Manger, IT1 interviews, 2013.
Consequently, the design process of Performance Management System is decentralised
to each department, and even employees can participate in the Performance
Management System design process.
“The design and implementation process was based on a consultative
approach: staff were consulted and involved in the definition of the
data collected as the data should be used by staff to improve their
work. As the employees created the system, they accept it
immediately”.
Manger, IT1 interviews, 2013.
IT1 is characterised with Italy’s national cultural dimensions of moderate but inclined
towards low Power Distance, high Uncertainty Avoidance, high individualism, long-
term orientation. From the context surrounding the Performance Management System
design, some moderators were observed, namely: being under 45, management
education of leaders and innovation based business model. In the following, the
influence of national culture and moderators is observed as follows: First, low Power
Distance/individualism cultures influence: a) the initial use of Financial Performance
Management System. It is thought that due to critical economic conditions, new
Performance Management System design, implementation and use was triggered.
Second, due to low Power Distance/Individuality, high Uncertainty Avoidance and
moderators: a) collaboration in the Performance Management System design was
extended to managers and employees, though leaders design their measures and
88
delegate local Performance Management System to managers who involve their
employees in the design process. Third, no influence was observed due to term
orientation, and masculinity.
5.3.3. The influence of national culture on the Performance Management
System use of IT1
Use of performance measures was observed at two levels, corporate and departmental.
Leaders used financial performance results to make informed decisions and monitor
critical processes, whereas departments held informal monthly performance reviews, at
which performance reports were displayed visually. Performance reviews are
decentralised, and horizontal4 accessibility was rarely observed. Leaders’ aims in using
performance measures are to monitor critical processes, to guide their decision-making,
and to motivate employees.
“This aims to require the introduction of a suitable measurement
system to manage activities (but not to control employees)”. “The
system is also promoting the improvement of empowerment and
engagement”. Manager in IT2, interviews, 2013
Performance Management System use is regular, but the accessibility of corporate
performance reports is restricted to managers, meaning that access to performance
reports is still facilitated through vertical communication, which could be due to the
strong UA environment.
IT1 is characterised with Italy’s national cultural dimensions of moderate but inclined
towards low Power Distance, high Uncertainty Avoidance, high individualism, long-
term orientation. From the context surrounding the Performance Management System
use, some moderators were observed, namely: being under 45, management education
of leaders and innovation based business model.
4 Horizontal means interdepartmental.
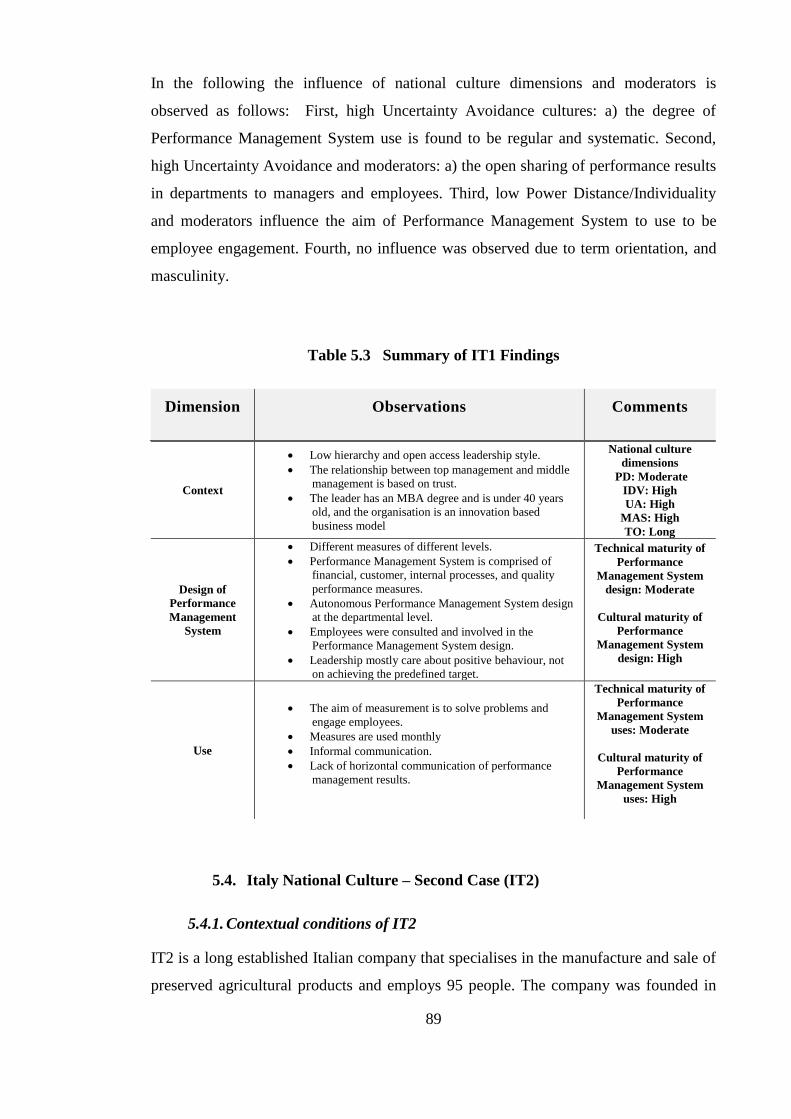
89
In the following the influence of national culture dimensions and moderators is
observed as follows: First, high Uncertainty Avoidance cultures: a) the degree of
Performance Management System use is found to be regular and systematic. Second,
high Uncertainty Avoidance and moderators: a) the open sharing of performance results
in departments to managers and employees. Third, low Power Distance/Individuality
and moderators influence the aim of Performance Management System to use to be
employee engagement. Fourth, no influence was observed due to term orientation, and
masculinity.
Table 5.3 Summary of IT1 Findings
Dimension Observations Comments
Context
Low hierarchy and open access leadership style.
The relationship between top management and middle
management is based on trust.
The leader has an MBA degree and is under 40 years
old, and the organisation is an innovation based
business model
National culture
dimensions
PD: Moderate
IDV: High
UA: High
MAS: High
TO: Long
Design of
Performance
Management
System
Different measures of different levels.
Performance Management System is comprised of
financial, customer, internal processes, and quality
performance measures.
Autonomous Performance Management System design
at the departmental level.
Employees were consulted and involved in the
Performance Management System design.
Leadership mostly care about positive behaviour, not
on achieving the predefined target.
Technical maturity of
Performance
Management System
design: Moderate
Cultural maturity of
Performance
Management System
design: High
Use
The aim of measurement is to solve problems and
engage employees.
Measures are used monthly
Informal communication.
Lack of horizontal communication of performance
management results.
Technical maturity of
Performance
Management System
uses: Moderate
Cultural maturity of
Performance
Management System
uses: High
5.4. Italy National Culture – Second Case (IT2)
5.4.1. Contextual conditions of IT2
IT2 is a long established Italian company that specialises in the manufacture and sale of
preserved agricultural products and employs 95 people. The company was founded in
90
1962, but grew rapidly and tripled its turnover and production volume in less than ten
years. In the early ‘90s, the company began designing a new factory, which became
operational in 1994. It adopted quality standard methodologies such as ISO certification
and began modernising equipment and buildings. However, the business encountered
some complexities in its operation, such as the seasonality of the supply of raw
products, which required speed and flexibility in its manufacturing process. The owners
and members of their families occupy the majority of the relevant managerial posts in
the organisation. The three owners take the major decisions, and rarely the involved, but
the relationship between top management and middle management is friendly and based
on trust. The organisational culture is friendly and supportive. Table 5.4 presents a
summary of the case details.
5.4.2. The influence of national culture on Performance Management System
design at
Leaders and managers undertook the design of Performance Management System.
“the design and implementation process was based on a consultative
approach: all the staff analysed the current Performance
Management System, then the managers of each function were
involved in the re-design of the system and the definition of the main
strategic indicators”. IT2 Manager, interviews, 2013
The observed Performance Management System included financial, customer, and
internal process performance measures and intangible perspectives, indicating a high
technical maturity of Performance Management System design. Examples of customer-
related performance measures include compliance with delivery times, decreased stock
shortage, increased market share, increased brand reputation, improved client services,
improved quality of sales force and customer relationship, and product range
completeness. Examples of financial performance measures include: decreased impact
of purchasing costs on net revenues, minimised production costs of finished goods,
increased contribution margin, increased overall turnover, and increased turnover from
new customers. Examples of internal processes related performance measures include:
improved supply reliability, increased production efficiency, greater flexibility of
production system, improved stability of production planning, conformity of
91
manufacturing process, and increased development speed. Examples of intangible
performance measures include personnel satisfaction and improved alignment of
competencies. Thus, the technical maturity of Performance Management System design
in IT2 is high.
IT2 is characterised by Italy’s national cultural dimensions of moderate but inclined
towards low Power Distance, high Uncertainty Avoidance, high individualism, long-
term orientation. In the following, the influence of national culture is observed as
follows: First, low Power Distance/individualism cultures influence: a) the initial use of
Financial Performance Management System. It is thought that due to critical economic
conditions, therefore new Performance Management System design, implementation
and use was triggered. Second, due to low Power Distance/Individuality and high
Uncertainty Avoidance: a,) collaboration in the Performance Management System
design was extended to managers. Third, no influence was observed due to term
orientation, and masculinity.
5.4.3. The Influence of national culture on Performance Management System
use at IT2
The collection of performance data takes place daily and weekly, and the results are
discussed on a weekly and monthly basis, by the top management team. The main
theme of the performance reviews is helping leaders understand the determinants of
negative results and identify possible solutions. Particular attention is given to processes
from the perspective of reducing costs and increasing efficiency.
“Particular attention is given to the process perspective to reduce
cost and increase efficiency”. IT2 Manager, interviews, 2013
It should be noted that despite the publicly announced company objectives, the
Performance Management System at the time of the case study was not supporting the
improvement of empowerment and engagement.
“Despite the company's objectives, the Performance Management
System is not supporting the improvement of empowerment and
engagement”.. IT2 manager, interviews, 2013
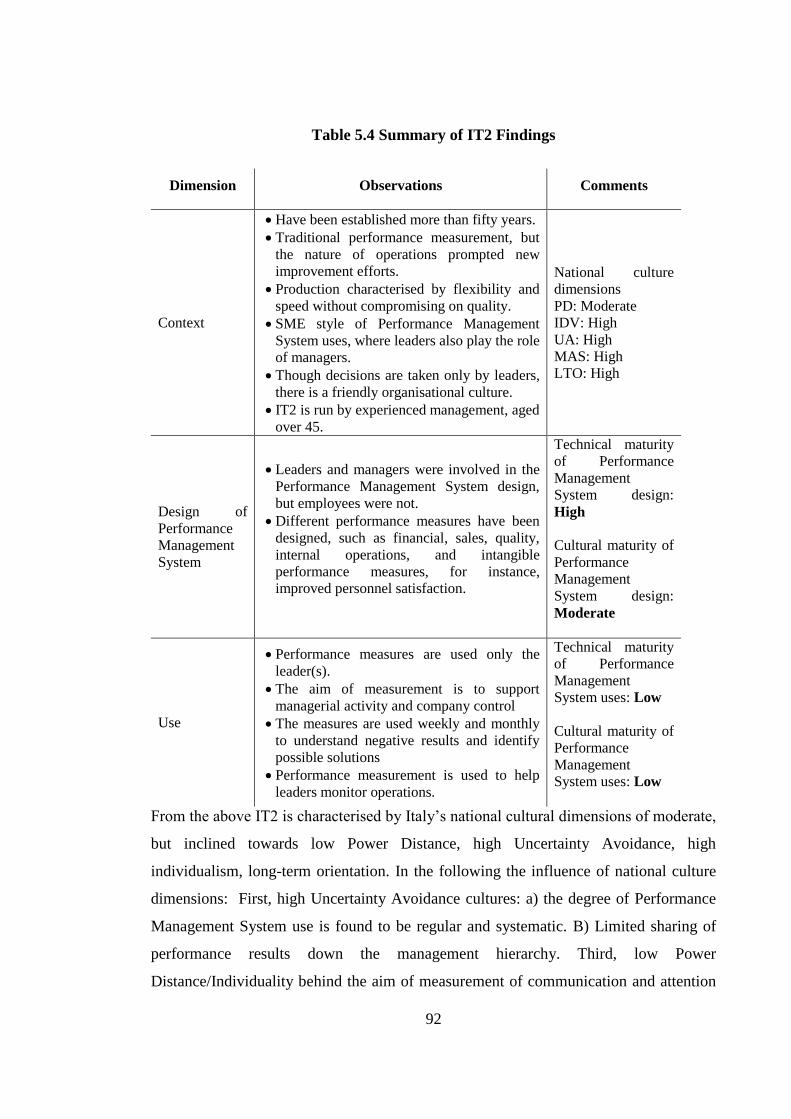
92
Table 5.4 Summary of IT2 Findings
Dimension Observations Comments
Context
Have been established more than fifty years.
Traditional performance measurement, but
the nature of operations prompted new
improvement efforts.
Production characterised by flexibility and
speed without compromising on quality.
SME style of Performance Management
System uses, where leaders also play the role
of managers.
Though decisions are taken only by leaders,
there is a friendly organisational culture.
IT2 is run by experienced management, aged
over 45.
National culture
dimensions
PD: Moderate
IDV: High
UA: High
MAS: High
LTO: High
Design of
Performance
Management
System
Leaders and managers were involved in the
Performance Management System design,
but employees were not.
Different performance measures have been
designed, such as financial, sales, quality,
internal operations, and intangible
performance measures, for instance,
improved personnel satisfaction.
Technical maturity
of Performance
Management
System design:
High
Cultural maturity of
Performance
Management
System design:
Moderate
Use
Performance measures are used only the
leader(s).
The aim of measurement is to support
managerial activity and company control
The measures are used weekly and monthly
to understand negative results and identify
possible solutions
Performance measurement is used to help
leaders monitor operations.
Technical maturity
of Performance
Management
System uses: Low
Cultural maturity of
Performance
Management
System uses: Low
From the above IT2 is characterised by Italy’s national cultural dimensions of moderate,
but inclined towards low Power Distance, high Uncertainty Avoidance, high
individualism, long-term orientation. In the following the influence of national culture
dimensions: First, high Uncertainty Avoidance cultures: a) the degree of Performance
Management System use is found to be regular and systematic. B) Limited sharing of
performance results down the management hierarchy. Third, low Power
Distance/Individuality behind the aim of measurement of communication and attention
93
focus, plus monitoring and control. Second, no influence was observed due to: term
orientation, and masculinity.
5.5. China National Culture – First Case (CH1)
5.5.1. Contextual conditions of CH1
CH1 was founded in 1958 and specialises in the manufacture and sale of industrial
equipment for food manufacturers, such as dumpling makers, stuffing and cutting
machines, flour mixing machines, hoisting rapid freezers, walnut cake makers and other
machines of different sizes and capacities. The company's primary markets include the
domestic market in China, and in sixty-four countries. The company has approximately
180 full-time employees. Approximately one hundred shareholders privately own the
company; the shareholders elect the supervisory board, to assess the management team,
and to appoint the General Manager. Every year, the oversight board meets with the
General Manager to review actual financial performance against planned performance.
The result of this review indicates the degree of effectiveness of the executive
management of the organisation. Table 5.5 presents a summary of the case details.
5.5.2. The influence of national culture on Performance Management System
design in CH1
The Performance Management System at CH1 is comprised of financial, customer, and
internal operations performance measures. Leaders initiated performance measurement
design by calculating expected sales, looking at sales history, and predicting expected
demand. Then, a plan was made to forecast master production; the plan outlined the
projected workload for various departments, and managers received their departments’
targets, and in turn distributed to the important responsibilities and tasks among their
employees. Neither managers nor employees participated in calculating the production
target and plan.
Despite their non-involvement in the Performance Management System design process,
managers’ attitudes were observed to be indifferent. When the leader was asked about
whether managers were disappointed by their non-participation, he seemed surprised at
the suggestion.
94
“No”. CH1 general manager when I asked him whether his staff
asked feel sad or unhappy for not participating in the PMS design
process. Interviews, 2013
CH1 is characterised by China’s national culture dimensions of high Power Distance,
Low Uncertainty Avoidance, low individualism, long-term orientation. In the following
the influence of national culture is observed as follows: First, high power/ low
individualism influences: a) the new approach in the use of a financial, customer and
process-oriented performance measurement. B) More tolerance to subjective measures.
Second, High Power Distance/ low Individuality and low Uncertainty Avoidance: a)
leaders prefer to design the Performance Management System themselves. Third, no
influence was observed due to: term orientation, and masculinity
5.5.3. The influence of national culture on Performance Management System
use in CH1
The performance management system is considered an important managerial tool for
directing attention and communication, and for informing leaders in their decision-
making. To communicate and direct attention, meetings are the preferred tool in CH1 to
conduct performance reviews. Different formal meetings are conducted at various levels
and for various reasons, such as quality meetings, production meetings, executive
meetings, board meetings and so on. Some meetings are held monthly, such as board
meetings; others, such as executive meetings, are held weekly, and at the departmental
level meetings can be daily.
In performance reviews managers who did not fulfil their targets, are expected to
explain reasons behind their failures. The aim of the leaders in this measurement is to be
able to take informed decisions regarding pricing, production, purchase plans, and
focusing employees toward production policies.
CH1 is characterised with China’s national culture dimensions of high Power Distance,
Low Uncertainty Avoidance, low individualism, long-term orientation. In the following
the influence of national culture is observed as follows: First, low Uncertainty
Avoidance and long-term orientation influence: a) the regular and systematic use of
performance reports. B) The open sharing of performance information and reports on all
levels. Second, High Power Distance/ low Individuality and low Uncertainty
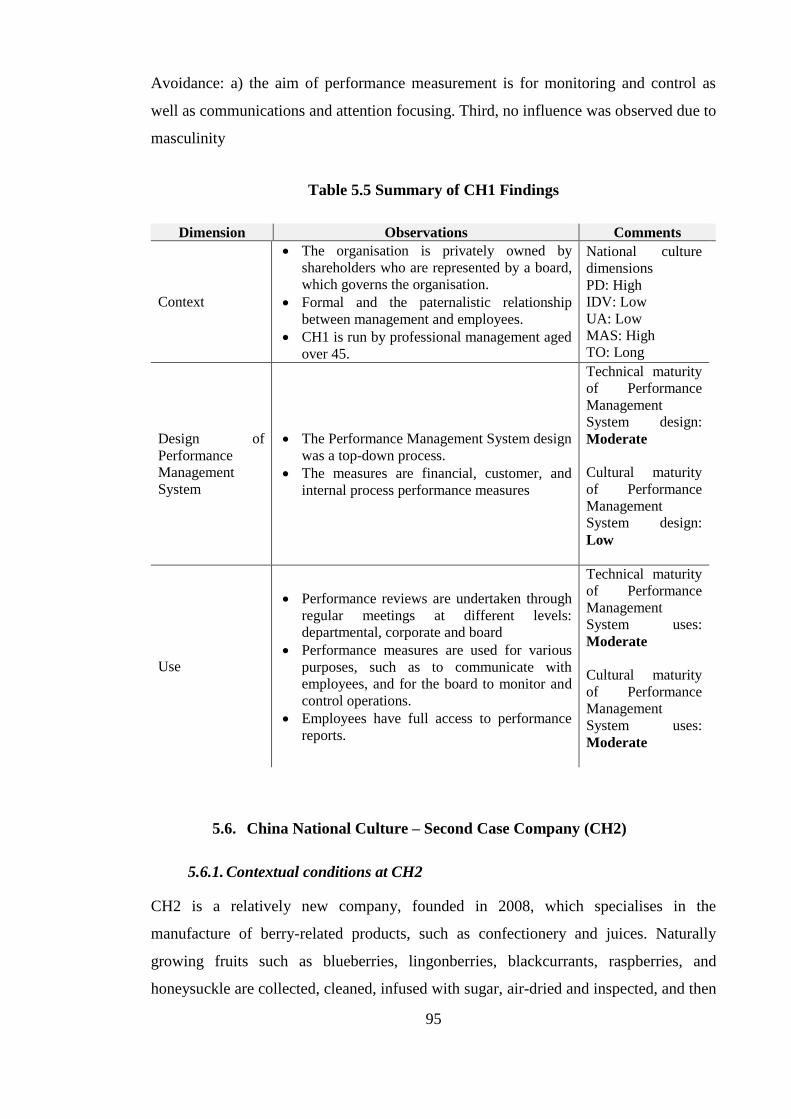
95
Avoidance: a) the aim of performance measurement is for monitoring and control as
well as communications and attention focusing. Third, no influence was observed due to
masculinity
Table 5.5 Summary of CH1 Findings
Dimension Observations Comments
Context
The organisation is privately owned by
shareholders who are represented by a board,
which governs the organisation.
Formal and the paternalistic relationship
between management and employees.
CH1 is run by professional management aged
over 45.
National culture
dimensions
PD: High
IDV: Low
UA: Low
MAS: High
TO: Long
Design of
Performance
Management
System
The Performance Management System design
was a top-down process.
The measures are financial, customer, and
internal process performance measures
Technical maturity
of Performance
Management
System design:
Moderate
Cultural maturity
of Performance
Management
System design:
Low
Use
Performance reviews are undertaken through
regular meetings at different levels:
departmental, corporate and board
Performance measures are used for various
purposes, such as to communicate with
employees, and for the board to monitor and
control operations.
Employees have full access to performance
reports.
Technical maturity
of Performance
Management
System uses:
Moderate
Cultural maturity
of Performance
Management
System uses:
Moderate
5.6. China National Culture – Second Case Company (CH2)
5.6.1. Contextual conditions at CH2
CH2 is a relatively new company, founded in 2008, which specialises in the
manufacture of berry-related products, such as confectionery and juices. Naturally
growing fruits such as blueberries, lingonberries, blackcurrants, raspberries, and
honeysuckle are collected, cleaned, infused with sugar, air-dried and inspected, and then
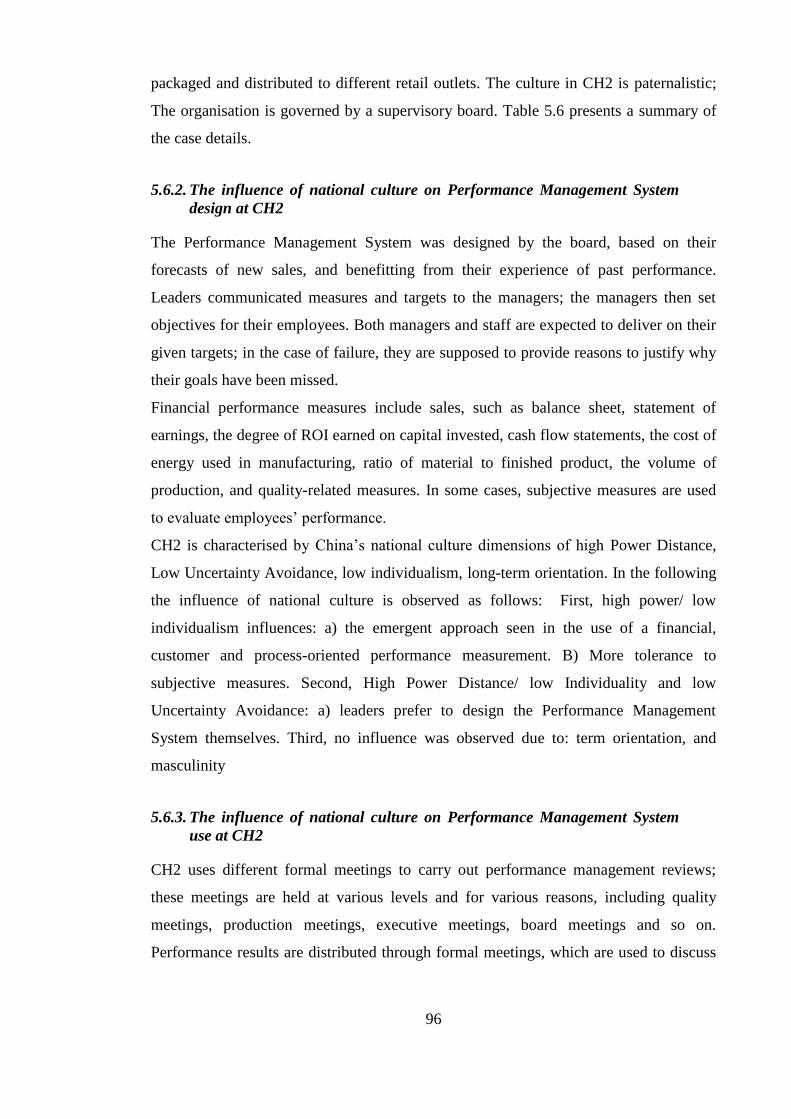
96
packaged and distributed to different retail outlets. The culture in CH2 is paternalistic;
The organisation is governed by a supervisory board. Table 5.6 presents a summary of
the case details.
5.6.2. The influence of national culture on Performance Management System
design at CH2
The Performance Management System was designed by the board, based on their
forecasts of new sales, and benefitting from their experience of past performance.
Leaders communicated measures and targets to the managers; the managers then set
objectives for their employees. Both managers and staff are expected to deliver on their
given targets; in the case of failure, they are supposed to provide reasons to justify why
their goals have been missed.
Financial performance measures include sales, such as balance sheet, statement of
earnings, the degree of ROI earned on capital invested, cash flow statements, the cost of
energy used in manufacturing, ratio of material to finished product, the volume of
production, and quality-related measures. In some cases, subjective measures are used
to evaluate employees’ performance.
CH2 is characterised by China’s national culture dimensions of high Power Distance,
Low Uncertainty Avoidance, low individualism, long-term orientation. In the following
the influence of national culture is observed as follows: First, high power/ low
individualism influences: a) the emergent approach seen in the use of a financial,
customer and process-oriented performance measurement. B) More tolerance to
subjective measures. Second, High Power Distance/ low Individuality and low
Uncertainty Avoidance: a) leaders prefer to design the Performance Management
System themselves. Third, no influence was observed due to: term orientation, and
masculinity
5.6.3. The influence of national culture on Performance Management System
use at CH2
CH2 uses different formal meetings to carry out performance management reviews;
these meetings are held at various levels and for various reasons, including quality
meetings, production meetings, executive meetings, board meetings and so on.
Performance results are distributed through formal meetings, which are used to discuss
97
and review performance results, featuring relaxed information sharing between different
departments.
“We released our annual profits and revenues or the staff (to see) at
the end of the year”. CH2 GM, interviews, 2013
The measures are used to focus employees, with top management at the centre of
decision-making regarding their use.
CH2 is characterised with China’s national culture dimensions of high Power Distance,
Low Uncertainty Avoidance, low individualism, long-term orientation. In the following
the influence of national culture is observed as follows: First, low Uncertainty
Avoidance and long-term orientation influence: a) the regular and systematic use of
performance reports. B) The open sharing of performance information and reports on all
levels. Second, High Power Distance/ low Individuality and low Uncertainty
Avoidance: a) the aim of performance measurement is for monitoring and control as
well as communications and attention focusing. Third, no influence was observed due to
masculinity and long-term orientation.
Table 5.6 Summary of CH2 Findings
Dimension Observations Comments
Context
Governed by a board that represents the
shareholders.
A paternalistic relationship exists between
management and employees.
CH2 is run by professional management aged
over 45
National culture
dimensions
PD: High
IDV: Low
UA: Low
MAS: High
TO: Long
Design of
Performance
Management
System
Targets are designed by leaders and
communicated from the top down.
Subjective measures are sometimes used.
Financial, operations, sales, purchase and
quality measures are used.
Technical maturity of
Performance Management
System design: Moderate
Cultural maturity of
Performance Management
System design: Low
Use
Daily, review of performance reports
Regular performance reviews are held at
different levels.
The aim of the PM is to communicate strategy
to employees and to allow managers to
control operations.
Technical maturity of
Performance Management
System uses: Moderate
Cultural maturity of PMS
uses: Moderate
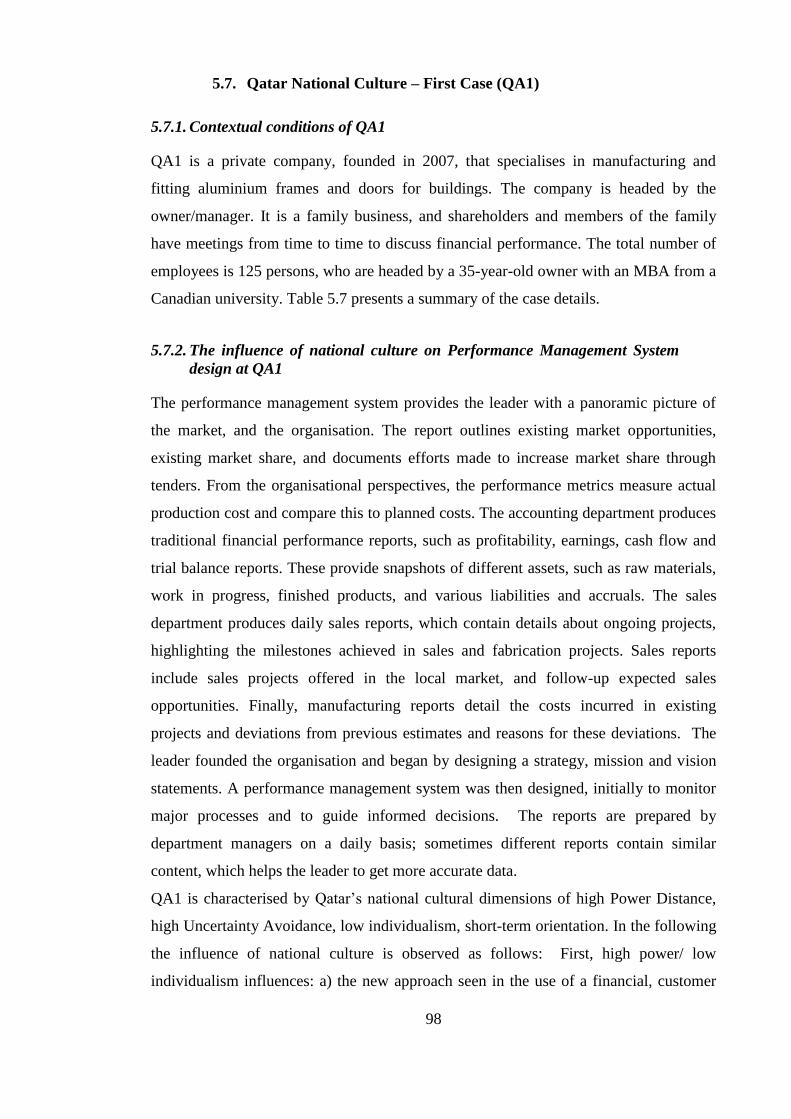
98
5.7. Qatar National Culture – First Case (QA1)
5.7.1. Contextual conditions of QA1
QA1 is a private company, founded in 2007, that specialises in manufacturing and
fitting aluminium frames and doors for buildings. The company is headed by the
owner/manager. It is a family business, and shareholders and members of the family
have meetings from time to time to discuss financial performance. The total number of
employees is 125 persons, who are headed by a 35-year-old owner with an MBA from a
Canadian university. Table 5.7 presents a summary of the case details.
5.7.2. The influence of national culture on Performance Management System
design at QA1
The performance management system provides the leader with a panoramic picture of
the market, and the organisation. The report outlines existing market opportunities,
existing market share, and documents efforts made to increase market share through
tenders. From the organisational perspectives, the performance metrics measure actual
production cost and compare this to planned costs. The accounting department produces
traditional financial performance reports, such as profitability, earnings, cash flow and
trial balance reports. These provide snapshots of different assets, such as raw materials,
work in progress, finished products, and various liabilities and accruals. The sales
department produces daily sales reports, which contain details about ongoing projects,
highlighting the milestones achieved in sales and fabrication projects. Sales reports
include sales projects offered in the local market, and follow-up expected sales
opportunities. Finally, manufacturing reports detail the costs incurred in existing
projects and deviations from previous estimates and reasons for these deviations. The
leader founded the organisation and began by designing a strategy, mission and vision
statements. A performance management system was then designed, initially to monitor
major processes and to guide informed decisions. The reports are prepared by
department managers on a daily basis; sometimes different reports contain similar
content, which helps the leader to get more accurate data.
QA1 is characterised by Qatar’s national cultural dimensions of high Power Distance,
high Uncertainty Avoidance, low individualism, short-term orientation. In the following
the influence of national culture is observed as follows: First, high power/ low
individualism influences: a) the new approach seen in the use of a financial, customer
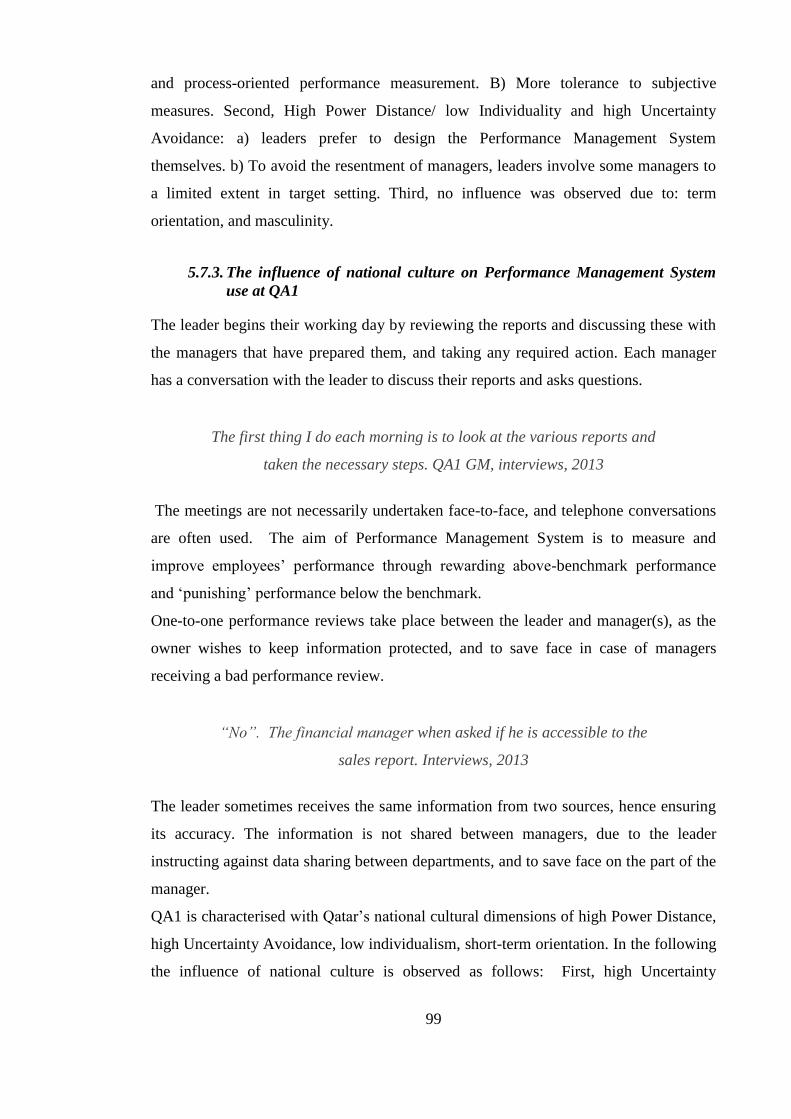
99
and process-oriented performance measurement. B) More tolerance to subjective
measures. Second, High Power Distance/ low Individuality and high Uncertainty
Avoidance: a) leaders prefer to design the Performance Management System
themselves. b) To avoid the resentment of managers, leaders involve some managers to
a limited extent in target setting. Third, no influence was observed due to: term
orientation, and masculinity.
5.7.3. The influence of national culture on Performance Management System
use at QA1
The leader begins their working day by reviewing the reports and discussing these with
the managers that have prepared them, and taking any required action. Each manager
has a conversation with the leader to discuss their reports and asks questions.
The first thing I do each morning is to look at the various reports and
taken the necessary steps. QA1 GM, interviews, 2013
The meetings are not necessarily undertaken face-to-face, and telephone conversations
are often used. The aim of Performance Management System is to measure and
improve employees’ performance through rewarding above-benchmark performance
and ‘punishing’ performance below the benchmark.
One-to-one performance reviews take place between the leader and manager(s), as the
owner wishes to keep information protected, and to save face in case of managers
receiving a bad performance review.
“No”. The financial manager when asked if he is accessible to the
sales report. Interviews, 2013
The leader sometimes receives the same information from two sources, hence ensuring
its accuracy. The information is not shared between managers, due to the leader
instructing against data sharing between departments, and to save face on the part of the
manager.
QA1 is characterised with Qatar’s national cultural dimensions of high Power Distance,
high Uncertainty Avoidance, low individualism, short-term orientation. In the following
the influence of national culture is observed as follows: First, high Uncertainty
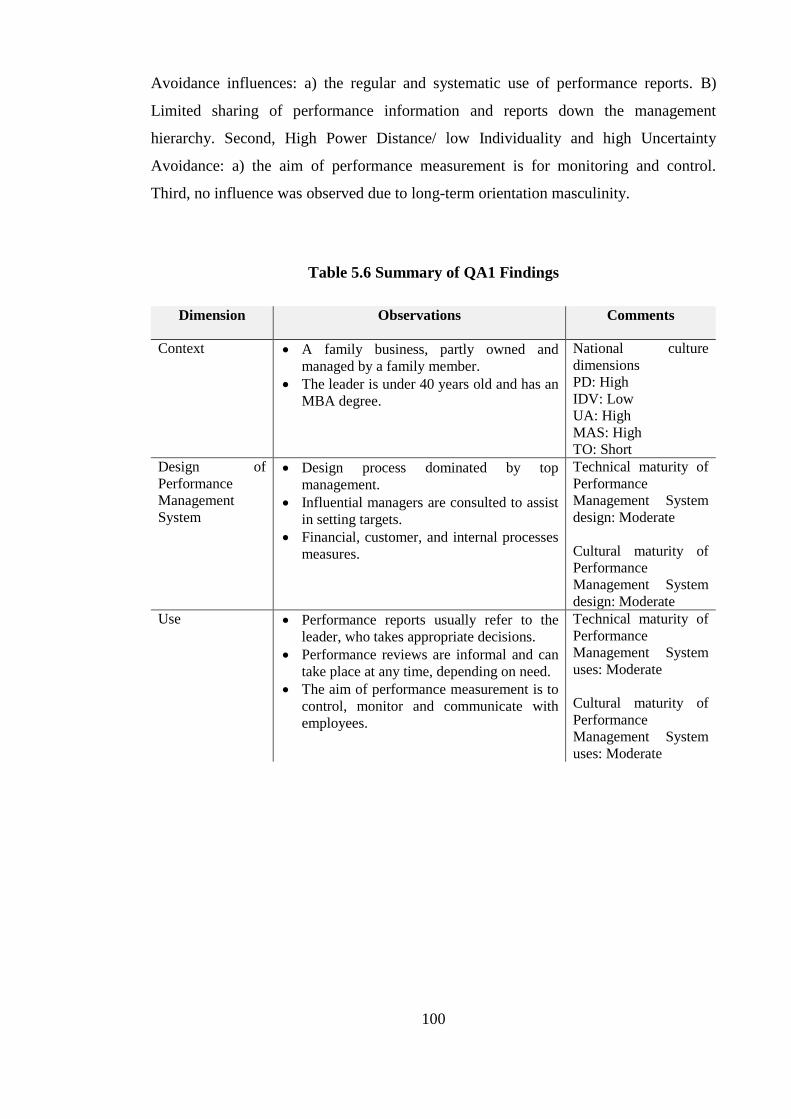
100
Avoidance influences: a) the regular and systematic use of performance reports. B)
Limited sharing of performance information and reports down the management
hierarchy. Second, High Power Distance/ low Individuality and high Uncertainty
Avoidance: a) the aim of performance measurement is for monitoring and control.
Third, no influence was observed due to long-term orientation masculinity.
Table 5.6 Summary of QA1 Findings
Dimension Observations Comments
Context A family business, partly owned and
managed by a family member.
The leader is under 40 years old and has an
MBA degree.
National culture
dimensions
PD: High
IDV: Low
UA: High
MAS: High
TO: Short
Design of
Performance
Management
System
Design process dominated by top
management.
Influential managers are consulted to assist
in setting targets.
Financial, customer, and internal processes
measures.
Technical maturity of
Performance
Management System
design: Moderate
Cultural maturity of
Performance
Management System
design: Moderate
Use Performance reports usually refer to the
leader, who takes appropriate decisions.
Performance reviews are informal and can
take place at any time, depending on need.
The aim of performance measurement is to
control, monitor and communicate with
employees.
Technical maturity of
Performance
Management System
uses: Moderate
Cultural maturity of
Performance
Management System
uses: Moderate
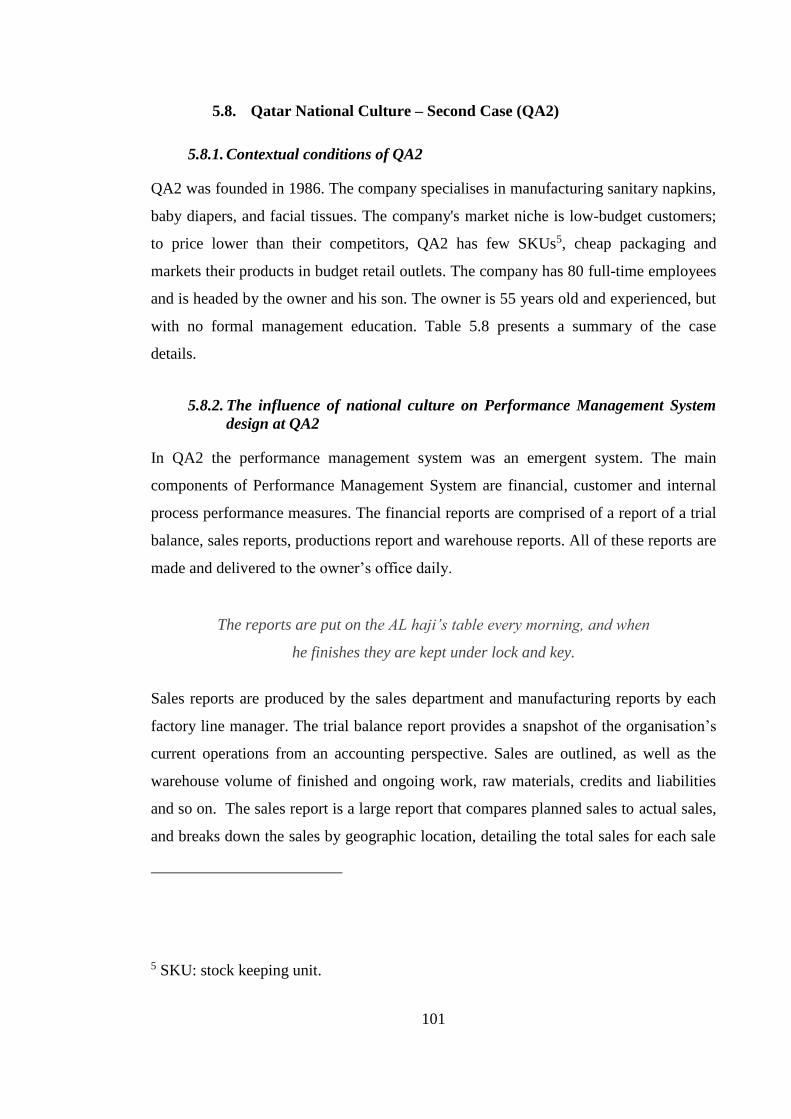
101
5.8. Qatar National Culture – Second Case (QA2)
5.8.1. Contextual conditions of QA2
QA2 was founded in 1986. The company specialises in manufacturing sanitary napkins,
baby diapers, and facial tissues. The company's market niche is low-budget customers;
to price lower than their competitors, QA2 has few SKUs5, cheap packaging and
markets their products in budget retail outlets. The company has 80 full-time employees
and is headed by the owner and his son. The owner is 55 years old and experienced, but
with no formal management education. Table 5.8 presents a summary of the case
details.
5.8.2. The influence of national culture on Performance Management System
design at QA2
In QA2 the performance management system was an emergent system. The main
components of Performance Management System are financial, customer and internal
process performance measures. The financial reports are comprised of a report of a trial
balance, sales reports, productions report and warehouse reports. All of these reports are
made and delivered to the owner’s office daily.
The reports are put on the AL haji’s table every morning, and when
he finishes they are kept under lock and key.
Sales reports are produced by the sales department and manufacturing reports by each
factory line manager. The trial balance report provides a snapshot of the organisation’s
current operations from an accounting perspective. Sales are outlined, as well as the
warehouse volume of finished and ongoing work, raw materials, credits and liabilities
and so on. The sales report is a large report that compares planned sales to actual sales,
and breaks down the sales by geographic location, detailing the total sales for each sale
5 SKU: stock keeping unit.
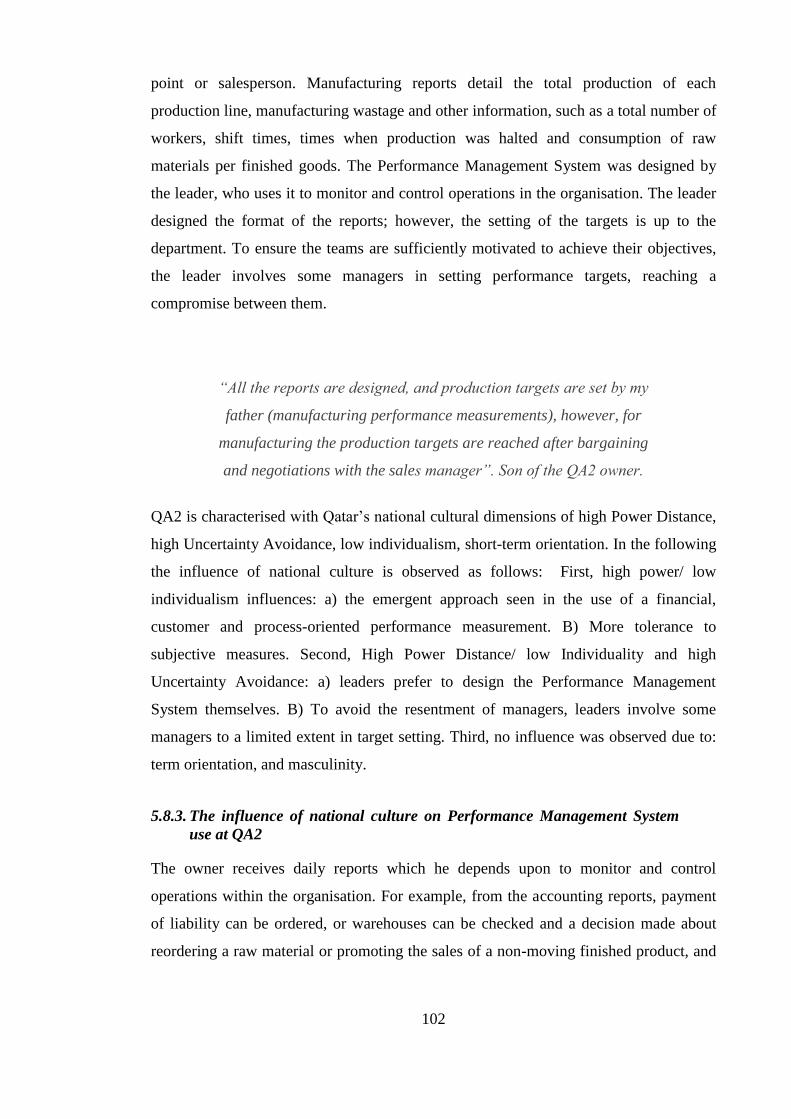
102
point or salesperson. Manufacturing reports detail the total production of each
production line, manufacturing wastage and other information, such as a total number of
workers, shift times, times when production was halted and consumption of raw
materials per finished goods. The Performance Management System was designed by
the leader, who uses it to monitor and control operations in the organisation. The leader
designed the format of the reports; however, the setting of the targets is up to the
department. To ensure the teams are sufficiently motivated to achieve their objectives,
the leader involves some managers in setting performance targets, reaching a
compromise between them.
“All the reports are designed, and production targets are set by my
father (manufacturing performance measurements), however, for
manufacturing the production targets are reached after bargaining
and negotiations with the sales manager”. Son of the QA2 owner.
QA2 is characterised with Qatar’s national cultural dimensions of high Power Distance,
high Uncertainty Avoidance, low individualism, short-term orientation. In the following
the influence of national culture is observed as follows: First, high power/ low
individualism influences: a) the emergent approach seen in the use of a financial,
customer and process-oriented performance measurement. B) More tolerance to
subjective measures. Second, High Power Distance/ low Individuality and high
Uncertainty Avoidance: a) leaders prefer to design the Performance Management
System themselves. B) To avoid the resentment of managers, leaders involve some
managers to a limited extent in target setting. Third, no influence was observed due to:
term orientation, and masculinity.
5.8.3. The influence of national culture on Performance Management System
use at QA2
The owner receives daily reports which he depends upon to monitor and control
operations within the organisation. For example, from the accounting reports, payment
of liability can be ordered, or warehouses can be checked and a decision made about
reordering a raw material or promoting the sales of a non-moving finished product, and
103
so on. The leader then contacts the person in charge, usually via phones or a short,
unplanned one-to-one meeting, and a decision is made.
Table 5.8 Summary of QA2 Findings
Dimension Observations Comments
Context
Single owner/manager.
QA2 is run by professional
management, over 45 years of age.
Emergent performance management
system.
National culture
dimensions
PD: High
IDV: Low
UA: High
MAS: High
TO: Short
Design of
Performance
Management
System
Designed by the leader.
Financial, operational, and sales
performance measures.
Resentment from some employees led
to their being inviting to consult on
setting the production targets.
Technical
maturity of
Performance
Management
System design:
Moderate
Cultural maturity
of Performance
Management
System design:
Moderate
Use
Informal daily performance reviews
One to one performance reviews.
Performance measurement reports are
not accessible to other employees.
The use of subjective sources of
information on performance targets
could result in disputes over
performance review results.
Technical
maturity of
Performance
Management
System uses: Low
Cultural maturity
of Performance
Management
System uses: Low
Typically, the role of the manager in charge is as a consultant, and the leader also
benefits from other reports that could be reporting on the same thing. This
‘triangulation’ motivates the managers who prepare performance reports to ensure that
they are accurate. In performance reviews, arguments sometimes occur because the
leaders have previously used subjective data sources to set production targets, which
some employees could perceive to be unacceptable, resulting in an argument in
performance measurement reviews.
104
QA2 is characterised with Qatar’s national cultural dimensions of high Power Distance,
high Uncertainty Avoidance, low individualism, short-term orientation. In the following
the influence of national culture is observed as follows: First, high Uncertainty
Avoidance influences: a) the regular and systematic use of performance reports. B)
Limited sharing of performance information and reports down the management
hierarchy. Second, High Power Distance/ low Individuality and high Uncertainty
Avoidance: a) the aim of performance measurement is for monitoring and control.
Third, no influence was observed due to long-term orientation masculinity.
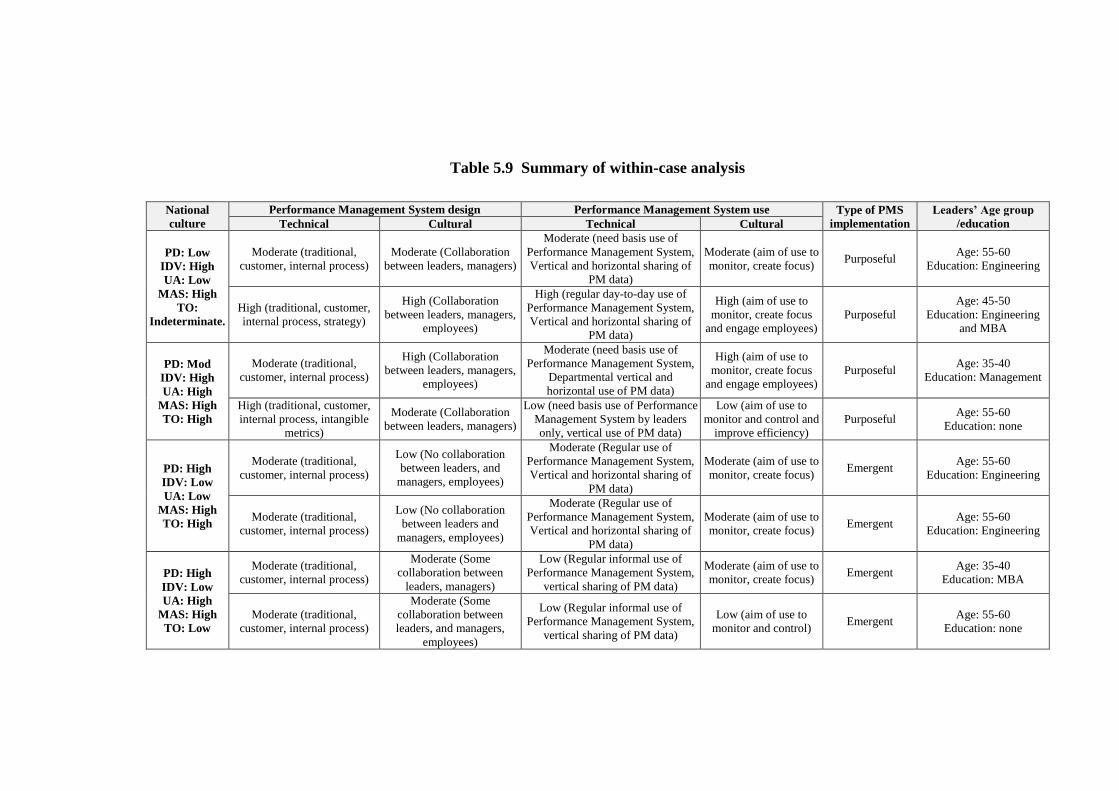
Table 5.9 Summary of within-case analysis
National
culture
Performance Management System design Performance Management System use Type of PMS
implementation
Leaders’ Age group
/education Technical Cultural Technical Cultural
PD: Low
IDV: High
UA: Low
MAS: High
TO:
Indeterminate.
Moderate (traditional,
customer, internal process)
Moderate (Collaboration
between leaders, managers)
Moderate (need basis use of
Performance Management System,
Vertical and horizontal sharing of
PM data)
Moderate (aim of use to
monitor, create focus) Purposeful
Age: 55-60
Education: Engineering
High (traditional, customer,
internal process, strategy)
High (Collaboration
between leaders, managers,
employees)
High (regular day-to-day use of
Performance Management System,
Vertical and horizontal sharing of
PM data)
High (aim of use to
monitor, create focus
and engage employees)
Purposeful
Age: 45-50
Education: Engineering
and MBA
PD: Mod
IDV: High
UA: High
MAS: High
TO: High
Moderate (traditional,
customer, internal process)
High (Collaboration
between leaders, managers,
employees)
Moderate (need basis use of
Performance Management System,
Departmental vertical and
horizontal use of PM data)
High (aim of use to
monitor, create focus
and engage employees)
Purposeful Age: 35-40
Education: Management
High (traditional, customer,
internal process, intangible
metrics)
Moderate (Collaboration
between leaders, managers)
Low (need basis use of Performance
Management System by leaders
only, vertical use of PM data)
Low (aim of use to
monitor and control and
improve efficiency)
Purposeful Age: 55-60
Education: none
PD: High
IDV: Low
UA: Low
MAS: High
TO: High
Moderate (traditional,
customer, internal process)
Low (No collaboration
between leaders, and
managers, employees)
Moderate (Regular use of
Performance Management System,
Vertical and horizontal sharing of
PM data)
Moderate (aim of use to
monitor, create focus) Emergent
Age: 55-60
Education: Engineering
Moderate (traditional,
customer, internal process)
Low (No collaboration
between leaders and
managers, employees)
Moderate (Regular use of
Performance Management System,
Vertical and horizontal sharing of
PM data)
Moderate (aim of use to
monitor, create focus) Emergent
Age: 55-60
Education: Engineering
PD: High
IDV: Low
UA: High
MAS: High
TO: Low
Moderate (traditional,
customer, internal process)
Moderate (Some
collaboration between
leaders, managers)
Low (Regular informal use of
Performance Management System,
vertical sharing of PM data)
Moderate (aim of use to
monitor, create focus) Emergent
Age: 35-40
Education: MBA
Moderate (traditional,
customer, internal process)
Moderate (Some
collaboration between
leaders, and managers,
employees)
Low (Regular informal use of
Performance Management System,
vertical sharing of PM data)
Low (aim of use to
monitor and control) Emergent
Age: 55-60
Education: none
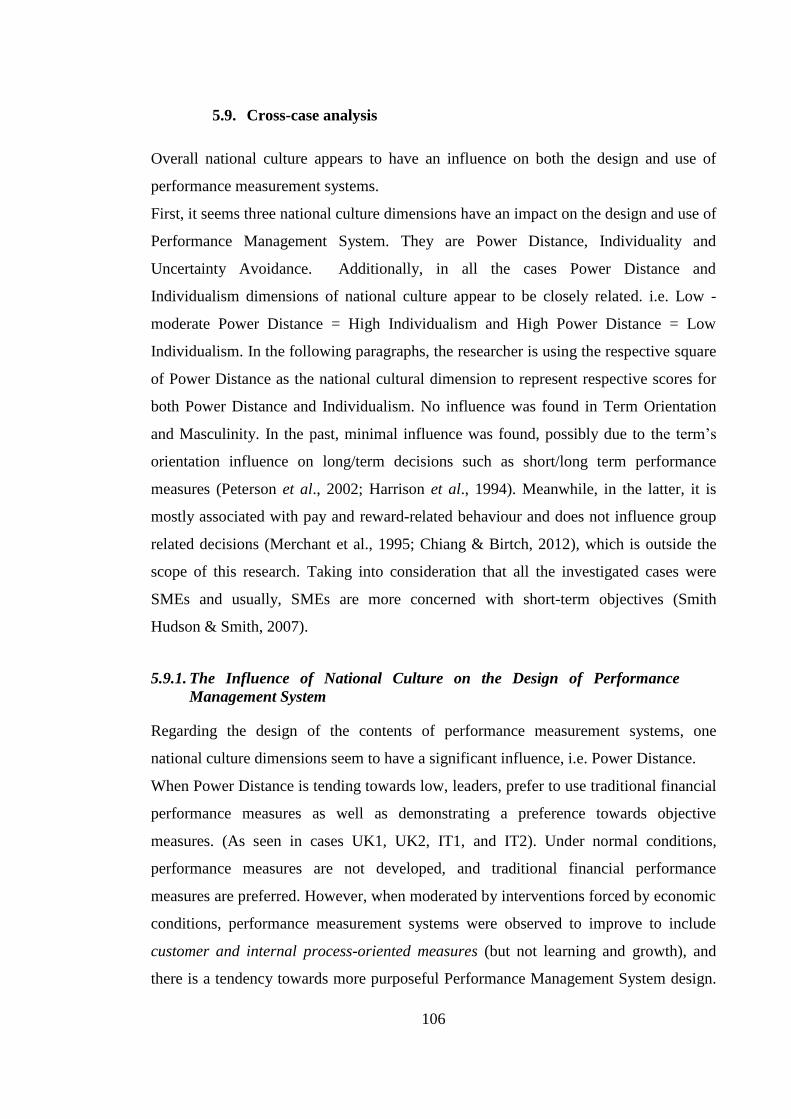
106
5.9. Cross-case analysis
Overall national culture appears to have an influence on both the design and use of
performance measurement systems.
First, it seems three national culture dimensions have an impact on the design and use of
Performance Management System. They are Power Distance, Individuality and
Uncertainty Avoidance. Additionally, in all the cases Power Distance and
Individualism dimensions of national culture appear to be closely related. i.e. Low -
moderate Power Distance = High Individualism and High Power Distance = Low
Individualism. In the following paragraphs, the researcher is using the respective square
of Power Distance as the national cultural dimension to represent respective scores for
both Power Distance and Individualism. No influence was found in Term Orientation
and Masculinity. In the past, minimal influence was found, possibly due to the term’s
orientation influence on long/term decisions such as short/long term performance
measures (Peterson et al., 2002; Harrison et al., 1994). Meanwhile, in the latter, it is
mostly associated with pay and reward-related behaviour and does not influence group
related decisions (Merchant et al., 1995; Chiang & Birtch, 2012), which is outside the
scope of this research. Taking into consideration that all the investigated cases were
SMEs and usually, SMEs are more concerned with short-term objectives (Smith
Hudson & Smith, 2007).
5.9.1. The Influence of National Culture on the Design of Performance
Management System
Regarding the design of the contents of performance measurement systems, one
national culture dimensions seem to have a significant influence, i.e. Power Distance.
When Power Distance is tending towards low, leaders, prefer to use traditional financial
performance measures as well as demonstrating a preference towards objective
measures. (As seen in cases UK1, UK2, IT1, and IT2). Under normal conditions,
performance measures are not developed, and traditional financial performance
measures are preferred. However, when moderated by interventions forced by economic
conditions, performance measurement systems were observed to improve to include
customer and internal process-oriented measures (but not learning and growth), and
there is a tendency towards more purposeful Performance Management System design.
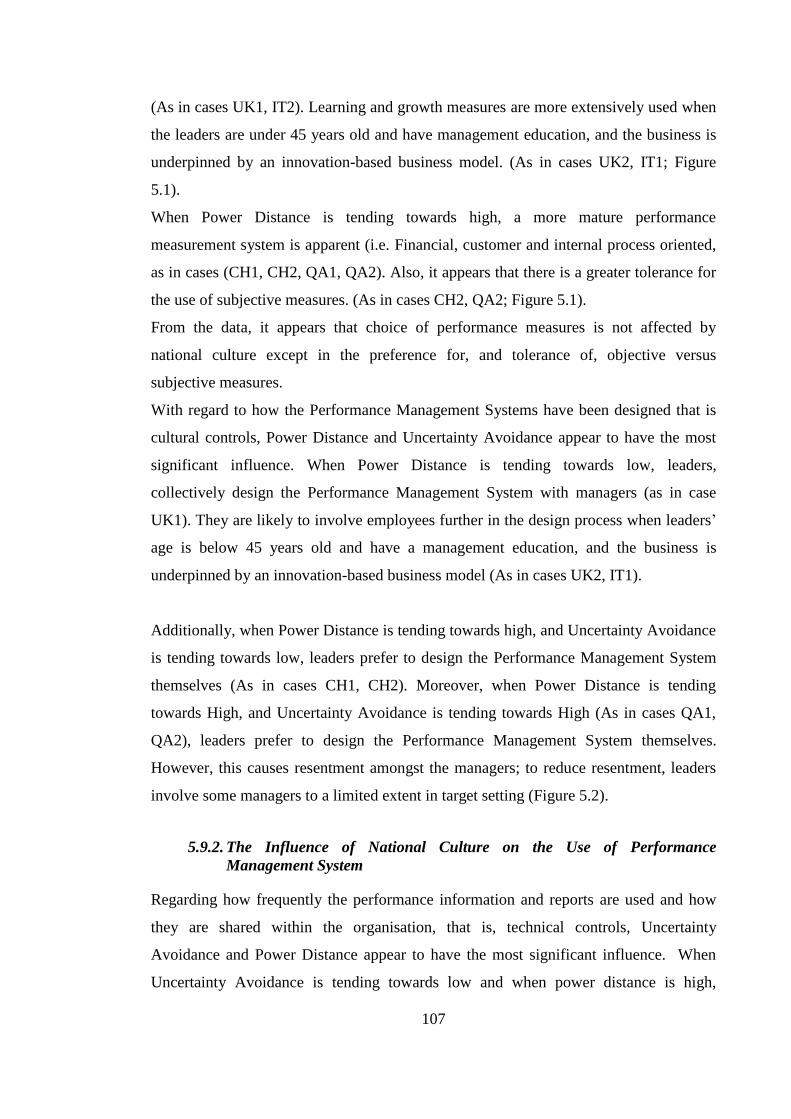
107
(As in cases UK1, IT2). Learning and growth measures are more extensively used when
the leaders are under 45 years old and have management education, and the business is
underpinned by an innovation-based business model. (As in cases UK2, IT1; Figure
5.1).
When Power Distance is tending towards high, a more mature performance
measurement system is apparent (i.e. Financial, customer and internal process oriented,
as in cases (CH1, CH2, QA1, QA2). Also, it appears that there is a greater tolerance for
the use of subjective measures. (As in cases CH2, QA2; Figure 5.1).
From the data, it appears that choice of performance measures is not affected by
national culture except in the preference for, and tolerance of, objective versus
subjective measures.
With regard to how the Performance Management Systems have been designed that is
cultural controls, Power Distance and Uncertainty Avoidance appear to have the most
significant influence. When Power Distance is tending towards low, leaders,
collectively design the Performance Management System with managers (as in case
UK1). They are likely to involve employees further in the design process when leaders’
age is below 45 years old and have a management education, and the business is
underpinned by an innovation-based business model (As in cases UK2, IT1).
Additionally, when Power Distance is tending towards high, and Uncertainty Avoidance
is tending towards low, leaders prefer to design the Performance Management System
themselves (As in cases CH1, CH2). Moreover, when Power Distance is tending
towards High, and Uncertainty Avoidance is tending towards High (As in cases QA1,
QA2), leaders prefer to design the Performance Management System themselves.
However, this causes resentment amongst the managers; to reduce resentment, leaders
involve some managers to a limited extent in target setting (Figure 5.2).
5.9.2. The Influence of National Culture on the Use of Performance
Management System
Regarding how frequently the performance information and reports are used and how
they are shared within the organisation, that is, technical controls, Uncertainty
Avoidance and Power Distance appear to have the most significant influence. When
Uncertainty Avoidance is tending towards low and when power distance is high,
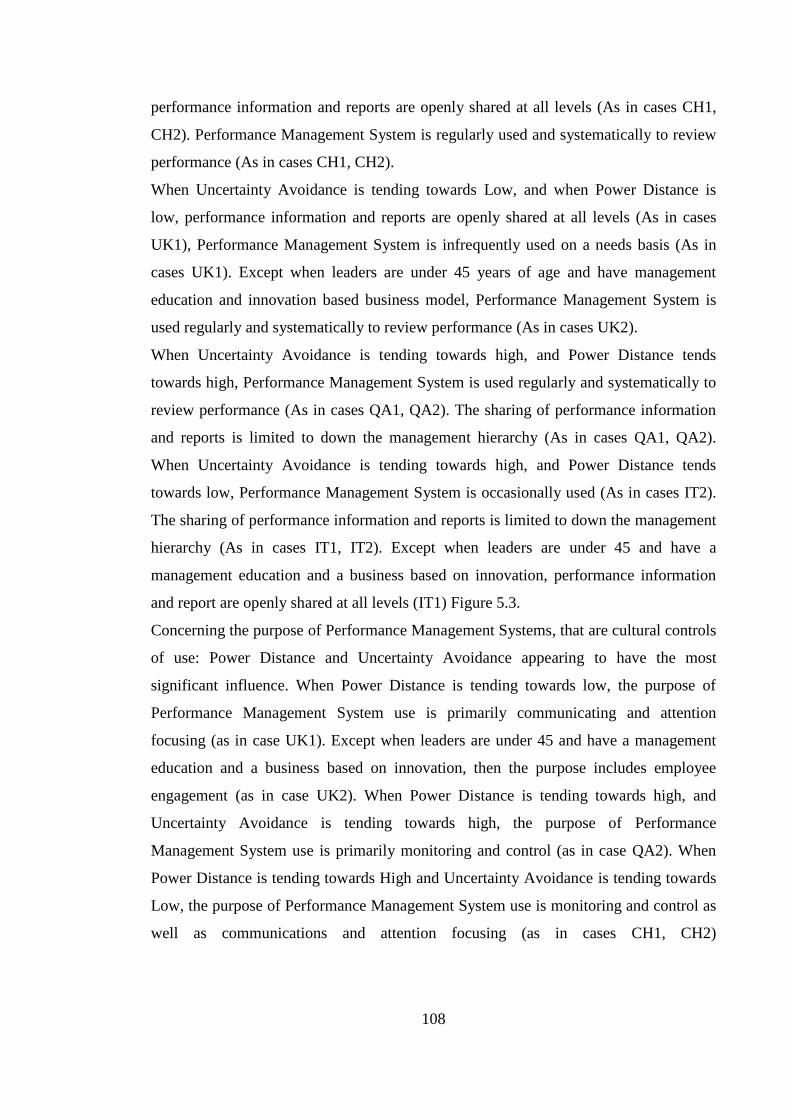
108
performance information and reports are openly shared at all levels (As in cases CH1,
CH2). Performance Management System is regularly used and systematically to review
performance (As in cases CH1, CH2).
When Uncertainty Avoidance is tending towards Low, and when Power Distance is
low, performance information and reports are openly shared at all levels (As in cases
UK1), Performance Management System is infrequently used on a needs basis (As in
cases UK1). Except when leaders are under 45 years of age and have management
education and innovation based business model, Performance Management System is
used regularly and systematically to review performance (As in cases UK2).
When Uncertainty Avoidance is tending towards high, and Power Distance tends
towards high, Performance Management System is used regularly and systematically to
review performance (As in cases QA1, QA2). The sharing of performance information
and reports is limited to down the management hierarchy (As in cases QA1, QA2).
When Uncertainty Avoidance is tending towards high, and Power Distance tends
towards low, Performance Management System is occasionally used (As in cases IT2).
The sharing of performance information and reports is limited to down the management
hierarchy (As in cases IT1, IT2). Except when leaders are under 45 and have a
management education and a business based on innovation, performance information
and report are openly shared at all levels (IT1) Figure 5.3.
Concerning the purpose of Performance Management Systems, that are cultural controls
of use: Power Distance and Uncertainty Avoidance appearing to have the most
significant influence. When Power Distance is tending towards low, the purpose of
Performance Management System use is primarily communicating and attention
focusing (as in case UK1). Except when leaders are under 45 and have a management
education and a business based on innovation, then the purpose includes employee
engagement (as in case UK2). When Power Distance is tending towards high, and
Uncertainty Avoidance is tending towards high, the purpose of Performance
Management System use is primarily monitoring and control (as in case QA2). When
Power Distance is tending towards High and Uncertainty Avoidance is tending towards
Low, the purpose of Performance Management System use is monitoring and control as
well as communications and attention focusing (as in cases CH1, CH2)
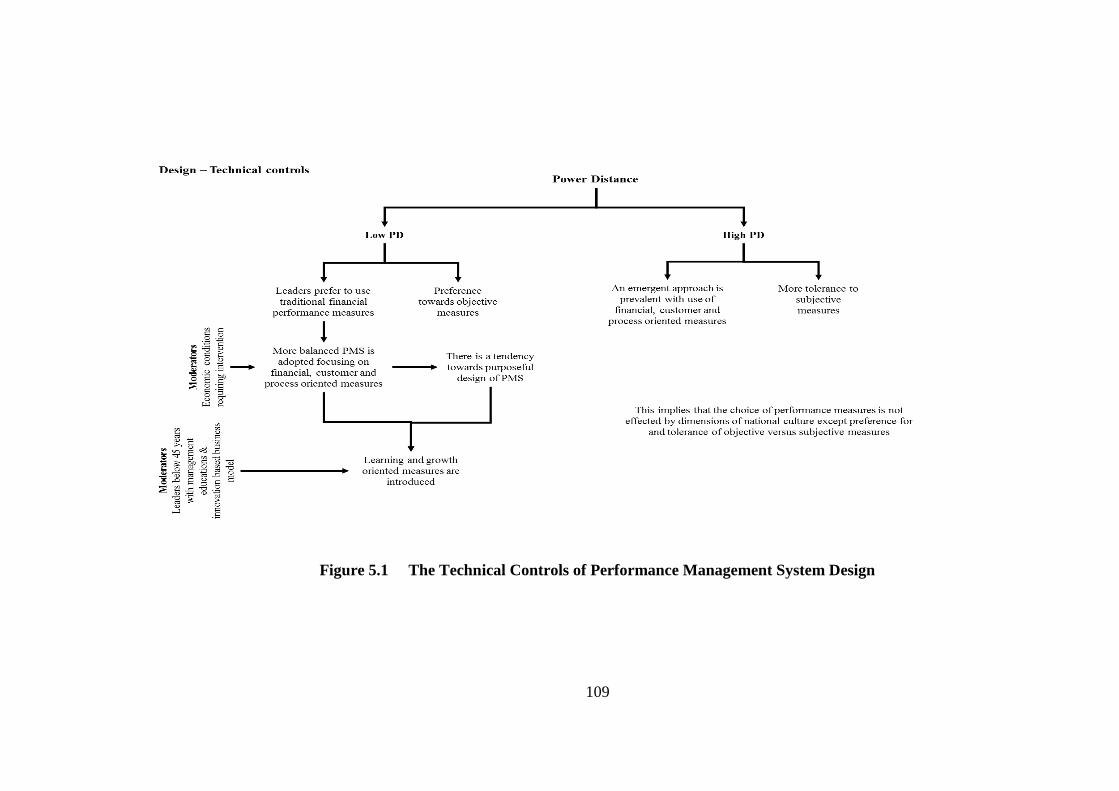
109
Figure 5.1 The Technical Controls of Performance Management System Design
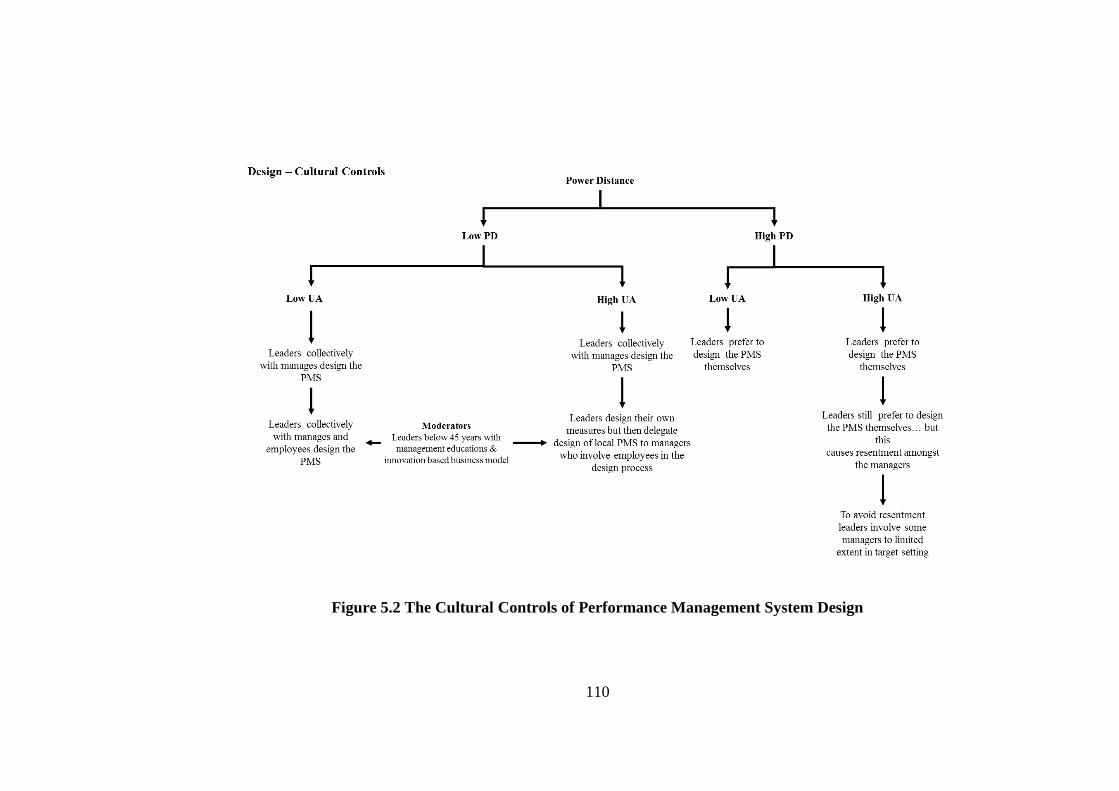
110
Figure 5.2 The Cultural Controls of Performance Management System Design
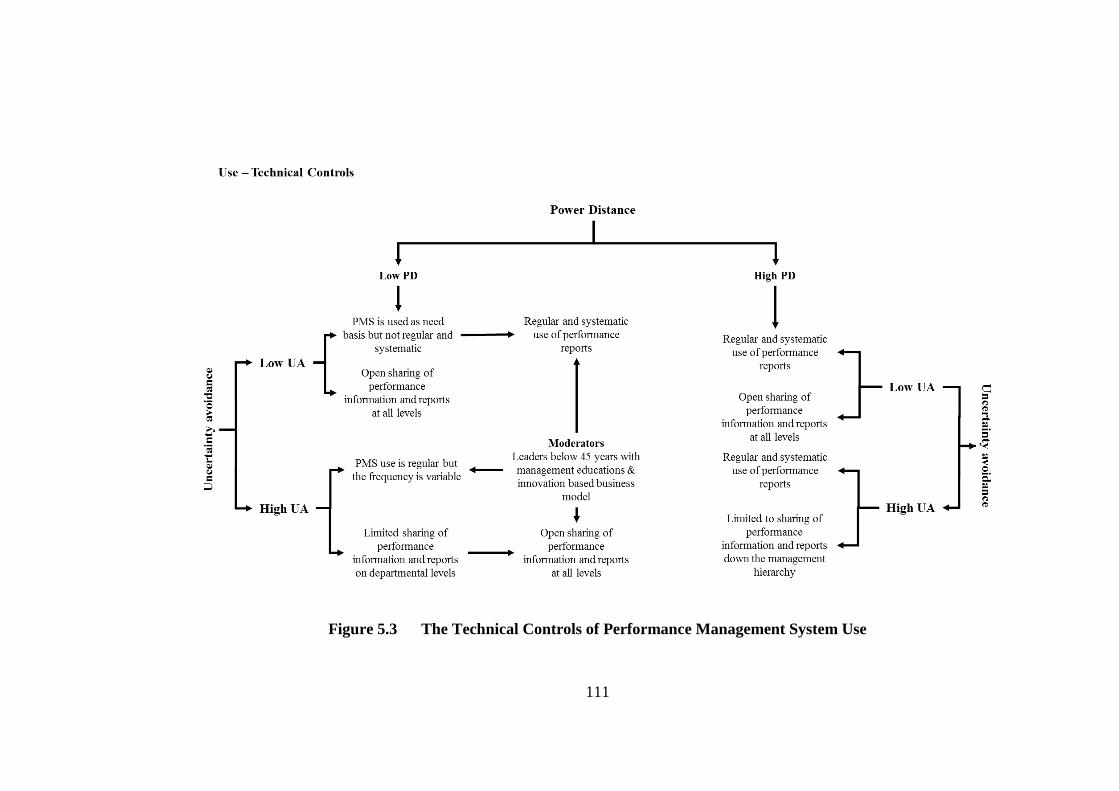
111
Figure 5.3 The Technical Controls of Performance Management System Use
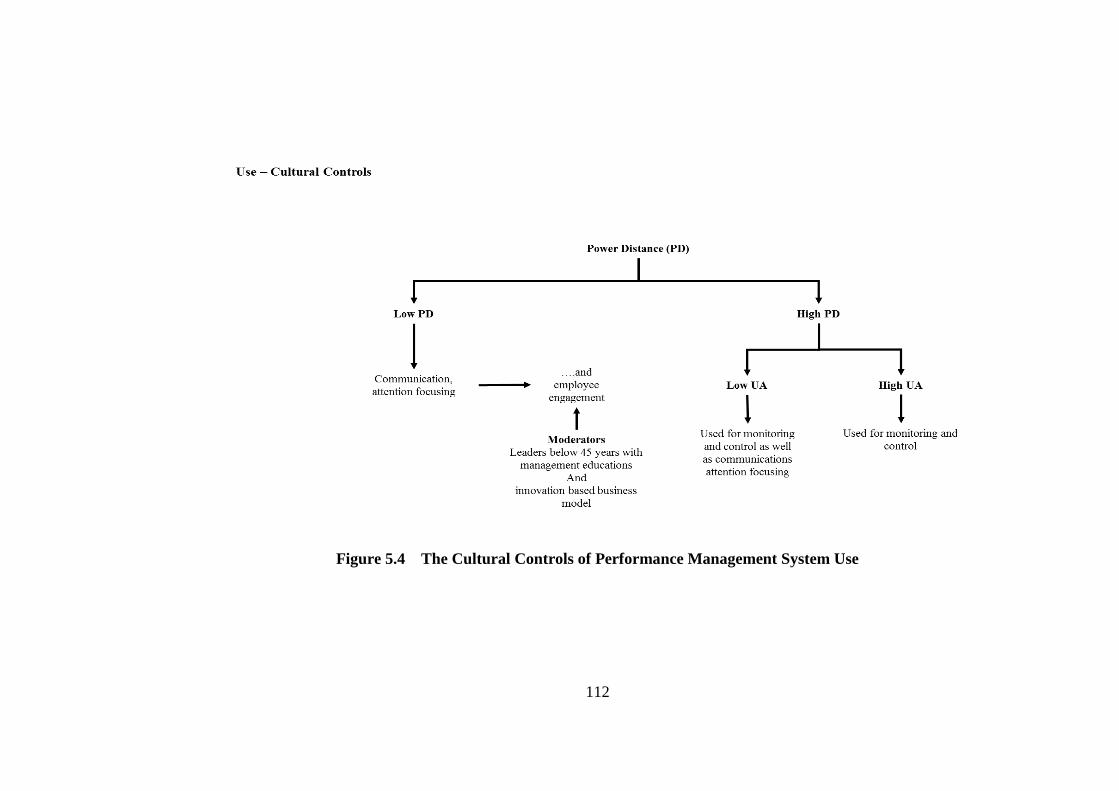
112
Figure 5.4 The Cultural Controls of Performance Management System Use
113
5.10. Summary of the Findings
In summarising these findings, the following propositions may be drawn:
5.10.1. Proposition 1 - When Power Distance is Low
1.1 Little importance is attached to performance measurement systems where the
use of traditional performance measures is preferred, and the measurement systems are
not developed and that more objective measures are preferred.
1.2 When any attempt is made to develop the Performance Management System, it
is developed collectively between the leaders and managers
1.3 PMS is primarily used for communication and attention focusing
1.4 Performance Management System use is not regular
5.10.2. Proposition 2 – When the Power Distance is High
2.1 A more mature Performance Management System emerges over time with
greater tolerance for subjective measures
2.2 Leaders prefer to design the Performance Management System themselves
2.3 Performance Management System is primarily used for monitoring and control
2.4 Performance Management System use is systematic and regular.
5.10.3. Proposition 3 – When Uncertainty Avoidance is Low
3.1 Performance information and report are openly shared
3.2 The levels of trust between leaders and managers is high. Consequently, the
design of Performance Management System is accepted, and Performance Management
System is used for communication and attention focusing
5.10.4. Proposition 4 – When Uncertainty Avoidance is High
4.1 Sharing of performance information and reports are limited to down the
management hierarchy.
4.2 The levels of trust between leaders and managers is lower. Consequently,
managers feel the need to get involved in the PMS design and use, though the PMS use
is limited to monitoring and control, though leaders’ use of PMS is limited to
monitoring and control.
114
Chapter 6 Discussion and Conclusion
The research question of this research is: how does National Culture impact on the
design and use of Performance Management Systems? Data was collected from eight
manufacturing SMEs case studies in four national cultures, and information was
gathered from semi-structured interviews, observations, discussion with experts, and
material provided and published by the investigated organisations. The analysis of the
findings suggest that national culture does influence the design and use of Performance
Management System, as shown in the previous chapter. Twenty-two research
propositions emerged, suggesting that Power Distance, Individualism and Uncertainty
Avoidance impact on Performance Management System design and use. The impact of
these dimensions can be described as follows:
The research findings confirmed that national culture dimensions of Power Distance
(PD) and Uncertainty Avoidance (UA) impact the design and use of Performance
Management Systems individually or combined. PD dimension impacts the degree of
Performance Management Systems’ adoption, the extent of collaboration in
Performance Management Systems’ design, the intended aim of Performance
Management Systems’ implementation, type of performance measures employed, and
the frequency of Performance Management Systems’ use. While UA dimension
influences information accessibility and collaboration pattern in PMS use. The research
also identified different moderators that affect the action of national culture dimensions
such as leaders’ age, and education and innovation based goods.
The research makes several contributions to the field of performance measurement:
Firstly, the study states the influence of single national culture dimensions on the
Performance Management Systems Design and Use in manufacturing SMEs. Secondly,
the study states the influence of combined national culture dimensions on the
Performance Management Systems Design and Use in manufacturing SME. Thirdly, the
study employed a novel theoretical framework which enables estimating differences
between PMS using the maturity of technical and cultural controls. Fourth, the study
employed a qualitative inductive, fine-grained case study method of research, unlike the
commonly used quantitative method. Fifthly, the study presented a four national
cultures comparison, contrary to the commonly two national cultures comparisons that
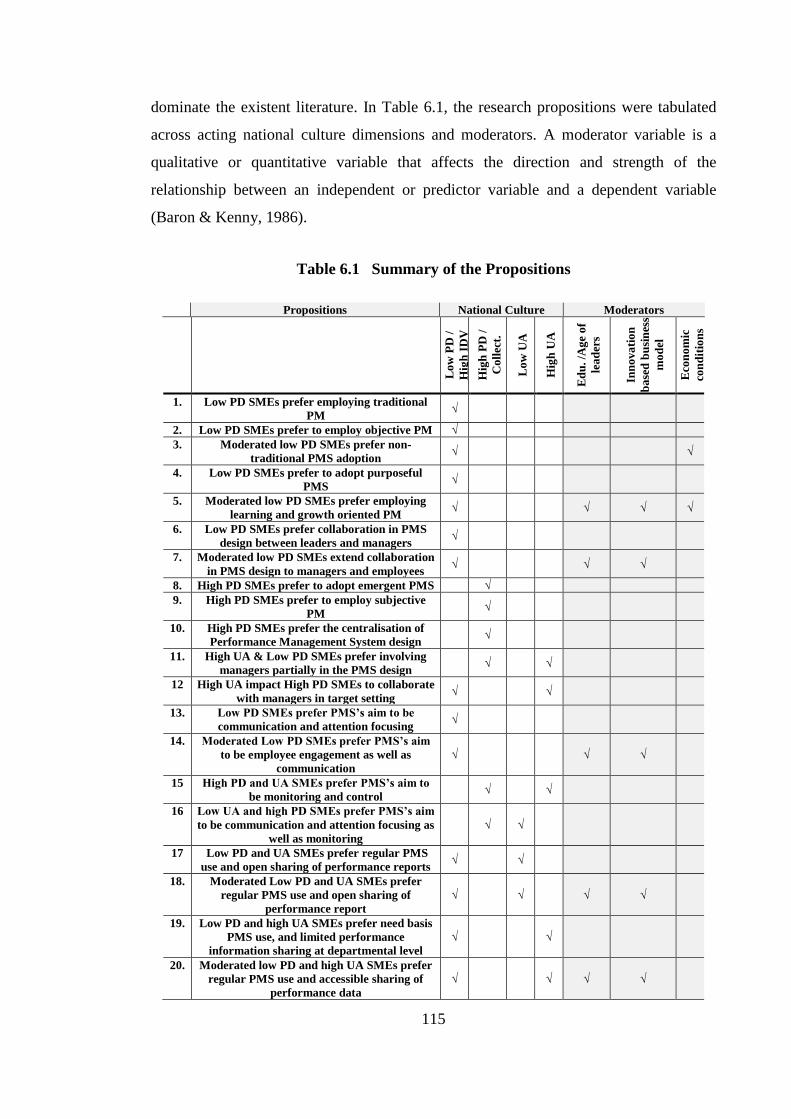
115
dominate the existent literature. In Table 6.1, the research propositions were tabulated
across acting national culture dimensions and moderators. A moderator variable is a
qualitative or quantitative variable that affects the direction and strength of the
relationship between an independent or predictor variable and a dependent variable
(Baron & Kenny, 1986).
Table 6.1 Summary of the Propositions
Propositions National Culture Moderators
Lo
w P
D /
Hig
h I
DV
Hig
h P
D /
Co
llec
t.
Lo
w U
A
Hig
h U
A
Ed
u.
/Ag
e o
f
lea
der
s
Inn
ova
tio
n
ba
sed
bu
sin
ess
mo
del
Eco
no
mic
con
dit
ion
s
1. Low PD SMEs prefer employing traditional
PM √
2. Low PD SMEs prefer to employ objective PM √
3. Moderated low PD SMEs prefer non-
traditional PMS adoption √ √
4. Low PD SMEs prefer to adopt purposeful
PMS √
5. Moderated low PD SMEs prefer employing
learning and growth oriented PM √ √ √ √
6. Low PD SMEs prefer collaboration in PMS
design between leaders and managers √
7. Moderated low PD SMEs extend collaboration
in PMS design to managers and employees √ √ √
8. High PD SMEs prefer to adopt emergent PMS √
9. High PD SMEs prefer to employ subjective
PM √
10. High PD SMEs prefer the centralisation of
Performance Management System design √
11. High UA & Low PD SMEs prefer involving
managers partially in the PMS design √ √
12 High UA impact High PD SMEs to collaborate
with managers in target setting √ √
13. Low PD SMEs prefer PMS’s aim to be
communication and attention focusing √
14. Moderated Low PD SMEs prefer PMS’s aim
to be employee engagement as well as
communication
√ √ √
15 High PD and UA SMEs prefer PMS’s aim to
be monitoring and control √ √
16 Low UA and high PD SMEs prefer PMS’s aim
to be communication and attention focusing as
well as monitoring
√ √
17 Low PD and UA SMEs prefer regular PMS
use and open sharing of performance reports √ √
18. Moderated Low PD and UA SMEs prefer
regular PMS use and open sharing of
performance report
√ √ √ √
19. Low PD and high UA SMEs prefer need basis
PMS use, and limited performance
information sharing at departmental level
√ √
20. Moderated low PD and high UA SMEs prefer
regular PMS use and accessible sharing of
performance data
√ √ √ √
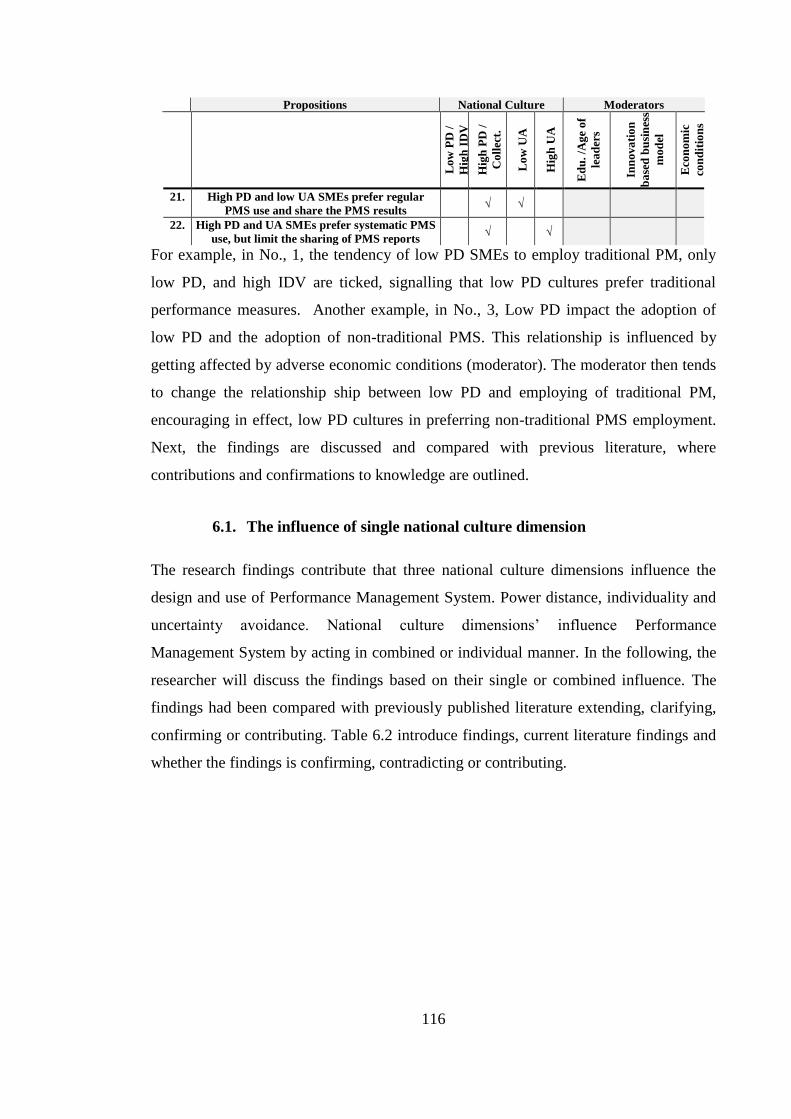
116
Propositions National Culture Moderators
Lo
w P
D /
Hig
h I
DV
Hig
h P
D /
Co
llec
t.
Lo
w U
A
Hig
h U
A
Ed
u.
/Ag
e o
f
lea
der
s
Inn
ova
tio
n
ba
sed
bu
sin
ess
mo
del
Eco
no
mic
con
dit
ion
s
21. High PD and low UA SMEs prefer regular
PMS use and share the PMS results √ √
22. High PD and UA SMEs prefer systematic PMS
use, but limit the sharing of PMS reports √ √
For example, in No., 1, the tendency of low PD SMEs to employ traditional PM, only
low PD, and high IDV are ticked, signalling that low PD cultures prefer traditional
performance measures. Another example, in No., 3, Low PD impact the adoption of
low PD and the adoption of non-traditional PMS. This relationship is influenced by
getting affected by adverse economic conditions (moderator). The moderator then tends
to change the relationship ship between low PD and employing of traditional PM,
encouraging in effect, low PD cultures in preferring non-traditional PMS employment.
Next, the findings are discussed and compared with previous literature, where
contributions and confirmations to knowledge are outlined.
6.1. The influence of single national culture dimension
The research findings contribute that three national culture dimensions influence the
design and use of Performance Management System. Power distance, individuality and
uncertainty avoidance. National culture dimensions’ influence Performance
Management System by acting in combined or individual manner. In the following, the
researcher will discuss the findings based on their single or combined influence. The
findings had been compared with previously published literature extending, clarifying,
confirming or contributing. Table 6.2 introduce findings, current literature findings and
whether the findings is confirming, contradicting or contributing.
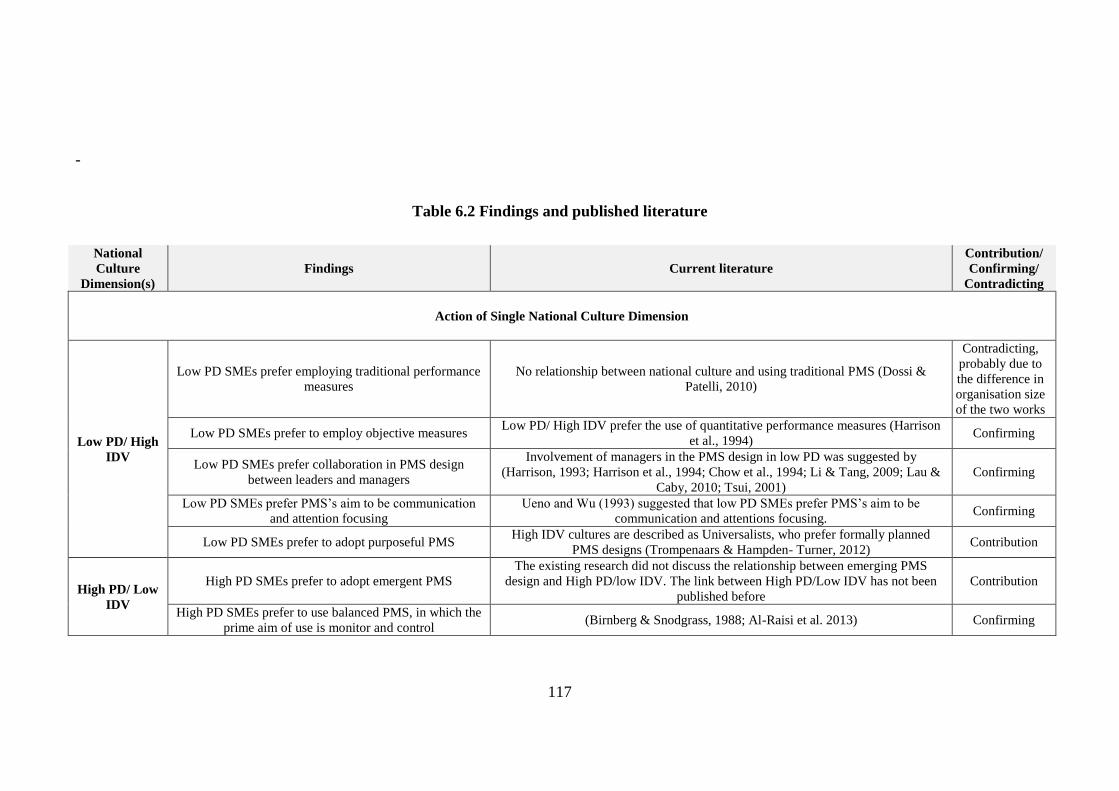
117
-
Table 6.2 Findings and published literature
National
Culture
Dimension(s)
Findings Current literature
Contribution/
Confirming/
Contradicting
Action of Single National Culture Dimension
Low PD/ High
IDV
Low PD SMEs prefer employing traditional performance
measures
No relationship between national culture and using traditional PMS (Dossi &
Patelli, 2010)
Contradicting,
probably due to
the difference in
organisation size
of the two works
Low PD SMEs prefer to employ objective measures Low PD/ High IDV prefer the use of quantitative performance measures (Harrison
et al., 1994) Confirming
Low PD SMEs prefer collaboration in PMS design
between leaders and managers
Involvement of managers in the PMS design in low PD was suggested by
(Harrison, 1993; Harrison et al., 1994; Chow et al., 1994; Li & Tang, 2009; Lau &
Caby, 2010; Tsui, 2001)
Confirming
Low PD SMEs prefer PMS’s aim to be communication
and attention focusing
Ueno and Wu (1993) suggested that low PD SMEs prefer PMS’s aim to be
communication and attentions focusing. Confirming
Low PD SMEs prefer to adopt purposeful PMS High IDV cultures are described as Universalists, who prefer formally planned
PMS designs (Trompenaars & Hampden- Turner, 2012) Contribution
High PD/ Low
IDV
High PD SMEs prefer to adopt emergent PMS
The existing research did not discuss the relationship between emerging PMS
design and High PD/low IDV. The link between High PD/Low IDV has not been
published before
Contribution
High PD SMEs prefer to use balanced PMS, in which the
prime aim of use is monitor and control (Birnberg & Snodgrass, 1988; Al-Raisi et al. 2013) Confirming
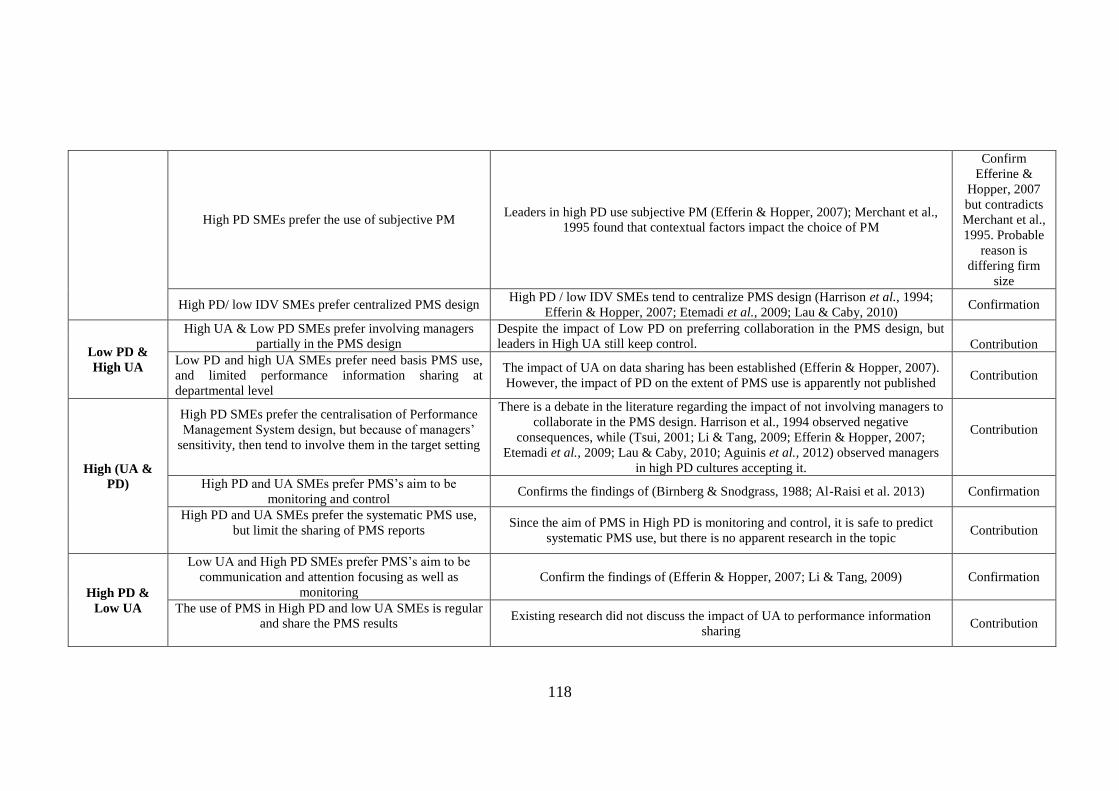
118
High PD SMEs prefer the use of subjective PM Leaders in high PD use subjective PM (Efferin & Hopper, 2007); Merchant et al.,
1995 found that contextual factors impact the choice of PM
Confirm
Efferine &
Hopper, 2007
but contradicts
Merchant et al.,
1995. Probable
reason is
differing firm
size
High PD/ low IDV SMEs prefer centralized PMS design High PD / low IDV SMEs tend to centralize PMS design (Harrison et al., 1994;
Efferin & Hopper, 2007; Etemadi et al., 2009; Lau & Caby, 2010) Confirmation
Low PD &
High UA
High UA & Low PD SMEs prefer involving managers
partially in the PMS design
Despite the impact of Low PD on preferring collaboration in the PMS design, but
leaders in High UA still keep control.
Contribution
Low PD and high UA SMEs prefer need basis PMS use,
and limited performance information sharing at
departmental level
The impact of UA on data sharing has been established (Efferin & Hopper, 2007).
However, the impact of PD on the extent of PMS use is apparently not published Contribution
High (UA &
PD)
High PD SMEs prefer the centralisation of Performance
Management System design, but because of managers’
sensitivity, then tend to involve them in the target setting
There is a debate in the literature regarding the impact of not involving managers to
collaborate in the PMS design. Harrison et al., 1994 observed negative
consequences, while (Tsui, 2001; Li & Tang, 2009; Efferin & Hopper, 2007;
Etemadi et al., 2009; Lau & Caby, 2010; Aguinis et al., 2012) observed managers
in high PD cultures accepting it.
Contribution
High PD and UA SMEs prefer PMS’s aim to be
monitoring and control Confirms the findings of (Birnberg & Snodgrass, 1988; Al-Raisi et al. 2013) Confirmation
High PD and UA SMEs prefer the systematic PMS use,
but limit the sharing of PMS reports
Since the aim of PMS in High PD is monitoring and control, it is safe to predict
systematic PMS use, but there is no apparent research in the topic Contribution
High PD &
Low UA
Low UA and High PD SMEs prefer PMS’s aim to be
communication and attention focusing as well as
monitoring
Confirm the findings of (Efferin & Hopper, 2007; Li & Tang, 2009) Confirmation
The use of PMS in High PD and low UA SMEs is regular
and share the PMS results
Existing research did not discuss the impact of UA to performance information
sharing Contribution
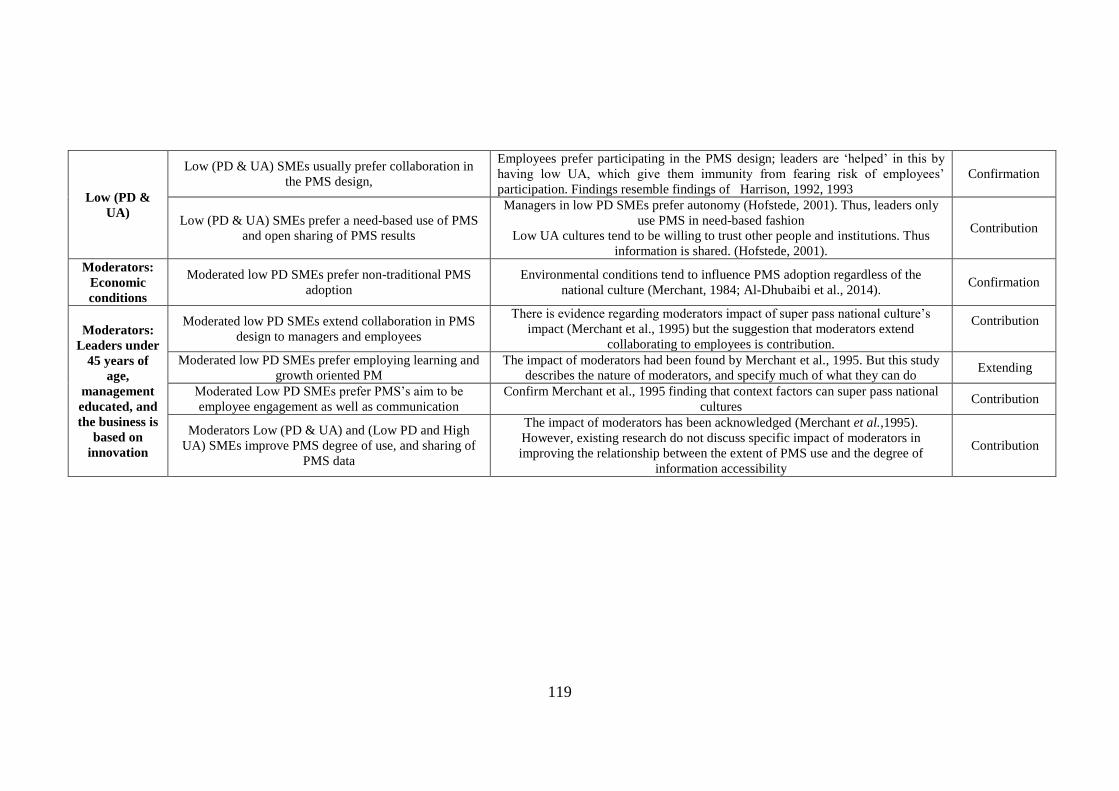
119
Low (PD &
UA)
Low (PD & UA) SMEs usually prefer collaboration in
the PMS design,
Employees prefer participating in the PMS design; leaders are ‘helped’ in this by
having low UA, which give them immunity from fearing risk of employees’
participation. Findings resemble findings of Harrison, 1992, 1993
Confirmation
Low (PD & UA) SMEs prefer a need-based use of PMS
and open sharing of PMS results
Managers in low PD SMEs prefer autonomy (Hofstede, 2001). Thus, leaders only
use PMS in need-based fashion
Low UA cultures tend to be willing to trust other people and institutions. Thus
information is shared. (Hofstede, 2001).
Contribution
Moderators:
Economic
conditions
Moderated low PD SMEs prefer non-traditional PMS
adoption
Environmental conditions tend to influence PMS adoption regardless of the
national culture (Merchant, 1984; Al-Dhubaibi et al., 2014). Confirmation
Moderators:
Leaders under
45 years of
age,
management
educated, and
the business is
based on
innovation
Moderated low PD SMEs extend collaboration in PMS
design to managers and employees
There is evidence regarding moderators impact of super pass national culture’s
impact (Merchant et al., 1995) but the suggestion that moderators extend
collaborating to employees is contribution.
Contribution
Moderated low PD SMEs prefer employing learning and
growth oriented PM
The impact of moderators had been found by Merchant et al., 1995. But this study
describes the nature of moderators, and specify much of what they can do Extending
Moderated Low PD SMEs prefer PMS’s aim to be
employee engagement as well as communication
Confirm Merchant et al., 1995 finding that context factors can super pass national
cultures Contribution
Moderators Low (PD & UA) and (Low PD and High
UA) SMEs improve PMS degree of use, and sharing of
PMS data
The impact of moderators has been acknowledged (Merchant et al.,1995).
However, existing research do not discuss specific impact of moderators in
improving the relationship between the extent of PMS use and the degree of
information accessibility
Contribution
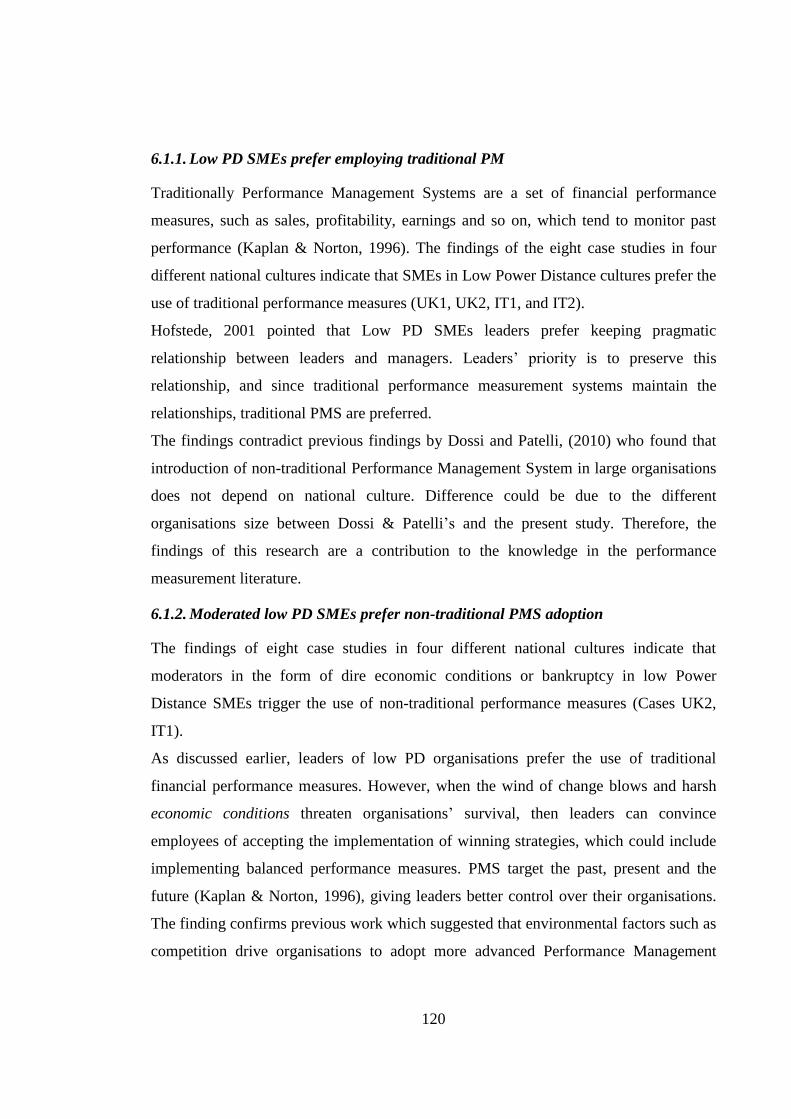
120
6.1.1. Low PD SMEs prefer employing traditional PM
Traditionally Performance Management Systems are a set of financial performance
measures, such as sales, profitability, earnings and so on, which tend to monitor past
performance (Kaplan & Norton, 1996). The findings of the eight case studies in four
different national cultures indicate that SMEs in Low Power Distance cultures prefer the
use of traditional performance measures (UK1, UK2, IT1, and IT2).
Hofstede, 2001 pointed that Low PD SMEs leaders prefer keeping pragmatic
relationship between leaders and managers. Leaders’ priority is to preserve this
relationship, and since traditional performance measurement systems maintain the
relationships, traditional PMS are preferred.
The findings contradict previous findings by Dossi and Patelli, (2010) who found that
introduction of non-traditional Performance Management System in large organisations
does not depend on national culture. Difference could be due to the different
organisations size between Dossi & Patelli’s and the present study. Therefore, the
findings of this research are a contribution to the knowledge in the performance
measurement literature.
6.1.2. Moderated low PD SMEs prefer non-traditional PMS adoption
The findings of eight case studies in four different national cultures indicate that
moderators in the form of dire economic conditions or bankruptcy in low Power
Distance SMEs trigger the use of non-traditional performance measures (Cases UK2,
IT1).
As discussed earlier, leaders of low PD organisations prefer the use of traditional
financial performance measures. However, when the wind of change blows and harsh
economic conditions threaten organisations’ survival, then leaders can convince
employees of accepting the implementation of winning strategies, which could include
implementing balanced performance measures. PMS target the past, present and the
future (Kaplan & Norton, 1996), giving leaders better control over their organisations.
The finding confirms previous work which suggested that environmental factors such as
competition drive organisations to adopt more advanced Performance Management
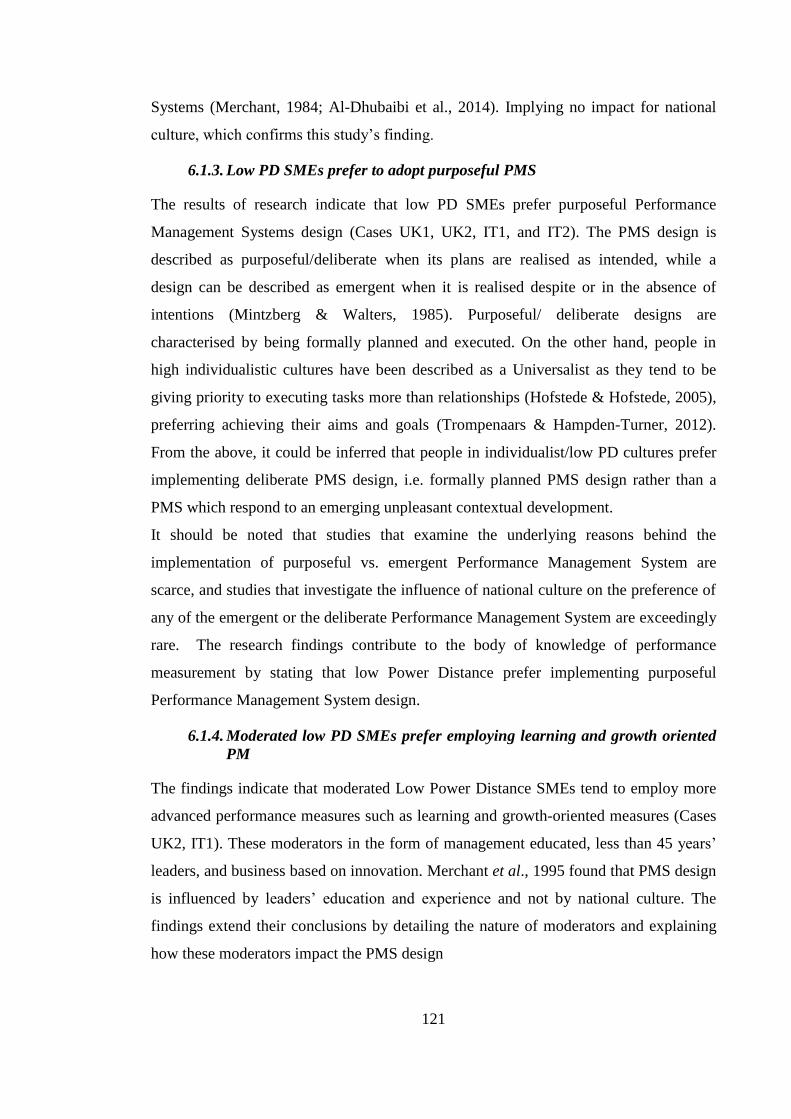
121
Systems (Merchant, 1984; Al-Dhubaibi et al., 2014). Implying no impact for national
culture, which confirms this study’s finding.
6.1.3. Low PD SMEs prefer to adopt purposeful PMS
The results of research indicate that low PD SMEs prefer purposeful Performance
Management Systems design (Cases UK1, UK2, IT1, and IT2). The PMS design is
described as purposeful/deliberate when its plans are realised as intended, while a
design can be described as emergent when it is realised despite or in the absence of
intentions (Mintzberg & Walters, 1985). Purposeful/ deliberate designs are
characterised by being formally planned and executed. On the other hand, people in
high individualistic cultures have been described as a Universalist as they tend to be
giving priority to executing tasks more than relationships (Hofstede & Hofstede, 2005),
preferring achieving their aims and goals (Trompenaars & Hampden-Turner, 2012).
From the above, it could be inferred that people in individualist/low PD cultures prefer
implementing deliberate PMS design, i.e. formally planned PMS design rather than a
PMS which respond to an emerging unpleasant contextual development.
It should be noted that studies that examine the underlying reasons behind the
implementation of purposeful vs. emergent Performance Management System are
scarce, and studies that investigate the influence of national culture on the preference of
any of the emergent or the deliberate Performance Management System are exceedingly
rare. The research findings contribute to the body of knowledge of performance
measurement by stating that low Power Distance prefer implementing purposeful
Performance Management System design.
6.1.4. Moderated low PD SMEs prefer employing learning and growth oriented
PM
The findings indicate that moderated Low Power Distance SMEs tend to employ more
advanced performance measures such as learning and growth-oriented measures (Cases
UK2, IT1). These moderators in the form of management educated, less than 45 years’
leaders, and business based on innovation. Merchant et al., 1995 found that PMS design
is influenced by leaders’ education and experience and not by national culture. The
findings extend their conclusions by detailing the nature of moderators and explaining
how these moderators impact the PMS design
122
6.1.5. Low PD SMEs prefer collaboration in PMS design between leaders and
managers
The findings indicate that low Power Distance culture SMEs prefer collaboration in
Performance Management System design between leaders and managers (cases UK1,
UK2, IT1, IT2). Leaders in Low Power Distance SMEs prefer ‘decentralised decision
structures and less concentration of authority’. They are usually ‘Democrats’, and rely
on support from managers and seek consultation from them, which leads to the
managers’ satisfaction and increased productivity. (Hofstede, 2001; p. 107). These
findings confirm results from (Harriosn, 1992; Harrison et al., 1994; Chow et al., 1994;
Li & Tang, 2009; Lau & Caby, 2010; Tsui, 2001).
6.1.6. Moderated low PD SMEs extend collaboration in PMS design to
managers and employees
The findings indicate that moderators have induced organisations to extend
collaboration in PMS design to managers and staff (Cases UK2, IT1). Moderators in
the form of management educated, less than 45 years’ leaders, and business based on
innovation. As in Section 6.1.4., the impact of context seems to surpass the impact of
national culture. In addition, extending collaboration to employees see to be the norm
when the aim of Performance Management System was employees’ engagement or
communication Ferreira & Otley, (2009). However, published literature regarding
research about the impact of national culture on the impact of moderators in low PD
seems to be scared. Therefore, the current findings which suggest that moderators such
as educated and under 45 years’ age leaders and businesses which based on innovation
tend to extend collaboration to include employees, is a contribution to the body of
knowledge.
6.1.7. High PD SMEs prefer to adopt emergent PMS
The research findings indicate that High PD/low IDV cultures prefer emergent
Performance Management Systems design (Cases CH1, CH2, QA1, and QA2).
Emerging design may be initiated for several reasons such as market shocks, or even
other unintended strategies. This could be explained by collectivist cultures who are
known for their particularism (Hofstede & Hofstede, 2005). Particularist cultures focus
on relationships and prefer informal networks to reach their aims and goals
123
(Trompenaars & Hampden-Turner, 2012), which is compatible with emergent
strategies.
It should be noted that studies that examine the underlying reasons behind the
implementation of purposeful vs. emergent Performance Management System are
scarce, and studies that investigate the influence of national culture on the preference of
any of emergent Performance Management Systems are exceedingly rare. The research
findings contribute to the body of knowledge by stating that collectivist cultures tend to
employ emergent design of Performance Management System, while individual cultures
tend to employ deliberate Performance Management System.
6.1.8. High PD SMEs prefer the centralisation of Performance Management
System design
The findings indicate that High Power Distance SMEs prefer to centralise the
Performance Management System design (cases CH1, CH2, QA1, and QA2).
Hierarchy in high Power Distance organisations is characterised by the inequality
between leaders and other members of staff. Employees obey and depend upon their
leaders. On the other hand, leaders consider centralization as a norm of life (Hofstede &
Hofstede, 2005). Subsequently, leaders in high PD cultures prefer Performance
Management System design to be centralised. The research confirms previous research
by (Harrison, 1992, Harrison et al., 1994; Efferin & Hopper, 2007; Etemadi et al., 2009;
Lau & Caby, 2010).
6.1.9. Low PD SMEs prefer PMS’s aim to be communication and attention
focusing
The findings indicate that low Power Distance cultures SMEs prefer PMS’s aim to be
communication. Thus, in the regularly held meetings, the performance information was
shared through different media and discussions were held to encourage their
participation. (Cases UK1, UK2, IT1, IT2).
The probable reason could be due to the influence of low PD cultures which tend to
provide space to motivate managers and employees and to promote equal rights and
enact harmony between leaders and managers (Hofstede, 2001). Thus, different types of
communication methods are needed to enhance and relate motivation between leaders,
managers and employees; Performance Management System provides the needed
platform to achieve communication between the different layers of management. As
124
several methods of reporting were observed to be used such as printed reports, face to
face meetings and visual methods.
The research findings confirm the results of Ueno and Wu (1993), which stated that
organisations in low PD cultures, prefer employing Performance Management System
with the aim of communication and attention focusing.
6.1.10. Moderated Low PD SMEs prefer PMS’s aim to be employee engagement
as well as communication
The findings indicate the influence of moderators on low Power Distance SMEs who
aim their PMS to include employee engagement as well as communication (Cases UK1,
IT1).
Naturally, in low PD SMEs, the PMS’s aim is communication and attention setting
(Section 6.1.9). Moderators in the form of management educated, aged less than 45
years’ leaders, and business based on innovation were observed to have extended
PMS’s aim to employee engagement. The findings extend Merchant et al., 1995
findings that PMS design is influenced by leaders’ education and experience and not by
national culture. Moderated Low PD SMEs engaged employees and extended
performance information design to them, as well as using learning and growth
measures; to develop employees and increase their performance.
6.1.11. Low PD SMEs prefer to employ objective PM
The findings indicate that leaders in low Power Distance and individualistic cultures
prefer the use of objective performance measures. They are quantifiable and verifiable
measures (Malina & Selto, 2004). They describe performance impartially, without
relying on a leader’s judgement. Since subordinates in low Power Distance value their
equality with their leaders (Hofstede, 2001), they prefer performance measures that
report results without interference from their leaders.
The findings confirm the results of Harrison et al. (1994) who state that low Power
Distance cultures prefer to employ objective performance measures.
6.1.12. High PD SMEs prefer to employ subjective PM
The findings indicate that leaders in high Power Distance/ collectivist cultures are
tolerant of subjective performance measures (cases CH1, CH2, QA1, and QA2).
125
Subjective performance measures are usually based on leaders’ judgement arising from
observing settings such as work attitude, interpersonal skills, communication and
motivation (Hartmann et al., 2010). Hofstede (1980) had suggested that managers and
employees in High Power Distance cultures are willing to accept leaders’ judgmental
evaluations. The findings confirm literature findings that leaders in high PD prefer to
use subjective measures (Efferin & Hopper, 2007), but contradict the results of
Merchant et al., 1995 who did not find a relationship between High power distance and
subjective performance measures but instead suggested that contextual factors play a far
more important role. A possible reason could be the difference in organisation’s size, as
Merchant et al., 1995 Empirical was performed on large organisations, while Efferin &
Hopper’s research was undertaken on an SME. Therefore, the findings support and
confirm Efferin & Hopper’s findings, as the findings were undertaken on SMEs.
6.2. The influence of combined national culture dimensions
This study contributes to the field by reporting the influence of combined national
cultural dimensions of the design and use of Performance Management Systems. In the
following several propositions on the effect of the combined influence of Power
Distance and Uncertainty Avoidance are reported.
6.2.1. High UA & Low PD SMEs prefer involving managers partially in the
PMS design
The findings indicate that low Power Distance SMEs invite managers to collaborate in
the Performance Management System design. However, collaboration in PMS design
differ depending on UA score. In low UA cultures, leaders are willing to collaborate
freely with managers. However, in high Uncertainty Avoidance cultures, the nature of
collaboration was observed to be different. In IT2, collaboration was extended to senior
executives, under the IT2 leaders supervision. While in IT1, PMS design was
decentralised, where various departments design their own Performance Management
Systems. Hofstede, (2001) observed that leaders in high UA prefer hierarchical control
(Hofstede, 2001). It seems that although in IT1 despite the absence of leaders from the
actual design process, the decentralised Performance Management System design
allowed them to the process indirectly.
It should be noted that studies that examine the influence of uncertain avoidance on
Performance Management System design are scarce. The research findings contribute
126
to the body of knowledge by clarifying the role of Uncertainty Avoidance in the
Performance Management System design.
It seems that PD is the dimension which is determining the behaviour and other national
culture dimensions moderate its impact.
6.2.2. High UA impact High PD SMEs to collaborate with managers in target
setting
Leaders in High PD SMEs prefer centralised Performance Management System design.
However, the response of managers to being not involved has been observed to differ
depending on UA score. In high UA cultures, managers resented their exclusion from
the Performance Management System design. Prompting leaders to invite some
influential managers for consultation in target setting (Cases QA1, QA2).
High PD cultures are characterised by the potential confrontation between leaders and
managers (Hofstede, 2001). The leaders’ sole control of the Performance Management
System design process in high PD cultures, tend to trigger managers’ pessimism and
mistrust, especially in a high Uncertainty Avoidance culture (Ibid). Thus, resulting in
resentment which affects the attitude and possibly the performance of managers. The
dynamic business environment motivates leaders to improve the situation by giving
some status to managers by inviting some of them to take part in target setting.
There is a debate in the literature regarding managers’ attitude when they are not
involved in the PMS design. Some authors found that excluding managers from
Performance Management System design negatively affected their attitude (Harrison et
al., 1994). While others concluded that excluding managers in high Power Distance
cultures from PMS design collaboration, resulted in little attitudinal impact, because
managers were accustomed to being excluded from Performance Management System
design (Tsui, 2001; Li & Tang, 2009; Efferin & Hopper, 2007; Etemadi et al., 2009;
Lau & Caby, 2010; Aguinis et al., 2012). The findings underscore the role of UA score
in high PD cultures which is a contribution.
127
6.2.3. High PD and UA SMEs prefer PMS’s aim to be monitoring and control
The findings indicate that leaders in high Power Distance and Uncertainty Avoidance
cultures prefer the objective of Performance Management System use to be monitoring
and control (Cases QA1, QA2).
The probable reason could be due to two reasons: the influence of high PD tends to
promote leaders to hold authoritarian values and to concentrate power in their hands.
Leaders keep critical decisions under control at the top of the hierarchy (Hofstede,
2001), thus relying on performance reports to monitor organisational activities. While
High UA culture tends to motivate leaders to be vigilant to reduce risks and uncertainty
by introducing more control (Hofstede, 2001). The research findings confirm the results
of (Birnberg & Snodgrass, 1988; Al-Raisi et al. 2013) who found that the main role of
Performance Management System in high Power Distance cultures is to control and
monitor performance.
6.2.4. Low UA and high PD SMEs prefer PMS’s aim to be communication and
attention focusing as well as monitoring
The findings indicate SMEs in High Power Distance and Low Uncertainty Avoidance
cultures prefer the Performance Management System’s aim to be communication and
attention focusing as well as monitoring and control (Cases CH1, CH2).
The probable reason could be due to two reasons: the influence of high PD which
promotes leaders to hold authoritarian values and concentrate power, and the influence
of Low UA culture which promotes managers’ tolerance and preference for lenient rules
as most people are trusted (Hofstede, 2001). Leaders in Low UA cultures tend to use
different support methods to encourage innovation (Ibid), and one of these support
methods is communication and drawing the attention of employees.
The research findings confirm previous findings (Efferin & Hopper, 2007; Li & Tang,
2009, p. 201) that observed that the Performance Management System aim in a Chinese
public organisation had been communicating and ‘influence decision making’ to the
body of knowledge by stating that leaders in low UA and high PD cultures prefer the
aim of measurement to be communication and attention focusing as well as monitoring
and control.
128
6.2.5. Low PD and UA SMEs prefer need-based use of PMS and open sharing
of PMS results
The findings indicate that low Power Distance and low Uncertainty Avoidance cultures
prefer the need-based use of PMS and open exchange of PMS results (Case UK1).
The probable reason could be due to two interacting dominant national culture
dimensions, i.e. low PD and UA. In Low Power Distance cultures, autonomy is
preferred unlike the norms in hierarchical organisations where leaders tend to control
decisions, and thus need a continuous stream of data to help in effective control
(Hofstede, 2001). Thus, low PD culture SMEs, monitoring does not have the same
priority as in hierarchical organisations, and hence the Performance Management
System use is need based.
In addition, leaders in low UA cultures have less regard for stability and permanence in
relationships, and would be willing to trust other people and institutions, and are
prepared to share Performance Management System results on all levels.
Studies that had investigated the influence of national culture on the degree of
Performance Management System use and degree of information sharing are
exceedingly rare. The research findings contribute to the body of knowledge by stating
that SMEs in low PD and UA cultures prefer the limited use of Performance
Management System and the open sharing of Performance Management System data
and reports.
6.2.6. Moderated Low PD and UA SMEs prefer regular PMS use and open
sharing of performance reports
The findings indicate that moderators influence Low Power Distance and Uncertainty
Avoidance cultures prefer the regular and systematic use of Performance Management
System with the open sharing of performance information and reports. Moderators in
the form of leaders under 45 years, who are qualified in the art of management, as well
as businesses which are based on innovation (Case UK2).
Studies that investigate the influence of moderators on low PD and UA, enhancing the
degree of use are extremely rare. The research findings contribute to the body of
performance measurement knowledge by stating that moderators in low PD and UA
cultures appear to be influencing the regular use of Performance Management System,
and the open sharing of Performance Management System data and reports.
129
6.2.7. Low PD and high UA SMEs prefer need basis PMS use, and limited
performance information sharing at departmental level
The findings indicate that SMEs in low Power Distance and high Uncertainty
Avoidance cultures prefer the variable use of Performance Management System and
tend to restrict the Performance Management System sharing of data and reports. The
probable reason could be due to two national culture dimensions, low PD and high UA
(Cases IT1, IT2).
Low Power Distance cultures prefer autonomy unlike hierarchical organisation, PMS
use is need-based, indicating that low PD SMEs prefer variable use of Performance
Management System, however, because high UA cultures have high regards to stability
and permanence in relationships, and would be unwilling to trust other people and
institutions easily, the sharing of performance results in departmental level is limited.
The findings regarding exchange of information being influenced by high UA had been
established by Efferin & Hopper, (2007), but the impact of PD on the extent of PMS use
is not apparently published.
The combined findings contribute to the body of knowledge.
6.2.8. Moderated low PD and high UA SMEs prefer regular PMS use and
accessible sharing of performance data
The findings indicate that moderators influence organisations in the low Power Distance
and low Uncertainty Avoidance cultures to prefer the use of Performance Management
System to be regular and systematic and the open sharing of performance information
and reports (Case UK2).
The findings of this research suggest that Low PD and High UA SMEs use
Performance Management System regularly unlike what is expected in low PD cultures
which use PMS in need basis. This is possible due to the action of moderators in the
form of management educated leaders who are under 45 years of age and innovation
oriented organisations. These findings confirm similar findings by Merchant et al.,
1995.
130
6.2.9. High PD and low UA SMEs prefer regular PMS use and share the PMS
results
The findings indicate that High Power Distance and Low Uncertainty Avoidance SMEs
prefer regular PMS and open sharing of performance information and reports (Cases
CH1, CH2).
The rationale behind such a choice is the impact of High Power Distance which prefers
centralization in decision-making, and thus need a continuous stream of knowledge.
Therefore, leaders in High PD has the use of Performance Management System in their
top priorities. Meanwhile, low UA culture has less regard to stability and permanence in
relationships and would be willing to trust other people and institutions. Thus, they do
not have an issue with information sharing.
Studies that investigate the influence of national culture on the degree of Performance
Management System use and degree of exchange of information are exceedingly rare.
The research findings contribute to the body of knowledge by stating that High PD and
Low UA SMEs appear to be influencing the regular use of Performance Management
System, and the open sharing of Performance Management System data and reports.
6.2.10. High PD and UA SMEs prefer systematic PMS use, but limit the sharing
of PMS reports
The findings indicate that High Power Distance and High Uncertainty Avoidance SMEs
prefer the regular use of Performance Management System but limited exchange of
performance information and reports (Cases QA1, QA2). The rationale behind such a
choice is the High-Power Distance impact which prefers centralization in decision-
making (Hofstede, 2001), and thus need a continuous stream of knowledge. Therefore,
leaders in great PD has the use of Performance Management System in their top
priorities. Meanwhile, High UA culture has high regard to stability and permanence in
relationships and would be less willing to trust other people and institutions (Hofstede,
2001). Thus, they restrict information sharing. This finding confirms the conclusion of
Efferin & Hopper, (2007) who observed that Chinese Business owners in Indonesia did
not share information with their managers due to trust issues.
Studies that investigate the influence of national culture on the degree of Performance
Management System use and degree of information sharing are exceedingly rare. The
research findings contribute to the body of knowledge by stating that high PD and UA
131
cultures appear to be influencing the regular use of Performance Management System,
and the restrictive sharing of Performance Management System data and reports.
6.3. Summary of the findings
6.3.1. How does National Culture impact on the Performance Management
System design?
The impact of Low PD culture
PD culture tends to induce the adoption of performance management system, as
low PD cultures, leaders prefer traditional Performance Management System,
while high PD prefer the use of balanced Performance Management Systems.
PD culture tends to induce the adoption of different performance management
system designs, as it is purposeful in Low PD cultures and emergent in high PD
cultures.
PD culture tends to influence the degree of collaboration of managers in the
Performance Management System Design. Great collaboration in Performance
Management System design is expected in Low PD, while low collaboration in
Performance Management System design is expected in High PD.
PD culture tends to induce the choice of type of Performance Measures
regarding their objectivity and subjectivity. It is objective performance measures
in low PD, while it is subjective performance measures in High PD.
The impact of UA
UA culture tends to influence the pattern of collaboration in Performance
Management System design, depending on the kind of the current score of PD.
Thus, moderate collaboration is expected in High UA cultures, while great
collaboration in Performance Management System design is expected in low UA
cultures.
The impact of moderators
Harsh economic contexts tend to increase the likelihood of balanced
Performance Management System adaptation in low PD cultures.
Leaders who are under 45 years of age and are management educated tend to
prefer employing learning and growth Performance Measure, in Low PD
cultures.
132
Leaders who are under 45 years of age and are management educated tend to
prefer extending the collaboration in Performance Management System design
to managers and employees, in low PD cultures.
6.3.2. How does National Culture impact on the use of Performance
Management System?
The impact of Low PD
PD culture tends to influence the choice of the Performance Management
System aim of use. Thus, in low PD culture, the aim of use is communication
and attention focusing while the objective of use in High PD is monitoring and
control.
PD culture tends to influence the frequency of Performance Management
System use, in low PD, the frequency of Performance Management System use
is need-based, while it is frequent in High PD.
The impact of UA
UA culture tends to influence the degree of information accessibility. In High
UA, the flow of information is restrictive, while it’s more accessible in low UA.
The impact of moderators
Leaders who are young and are management educated prefer the aim of
Performance Management System to be employee engagement as well as
communication in low PD cultures.
Leaders who are under 45 years of age and are management educated, prefer low
access to Performance Management System reports in Low PD and High UA
cultures.
Leaders who are under 45 years of age and are management educated prefer a
frequent degree of Performance Management System use in Low PD and UA
cultures.
6.4. Conclusion
Understanding the influence of national culture helps to identify and explain the
possible reaction of the Performance Management System users in different national
cultures, and contribute to provide appropriate mechanisms about the way Performance
133
Management System should be designed and used if applied in a different location from
where it has been designed. The present research highlights the influence of various
dimensions of national culture, which had been previously researched, but in
fragmented, incomplete and from a management accounting perspective. A summary of
the contributions, confirmation and extension, had been tabulated in Table 6.2. The
major contribution of this study is specifying single and combined influence of national
culture dimensions in addition to specifying influence oh by moderators.
6.4.1. Theoretical implications
The purpose of this thesis was to explore the influence of national culture on the PMS
design and use. Generally, the findings agree with researchers who supported the notion
that national culture has impact on performance measurement (such as Carmona et al.,
2011; Chow et al., 1999; de Waal, 2006 and others). However, the findings contribute
to knowledge by offering more details on how individual and combined national culture
dimensions impact the design and use of PMS and how national culture dimensions’
impact PMS implementation and how moderators can interfere with national culture
influence. In addition, the findings assume that moderators could be the explain the
failure of previous research works who concluded that national culture has insignificant
impact on Performance Management Systems.
In this section, first, the research contributions are presented, second, an explanation is
offered to contradictions with past literature will be explained. Third, contributions to
practice are presented, fourth, limitations of the research are presented and fifth will
suggest some ideas for future research.
The research Contributions
The research addressed a gap in literature regarding the need for understanding the
impact of national culture on the design and use of PMS. In this subsection,
contributions in the impact of power distance, uncertainty avoidance, PMS
implementation type, and the impact of moderators has been presented
Impact of Power Distance
Power distance had been found to impact the frequency of PMS use. In low PD cultures,
PMS use was observed as need-based, while in high PD, PMS use was observed as
134
regular. The disinterest from PMS use is surprising. Does it imply that top management
does not have the need to measurement? or does it imply that it was abandoned by top
management because of management resistance? Top management in low PD use PMS
for communication and attention focusing (from the findings). Thus, when the aim of
communication is achieved by other means, it is logical that top management limit their
PMS use. Probably, the stable nature of businesses, support the need bases approach
towards PMS use, especially in SMEs which are working in niche products and
services.
There is another reason for low frequency of PMS use when employees value their
autonomy in low PD cultures (Hofstede, 2001). They feel alienated when subjected to
PMS review scrutiny; then they resent top management’s interference in their
responsibilities, which force top management to limit the use of PMS a PMS only when
needed.
Now, when top management are compelled by economic crisis, and threatened
organisations’ existence, they change their attitude towards measurement, and they can
convince managers by accepting regular PMS use.
Impact of Uncertainty Avoidance
Low Uncertainty Avoidance SMEs had been observed to accommodate free access of
PMS data and performance reports. Information sharing could be due to the high trust
seen in Low UA cultures between top and middle management (Hofstede, 2001).
However, the present research findings were contradicted by Efferin & Hopper (2007),
and confirmed by Li & Tang, 2008. However, each one of the three-empirical works
had a unique contextual factor. They define the organisation size, location of the cases
study, either inside or outside the intended national culture. This research and Efferine’
s were SMEs, while Li & Tang, is large state-owned enterprise. This research and Li &
Tang, exist in mainland China, while Efferine’ s existed outside China. It seems from
the finding, that location of an organisation matters, for high UA cultures to exhibit
information sharing could also need to exist in its original geographic location.
The findings had observed that UA score influenced the centrality of PMS design
practices. PMS design in High PD is centralised (Harrison, 1992, 1993). However, in
High PD and UA, middle managers resented little involvement, and it seems that trust
135
was an issue. In addition, participation in PMS design boosted middle managers’
position in front of their employees. Thus, top management offered limited participation
to some managers in the form of consultation only. While top manager still retaining the
final say in their managers’ involvement, though the little participation was impactful in
regaining trust. While in low UA and high PD cultures, the relationship between top
management and other employees was based on trust, and staff trusted their employers
and were not involved in the PMS design.
National culture Impact on PMS implementation
The research suggests a relationship between Low PD/High IDV cultures and
purposeful PMS implementation. The relationship between low PD/high IDV and
universalist cultures was established by Hofstede, 2001; Universalist cultures place
great importance on rules, laws, values and regulations comes before relationships. The
findings are compatible with the universalist mentality, and it constitutes a contribution.
On the other hand, findings observed that in High PD/low IDV cultures, emergent PMS
implementation was observed. The relationship between High PD/low IDV and
Particularist cultures was established by Hofstede (ibid). Particularist cultures believe
the circumstances and relationship dictate rules and their responses change bases on
existing conditions and the identity of involved people. It seems that the findings are
contribution and appear to be compatible with Particularist mode of thinking.
Action of moderators
The impact of moderators had been established by Merchant et al., 1995. This study
describes the nature of positive moderators, and contribute to what moderators could
establish. Positive moderators because the observed moderates in the study were helpful
towards better implementation and use. They are economic situation, management and
learning age of leaders.
First, economic situation encouraged middle managers, and leaders in low PD to reduce
their resistance to measurement, and start proper use, and employ balanced PMS. That
is survival encouraged PMS implementation and use. Second, leadership when
management educated, and young that 45 years of age, was found to employ more High
maturity performance measures and aim performance measurement at increasing
employees’ engagement.
136
The actions of moderators stress that national culture is a major factor in PMS use and
design, but contextual factors could overtake national culture’s impact.
.
The research had found a moderating action of UA in limiting managers’ collaboration
in PMS design. It has been suggested that Low PD cultures preferring collaboration in
the PMS design (Harrison, 1992) but in the Italian cases, which have high UA scores,
and moderate PD score
The findings show that different factors influence the Performance Management System
design and use. First, is the national culture. The findings show that it has influence.
Power distance influences the adoption of (balanced/traditional) performance measures,
the choice of (collaboration/ centralization) in Performance Management System
design, the extent of Performance Management System use, the aim of Performance
Management System use (monitor and control/communicate), and the choice of
designing (purposeful/emergent) Performance Management System. Uncertainty
avoidance influences the degree of information accessibility, the extent of trust between
leaders and the rest of the staff. Individuality influences the leaders’ preference for
using subjective or objective measures. Additionally, a combination of uncertainty
avoidance and power distance influences the extent of Performance Management
System use and the degree of information accessibility and the attitude of non-
participating managers in high power distance cultures. The findings indicate that the
choice of performance measures does not usually depend on national culture, but on
commercial logic and convenience, except for the preference for objective/subjective
measures.
Second, contextual factors seem to influence would be a national culture’s impact. As
findings indicated that the effect of four moderators: education and age of leaders, the
degree to which the business is based on innovation, and economic conditions.
6.4.2. Contribution to Practice
Globalisation, deregulation, innovation, and high customer expectations have resulted in
strong competition, which means that organisations face challenges. These challenges
137
require them to expand and create synergies beyond their borders. The findings of the
present research suggest that national culture influences the design and use of
Performance Management System; thus, it is safe to conclude that the implications of
Western management practices should be studied, as they may require amendment
before they can be applied in non-western contexts. Expanding organisations need to
know the consequences of using their Performance Management System in new
cultures, as the findings clearly show that national culture influence the design and use
of Performance Management System. Leaders, investors, practitioners and others who
are planning to use their Performance Management System beyond their native origins,
should be aware that the notion that one size fits all is not applicable in performance
measurement, even Performance Management Systems which are designed within the
Western domain.
Leaders in high Power Distance cultures, play a fundamental role in motivating
individuals, enacting new strategies, and implementing Performance Management
System. They help to ensure employees understand the change process and should assist
in smooth implementation by communicating the influence of new changes, motivating
both managers and employees. Stakeholders should strive to enhance leaders’ capability
through education programs and training.
In high Uncertainty Avoidance cultures, managers and employees’ resistance to change
should be overcome by ensuring adequate support and training. The active participation
of leaders reduces uncertainty and frustration resulting from Performance Management
System implementation and reassures managers and employees. They should explain
ambiguous Performance Management Systems and supplement inadequate Performance
Management System information.
The research has shown that the influence of reduced collaboration on managers’
attitudes, in high Power Distance cultures depends on the Uncertainty Avoidance score.
Even when managers are invited to collaborate on cases which had a high uncertainty
avoidance score, the extent of participation was limited. Thus, the notion of importing
managerial practices should be treated with caution.
138
6.4.3. Limitations
The findings of this research are limited to the eight cases that have been studied, which
affects the issue of generalizability, as discussed before, though findings that support
the existing theory are more widely applicable. Meanwhile, these conclusions extend
existing theory are considered propositions that are plausible in the context of the bodies
of literature in which they are positioned but require further empirical validation.
Some cases such as Case UK1 we carried out based on one interview, but with the
support of rich discussion with learned experts about the organisation. The researcher is
satisfied that the combination of the single interview, external interview and the data
available about the organisation, has sufficiently provided the content necessary for the
case, though, still suggests that it would have been better to have more interviews. Thus,
it could be considered a minor flaw in the research.
The research design was aimed at reducing the influence of contextual factors such as
organisation size, occupational culture. However, other contextual factors could have
had some influence, such as the type of governance structure and leaders attributes in
terms of education, age, personality, leadership, gender, and political influences, the
state of the economy, the state of competition, local labour conditions and so on.
The research design was based on two cases from each national culture, from the
manufacturing sector. That said, the conclusions of this study can be generalised to
other sectors, though they cannot represent their cultures. Future studies could apply the
framework developed in this study and test its applicability in different contexts.
Finally, the researcher was unable to interview all of the managers who were involved
in the Performance Management System design and use, due to strains on access,
management time, and unavailability of translation services. For most parts, leaders and
managers in each organisation were interviewed as described in the research protocol;
therefore, the data collected can still be considered a valid reflection of the Performance
Management System design and use. Nevertheless, greater access, time and resources
could be helpful for further research.
The study has successfully addressed the research objective and provided the
appropriate analytical tools to answer further research questions, investigating the
influence of other types of culture: such as organisational and occupational cultures. In
this section, some topics for further research are suggested.
139
6.5. Future Research
First, future research should investigate the influence of other dimensions of national
culture that were not covered within the scope of existing research, such as masculinity,
and long/short term orientation, where the examined cases did not provide any support
for the further inquiry. Second, the existing research employed Hofstede’s framework of
national culture researcher, and it could be useful if future researchers employ other
national culture typologies such as House et al. (2004) and Trompenaars and Hampden-
Turner (2012). Third, as indicated in the limitations, not all the contextual factors have
been controlled. Thus it would be useful if future research could control additional
contextual factors such as labour market, legislation, governance and the influence of
occupational culture. Fourth, due to the use of qualitative methodology, future research
using a quantitative research would be a contribution. Fifth, future research should
investigate the influence of national culture on performance measurement and reward
and compensation, which could be helpful for expanding organisations.
6.6. Personal reflections
At the end of this thesis, it is fair to acknowledge the challenges faced during the course
of the journey both professionally and personally. The challenges were amplified by the
fact that I had joined academia from the operative field, which showed its toll on me
during the writing stage. The difficult task of adjusting to the demands of social science
research and scholarship was challenging, especially when the research subject required
extra attention because of its evasive and elusive characteristic.
However, my previous experience equipped me with the necessary motivation to dive
deep in the performance measurement arena because I knew the need of this knowledge
for the common good of people and organisations. Lack of objective criteria to measure
the performance of their organisations, plus the debate resulting from proponents and
opponents of implementing new management fads resulted in underestimating the
significance of performance measurement in organisations. Many countries who
happened to be not western are facing great crises, and there is a need to introduce to
them advanced managerial capabilities, which, if presented to them without being
adjusted for national culture could lead to an opposite effect. Thus, there is a need to
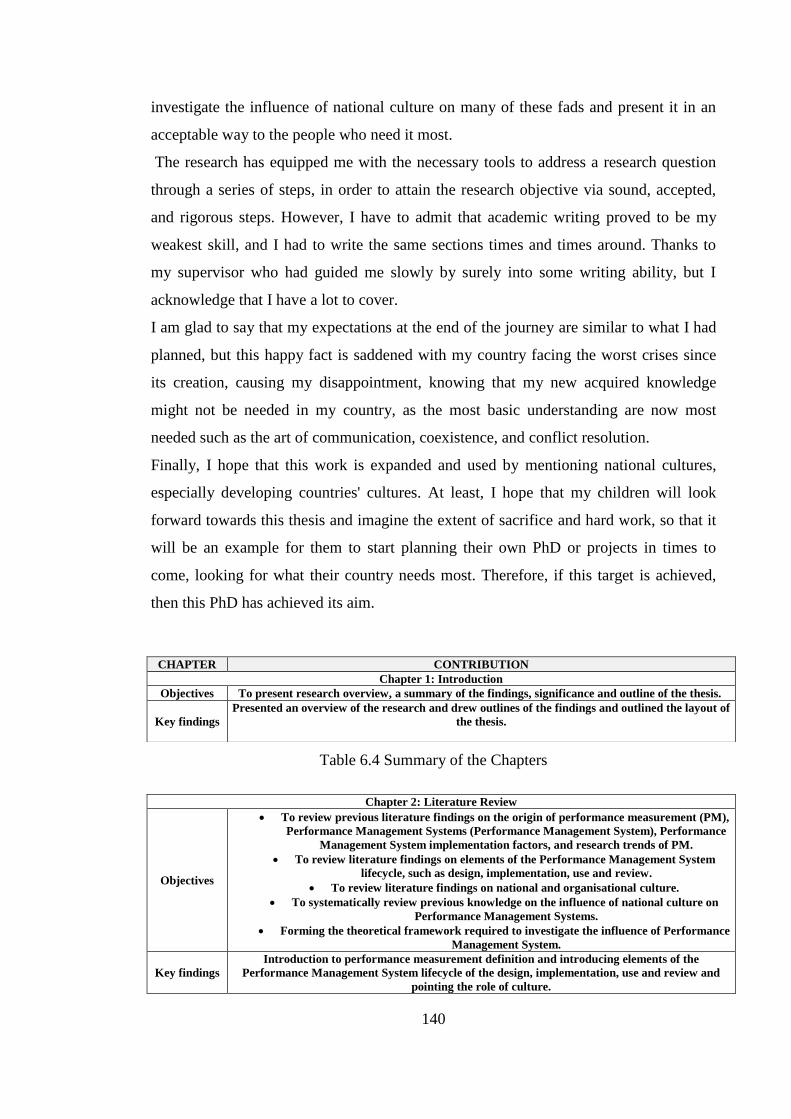
140
investigate the influence of national culture on many of these fads and present it in an
acceptable way to the people who need it most.
The research has equipped me with the necessary tools to address a research question
through a series of steps, in order to attain the research objective via sound, accepted,
and rigorous steps. However, I have to admit that academic writing proved to be my
weakest skill, and I had to write the same sections times and times around. Thanks to
my supervisor who had guided me slowly by surely into some writing ability, but I
acknowledge that I have a lot to cover.
I am glad to say that my expectations at the end of the journey are similar to what I had
planned, but this happy fact is saddened with my country facing the worst crises since
its creation, causing my disappointment, knowing that my new acquired knowledge
might not be needed in my country, as the most basic understanding are now most
needed such as the art of communication, coexistence, and conflict resolution.
Finally, I hope that this work is expanded and used by mentioning national cultures,
especially developing countries' cultures. At least, I hope that my children will look
forward towards this thesis and imagine the extent of sacrifice and hard work, so that it
will be an example for them to start planning their own PhD or projects in times to
come, looking for what their country needs most. Therefore, if this target is achieved,
then this PhD has achieved its aim.
Table 6.4 Summary of the Chapters
Chapter 2: Literature Review
Objectives
To review previous literature findings on the origin of performance measurement (PM),
Performance Management Systems (Performance Management System), Performance
Management System implementation factors, and research trends of PM.
To review literature findings on elements of the Performance Management System
lifecycle, such as design, implementation, use and review.
To review literature findings on national and organisational culture.
To systematically review previous knowledge on the influence of national culture on
Performance Management Systems.
Forming the theoretical framework required to investigate the influence of Performance
Management System.
Key findings
Introduction to performance measurement definition and introducing elements of the
Performance Management System lifecycle of the design, implementation, use and review and
pointing the role of culture.
CHAPTER CONTRIBUTION
Chapter 1: Introduction
Objectives To present research overview, a summary of the findings, significance and outline of the thesis.
Key findings
Presented an overview of the research and drew outlines of the findings and outlined the layout of
the thesis.
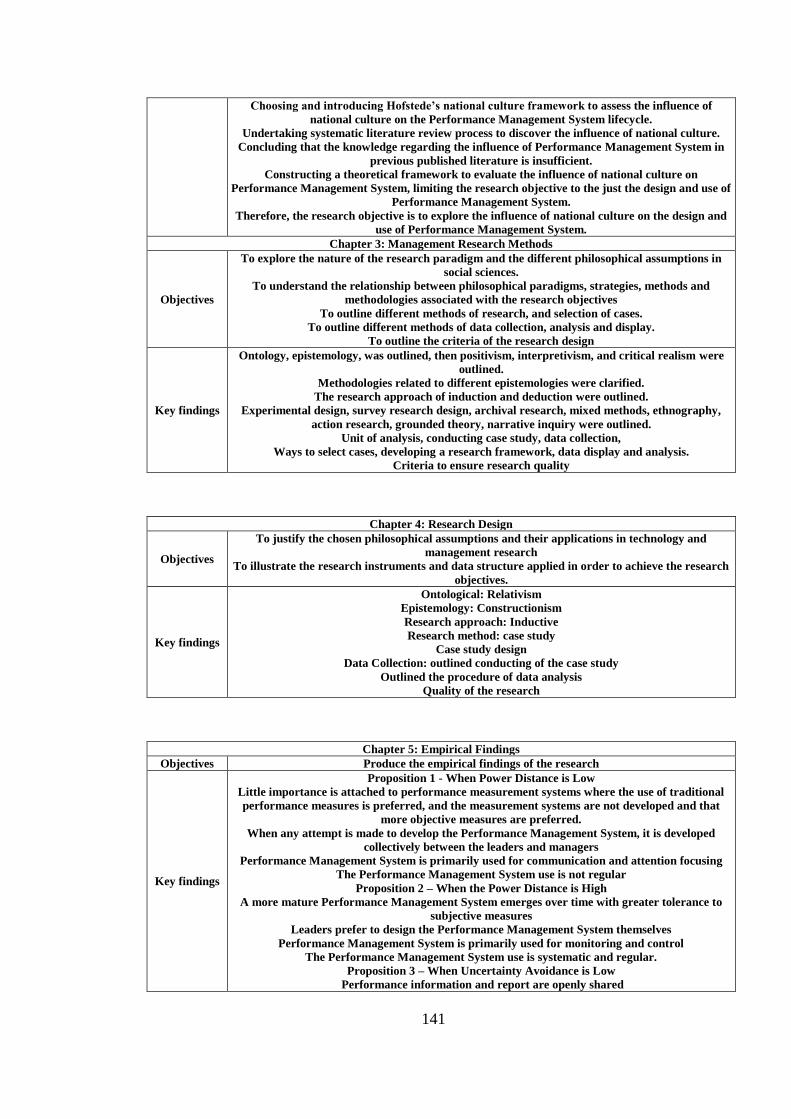
141
Choosing and introducing Hofstede’s national culture framework to assess the influence of
national culture on the Performance Management System lifecycle.
Undertaking systematic literature review process to discover the influence of national culture.
Concluding that the knowledge regarding the influence of Performance Management System in
previous published literature is insufficient.
Constructing a theoretical framework to evaluate the influence of national culture on
Performance Management System, limiting the research objective to the just the design and use of
Performance Management System.
Therefore, the research objective is to explore the influence of national culture on the design and
use of Performance Management System.
Chapter 3: Management Research Methods
Objectives
To explore the nature of the research paradigm and the different philosophical assumptions in
social sciences.
To understand the relationship between philosophical paradigms, strategies, methods and
methodologies associated with the research objectives
To outline different methods of research, and selection of cases.
To outline different methods of data collection, analysis and display.
To outline the criteria of the research design
Key findings
Ontology, epistemology, was outlined, then positivism, interpretivism, and critical realism were
outlined.
Methodologies related to different epistemologies were clarified.
The research approach of induction and deduction were outlined.
Experimental design, survey research design, archival research, mixed methods, ethnography,
action research, grounded theory, narrative inquiry were outlined.
Unit of analysis, conducting case study, data collection,
Ways to select cases, developing a research framework, data display and analysis.
Criteria to ensure research quality
Chapter 4: Research Design
Objectives
To justify the chosen philosophical assumptions and their applications in technology and
management research
To illustrate the research instruments and data structure applied in order to achieve the research
objectives.
Key findings
Ontological: Relativism
Epistemology: Constructionism
Research approach: Inductive
Research method: case study
Case study design
Data Collection: outlined conducting of the case study
Outlined the procedure of data analysis
Quality of the research
Chapter 5: Empirical Findings
Objectives Produce the empirical findings of the research
Key findings
Proposition 1 - When Power Distance is Low
Little importance is attached to performance measurement systems where the use of traditional
performance measures is preferred, and the measurement systems are not developed and that
more objective measures are preferred.
When any attempt is made to develop the Performance Management System, it is developed
collectively between the leaders and managers
Performance Management System is primarily used for communication and attention focusing
The Performance Management System use is not regular
Proposition 2 – When the Power Distance is High
A more mature Performance Management System emerges over time with greater tolerance to
subjective measures
Leaders prefer to design the Performance Management System themselves
Performance Management System is primarily used for monitoring and control
The Performance Management System use is systematic and regular.
Proposition 3 – When Uncertainty Avoidance is Low
Performance information and report are openly shared
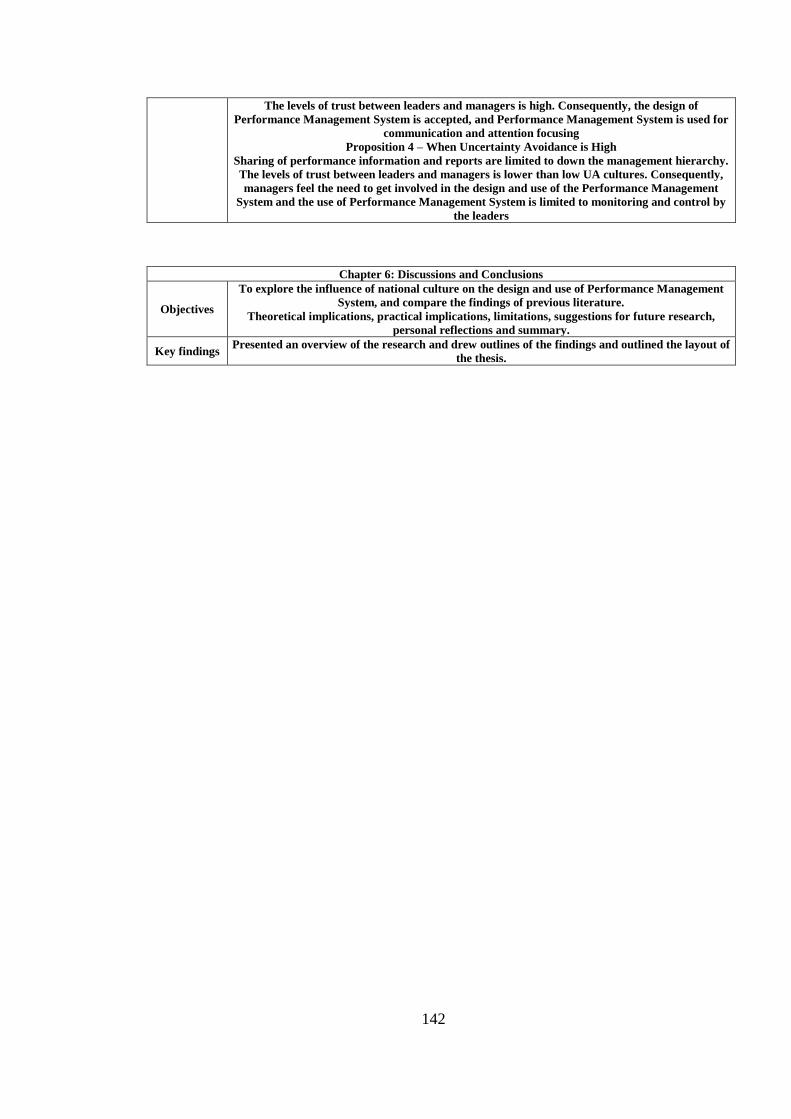
142
The levels of trust between leaders and managers is high. Consequently, the design of
Performance Management System is accepted, and Performance Management System is used for
communication and attention focusing
Proposition 4 – When Uncertainty Avoidance is High
Sharing of performance information and reports are limited to down the management hierarchy.
The levels of trust between leaders and managers is lower than low UA cultures. Consequently,
managers feel the need to get involved in the design and use of the Performance Management
System and the use of Performance Management System is limited to monitoring and control by
the leaders
Chapter 6: Discussions and Conclusions
Objectives
To explore the influence of national culture on the design and use of Performance Management
System, and compare the findings of previous literature.
Theoretical implications, practical implications, limitations, suggestions for future research,
personal reflections and summary.
Key findings Presented an overview of the research and drew outlines of the findings and outlined the layout of
the thesis.
143
References
Abernethy, M. A., Bouwens, J. & van Lent, L., 2010. Leadership and control system
design. Management Accounting Research.
ABS, 2010. Academic Journal Quality Guide. London: Association of Business Schools
Publishing.
Adair, C. et al., 2003. Performance Measurement Systems in Health and Mental Health
Services: Models, Practices, and Effectiveness, Alberta- Canada: Alberta Heritage
Foundation for Medical Research.
Adler, N. J. & Bartholomew, S., 1992. Managing globally competent people. Academy
of Management Executive, Volume 6, pp. 52-65.
Agostino, D. & Arnaboldi, M., 2011. How the BSC implementation process shapes its
outcome. International Journal of Productivity and Performance Managemen, 60(2),
pp. 99-114.
Aguinis, H., Joo, H. & Gottfredson, R. K., 2012. Performance management universals:
Think globally and act locally. Business Horizons, 55(4), pp. 3585-392.
Ahn, H., 2001. Applying the Balanced Scorecard Concept:An Experience Report. Long
Range Planning, 34, pp. 441-461.
Aidemark, L., 2001. The meaning of balanced scorecards in the health care
organization. Financial Accountability & Management, 17(1), pp. 23-40.
Al-Dhubaibi, A., Rahman, I., Haniff, M. & Sanusi, M. Z., 2014. Contingencies
Influencing Management Accounting Practice : A Yemen-based Empirical Study. Asia-
Pacific Management Accounting Journal, 9(2).
Al-Raisi, A., Amin, S., Iqbal, R. & Thompson, P., 2013. Evaluation of E-Performance
System: A Cultural Perspective. s.l., Proceedings of the 2013 IEEE 17th International
Conference on Computer Supported Cooperative Work in Design.
Alsada, A. B., 2010. The Impact of Performance Measurement Systems on
Organisational Culture, s.l.: s.n.
Anthony, R., 1965. Planning and control systems: A framework for analysis. Boston:
Graduate School of Business Administration, Harvard University.
144
Assiri , A., Zairi, M. & Eid, R., 2006. How to profit from the balanced scorecard: An
implementation roadmap. Industrial Management & Data Systems, 106(7), pp. 937 -
952.
Atkinson, A. A., Waterhouse, J. & Wells, R., 1997. A stakeholder approach to strategic
performance measurement. Sloan Management Review, Issue Spring, pp. 25-37.
Awasthi, V. N., Chow, C. W. & Wu, A., 1998. Performance measure and resource
expenditure choices in a teamwork environment: the effects of national culture.
Management Accounting Research, Volume 9, pp. 199-138.
Baker, M. J. & Foy, A., 2003. Business and Management Research. 3rd ed.
Helensburgh: Western Publishers Ltd.
Baron, R. M. & Kenny, D. A., 1986. The moderator-mediator variable distinction in
social psychological research: Conceptual, strategic, and statistical considerations.
Journal of Personality and Social Psychology, Volume 51, pp. 1173-1182.
Barratt, M., Choi, T. Y. & Li, M., 2011. Qualitative case studies in operations
management: Trends, research outcomes, and future research implications. Journal of
Operations Management, pp. 329-342.
Baskerville-Morley, R., 2005. A research note: the unfinished business of culture.
Accounting, Organizations and Society, 30(4), pp. 389-391.
Bedford, D., Brown, D. A., Malmi, T. & Sivabalan, P., 2008. Balanced Scorecard
Design and Performance Impacts: Some Australian Evidence. JAMAR, Vol. 6 Number
2, pp. 17-36.
Berger, P. L. & Luckmann, T., 1971. The social construction of reality : a treatise in the
sociology of knowledge. s.l.:Harmondsworth: Penguin Books.
Bhagat, R. S., Triandis, H. C. & McDevitt, A. S., 2012. Managing Global
Organizations. 1st ed. Cheltenham: Edward Elgar Publishing Limited.
Bhagwat, R. & Sharma, M., 2007. Performance measurement of supply chain
management: A balanced scorecard approach. Computers & Industrial Engineering,
53(1), pp. 43-62.
Birnberg, C. & Snodgrass, C., 1988. Culture and Control: A Field Study. Accounting,
Organizations, and Society, 13(5), pp. 447-464.
Bititci , U., Turner, T. & Begemann, C., 2000. Dynamics of performance measurement
systems. International Journal of Operations and Production Management, Volume 20,
pp. 692-704.
145
Bititci, U., Carrie, A. & McDevitt, L., 1997. Integrated performance measurement
systems: a development guide. International Journal of Operations & Production
Management, 15(6), pp. 522-35.
Bititci, U., Cocca, P. & Ates, A., 2015. Impact of visual performance management
systems on the performance management practices of. International Journal of
Production Research, pp. 1-24.
Bititci, U., Garengo, P., Ates, A. & Nudurupati, S., 2014. Value of maturity models in
performance measurement. International Journal of Production Research, 53(10), pp.
3062-3085.
Bititci, U., Garengo, P. & Dörfler, V., 2012. Performance Measurement: Challenges for
Tomorrow. International Journal of Management Reviews, Vol, 14(3), p. 305–327.
Bititci, U. S. ed., 2015. In: Managing Business Performance: The Science and The Art.
s.l.:Wiley, p. 312.
Bititci, U. S. et al., 2006. Dynamics of performance measurement and organisational
culture. International Journal of Operations & Production Management, Volume Vol.
26, No.12, pp. 1325-1350.
Bititci, U. S. et al., 2004. The interplay between performance measurement,
organisational culture, management style. Measuring Business Excellence, Volume 3, p.
8.
Bourne, M., 2001. Implementation Issues, Handbook of Performance Measurement.
London: GEE.
Bourne, M., 2005. Researching performance measurement system implementation: the
dynamics of success and failure. Production Planning & Control, 16(2), pp. 101-113.
Bourne, M., Melnyk, A. S., Bititci, U. S. & Anderson, B., 2013. Emerging issues in
performance measurement. Management Accounting Research, 25(2).
Bourne, M. et al., 2014. Emerging issues in performance measurement. Management
Accounting Research, 25(2), pp. 117-118.
Bourne, M. et al., 2000. Designing, implementing and updating performance
measurement systems. International Journal of Operations & Production Management,
7, Volume 20, pp. 754-771.
Bourne, M., Neely, A., Mills, J. & Platts, K., 2003. Implementing performance
measurement systems: a literature review. International Journal of business
performance management, 5(1).
146
Bourne, M., Neely, A., Platts, K. & Mills, J., 2002. The success and failure of
performance measurement initiatives: Perceptions of participating managers.
International Journal of Operations& Production Management, pp. 1288-1310.
Braam, G. J. & Nijssen, E. J., 2004. Performance effects of using the Balanced
Scorecard: a note on the Dutch experience. Long Range Planning, 37, p. 335–349.
Brewer, P., 2002. An approach to organizing a management accounting curriculum.
Issues in Accounting Education, 15(2), pp. 211-235.
Bryman, A. & Bell, E., 2011. Business Research Methods. 3rd ed. New York: Oxford
University Press.
Cardinal, L., 2001. Technological innovation in the pharmaceutical industry: the use of
organizational control in managing research and development. Organization Science,
12(1), pp. 19-36.
Carmona, S. & Granlund, A., 2003. Measures vs. action: the BSC in Swedish Law
enforcement. International Journal of Operations and Production Management, 23(12),
pp. 1475-1496.
Carmona, S., Iyer, G. & Reckers, P., 2011. The impact of strategy communications,
incentives and national culture on balanced scorecard implementation. Advances in
Accounting,Incorporating Advances in International Accounting, Volume 27, pp. 62-74.
Chan, K.-Y. & Drasgow, F., 2001. Toward a theory of individual differences and
leadership: Understanding the motivation to lead. Journal of Applied Psychology, 86(3),
pp. 481-498.
Cheng, M.-I., Dainty, A. & Moore, D., 2007. Implementing a new performance
management system within a project-based organization. International Journal of
Productivity and Performance Management, 56(1), pp. 60-75.
Chenhall, R. H., 2003. Management control systems design within its organizational
context: findings from contingency-based research and directions for the future.
Accounting, Organizations and Society , Volume 28, p. 127–168.
Chesbrough, H. W. & Garman, A. R., 2009. How open innovation can help you cope in
lean times. Harvard Business Review, Issue 87, pp. 68-76.
Chesley , J. A. & Wenger, M. S., 1999. Transforming an organization: Using models to
foster a strategic conversation. California Management Review, 41(3), p. 54–73.
Child, J., 1973. Predicting and understanding organizational structure. Administrative
Science Quarterly, 18(2), pp. 168-85.
147
Choong, K. K., 2013. Has this large number of performance measurement publications
contributed to its better understanding? A systematic review for research and
applications. International Journal of Production Research, 52(14), pp. 4174-4197.
Chow, C., Kato, Y. & Shields, M., 1994. National culture and the preference for
management controls: An exploratory study of the firm-labor market interface.
Accounting, Organizations, and Society, 19(45), pp. 381-400.
Chow, C. W., Harrison, G. L., McKinnon, J. L. & Wu, A., 1999. Cultural influences on
informal sharing in Chinese and Anglo-American organizations: an exploratory study.
Accounting, Organizations and Society, Volume 24, pp. 561-582.
Chow, C. W., Kato, Y. & Merchant, K. A., 1996. Use of organizational controls and
their effects on data manipulation and management myopia: a Japan vs US comparison.
Accounting, Organizations and Society, 21(2/3), pp. 175-192.
Ciuzaite, E., 2008. Balanced scorecard development in Lithuanian companies. Aarhus :
Aarhus School of Business.
Cocca, P. & Alberti, M., 2010. A framework to assess performance measurement
systems in SMEs. International Journal of Productivity and Performance Management,
59(2), pp. 189-200.
Collis, J. & Hussey, R., 2011. Scientist or ethnographer?. In: A. Karami, ed.
Management research. Hampshire: Palgrave Macmillan, pp. 67-96.
Collis, J. & Hussey, R., 2014. Business Research. 4th ed. Hampshire: Palgrave
Macmillan Higher Education.
Collis, J. et al., 2011. Management Research Custom Publication. s.l.:Palgrave
Macmillan.
Creswell, J. W., 2014. Research Design. 4th ed. London: Sage.
Cross, K. & Lynch, R., 1988-1989. The SMART way to define and sustain success.
National Productivity Review, 9(1), pp. 23-33.
Cugueró-Escofet, N. & Rosanas, J. M., 2013. The just design and use of management
control systems as requirements. Management Accounting Research, Volume 24, pp.
23-40.
Davis, S. & Albright, T., 2004. An investigation of the effect of balanced scorecard
implementation in financial performance. Management Accounting Research, Issue Vol.
15, No. 2, pp. 135-53.
148
de Waal, A., 2002. The role of behavioural factors in the successful implementation and
use of performance management systems. Boston, MA, Proceedings of 3rd International
Performance Management Association Conference, pp. 157-164.
de Waal, A., 2006. The Role of Behavioral Factors and National Cultures in Creating
Effective Performance Management Systems. Systematic Practice and Action Research,
February, 19(1), pp. 61-79.
de Waal, A. A., 2003. "Behavioral factors important for the successful implementation
and use of performance management systems. Management Decision, 41(8), pp. 688 -
697.
de Waal, A. A. & Coevert, V., 2007. The effect of performance management on the
organizational results of a bank. International Journal of Productivity and Performance
Management, Vol. 56 Iss: 5, pp. 397 - 416.
de Waal, A. a. & Counet, H., 2009. Lessons learned from performance management
systems implementations. International Journal of Productivity and Performance
Management, 58(4), pp. 367 - 390.
de Waal, A. & Frijns, M., 2011. Longitudinal research into factors of high performance:
the follow-up case of Nabil Bank. Measuring Business Excellence, 15(1), pp. 4-19.
Deal, T. & Kennedy, A., 1982. Corporate Cultures: The Rites and Rituals of Corporate
Life. Harmondsworth: Penguin Books.
Decoene, V. & Bruggeman, W., 2006. Strategic alignment and middle-level managers'
motivation in a balanced scorecard setting. International Journal of Operations &
Production Management, 26(4), pp. 429 - 448.
Dixon, J., Nanni, A. & Vollmann, T., 1990. The New Performance Challenge. Irwin,
Burr Ridge, IL: Business One.
Dossi, A. & Patelli, L., 2008. The decision-influencing use of performance
measurement systems in relationships between headquarters and subsidiaries.
Management Accounting Research, Volume 19, pp. 126-148.
Easterby-Smith, M., Thorpe, R. & Jackson, P., 2012. Management Research. 4th
Edition ed. London: Sage.
Eccles, R. G., 1991. The performance measurement manifesto. Harvard Business
Review, pp. 131-7.
Efferin, S. & Hopper, T., 2007. Management control, culture and ethnicity in a Chinese
Indonesian company. Accounting, Organization and Society, Volume 32, pp. 223-262.
149
Eisenhardt, K. M., 1989. Building theories from case study research. Academy of
Management Review, 14(4), pp. 532-50.
Eisenhardt, K. M. & Graebner, M. E., 2007. Theory building from cases: Opportunities
and challenges. Academy of management journal, Volume 50, pp. 25-32.
Etemadi, H., Dilami, Z. D., Bazaz, M. S. & Parameswaran, R., 2009. Culture,
management accounting and managerial performance: Focus Iran. Advances in
Accounting, incorporating Advances in International Accounting, Volume 25, p. 216–
225.
Ferreira, A. & Otley, D., 2009. The design and use of performance management
systems: An extended framework for analysis. Management Accounting Research,
20(4), pp. 263-282.
Firth, M., 1996. The diffusion of managerial accounting procedures in the people’s
republic of China and the influence of foreign partnered joint ventures. Accounting,
Organizations and Society, Volume 21, p. 629–654.
Fitzgerald, I. & Moon, P., 1996. Performance Measures in Service Industries: Making it
Work. s.l.:CIMA.
Fitzgerald, L. et al., 1991. Performance Service Businesses. London: CIMA Publishing.
Franco, M. & Bourne, M., 2003. Factors that play a role in "managing through
measures. Management Decision, 41(8), pp. 698 - 710.
Franco-Santos , M. & Bourne, M., 2005. An examination of the literature relating to
issues affecting how companies manage through measures. Production Planning &
Control: The Management of Operations , 16(2), pp. 114-124.
Franco-Santos, M., Lucianetti, L. & Bourne, M., 2012. Contemporary performance
measurement systems: A review of their consequences and a framework for research.
Management Accounting Research, 23(2), pp. 79-119.
Gabrielidis , C. et al., 1997. Preferred styles of conflict resolution: Mexico and the
United States. Journal of Cross-Cultural Psychology, pp. 661-977.
Garengo , P. & Biazzo, S., 2012. Unveiling strategy in SMEs through balanced
scorecard implementation: A circular methodology. Total Quality Management &
Business Excellence, 23(1), pp. 79-102.
Garengo , P. & Bititci, U., 2007. Towards a contingency approach to performance
measurement: an empirical study in Scottish SMEs. International Journal of Operations
& Production Management, 8, Volume 27, pp. 802-825.
150
Garengo, P., Biazzo, S. & Bititci, U., 2005. Performance measurement systems in
SMEs: A review for a research agenda. International Journal of Management Reviews,
7(1), pp. 25-47.
Glaser, B. G. & Strauss, A. L., 1968. The discovery of grounded theory : strategies for
qualitative research. London: Weidenfeld and Nicolson.
Gomez , C., Kirkman, B. & Shapiro, D. , 2000. The impact of collectivism and in-
group/out-group membership on the evaluation generosity of team members. Academy
of Management, Volume 43, pp. 1097-106.
Gordon, L. A. & Narayanan, V. K., 1984. Management accounting systems, perceived
environmental uncertainty and organization structure: an empirical investigation.
Accounting, Organizations and Society, 9(1), pp. 33-47.
Govindarajan, V., 1988. A contingency approach to strategy implementation at the
business-unit level: integrating administrative mechanisms with strategy. Academy of
Management Journal, pp. 828-853.
Greatbanks, R. & Tapp, D., 2007. The impact of BSC in a public sector environment:
empirical evidence from Dundin city council New Zealand. International Journal of
Operations and Production Management, 27(8), pp. 846-873.
Guba, E. G. & Lincoln, Y. S., 1981. Effective evaluation: Improving the usefulness of
evaluation results through responsive and naturalistic approaches. San Franciso, CA:
Jossey-Bass.
Guba, E. G. & Lincoln, Y. S., 1985. Naturalistic inquiry. Newbury Park: Sage.
Hacker , M. & Brotherton, P., 1998. Designing and installing effective performance
measurement systems. IIIE Solutions, 30(8), pp. 18-23.
Hall, E., 1976. Beyond Culture. New York, NY: Anchor Press Doubleday.
Hansen, M. T. & Birkinshaw, J., 2007. The innovation value chain. Harvard Business
Review, Issue 85, pp. 121-130.
Harpaz, I., Honig, B. & Coetsier, P., 2002. A cross-cultural longitudinal analysis of the
meaning of work and the socialization process of career starters. Journal of World
Business, Volume 37, pp. 230-44.
Harrington, L., Boyson, S. & Corsi, T., 2011. X-SCM: The New Science of X-treme
Supply Chain Management. New York, NY: Routledge.
Harrison, G. L., 1992. The Cross-cultural Generaliability of the Relation between
Participation, Budget, Emphasis and Job Related Attitudes. 17(1).
151
Harrison, G. L., 1993. Reliance on Accounting Performance Measures in Superior
Evaluative Style : the Effect of National Culture and Personality. Accounting
Organizations andSociety, 14(4), pp. 319--339.
Harrison, G. L. & McKinnon, J. L., 1999. Cross-cultural research in management
control systems design: a review of the current state. Accounting, Organizations and
Society, Volume 24, pp. 483-506.
Harrison, G., McKinnon, J., Panchapakesan, S. & Mitzi, L., 1994. The Influence of
Culture on Organizational Design and Planning and Control in Australia and the United
States Compared with Singapore and Hong Kong. Journal of lnternational Financial
Management and Accounting, 5(3), pp. 242-261.
Hartmann, F., Naranjo-gil, D. & Perego, P., 2010. The Effects of Leadership Styles and
Use of Performance Measures on Managerial Work- Related Attitudes. European
Accounting Review, 19(2), pp. 275-310.
Henri, J., 2006. Organizational culture and performance measurement system.
Accounting, Organizations and Society, Volume 31, p. 77–103.
Hofstede G., 2016. The Hofstede Centre. [Online]
Available at: https://geert-hofstede.com/national-culture.html
[Accessed 27 April 2016].
Hofstede, G., 1980. Culture’s Consequences. Sage,Beverly Hill,CA: s.n.
Hofstede, G., 2001. Culture's Consequences. 2nd ed. California: Sage Publications.
Hofstede, G. & Hofstede, G. J., 2005. Cultures and Organizations: Software of the
Mind. 2nd ed. New York: McGraw-Hill Books.
Hoque, Z. & James, W., 2000. Linking Balanced Scorecard measures to size and market
factors: impact on organizational performance. Journal of Management Accounting
Research, Volume 12, pp. 1-17.
House, R. et al., 2004. Cultures, Leadership, and Organizations:GLOBE Study of 62
Societies. Newbury Park, CA: Sage.
Hudson, M., Bennet, J., Smart, A. & Bourne, M., 1999. Performance measurement in
planning and control of SMEs. In: K. Mertins, O. Krause & B. Schallock, eds. Global
Production Management. Boston, MA: Kluwer Academic.
Hudson, M., Smart, A. & Bourne, M., 2001. Theory and practice in SME performance
measurement systems. International Journal of Operations & Production Management,
21(8), pp. 1096-1115.
152
Hvolby, H.-H. & Thorstenson, A., 2000. Performance measurement in small and
medium-sized enterprises. Coventry, 17–19 April, Proceeding of the International
Conference on Stimulating Manufacturing Excellence in SMEs.
Inglehart, R., 2008. Changing values among Western publics from 1970 to 2006. West
European Politics, 31(1-2), pp. 130-146.
Ittner , C., Larcker, D. & Randall, T., 2003. “Performance implications of strategic
performance measurement in financial services firm. Accounting, Organizations and
Society, 28(7-8), pp. 715-41.
Jansen, E., Merchant, W. & der Stede, V., 2009. National differences in incentive
compensation practices: The differing roles of financial performance measurement in
the United States and the Netherlands. Accounting, Organizations and Society, 34(1),
pp. 58-84.
Johnson, H. T. & Kaplan, R. S., 1987. Relevance Lost: The Rise and Fall of
Management Accounting. Boston, MA: Harvard Business School Press.
Kaplan, R. & Norton, D., 1992. The balanced scorecard – measures that drive. Harvard
Business Review, 70(1), pp. 71-9.
Kaplan, R. & Norton, D., 1996. The balanced scorecard. Boston: Harvard Business
School Press.
Kaplan, R. & Norton, D., 2001. The Strategy-focused Organisation. Boston, MA:
Harvard Business School Press.
Keegan, D., Eiler, R. & Jones, C., 1989. Are your performance measures obsolete.
Management Accounting, Issue 6, pp. 45-50.
Kennerley, M. & Neely, A., 2003. Measuring performance in a changing business
environment. International Journal of Operations & Production Management, 23(2),
pp. 213-229.
Kershaw, R. & Kershaw, S., 2001. Developing a balanced scorecard to implement
strategy as St. Elsware Hospital. Management Accounting Quarterly, 2(2), pp. 28-35.
Khandwalla, P. N., 1972. The effects of different types of competition on the use of
management controls. J. Acc. Res. , 10(2), pp. 275-285.
Kirkman, B., Rosen, B., Tesluk, P.E, & Gibson, C.B., 2004. The impact of team
empowerment on virtual team performance: The moderating role of face to face
interaction. Academy of Management Journal, 47(2), pp. 175-192.
153
Kleingeld, A., Van Tuijl, H. & Algera, J. A., 2004. Participation in the design of
performance management systems: a quasi-experimental field study. Journal of
Organizational Behavior, Volume 25, p. 831–851.
Kluckhohn, ; Strodtbeck, 1961. Variations in Value Orientations. Evanston, IL: Row,
Peterson & Co.
Lau, C. M. & Caby, J., 2010. The effects of national culture on the role of participation
in different task situations. Advances in Accounting, 26(1), pp. 128-133.
Lau, C. M. & Chong, J., 2002. The effects of budget emphasis, participation and
organizational commitment on job satisfaction : Evidence from the financial service
sector. Advances in Accounting Behavioral Research, Volume 5, pp. 183-211.
Lawrie, G. & Cobbold, I., 2004. Third-generation balanced scorecard: evolution of an
effective strategic control tool. International Journal of Productivity and Performance
Management, 53(7), pp. 611-623.
Lebas, M. J., 1995. Performance measurement and performance management.
International Journal of Production Economics, Volume 41, pp. 23-35.
Lewy, C. & du Mee, P., 1998. The ten commandments of balanced scorecard
implementation. Management Control and Accounting, Issue April, p. 2.
Lincoln, Y. S., Lynham, S. A. & Guba, E. G., 2011. Paradigmatic controversies,
contradictions, and emerging confluences revisited. In: N. K. Denzin & Y. S. Lincoln,
eds. The SAGE Handbook of Qualitative Research. Thousand Oaks, CA: Sage
Publications Inc., pp. 97-128.
Lindholm, N., 2000. National Culture and Performance Management in MNC
subsidiaries. International Studies of Management and Organization, 29(4), pp. 45-66.
Li, P. & Tang, G., 2009. Performance measurement design within its organisational
context—Evidence from China. Management Accounting Research.
Lynch, R. & Cross, K., 1991. Measure Up! Yardsticks for Continuous Improvement.
Oxford: Blackwell.
Malina, M. A. & Selto, F. H., 2004. Choice and change of measures in performance
measurement models. Management Accounting Research, 15, p. 441–469.
Malmi, T., 2001. Balanced scorecards in Finnish companies: A research note.
Management Accounting Research, 12(2), pp. 207-220.
McCunn, P., 1998. The balanced scorecard: the eleventh commandment. Management
Accounting, pp. 34-6.
154
McSweeney, B., 2002. Hofstede's model of national cultural differences and the
consequences: a triumph of faith - a fail of analysis. Human Relations, Volume 55, pp.
55-118.
Meekings, A., 1995. Unlocking the potential of performance measurement: a guide to
practical implementation. Public Money & Management, Issue October-December, pp.
1-8.
Melnyk, S. A. et al., 2014. Is performance measurement and management fit for the
future?. Management Accounting Research, Volume 25, pp. 173-186.
Mendibil, K. & MacBryde, J., 2006. Factors that affect the design and implementation
of team-based performance measurement systems. International Journal of Productivity
and Performance Management, 2(118-142), p. 55.
Merchant , K. A. & Van der Stede, W. A., 2007. Management Control Systems:
Performance Measurement, Evaluation and Incentives. 2nd ed. s.l.:Prentice Hall.
Merchant, K., 1984. Influences on departmental budgeting: An empirical examination
of a contingency model. Accounting Organizations and Society, 9(4), pp. 291-307.
Merchant, K., 1998. Modern Management Control Systems: Text and Cases. Upper
Saddle River, NJ: Prentice-Hall.
Merchant, K. A., Diego, S. & Wu, A., 1995. Measurement, Evaluation and Reward of
Profit Centres Managers: A Cross-Culture Field Study. Accounting, Organizations and
Society, 20(7/8), pp. 619-638.
Merchant, K. A. & Van der Stede, W., 2003. Management Control Systems -
Performance Measurement Evaluation and Incentives. 1st Edition ed. New York:
Prentice Hall.
Mettänen, P., 2005. Design and implementation of a performance measurement system
for a research organization,. Production Planning & Control, 16(2), pp. 178-188.
Meyer, J. A., 1997. The Acceptance of Visual Information in Management. Information
& Management 32, 32(6), p. 275–287.
Miles, M. B., Huberman, A. M. & Saldana, J., 2014. Qualitative data analysis. 3rd ed.
Thousand Oaks: SAGE Publications Inc..
Miles, M. & Huberman, A., 1994. Qualitative Data Analysis: Grounded Theory
Procedures and Techniques. London: Sage.
Minkov, M., 2011. Cultural Differences in a Globalizing World. 1st ed. Bingley, UK:
Emerald Group Publishing Limited.
155
Minkov, M. & Hofstede, H., 2011. The evolution of Hofstede's Doctrine. Cross
Cultural Management: An International Journal, 18(1), pp. 10-20.
Mintzberg , H. & Walters, J. A., 1985. Of strategies, deliberate and emergent. Strategic
Management Journal, Issue 6, pp. 257-272.
Mintzberg, 1983. Structures in Fives: Designing effective organizations.. Englewood
Cliffs, NJ: Prentice Hall.
Mitchell , T., Thompson K. R. & George-Falvy , J., 2000. Goal-setting: theory and
practice. In: C. Cooper & E. A. Locke , eds. Industrial, Work and Organisational
Psychology. Oxford: Sage.
Mooraj, S., Oyon, D. & Hostettler, D., 1999. The Balanced Scorecard: a Necessary
Good or an Unnecessary Evil?. European Management Journal, 5 17, 5(17), p. 481–
491.
Myers, M., 2013. Qualitative Research in Business & Management. 2nd ed. London:
Sage.
Nardon, L. & Steers, R. M., 2009. The culture theory jungle: divergence and
convergence in models of national culture. In: R. S. Bhagat & R. M. Steers, eds.
Cambridge Handbook of Culture, Organizations, and Work. Cambridge: University
Press, pp. 3-22.
Neely, A., Adams, C. & Crowe, P., 2001. The performance prism in practice.
Measuring Business Excellence, 5(2), pp. 6-11.
Neely, A., 1999. The performance measurement revolution: why now and what next?.
International Journal of Operations & Production Management , 19(2), pp. 205 - 228.
Neely, A. & Adams, C., 2001. The performance prism perspective. Journal of Cost
Management, 15(1), pp. 7-15.
Neely, A., Adams, C. & Kennerley, M., 2002. The Performance Prism: The Scorecard
for Measuring and Managing Stakeholder Relationship. London: Prentice-Hall.
Neely, A. & Bourne, M., 2000. Why Measurement Initiatives Fail?. Measuring
Business Excellence, 12(4).
Neely, A. D., Gregory, M. J. & Platts, K. W., 1995. Performance Measurement System
Design: A Literature Review and Research Agenda. International Journal of
Operations and Production Management, pp. 80-116.
Neely, A., Gregory, M. & Platts, K., 2005. Performance measurement system design.
International Journal of Operations & Production Management, 25(12), pp. 1228-1263.
156
Neely, A. et al., 1996. Performance measurement system design: Should process based
approaches be adopted. International journal of Production Economics, Issue 46-47, pp.
423-431.
Neely, A. et al., 1996. Getting the Measure of Your Business. Cambridge: Works
management.
Newman, K. L. & Nollen, S. D., 1996. Culture and congruence: the fit between
management practices and national culture. Journal of International Business Studies,
27(4), pp. 753-779.
Nudurupati & Bititci, 2005. Implementation and impact of IT-supported performance
measurement systems. Production Planning and Control, 16, pp. 152-162.
Nudurupati, S. S., Bititci, U. S., Kumar, V. & Chan, F. T., 2011. State of the art
literature review on performance measurement. Computers & Industrial Engineering,
60, pp. 279-290.
O'Connor, N. G., 1995. The influence of organizational culture on the usefulness of
budget participation by Singaporean-Chinese managers. Accounting, Organizations and
Society, 20(5), pp. 385-403.
O'Connor, N. G., Chow, C. W. & Wu, A., 2004. The adoption of “Western”
management accounting/controls in China's state-owned enterprises during economic
transition. Accounting, Organizations and Society, 29(3-4), pp. 349-375.
Ogbeide, R. & Harrington, R., 2011. The relationship among participative management
style, strategy implementation success, and financial performance in the foodservice
industry. International Journal of Contemporary Hospitality Management, 23(6), pp.
719-738.
Otley, D., 1999. Performance management : a framework for management control
systems research. Management Accounting Research, 10(11), pp. 363-382.
Otley, D., 2003. Management Control and Performance Management: Whence and
Whither?. The British Accounting Review, 34(4), pp. 309-326.
Ouchi, W., 1979. A conceptual framework for the design of organizational control
mechanisms. Management Science, 25(9), pp. 833-848.
Pagell, M., Katz, J. P. & Sheu, C., 2005. The importance of national culture in
operations management research. International Journal of Operations & Production
Management, 25(4), pp. 371-394.
157
Pavlov, A. & Bourne, M., 2011. Explaining the effects of performance measurement on
performance. International Journal of Operations & Production Management, 31(1),
pp. 101-122.
Perrow, C., 1967. A framework for comparative organizational analysis. American
Sociological Review, 32(2), pp. 194-208.
Peterson, R. M., Dibrell, C. C. & Pett, T. L., 2002. Long-vs. short-term performance
perspectives of Western European, Japanese, and U.S. countries: where do they lie?.
Journal of World Business, Volume 37, pp. 245-255.
Pettigrew, A., 1987. The awakening giant, change and continuity in ICI. Oxford:
Blackwell, 1985. Journal of Management Studies, 24(6), pp. 649-70.
Pisano, G. P. & Verganti, R., 2008. Which kind of collaboration is right for you?.
Harvard Business Review, Issue 89, pp. 1-8.
Poister , T. & Streib , G., 1999. Performance measurement in municipal government:
assessing the state of practice. Public Administration Review, 59(4), pp. 325-35.
Pun, K. F. & White, A. S., 2005. A performance measurement paradigm for integrating
strategy formulation: A review systems and frameworks. International Journal of
Management Reviews, Vol. 7 Iss. 1, pp. 49-71.
Saunders, M., Lewis, P. & Thornhill, A., 2012. Research Methods for Business
Students. 6th ed. Harlow: Pearson Eduction Limited.
Schneiderman, A., 1999. Why balanced scorecards fail. Journal of Strategic
Performance Measurement, Volume 3, pp. 6-11.
Schneider, S. C. & de Meyer, A., 1991. Interpreting and responding to strategic issues:
the impact of national culture. Strategic Management Journal, Volume 12, pp. 307-320.
Schwartz, S., 1994. Cultural dimensions of values: toward an understanding of national
differences. In: U. Kim, H. Triandis, C. Kagitcibasi & Choi, S, eds. Individualism and
Collectivism: Theory, Method, and Application. Thousand Oaks, CA: Sage, pp. 85-119.
Shepherd, C. & Gunter, H., 2006. Measuring supply chain performance: current
research and future directions. International Journal of Productivity and Performance
Management, 55(4), pp. 242-58.
Shotter, J., 1993. Conversational realities : constructing life through language. London;
Thousand Oaks, Calif: Sage Publication.
Simons, R., 1987. Accounting control systems and business strategy: an empirical
analysis. Accounting Organizations and Society, Volume 12, pp. 357-374.
158
Simons, R., 2000. Performance Measurement and Control Systems for Implementing
Strategy. Upper Saddle River, NJ: Prentice Hall.
Smith Hudson, M. & Smith, D., 2007. Implementing strategically aligned performance
measurement in small firms. International Journal Production Economics, Issue 106,
pp. 393-408.
Smith, F., 2007. KPIs made easy. Control Engineering, Issue 1, pp. 42-46.
Speckbacher, G., Bischof, J. & Pfeiffer, T., 2003. A descriptive analysis on the
implementation of Balanced Scorecards in German-speaking countries. Management
Accounting Research , Volume 14, p. 361–387.
Stake, R. E., 2005. Qualitative case studies. In: N. Denzin & Y. S. Lincoln, eds.
Qualitative Research. Thousand Oaks, California: Sage Publications, pp. 443-466.
Steers, R. M., Nardon, L. & Sanchez-Runde, C., 2009. Culture and organization design:
strategy, structure, and decision-making. In: R. S. Bhagat & R. M. Steers, eds.
Cambridge Handbook of Culture, Organizations, and Work. New York: Cambridge
University Press, pp. 71-117.
Stiles, P. & Taylor, B., 2001. Boards at Work - How Directors View their Roles and
Responsibilities. New York: Oxford University Press.
Tafarodi , R., Milne, A. B. & Smith, A. J. , 1999. Evidence for an augmentation effect
on self-perceived. Personality and Social Psychology Bulletin, Volume 25, pp. 1405-
1416.
Tannenbaum, A., 1968. Control in Organizations. New York: McGraw-Hill.
Tayeb, M., 1988. Organizations and National Culture. 1st ed. London: Sage
Publications.
Taylor, A. & Taylor, M., 2014. Factors influencing effective implementation of
performance measurement systems in small and medium-sized enterprises and large
firms: a. International Journal of Production Research, 52(3), pp. 847-866.
Tenhunen, J., Rantanen, H. & Ukko, J., 2001. SME-oriented Implementation of a
Performance Measurement System. Lahti, Finland: Department of Industrial
Engineering and Management, Lapeentranta University of Technology.
Tessier, S. & Otley, D., 2012. A conceptual development of Simons' Levers of Control
framework. Management Accounting Research, 23(3), pp. 171-185.
Tharenou, P., Ross, D. & Cooper, B., 2007. Management Research Methods. 1st ed.
New York: Cambridge University Press.
159
Thomson, W. & Hickey, J., 2005. Society in Focus Boston, MA: Pearson.. [Online]
Available at: https://en.wikipedia.org/wiki/Western_world#cite_note-autogenerated1-8
[Accessed 14 January 2016].
Tranfield, D., Denyer, D. & Smart, P., 2003. Towards a methodology for developing
evidence-informed management knowledge by means of systematic review. British
Journal of Management, Volume 14, pp. 207-222.
Trompenaars, F., 1993. Managing Across Cultures. New York: Random House.
Trompenaars, F. & Hampden-Turner, C., 2012. Riding the Waves of Culture. 3rd ed.
New York: McGraw-Hill Books.
Tsang, D., 2007. Leadership, national culture and performance management in the
Chinese software industry. International Journal of Productivity and Performance
Management, 56(4), pp. 270-284.
Tsui, J. S., 2001. The impact of culture on the relationship between budgetary
participation, management accounting system and managerial performance: An analysis
of Chinese and Western management. International Journal of Accounting, Volume 36,
pp. 125-146.
Tung, A., Baird, K. & Schoch, H. P., 2011. Factors influencing the effectiveness of
performance measurement systems. International Journal of Operations & Production
Management, Vol:31 Iss:12, pp. 1287 - 1310.
Ueno, S. & Wu, F. H., 1993. The comparative influence of culture on budget control
practices in the United States and Japan. The International Journal of Accounting, Issue
28, pp. 17-39.
Ukko, J., Tenhunen, H. & Rantanen, H., 2007. Performance measurement impacts on
management and leadership: Perspectives of management and employees. Internation
Journal of Production Economics, 5 110, pp. 39-51.
Van Aken, E. M. et al., 2005. Assessing maturity and effectiveness of enterprise
performance measurement systems. International Journal of Productivity and
Performance Management, 54(5), pp. 400-418.
van der Stede, W. A., 2003. The effect of national culture on management control and
incentive system design in multi-business firms : Evidence of intercorporate
isomorphism. European Accounting Review, 12(2), pp. 263-285.
160
Van, d. Z. & de Jong, B., 1999. Alignment is not enough: integrating business
information technology management with the balanced scorecard. Journal of
Management Information Systems, 16(1), pp. 137-156.
Vike, C., 2007. Weyerhaeuser’s data management model gathers supply chain data.
Pulp and Paper, Issue 2, pp. 36-38.
Voss, C., Tsikriktsis, N. & Frohlich, M., 2002. Case research in operations
management. International Journal of Operations & Production Management, 22(2),
pp. 195-219.
Waggoner, D. B., Neely, A. D. & Kennerley, M. P., 1999. The forces that shape
organisational performance measurement systems: An interdisciplinary review. Int. J.
Production Economics, 60-61, pp. 53-60.
Walliman, N., 2011. Research Methods. 1st ed. Abingdon: Routledge.
Wettstein, T. & Kueng, P., 2002. A maturity model for performance measurement
systems. In: Management Information Systems 2002: GIS and Remote Sensing.
Southampton: WIT Press.
Wilson, J., 2010. Essentials of business research. 1st ed. London: Sage.
Yin, R., 1994. Case Study Research: Design and Methods. 2nd ed. Thousand Oaks,
CA.: Sage.
Yin, R. K., 2014. Case study research: design and methods. 5th ed. Thousand Oaks:
Sage.
Zawawi, D., 2009. Cultural dimensions among Malaysian employees. International
Journal of Economics and Management, 2(2), pp. 409-426.