Exploring the feasibility of using remote sensing in...
52
Exploring the feasibility of using remote sensing in the dairy sector (fodder development) A pilot study in Banaskantha District, Gujarat Space Application Center, Indian Space Research Organisation (ISRO) & National Dairy Development Board (NDDB) June 2015
Transcript of Exploring the feasibility of using remote sensing in...

Exploring the feasibility of using
remote sensing in the dairy sector
(fodder development) A pilot study in Banaskantha District, Gujarat
Space Application Center, Indian Space Research Organisation (ISRO)
&
National Dairy Development Board (NDDB)
June 2015


Project Execution Team
The pilot project was executed by the following team members from SAC,
ISRO, Ahmedabad & NDDB, Anand,
Dr. Sujay Dutta, Shri K.N. Chaudhury, Dr. R. Tripathy &
Shri K.R. Manjunath
from
Space Applications Centre (ISRO), Ahmedabad
&
Shri Darsh Worah, Ms. Mena Paghadar &
Shri Subir Mitra
from
National Dairy Development Board, Anand

Acknowledgement
We are grateful to Shri T. Nandkumar, Chairman, NDDB and Shri A S
Kiran Kumar, Chairman, ISRO for taking keen interest, to initiate this
pilot study for demonstration of procedure and feasibility of utilising
remote sensing in the dairy sector, at the ground level.
The overwhelming support provided by Shri Tapan Mishra, Director,
SAC, ISRO Ahmedabad for carrying out this study is also duly
acknowledged.
We also acknowledge the contributions and support provided by the
following:
National Dairy Development Board, Anand
1 Dr. T N Datta (General Manager, SA&S)
2 Shri Anil Patel (Manager, SA&S)
3 Dr. N R Ghosh (Manager, AN)
Banaskantha Milk Union, Palanpur
1 Sanjay Karamchandani (Managing Director)
2 Narsinh Gurjar (Fodder Development Officer)
3 Dr. Haribhai M Patel (Manager)
4 Dr. P S Chaudhary (Senior Officer)
5 Dr V S Patel (Senior Officer)
6 Dr M V Prajapati (Assistant Executive)
7 Dr D V Loh (Junior Executive)
Anand Agriculture University
1 Ms. Ashvini Patel (B.tech Agri IT, Final Semester Student)
2 Ms. Devee Odedara (B.tech Agri IT, Final Semester Student)
List of Tables
Table-1: Requirement and availability of fodder in the country – 2010.
Table-2: Area under fodder crops in 2010-11
Table-3: Multi-date LISS-III data information
Table-4: Contingency table for accuracy assessment
Table-5: Contingency table for kappa coefficient
Table-6: Proportion of villages having significant fallow & culturable wastelands
Table-7: Proportion of villages having significant land under fodder crops
Table-8: Tahsilwise information on land, bovine livestock & dairying
Table-9: Comparison of changes in Land Use Land Cover (LULC)
between 2005-06 and 2011-12 for Palanpur tahsil
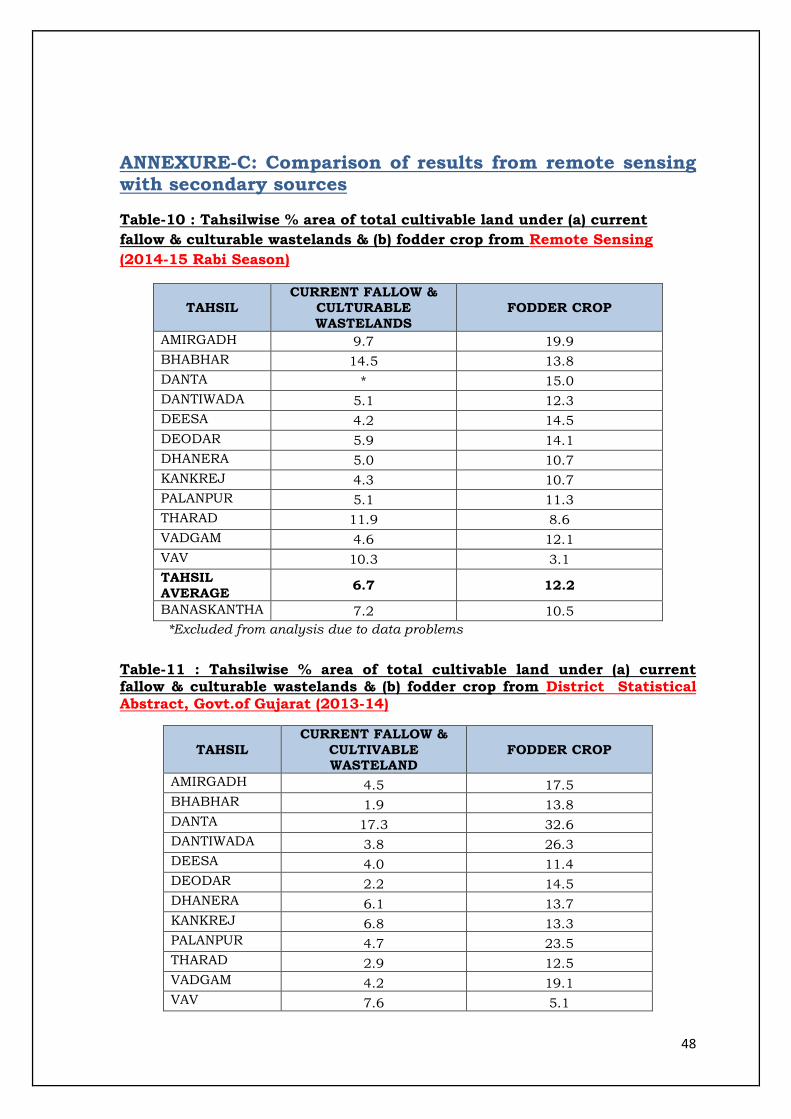
Table-10: Tahsilwise % area of total cultivable land under (a) current fallow & culturable wastelands & (b) fodder crop from Remote Sensing (2014-15 Rabi Season)
Table-11: Tahsilwise % area of total cultivable land under (a) current fallow & culturable wastelands & (b) fodder crop from
District Statistical Abstract, Govt.of Gujarat (2013-14)

List of Figures
Figure-1: Banaskantha district, Gujarat
Figure-2: Geo-referenced FCC of Jan.12, 2015, Path: 92 Row: 55
Figure-3: Ground truth sheet of fodder crop [Village: Dhedhal, Tahsil: Deesa]
Figure-4a: Zoomed view of the GT survey
Figure-4b: Synoptic view of the GT
Figure-5: Layer stack of NDVI images for all date with GT coverage and Tahsil boundaries
Figure-6: NDVI and LSWI Spectral profiles
Figure-7: Model development for generating mask image of non-agriculture area
Figure-8a: Remote Sensing Data Analysis Procedure
Figure-8b: Methodology for Fodder Area Estimation
Figure-9: GT point of fodder crop overlaid on satellite imagery of different dates
Figure-10: Spectral signatures of different crops
Figure-11: Classified image for fodder crops
Figure-12: FCC overlaid on classified image of fodder crops
Figure-13: Classified image for Current Fallow land
Figure-14: Classified image for Current Fallow land with FCC
Figure-15: Proportion of fodder crop area out of cultivable land
Figure-16: Proportion of current fallow & culturable wastelands out of cultivable land
Figure-17: Current fallows & Culturable Wastelands and Fodder
growing areas in Banaskantha district shown tahsilwise, as analysed by remote sensing during Rabi season 2014-15
Figure-18: Current fallows & Culturable Wastelands and Fodder growing areas in Palanpur tahsil , as analysed by remote
sensing during Rabi season 2014-15 Figure-19: Land Use Land Cover (LULC) Map of Palanpur Tahsil 2005-
06
Figure-20: Land Use Land Cover (LULC) Map of Palanpur Tahsil 2011-12
Figure-21: Land Use Land Cover (LULC) change in Palanpur tahsil (2005-06 & 2011-12)
Figure-22: Growing fodder in village culturable wasteland by
Madanagadh Dairy Co-operative Society, Village : Madana

(gadh), Tahsil: Palanpur, District: Banaskantha
Table of Contents
Executive Summary ................................................................................................................... 9
Introduction ................................................................................................................................ 11
Objective of the pilot project ................................................................................................. 13
Study Area .................................................................................................................................. 14
Satellite Data .............................................................................................................................. 15
Field Survey Data (Ground Truth) ...................................................................................... 16
Methodology ............................................................................................................................... 18
1 Calculation of NDVI and LSWI mean value .............................................................. 18
2 Hierarchical Decision Rule ............................................................................................ 20
3 Image Classification ......................................................................................................... 21
Results & Outputs ................................................................................................................... 26
1 Accuracy assessment ...................................................................................................... 30
2 Kappa coefficient ............................................................................................................... 31
3 Identification of current fallows and culturable wastelands .............................. 32
Discussions ................................................................................................................................ 37
1 Salient achievements of the project ............................................................................ 38
2 Linkages ............................................................................................................................... 40
Conclusions ................................................................................................................................ 40
ANNEXURE-A : Village level Analysis ................................................................................ 42
ANNEXURE-B: Tahsil level analysis ................................................................................... 43
ANNEXURE-C: Comparison of results from remote sensing with secondary
sources ......................................................................................................................................... 48
ANNEXURE-D: Growing fodder on village wastelands : Case Study of
Madanagadh Village ................................................................................................................ 49
References ................................................................................................................................... 50

9
Executive Summary
India is the largest producer of milk in the world. The most important
aspect of milk production in our country is that it is a major source of
livelihood for a large proportion of the rural population, especially small
holder farmers. About 80 percent of dairy farmers are small and
marginal, typically owning one to three milk producing animals and
contribute about 70 percent to the total milk production. Improving
productivity in our dairy sector can potentially contribute to improved
food security and stability of national milk prices, in addition to
improving the incomes of millions of small holder milk producers.
One important way in which the productivity can be improved is to
improve availability of feed and fodder for the bovine animals. However,
less than 5 per cent of the cultivable land is devoted to growing fodder
crops, though the contribution of the livestock sector to the agriculture
GDP (at constant prices) is higher than that of cereals (2012-13).
Indian Space Research Organisation (ISRO) has successfully developed
the crop production forecasts (FASAL) technology, for major food crops,
using remote sensing techniques. This pilot project, which is first of its
kind in the country, had been initiated in collaboration with Space
Applications Centre (SAC), ISRO, to explore, whether remote sensing
techniques could be utilised in estimating the area under fodder crop and
the extent of availability of current fallows and culturable wastelands, with
their geographical locations.
Fodder crops are normally grown sparsely and in very small plots by our
farmers, typically one hectare or less. This makes the job of
discrimination of these crops through remote sensing quite challenging.
This pilot project could estimate the area under green fodder crops
in Banaskantha district (81 thousand hectares) and the fallow areas
& culturable wastelands (57 thousand hectares) with 77% accuracy
level. It could also demarcate these areas on a GIS platform.

10
The main learning and possible way forward, which emerges out of this
pilot project, can be summarised as below,
a) It is feasible to assess green fodder availability for bovine livestock
at disaggregated level (district/sub-district) through remote
sensing, which could be an important input to various fodder
development programs or program components viz. Accelerated
Fodder Development Program (AFDP), National Livestock Mission
(NLM), MGNREGA, NDP-I, Watershed, etc.
b) It can act as a decision making tool for monitoring and planning of
fodder development activities by all the stakeholders in the dairy
sector, particularly as part of drought management in fodder deficit
areas.
Department of AH,D&F, Ministry of Agriculture, GOI had been
discussing with ISRO to explore the potential of geospatial technology, to
evolve a national study on the assessment of feed and fodder for the
livestock at disaggregated level e.g., district / tahsil level, to start with
and identify the measures for ensuring the availability of fodder on a
sustainable basis.
In this effort, ISRO can collaborate with NDDB for getting ground truth
(village level data) through its country wide network of Milk Unions, while
research organisations like NDRI & IGFRI can be co-opted for developing
models for fodder cropping pattern and establish fodder production
forecasting.
As an end result, ISRO can provide information on season wise, remote
sensing based estimates on area under fodder crop & current fallow &
culturable wastelands in a GIS platform, for dissemination to Milk
Unions and other stakeholders in the dairy sector.

11
Introduction
Development and growth of bovine livestock are highly associated with
the scope of availability of fodder from cultivable land, forest, pastures
and grazing lands. Traditionally, cattle grazed on the pastures and
grazing lands are supported by feeding crop residues or straw of jowar,
bajra, wheat, maize, paddy etc. supplemented with some green fodder.
The economic viability of bovine animal husbandry heavily depends
on sources of feed and fodder, as feed and fodder costs account for
around 70 percent of the total cost of milk production. The feed given
to cattle comprises of dry fodder, green fodder and concentrates. The
adequate supply of nutritive fodder and feed is a crucial factor impacting
the productivity and performance of the animals.
One of the main reasons for the low productivity of our livestock is
under-nutrition either due to lack of adequate quantity or lack of
balanced rations, beside the low genetic potential of the animals.
From Table-1 below, it is evident that the country is highly deficient in
respect of availability of green fodder, dry fodder and concentrates. The
deficit gap of availability vis-à-vis the requirement of green fodder is huge
at 665.80 million MT (62.76 %) and 138 million MT (23.46 %) for dry
fodder. The deficit of concentrates also found to be more than 30 percent.
The fodder and feed deficit varies across states and found more acute
and chronic in arid and semi-arid states where farming is highly
dependent on rainfall and have large livestock population.
Table-1 : Requirement and availability of fodder in the country – 2010.
Year Feed
Resources Availability
(Million Tons)
Requirement
(Million Tons)
Balance
(Million
Tons)
%
Deficit
2012
Dry 375 480 -105 -22 Green 614 820 -206 -25 Concentrate 55 82 -27 -33
2025 (Projected)
Dry 433 550 -117 -21 Green 600 1000 -400 -40 Concentrate 65 105 -40 -38
Source: National Institute of Animal Nutrition and Physiology (NIANP):ICAR 2012

12
About 29 Million hectare area in the country falls under the category of
open forests with less than 0.4 canopy density, which can be developed
with fodder trees. Further use of quality fodder seeds including dual
purpose grains like Bajra, Maize and Jowar, etc. could improve the
availability of feed and fodder multiple times.
The chronic shortage of feed and fodder resources during the last few
decades particularly the shortage has been severe in the Eastern region,
as compared to other regions. This could be attributed to the growing
livestock population, low productivity and less emphasis on forage
cultivation by the livestock owners.
To increase the fodder production, concerted efforts are needed to
develop community pastures with improved grasses and cultivation of
fodder on current fallows and marginal land areas. Suitable measures to
increase bio-mass production on current fallows, wastelands and
common grazing lands needs to be taken up expeditiously. Silvi-pastures
in wastelands and available degraded forest lands can also be taken up.
In fact, the National Livestock Mission addresses these issues
comprehensively, however ground level monitoring and
implementation is a challenging task, due to lack of sufficient data
on area under fodder crop, varieties of fodder crops grown and
fodder production.
The fodder crops as assessed in 2010-11 in major fodder growing states
are shown below in Table-2.
Table-2 : Area under fodder crops in 2010-11
Sr. Study States Area ‘000 ha
1 Rajasthan 3287
2 Maharashtra 969
3 Uttar Pradesh 831
4 Gujarat 821
5 Punjab 540
6 Madhya Pradesh 462
7 Haryana 408
8 Tamilnadu 195
13
9 Andhra Pradesh 85
10 Jammu & Kashmir 53
11 Karnataka 35
12 Uttarakhand 35
13 Bihar 18
14 West Bengal 3
15 Others 27
All India 7769
Source: Basic Animal Husbandry Statistics-2014, DAHDF, GOI
Rangeland and pastures have been identified as one of the Societal
Benefit Areas (SBA) identified by Group of Earth Observation System of
Systems (GEOSS), Headquartered in Geneva, which observed that the
fast changing international environment in terms of food supply and
climatic change enhances the need for rangeland monitoring in
developing countries also.
With the experience gained so far in national level agricultural production
forecasting through remote sensing under ‘FASAL’ project, it was thought
prudent to attempt fodder crop assessment and suggests ways for
improving fodder production areas, as these are crucial inputs in the
dairy sector.
In this project IRS LISS-III multi-date data is used to discriminate
food crops and fodder crops in the study area during October 2014
to March 2015. The major fodder crops grown in study area are Pearl
Millet, Sorghum, Lucerne, Cowpea, Guinea Grass, Maize, Oats, and
Chicory.
Objective of the pilot project
Identification/discrimination between food crops and fodder
crops at district level.
Identifying suitable areas of current fallows and culturable
wastelands at district level, for green fodder cultivation.

14
Study Area
Banaskantha district, Gujarat was chosen as a study district for
demonstration purpose. It lies between parallels of latitude 23° 49' and
24° 42' and the meridians of longitude 71° 1' and 73° 0' (Figure-1). The
area covered by the district is 10,757 sq. km. (5.49 %).The district is
located in the Northeast of Gujarat and is presumably named after
the Banas River which runs through the valley between Mount
Abu and Aravalli Range, flowing to the plains of Gujarat in this region
and towards the Rann of Kutch. It has twelve tahsils namely Deesa,
Dantiwada, Bhabhar, Vav, Kankrej, Deodar, Tharad, Dhanera, Danta,
Vadgam, Amirgadh and Palanpur. Deesa is famous for its potato market.
Some parts of the district are flat and some are hilly and full of small
hills and hillocks.
The district is facing a problem of high incidence of poverty, low
employment availabilities in lean agriculture seasons, acute shortage of
water resources for both, drinking and irrigating crops, frequent drought
and distress migration of big livestock holders along with livestock in
summer season. Livestock and dairying plays the dominant role in
the economy of the district.

15
Figure-1 : Banaskantha district, Gujarat
Satellite Data
Multi-temporal cloud-free digital data from Indian Remote sensing
satellite (IRS-P6) LISS-III was acquired during Rabi Season (October-
April). IRS, LISS-III data is provided by SAC-ISRO as shown in Table-3,
below. The study area lies in two LISS-III scenes of 093-55 and 092-55
(Figure-2). The satellite data was imported into ERDAS IMAGINE 9.1
software in an image format for geometric rectification.

16
Figure-2 : Geo-referenced FCC of Jan.12, 2015, Path: 92 Row: 55
Table-3 : Multi-date LISS-III data information
No Date Path/Row
1 Oct.08,2014 92/55
2 Oct.13,2014 93/55
3 Nov.01,2014 92/55
4 Nov.241,2014 93/55
5 Nov.30,2014 93/55
6 Dec.19,2014 92/55
7 Dec.24,2014 93/55
8 Jan.12,2015 92/55
9 Jan.17,2015 93/55
10 Feb.05,2015 92/55
11 Feb.10,2015 93/55
12 Mar.25,2015 92/55
13 Mar.30,2015 93/55
14 Apr.18,2015 92/55
Field Survey Data (Ground Truth)
Field surveys were carried out three times, in the duration, as shown
below,
1st: 12-13 February 2015,
2nd: 17-19 February 2015
3rd: 16-17 April 2015

17
The project team visited 69 villages to collect 169 Ground Truth (GT)
points across the district. Villages were selected in consultation with
Banaskantha Milk Union, based on their knowledge about villages
growing fodder in significant amount.
The third field survey was carried out for verification of fodder growing
areas. These points were preselected randomly from the classified
imagery and the project team navigated to the exact point using
GPS and Google Maps. Ground Truth (GT) was done by matching the
pattern, shape and size of the field from the FCC for a particular
topographic feature using GPS locations.
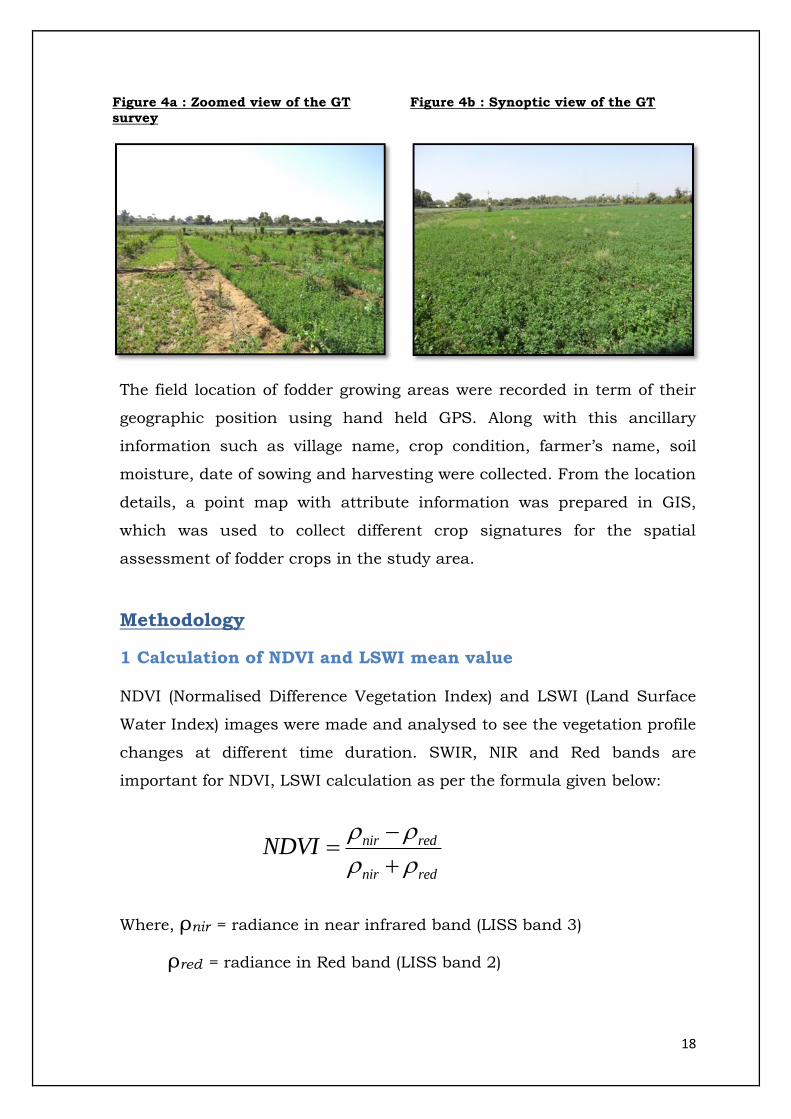
To illustrate, ground truth sheet (Figure-3), zoomed view (Figure-4a) and
synoptic view (Figure-4b) of a fodder growing plot in Village: Dhedhal
Tahsil : Deesa, is presented below.
Figure-3 : Ground truth sheet of fodder crop [Village: Dhedhal, Tahsil: Deesa]
18
Figure 4a : Zoomed view of the GT
survey
Figure 4b : Synoptic view of the GT
The field location of fodder growing areas were recorded in term of their
geographic position using hand held GPS. Along with this ancillary
information such as village name, crop condition, farmer’s name, soil
moisture, date of sowing and harvesting were collected. From the location
details, a point map with attribute information was prepared in GIS,
which was used to collect different crop signatures for the spatial
assessment of fodder crops in the study area.
Methodology
1 Calculation of NDVI and LSWI mean value
NDVI (Normalised Difference Vegetation Index) and LSWI (Land Surface
Water Index) images were made and analysed to see the vegetation profile
changes at different time duration. SWIR, NIR and Red bands are
important for NDVI, LSWI calculation as per the formula given below:
Where, ρnir = radiance in near infrared band (LISS band 3)
ρred = radiance in Red band (LISS band 2)
nir red
nir red
NDVI

19
For LSWI, SWIR and NIR bands are important, as per its formula
)LSWI =
)
nir swir
nir swir
Where, ρnir = radiance in near infrared band (LISS band 3)
ρred = radiance in SWIR (LISS band 4)
Next, date wise layer stack of all NDVI and LSWI image were made and
overlaid on the Banaskantha district boundary and GT points (fig.5).
Figure-5 : Layer stack of NDVI images for all date with GT coverage and Tahsil
boundaries
The spectral profiles of all the pixels of both LSWI and NDVI images will
differ as per its vegetation stages and reflectance.
To illustrate, Figure-6 below, represents the NDVI and LSWI spectral
profiles for the current fallow land of Village: Ujjanvada, Tahsil
:Bhabhar Similar spectral profiles were created for all GT points.

20
Figure-6: NDVI and LSWI Spectral profiles
2 Hierarchical Decision Rule
Hierarchical decision rule was used to mask classes of non-
agricultural area i.e. Forest, Scrubland, Water, Sand, Wet soil, and
X-axis (date)
1. Oct.8,2014
2. Nov.24, 2014
3. Dec.19, 2014
4. Jan.12, 2015
5. Feb.05, 2015
6. Mar.25, 2015
7. Apr.18, 2015

21
Fallow land. NDVI and LSWI stack file are used to mask non-
agricultural area. Classes were defined based on different values of
NDVI. Sometimes, when the mean NDVI values were not sufficient, at
that time LSWI mean values were used. Conditional functions were
defined in the model for generating mask of non-agricultural areas
currently not under cultivation as shown in Figure-7 below.
Figure-7 : Model development for generating mask image of non-agriculture area
3 Image Classification
The automatic classification process in ERDAS IMAGINE uses the
colours or spectral patterns of raster cells in a multi spectral image to
automatically categorize all cells into a specified number of spectral
classes. The relationship between spectral classes and different surface
material or land cover type may be known before hand or determined
after classification by analysis of the spectral properties of each class.
The automatic classification process offers a variety of classification
method as well as tools to aid in the analysis of the classified result. In
Automatic Classification process it combines classes of raster cells and
produces a classification raster. This process is designed for using a co-

22
registered set of rasters, which represents a multispectral image. The
basic requirement for the Automatic Classification process is that input
raster represent continuous (non-categorical) data, and have the same
extent, map projection, and cell size.
The Automatic Classification process provides several classification
methods; each method uses numerical methods to compare the spectral
patterns of all cells and assigns cells with similar patterns to the same
class. The process automatically categorizes cells in an image into
spectral classes, which can be related by the interpreter to specific
surface materials or land cover types. The success of the unsupervised
methods is based on the premise that the input raster dataset includes
natural statistical groups of spectral patterns that represent particular
types of physical features. All of the unsupervised classification methods,
except simple One-Pass Clustering, use an interactive process to analyse
a set of sample input cells and determine a set of class centre and
associated statistical properties. The entire input raster set is then
processed, and a classification rule is used to assign each raster cell to
one of the defined classes.
An unsupervised classification (ISODATA Clustering) technique was
performed using combination of all NDVI dates to create a mask of non-
agriculture and fallow and forest area area. Second iteration of
unsupervised classification (ISODATA Clustering) technique was applied
to segregate fodder growing areas in the district.
The ISODATA algorithm analyses a sample of the input to determine a
specified number of initial class centres. Cells are assigned to classes by
determining the closest class centre (minimum Euclidean distance). After
each classification step, the process calculates a new centre for each
class by finding the mean vector for each class. At the beginning of each
iteration the process evaluates the set of classes produced by the
previous steps. Large classes may be split on the basis of a combination
of factors, including the maximum standard deviation for the class,

23
average distance of class samples from the class centre, and number of
sample cells in the class. If the distance between the centres of a pair of
classes falls below a user-defined threshold, the classes are combined. If
the number of cells in a class falls below a user-defined threshold, the
class is discarded, and its cells are reassigned to other classes. Iterations
continue until there is little change in the location of class centres in
successive iterations, or until the maximum allowed number of iterations
is reached.
Some classes presenting profile like fodder are mixed with other crops,
while some of the fallow land classes are covered in forest, hilly area,
road, etc. To overcome these problems, LSWI image were used for
unsupervised classification in second iteration with 20 classes and 30
iterations. Each class was identified based on the signature profile of
collected GT points. Histogram of classified fodder classes were generated
to account for the number of fodder pixels within the district. The flow
diagram of the procedure is shown in Figure-8a and Figure-8b below,

24
Figure-8a: Remote Sensing Data Analysis Procedure
D1 Image
NDVI & LSWI Computation
Hierarchical Decision
Rule Classifier
Data Loss & Non
agriculture Pixels
Agricultural /
Cropped Pixels Crop Area
Multi-Date Data Set
D2 Image
Image-to-Image Registration
Base Image
Master Image: Registered on Map

25
Figure-8b : Methodology for Fodder Area Estimation
Georeferenced High
Resolution Data
Thematic
Covers GT
General GT Intensive
Crop Acreage Accuracy
Assessment
Final
Estimates
DN to Radiance
Geo-referencing Base
Image
Relative Radiance
Normalization
VI Indices
Multiple Classifiers
(Hierarchical, ISODATA etc.)
LISS-III D1 LISS-III D2 LISS-III Dn

26
Results & Outputs
Classification of signatures play important role in crop identification.
Classification was applied separately on both LISS-III scenes (92/55 and
93/55) and a mosaic of these scenes were prepared. Identification of
agricultural and non-agriculture land-use like canals, water bodies,
railway lines, roads, forest area, etc. was done using hierarchical decision
rule analysis. Agriculture area was extracted for further analysis after
masking out the non-agricultural areas. Fodder crops and other
competitive crops, scrub lands and fallow lands formed part of the derived
agricultural areas. The agricultural areas were classified using ISO-DATA
clustering. Figure-9 shows a GT point of fodder crop overlaid on satellite
imagery of different dates. data different classes were marked based on
different temporal spectral profile of various fodder crops like lucerne,
oats, chicory, maize, etc. as shown in Figure-10 as an illustration ,
Figure-9 : GT point of fodder crop overlaid on satellite imagery of different dates
8-Oct-2014 24-Nov-2014 19-Dec-2014 12-Jan-2015
05-Feb-2015 25-Mar-2015 18-Apr-2015
GT Point of
fodder crop

27
Figure-10 : Spectral signatures of different crops.
Chicory
Here, X-axis (dates)
1. Oct. 08, 2014
2. Nov.24, 2014
3. Dec.19, 2014
4. Jan.12, 2015
5. Feb.05, 2015
6. Mar.25, 2015
7. Apr.18, 2015
Maize Lucerne + Oats

28
Oats
Wheat
Based on the above spectral profile fodder crops were identified. Some
fodder classes were mixed with other crops like cumin and mustard and
castor. To overcome these problems, stack of LSWI images along with
NDVI images were used for better results. Each class was identified
based on the signature and profile of GT point.
As Banaskantha district is covered in two different Path/Row, same
procedure is followed for another adjacent path/row image. Single
mosaic image was created after classifying both the adjacent path
images. Then total fodder area was calculated from mosaic image by
overlaying Banaskantha shapefile based on histogram of classified
image.
Figure-11 below shows the tahsil boundary and classified image of
fodder crops while Figure-12 shows its comparison with False Colour
Composite (FCC) image. The distribution of fodder crops is shown in
yellow colour.
Figure-11 : Classified image for fodder crops

29

30
Figure-12 : FCC overlaid on classified image of fodder crops
This image shows the different fodder crops pixel marked in yellow
colour. Total area under fodder crop is estimated to be 81 thousand
hectare for rabi season.
1 Accuracy assessment
The accuracy assessment involves the comparison of a site on a map
against reference information (GT) for the same site. Accuracy assessment
is essential for comparison between classified imagery and ground truth
data to evaluate how well the classification represents the real world.
Table-4, below, presents the contingency table for accuracy assessment.
Overall Accuracy: Number of correct plots / total number of plots.
Table-4 : Contingency table for accuracy assessment
Plots Fodder Mustard Castor Potato Scrub land
Others Total
Fodder 85 7 1 0 18 7 118
Mustard 1 3 0 0 0 0 4
Castor 1 0 4 0 0 1 6
Potato 0 0 0 4 0 0 4
Scrub Land
0 0 0 0 14 0 14
Others 2 0 0 0 0 18 20

31
Total 89 10 5 4 32 26 166
Total accuracy = = 77 %
Here, diagonals represent sites classified correctly according to reference
data and off-diagonals represent misclassified sites.
2 Kappa coefficient
Kappa coefficient (represented as ) reflects the difference between actual
agreement and the agreement expected by chance. For example, of
0.85 means there is 85% better agreement than by chance alone. is
useful to compare two error matrices, cells in error matrix according to
severity of misclassification provide error bounds on accuracy.
Table-5 below provides the contingency table for the Kappa coefficient
Table-5 : Contingency table for kappa coefficient
Class types determined from reference source
User
Accuracy
(%)
Cla
ss t
ypes d
ete
rmin
ed f
rom
cla
ssif
ied m
ap
Plot Size Fodder Mustard Castor Potato Scrub
land Others Total
Fodder 85 7 1 0 18 7 118 72
Mustard 1 3 0 0 0 0 4 75
Castor 1 0 4 0 0 1 6 66
Potato 0 0 0 4 0 0 4 100
Scrub
Land 0 0 0 0 14 0 14 100
Others 2 0 0 0 0 18 20 90
Total 89 10 5 4 32 26 166
Producer
Accuracy (%) 95 30 80 100 44 69 77

32
Computation of Coefficent of Agreement
= (85+3+4+4+14+18) = 128
= (118 x 89) + (4 x 10) + (6 x 5) + (4 x 4) + (14 x
32) + (20 x 26)
=11556
= = 60.57%
While the accuracy level was 77%, the Kappa coefficient was found
to be 60.57%.
3 Identification of current fallows and culturable wastelands
The spatio-temporal analysis of the region was done using multi-date IRS
Resourcesat2 satellite data of LISS-III sensor of 24 m resolution to
determine the region within the district. The data were geo-referenced and
converted to radiance values using radiometric calibration. After these
pre-processing, the NDVI and LSWI of all the multi-date images were
generated and stacked together. An unsupervised classification (ISODATA
Clustering) technique was performed using combination of all NDVI and
LSWI dates to create a mask of non-agriculture and fallow and forest area
. Classification was carried out using Classifier Module of ERDAS Imagine
Software. Non-agriculture areas were delineated through clustering by
their typical NDVI values throughout the season. Discrimination of
clusters of fodder crops and other rabi crops were done through their
growth pattern as seen in spectral-temporal profiles.

33
Initially large classes of permanent fallow that are saline soil, hilly area,
water bodies and other forest were eliminated from the images using
hierarchical decision rule classification . The permanent fallow lands have
very low NDVI values throught the season. Profile rarely changes in case
of saline soil because it remains permanently fallow during the entire
season and its spectral reflectance remains below 0.2 NDVI values. Same
is the case of road, railway, canal and water bodies having similar
permanent spectral profiles every time. One the other hand, the profile of
forest peak at the some specific period. Thus depending upon profiles
these non-agricultural area were discriminated from agricultural area
using Hierarchical decision rule.
To classify remaining agricultural classes (like fodder and other
competitive crop signature according to Ground Truth (GT) data) ISO-
DATA clustering technique were used. Current fallow land and fodder
crops signatures were identified using this technique. The signature
reflecting low NDVI for maximum duration, were considered as fallow
land or wastelands. Then total current fallow land and wasteland area
was calculated from histogram of classified pixels of fallow land.
Figure-13 below shows the distribution of fallow land within tahsil
boundary and Figure-14 shows its comparison with FCC image to
ascertain the location of fallow and wastelands in the rabi season.
Figure-13 : Classified image for Current Fallow land

34
Figure-14 : Classified image for Current Fallow land with FCC
Using the classified image analysis shows that the entire central belt
shows high proportion of cultivable land under fodder crop in the
category (12-20% of the cultivable land as fodder crop) underlying
the importance of bovine livestock & dairying in Banaskantha district as
shown in Figure-15.
Figure-15 : Proportion of fodder crop area out of cultivable land

35
Figure-16 below shows that Vav, Tharad & Bhabar tahsils have the
highest amount of current fallow & culturable wastelands. About 10-15
percent of the current fallow and culturable wastelands fall in the
western part of the district which are mostly drought prone. Fortunately,
these tahsils are now getting irrigation from the “Sujalam Sufalam”
schemes, thus it is expected that area under fodder crops would increase
substantially with increase in bovine livestock population. Similar
observations have been shown by Govt. of Gujarat District Statistics
Abstract of 2013 given in Annexure C.
Figure-16 : Proportion of current fallow & culturable wastelands out of cultivable
land

36

37
Discussions
The salient objective of this pilot project was to explore whether remote
sensing technology has any utility in the context of the development of
dairy sector, particularly in fodder development.
It is observed that the availability and reliability of statistics related
to districtwise or tahsil wise area under fodder crops is not up to the
standards desired. Further, no statistics or maps are available on
segregation of area under major fodder crops, which is important in
planning for feed and fodder development.
National Livestock Mission under its sub-mission (component 7.3.1) on
Feed & Fodder Development calls for fodder production from non-forest
wasteland/ rangeland/ grassland/ non-arable land with 75% Central
assistance and 25% State share. The funding support consists of
maximum per hectare ceiling of Rs. 1 Lakh for CPR, Gochar land
/community land / waste land, which need treatment of soil and Rs.
0.85 Lakhs per hectare, which does not need such treatment. Further, an
amount of Rs. 30,000 per hectare has been provided for individual
farmer, who will cultivate fodder crops in own/leased land for a
minimum of 3 years. Implementing agencies designated are: Department
of Animal Husbandry/ Agriculture of the States. States may also involve
NGOs, SHGs, Corporations, Milk Cooperatives/ Federation / Central and
State Agriculture or Veterinary Colleges / Universities.
However, statistics of grasslands available with the implementing agency
and present status of requirement and availability of green and dry
fodder are not readily available. Many village dairy co-operatives have on
their own initiative are engaged in green fodder production for their
member milk producers. These institutions can take the benefit of the
funding support available under National Livestock Mission, as
mentioned above (Annexure-A).

38
1 Salient achievements of the project
This pilot project (duration Jan-May 2015), which was first of its
kind in the country, was able to achieve the following,
(a) Estimation of area under fodder crop for a particular season in a
particular sub-district (tahsil) also mapping it on a digital GIS
platform, whereas secondary sources may provide only annual data
district wise, that too only in some States.
(b) Estimation of the current fallow & culturable wastelands and also
mapping it on a digital GIS platform.
(c) With the active support of Milk Union and village dairy co-operative
societies, individual farmer/ plot level data could be collected with
ease and accuracy in different phases.
(d) Methodology for assessment of the aforesaid was developed and
tested using remote sensing technology with an accuracy level of
77%.
(e) The most important way forward maybe that the aforesaid
information can be analysed periodically and shared over a GIS
platform with the stakeholders, particularly the Milk Unions for their
programs on feed and fodder development in deficit areas. The Milk
Unions and village dairy co-ops may provide this information to
various GOI/State level schemes like AFDP, MGNREGA, Watershed,
NLM for initiating programs for fodder development in identified
villages.
(f) For example, in this pilot project, it was found that in Banaskantha
district, Gujarat, 46% of the villages are cultivating fodder crops in
more than 10% of the cultivable land available in their village,
underlying the importance of fodder crops in the agricultural
economy of the district (At the national level , 4.6% of the cultivable

39
land is utilised for growing fodder crops and the Working Group on
Livestock for 12th FYP had suggested a norm of atleast 10%).
Further, there is considerable scope in improving fodder production
in atleast 35% of the villages, where the current fallows & culturable
wastelands constitute more than 5% of the cultivable land
(Annexure-A).
(g) Observing at the sub-district (tahsil) level, we find that there is a
strong correlation between area under fodder crops and the
population of bovines (correlation coefficient is 0.9). Palanpur
tahsil was analysed in detail, as a case example, juxtaposing the
remote sensing image analysis with the LULC (Land Use Land Cover)
sourced from NRSC. Due to improvement in irrigation facilities
(between 2011-12 & 2005-06), the area under double/triple cropping
has increased by around 25% while current fallow decreased by 15%
and scrublands & other wastelands have decreased marginally.
Significantly, fodder crops are predominantly grown in the southwest
and southeast portions interspersed with main crops, while large
tracts of current fallow & culturable wastelands exists in the central
part of the tahsil (Annexure-B).
(h) The proportion of fodder crop areas as well as current fallow &
culturable wastelands determined through remote sensing when
compared with District Statistical Abstract (DSA), Govt. of Gujarat
show somewhat similar results. Though both the sources are not
strictly comparable, since the remote sensing duration refers to rabi
season only for the FY 2014-15, whereas the DSA refers to the
complete FY 2013-14 (which was the latest data available with us)
(Annexure-C).
(i) It was also possible to categorise and locate and map within the
tahsil (a) the fodder crop areas and (b) current fallows & culturable
wastelands, on a digital GIS platform. Thus, these can act as decision

40
support tools at the Milk Union level. The identified tahsils (sub-
districts) which have relatively higher area under fodder crops,
can be an important input for promoting intensive fodder
cultivation by providing good quality fodder seeds to dairy
farmers in these places.
ISRO has already developed the crop production forecasts (FASAL)
technology, for major food crops, however looking at dairy sector, which
in terms of contribution to GDP in the economy exceeds cereal crops, it is
important that a similar technology is developed and put in place for
fodder crops.
2 Linkages
Use of remote sensing technology in the dairy sector can also provide
technical inputs in following areas to important stakeholders, as below,
(a) Input to dairy sector on bovine carrying capacities of the milkshed
area and managing fodder scarcity during droughts.
(b) Input to dairy sector on location of fodder crops, fodder crop
production levels (in terms of biomass) /fodder crop area area
estimates in rabi & summer seasons (zaid)
(c) Input to Farming Systems Analysis program (ICAR Modipuram)
(d) Input for societal benefit areas on global rangeland assessment, as
identified by the GEOGLAM project. Global Earth Observation
System of Systems (GEOSS) through a coordination of remote sensing
activities around the globe has launched the “Global Agricultural Geo-
Monitoring” (GEOGLAM) project for advancement of sustainable
agriculture.
Conclusions
Department of AH,D&F had been discussing with ISRO to explore the
potential of geospatial technology to evolve a national study on the
assessment of feed and fodder for the livestock at disaggregated level e.g.,

41
district / tahsil level, to start with and identify the measures for ensuring
the availability of fodder on a sustainable basis.
Indian Grassland & Fodder Research Institute (IGFRI), Jhansi has been
instrumental in fostering research, training and extension programmes
on all aspects of forage production and utilization through inter-
disciplinary approach. It has been generating and disseminating
technologies for enhanced quality of forage and livestock productivity in
socio-economic and environmental perspectives.
In view of the growing importance of the dairy sector in the agricultural
economy and as it is forecasted that there would be significant shortage
of feed & fodder in the years to come, it may be prudent to scale up the
current pilot project to the State and district level to begin with.
In this context, the participation in fodder crop monitoring through
interaction with NDDB, Anand (National Dairy Development Board),
NDRI, Karnal (National Dairy Research Institute) and Indian Grasslands
& Fodder Research Institute (IGFRI), Jhansi would enable getting in-situ
ground truth data required for in-season fodder assessment. In return,
ISRO can provide remote sensing data for these sites during the crop
growing period. This will be mutually beneficial for all the
stakeholders to know the developing cropping pattern and
establishing procedures for fodder production forecasting.
Further the assessment of feed and fodder for livestock at
disaggregated (district/sub-district) level could be an important
input to various fodder development programs or program
components viz. Accelerated Fodder Development Program (AFDP),
National Livestock Mission (NLM), MGNREGA etc as well as for
important stakeholders like co-operative Milk Unions, Livestock
Boards and DAHDF. This would also meet a much awaited
requirement in the dairy sector as currently there are hardly any
regular and reliable statistics on fodder production in the country.

42
ANNEXURE-A : Village level Analysis
Table-6 : Proportion of villages having significant fallow & culturable wastelands
Number of Villages *
% of Villages % Current Fallow + Culturable Wasteland Area out of available
cultivable land #
187 23 0-2%
329 41 2-5%
203 25 5-8%
83 10 > 8%
Around 35% of villages have more than 5% of the cultivable land which are
lying as current fallow and/or culturable wastelands.
Table-7 : Proportion of villages having significant land under fodder crops
Number of
Villages * % of Villages
% Fodder Crop Area out of
available cultivable land
251 22 0-5%
369 32 5-10%
297 26 10-15%
141 12 15-20%
97 8 > 20%
Around 46% of villages are cultivating fodder crops which are more than
10% of the cultivable land available in their village
* Excludes villages which are outliers or do not have sufficient data for analysis
# Excludes Danta tahsil

43
ANNEXURE-B: Tahsil level analysis
Figure-17 : Current fallows & Culturable Wastelands and Fodder growing areas in
Banaskantha district shown tahsilwise, as analysed by remote sensing during Rabi
season 2014-15.
Table-8 : Tahsilwise information on land, bovine livestock & dairying
TA
HSIL
Cu
ltiv
able
lan
d (H
a)
1
CU
RR
EN
T F
ALLO
W
+ C
ULTU
RA
BLE
WA
STE
LA
ND
S (H
a.)
% C
UR
RE
NT
FA
LLO
W +
CU
LTU
RA
BLE
WA
STE
LA
ND
S 1
FO
DD
ER
GR
OW
N
(Ha.)
% F
OD
DE
R A
RE
A 1
PR
OC
UR
EM
EN
T
(TLPD
) 2
CO
WS
3
BU
FFA
LO
3
TO
TA
L B
OV
INE
S
AMIRGADH 18389 1787 9.7 3663 19.9 35 32463 29214 61677
BHABHAR 36198 5261 14.5 5011 13.8 39 26469 44325 70794
DANTA 27453 5 0.0 4130 15.0 120 64158 59200 123358
DANTIWADA 26980 1365 5.1 3331 12.3 119 27271 39564 66835
DEESA 118495 5002 4.2 17156 14.5 442 13187
8 128344 260222
DEODAR 51691 3067 5.9 7282 14.1 152 45079 88514 133593
DHANERA 71754 3596 5.0 7704 10.7 394 47211 106602 153813
KANKREJ 70733 3065 4.3 7556 10.7 144 38772 118979 157751
PALANPUR 61994 3176 5.1 7036 11.3 391 56621 83620 140241
THARAD 120428 14333 11.9 10372 8.6 248 67794 96337 164131
VADGAM 43896 2019 4.6 5300 12.1 436 56289 81655 137944
VAV 137109 14101 10.3 4242 3.1 102 60162 68992 129154
BANASKANTHA 785120 56777 6.7 82782 12.2 2621
654167 945346 1599513

44
1. Percentage of total cultivable land as per District Statistical Abstract 2013-14, Cultivable land is defined as Reported Area - Forests - Barren and Unculturable land - Non Agricultural land - Permanent
Pastures and Grazing lands
2. Source District Statistical Abstract 2013-14
3.Source : http://banaskanthadp.gujarat.gov.in/banaskantha/shakhao/pasupalan/pasudhan.htm (Livestock Census 2007)
The correlation coefficient between green fodder grown area and
bovine livestock population (assuming growth rate for all tahsils
are same between 2007 & 2012) is observed to be very high, around
0.9.
Land under fodder crop is more than 10% of the cultivable land except in
Tharad & Vav tahsil, which however (along with Bhabar tahsil) have more
than 10% of the cultivable land as current fallow & culturable wastelands.
Efforts can be made in developing these areas utilising the funding
support under National Livestock Mission, by the village level
dairy co-operatives.

45
Figure-18 : Current fallows & Culturable Wastelands and Fodder growing areas in
Palanpur tahsil , as analysed by remote sensing during Rabi season 2014-15
Figure-19 : Land Use Land Cover (LULC) Map of Palanpur Tahsil 2005-06

46
Figure-20 : Land Use Land Cover (LULC) Map of Palanpur Tahsil 2011-12
Table-9 : Comparison of changes in Land Use Land Cover (LULC) between
2005-06 and 2011-12 for Palanpur tahsil

47
Landuse Landcover
Category
2005-06 2011-12
Area change
(2011_12 -
2005_06)
(hectares)
%
change
in area
BUILT UP 1209 1442 234 19
KHARIF 8598 6252 -2346 -27
RABI 11516 5755 -5761 -50
ZAID 0 2634 2634 NA
DOUBLE_TRIPLE 26879 33507 6628 25
CURRENT FALLOW 7706 6576 -1131 -15
DECIDUOUS FOREST 2010 2109 99 5
SCRUB/DEGRADED 25 29 4 16
OTHER WASTELAND 406 388 -18 -4
SCRUBLAND 13520 12927 -594 -4
WATER BODIES 1109 1360 250 23
Area in Hectares
Area under double/triple cropping has increased by around 25% (as single
season crop area e.g. Kharif & Rabi reduces and Zaid season crops are
introduced).
The current fallow decreased by 15% and scrublands & other wastelands
have decreased marginally, showing more and more of such areas are
being brought under cultivation .
Figure-21 : Land Use Land Cover (LULC) change in Palanpur tahsil (2005-06 &
2011-12)
48
ANNEXURE-C: Comparison of results from remote sensing with secondary sources
Table-10 : Tahsilwise % area of total cultivable land under (a) current
fallow & culturable wastelands & (b) fodder crop from Remote Sensing
(2014-15 Rabi Season)
TAHSIL
CURRENT FALLOW &
CULTURABLE
WASTELANDS
FODDER CROP
AMIRGADH 9.7 19.9
BHABHAR 14.5 13.8
DANTA * 15.0
DANTIWADA 5.1 12.3
DEESA 4.2 14.5
DEODAR 5.9 14.1
DHANERA 5.0 10.7
KANKREJ 4.3 10.7
PALANPUR 5.1 11.3
THARAD 11.9 8.6
VADGAM 4.6 12.1
VAV 10.3 3.1
TAHSIL
AVERAGE 6.7 12.2
BANASKANTHA 7.2 10.5
*Excluded from analysis due to data problems
Table-11 : Tahsilwise % area of total cultivable land under (a) current fallow & culturable wastelands & (b) fodder crop from District Statistical Abstract, Govt.of Gujarat (2013-14)
TAHSIL
CURRENT FALLOW &
CULTIVABLE WASTELAND
FODDER CROP
AMIRGADH 4.5 17.5
BHABHAR 1.9 13.8
DANTA 17.3 32.6
DANTIWADA 3.8 26.3
DEESA 4.0 11.4
DEODAR 2.2 14.5
DHANERA 6.1 13.7
KANKREJ 6.8 13.3
PALANPUR 4.7 23.5
THARAD 2.9 12.5
VADGAM 4.2 19.1
VAV 7.6 5.1

49
TAHSIL
AVERAGE 5.5 16.9
BANASKANTHA 5.2 13.9
ANNEXURE-D: Growing fodder on village wastelands : Case
Study of Madanagadh Village
The village level Dairy Co-operative Society (DCS) in Madanagadh Village,
Palanpur Tahsil in Banaskantha district, on their own initiative, had
acquired 25 acres (around 10 hectares) of wastelands on lease from
Gram Panchayat and has developed it for forage production.
Figure -22 : Growing fodder in village culturable wasteland by Madanagadh Dairy Co-operative Society, Village : Madana (gadh), Tahsil: Palanpur, District: Banaskantha
This is managed profitably by the DCS and the green fodder grown here
is provided to the dairy farmers of the village especially the landless.
Around 100 DCS members, who are the beneficiaries of this green
fodder development project, belong to the socio-economically
backward classes and supply milk around 500 litres/day to the
society.
There are many such unutilised wastelands available in the village,
which can be developed further for forage production thus meeting the
green fodder deficit in the village.
The DCS can avail funding support for further fodder development
under National Livestock Mission through co-ordination of the
Banaskantha Milk Union.
Preliminary results under the NDDB-ISRO pilot project, indicate that it is
possible to identify and demarcate such wastelands/ fallow lands in
villages, which can be utilised by the DCSs in the village for meeting the
green fodder shortages. The above example can be a model for other
DCSs to emulate with requisite support.

50
References
1. Andrea S. Laliberte, Ed L. Fredrickson, and Albert Rango. American Society
for Photogrammetric and Remote Sensing. Photogrammetric Engineering &
Remote Sensing. Vol. 73(2), February 2007, pages no 197–207.
2. A.Perumal, SVC.Kameswara Rao, N.Uday Bhaskar ,A Synergistic Approach
towards Sustainable Land Resources Management Using Remote Sensing
and GIS Techniques ,An Indian Experience in the Semi-Arid Tropics under
the National Project ‘Integrated Mission for Sustainable Development’. By
Integrated Surveys Division, National Remote Sensing Agency, Balanagar,
Hyderabad - 500 037 India
3. Ball, Geoffrey H., Hall, David J. 1965. Isodata: a method of data analysis
and pattern classification, Stanford Research Institute, Menlo Park, United
States. Office of Naval Research. Information Sciences Branch
4. Brian D. Wardlow, Stephen L. Egbert, 2007. Large-area crop mapping using
time-series MODIS 250 m NDVI data: An assessment for the U.S. Central
Great Plains. National Drought Mitigation Centre, University of Nebraska–
Lincoln, United States, and Kansas Applied Remote Sensing Program and
Department of Geography, University of Kansas, United States.
5. Jensen, JR. 2005. Introductory digital image processing: a remote sensing
perspective, 3rd Edition, Upper Saddle River, NJ, Prentice Hall. 526pp.
6. Congalton, R. G. and K. Green. 1999. Assessing the accuracy of remotely
sensed data: Principles and practices. Lewis Publishers, Boca Raton.
7. Congalton, R.G. 1991. A review of assessing the accuracy of classification
of remotely sensed data. Remote Sensing of Environment 37:35-46
8. Czaplewski, R.L. and Catts, G.P., 1992. Calibration of remotely sensed
proportion or area estimates for misclassification error. Remote sensing of
Environment, 39, 29 -43.
9. Dadhwal, V.K., Singh, R.P., Dutta, S. and Parihar, J.S., 2002. Remote
sensing based crop inventory: A review of Indian experience. Tropical
Ecology 43 (1): 107-122, 2002.
10. Dutta, S., Sharma, S.A., Khera, A.P., Ajai, Yadav, M, Hooda R.S.,
Mothikumar, K.E. and Manchanda, M.L., 1994. Accuracy assessment in

51
cotton acreage estimation using Indian Remote Sensing satellite data.
ISPRS J. of Photogrammetry and remote Sensing, 49, 21 – 26.
11. Dr. Narayan G. Hegde, 2010. Forage Resource Development in India.
12. Dhananjoy Dutta, 2013. Indian Fodder Management towards 2030: A Case
of Vision or Myopia. International Journal of Management and Social
Sciences Research (IJMSSR) ISSN: 2319-4421, Volume 2, No. 2, February
2013.
13. Banaskantha District Stastical Abstract 2013-14
14. K.P Suresh,G.Ravi Kiran,K.Giridhar and K.T. Sampath,2012. Modeling and
Forecasting Livestock Feed Resources in India Using Climate Variables.
National Institute of Animal Nutrition and Physiology,Bangalore
560030,Karnataka,India.Asian-Aust.J.Anim.Sci.Vol.25,No. 4 :462-470 April
2012.
15. Liu, Jian Guo & Mason, Philippa J. (2009). Essential Image Processing for
GIS and Remote Sensing. Wiley-Blackwell. p. 4. ISBN 978-0-470-51032-2.
16. N.K. Patel, M. Chakraborty, S. Dutta, C. Patnaik, J.S. Parihar, S.C.
Moharana, A. Das, B.K. Sarangi and G. Behera. 2004. Multiple forecasts of
kharif rice in Orissa state – Four year experience of FASAL Pilot Study. J.
Ind. Soc. of Remote Sensing, vol. 32 (2): 125-144.
17. Perry Poulton and Neal Dalgliesh,2015. Evaluating use of remote sensing
for identifying management strategies: Example for small plot farmers
during the dry season insouthern Bangladesh. CSIRO Sustainable
Ecosystems, PO box 102, Toowoomba, Qld 4350, Australia
18. Sharman M. J., 1993. The Agricultural project of the joint research center:
Operational use of Remote Sensing for Agricultural Statistics. Proc. of Int.
symp. “Operationalisation of Remote Sensing” 19-23 April, ITC, Enschede,
The Netherlands.

52


![On the feasibility of detecting Rare Earth Element (REE ...GRSG56]-poster.pdfAmerican Society of Photogrammetry and Remote Sensing Imaging & Geospatial Technology Forum Tampa, Florida,](https://static.fdocuments.in/doc/165x107/5edacd71e2edb459a93eacd2/on-the-feasibility-of-detecting-rare-earth-element-ree-grsg56-american-society.jpg)