Exploring Missing Linkages between the Changing Land … of economic and industrial development that...
24
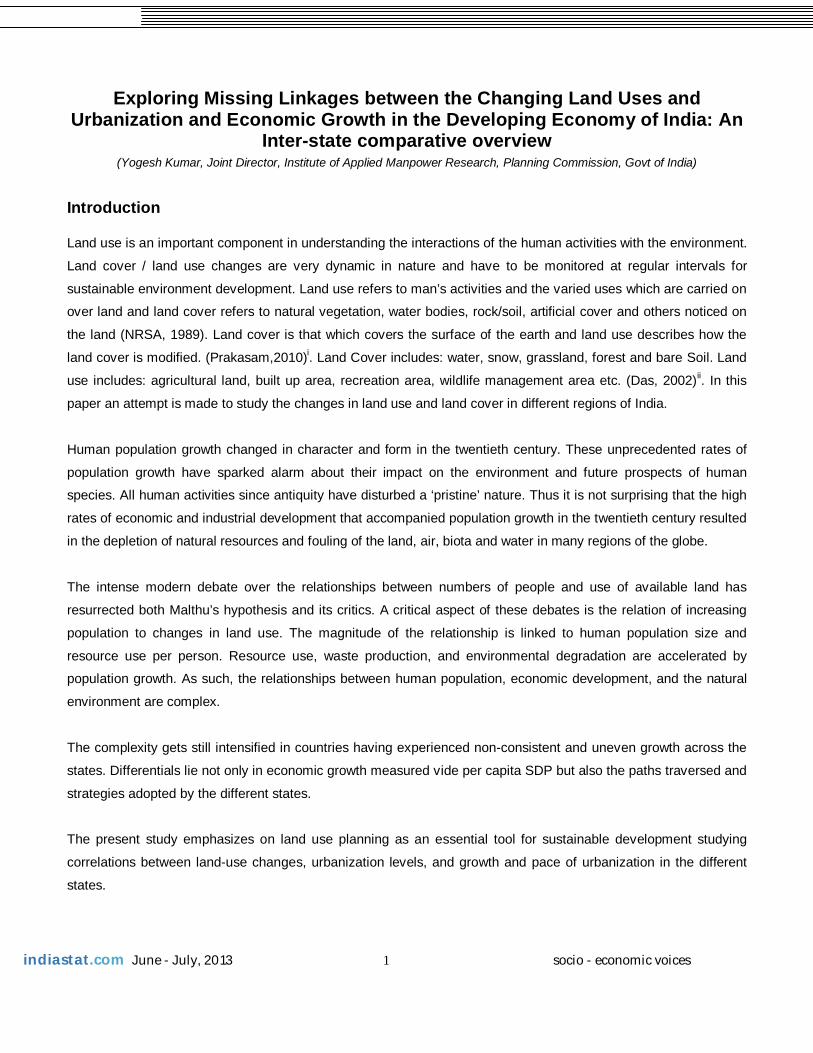
indiastat.com June - July, 2013 1 socio - economic voices Exploring Missing Linkages between the Changing Land Uses and Urbanization and Economic Growth in the Developing Economy of India: An Inter-state comparative overview (Yogesh Kumar, Joint Director, Institute of Applied Manpower Research, Planning Commission, Govt of India) Introduction Land use is an important component in understanding the interactions of the human activities with the environment. Land cover / land use changes are very dynamic in nature and have to be monitored at regular intervals for sustainable environment development. Land use refers to man’s activities and the varied uses which are carried on over land and land cover refers to natural vegetation, water bodies, rock/soil, artificial cover and others noticed on the land (NRSA, 1989). Land cover is that which covers the surface of the earth and land use describes how the land cover is modified. (Prakasam,2010) i . Land Cover includes: water, snow, grassland, forest and bare Soil. Land use includes: agricultural land, built up area, recreation area, wildlife management area etc. (Das, 2002) ii . In this paper an attempt is made to study the changes in land use and land cover in different regions of India. Human population growth changed in character and form in the twentieth century. These unprecedented rates of population growth have sparked alarm about their impact on the environment and future prospects of human species. All human activities since antiquity have disturbed a ‘pristine’ nature. Thus it is not surprising that the high rates of economic and industrial development that accompanied population growth in the twentieth century resulted in the depletion of natural resources and fouling of the land, air, biota and water in many regions of the globe. The intense modern debate over the relationships between numbers of people and use of available land has resurrected both Malthu’s hypothesis and its critics. A critical aspect of these debates is the relation of increasing population to changes in land use. The magnitude of the relationship is linked to human population size and resource use per person. Resource use, waste production, and environmental degradation are accelerated by population growth. As such, the relationships between human population, economic development, and the natural environment are complex. The complexity gets still intensified in countries having experienced non-consistent and uneven growth across the states. Differentials lie not only in economic growth measured vide per capita SDP but also the paths traversed and strategies adopted by the different states. The present study emphasizes on land use planning as an essential tool for sustainable development studying correlations between land-use changes, urbanization levels, and growth and pace of urbanization in the different states.
Transcript of Exploring Missing Linkages between the Changing Land … of economic and industrial development that...
indiastat.com June - July, 2013 1 socio - economic voices
Exploring Missing Linkages between the Changing Land Uses and Urbanization and Economic Growth in the Developing Economy of India: An
Inter-state comparative overview (Yogesh Kumar, Joint Director, Institute of Applied Manpower Research, Planning Commission, Govt of India)
Introduction
Land use is an important component in understanding the interactions of the human activities with the environment.
Land cover / land use changes are very dynamic in nature and have to be monitored at regular intervals for
sustainable environment development. Land use refers to man’s activities and the varied uses which are carried on
over land and land cover refers to natural vegetation, water bodies, rock/soil, artificial cover and others noticed on
the land (NRSA, 1989). Land cover is that which covers the surface of the earth and land use describes how the
land cover is modified. (Prakasam,2010)i. Land Cover includes: water, snow, grassland, forest and bare Soil. Land
use includes: agricultural land, built up area, recreation area, wildlife management area etc. (Das, 2002)ii. In this
paper an attempt is made to study the changes in land use and land cover in different regions of India.
Human population growth changed in character and form in the twentieth century. These unprecedented rates of
population growth have sparked alarm about their impact on the environment and future prospects of human
species. All human activities since antiquity have disturbed a ‘pristine’ nature. Thus it is not surprising that the high
rates of economic and industrial development that accompanied population growth in the twentieth century resulted
in the depletion of natural resources and fouling of the land, air, biota and water in many regions of the globe.
The intense modern debate over the relationships between numbers of people and use of available land has
resurrected both Malthu’s hypothesis and its critics. A critical aspect of these debates is the relation of increasing
population to changes in land use. The magnitude of the relationship is linked to human population size and
resource use per person. Resource use, waste production, and environmental degradation are accelerated by
population growth. As such, the relationships between human population, economic development, and the natural
environment are complex.
The complexity gets still intensified in countries having experienced non-consistent and uneven growth across the
states. Differentials lie not only in economic growth measured vide per capita SDP but also the paths traversed and
strategies adopted by the different states.
The present study emphasizes on land use planning as an essential tool for sustainable development studying
correlations between land-use changes, urbanization levels, and growth and pace of urbanization in the different
states.
indiastat.com June - July, 2013 2 socio - economic voices
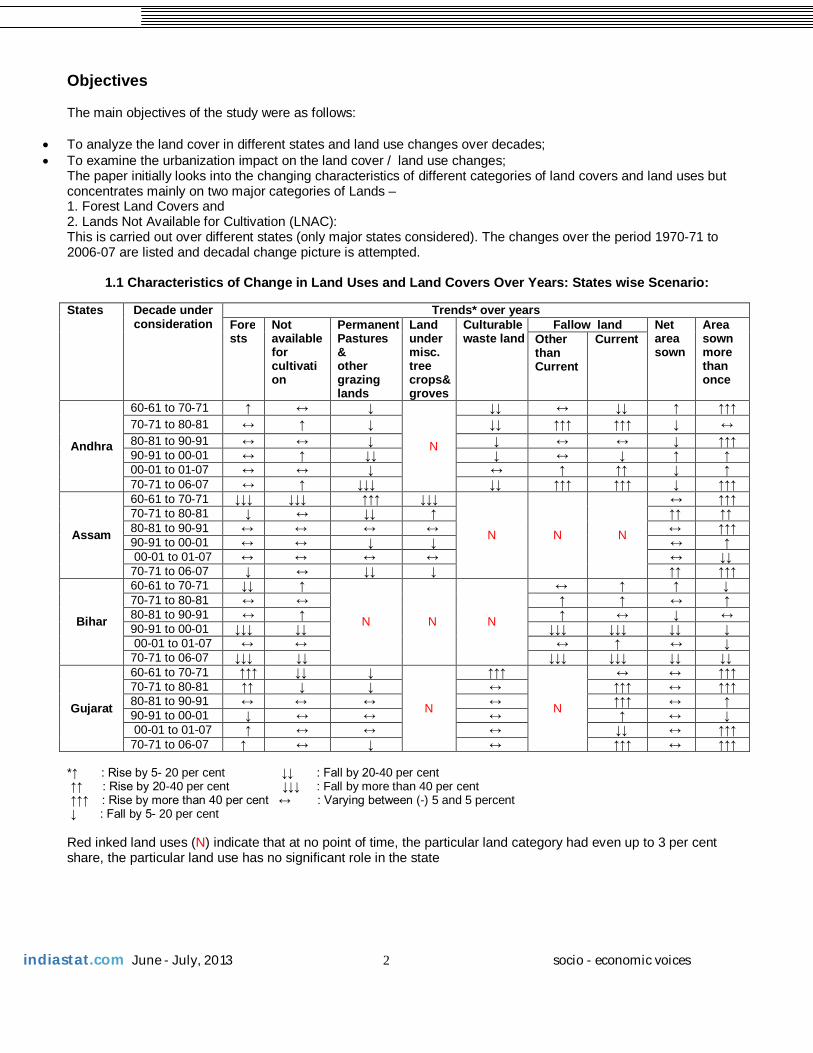
Objectives The main objectives of the study were as follows:
To analyze the land cover in different states and land use changes over decades; To examine the urbanization impact on the land cover / land use changes;
The paper initially looks into the changing characteristics of different categories of land covers and land uses but concentrates mainly on two major categories of Lands – 1. Forest Land Covers and 2. Lands Not Available for Cultivation (LNAC): This is carried out over different states (only major states considered). The changes over the period 1970-71 to 2006-07 are listed and decadal change picture is attempted.
1.1 Characteristics of Change in Land Uses and Land Covers Over Years: States wise Scenario: States Decade under
consideration Trends* over years
Forests
Not available for cultivation
Permanent Pastures & other grazing lands
Land under misc. tree crops& groves
Culturable waste land
Fallow land Net area sown
Area sown more than once
Other than Current
Current
Andhra
60-61 to 70-71 ↑ ↔ ↓
N
↓↓ ↔ ↓↓ ↑ ↑↑↑
70-71 to 80-81 ↔ ↑ ↓ ↓↓ ↑↑↑ ↑↑↑ ↓ ↔
80-81 to 90-91 ↔ ↔ ↓ ↓ ↔ ↔ ↓ ↑↑↑
90-91 to 00-01 ↔ ↑ ↓↓ ↓ ↔ ↓ ↑ ↑
00-01 to 01-07 ↔ ↔ ↓ ↔ ↑ ↑↑ ↓ ↑
70-71 to 06-07 ↔ ↑ ↓↓↓ ↓↓ ↑↑↑ ↑↑↑ ↓ ↑↑↑
Assam
60-61 to 70-71 ↓↓↓ ↓↓↓ ↑↑↑ ↓↓↓
N N N
↔ ↑↑↑
70-71 to 80-81 ↓ ↔ ↓↓ ↑ ↑↑ ↑↑ 80-81 to 90-91 ↔ ↔ ↔ ↔ ↔ ↑↑↑
90-91 to 00-01 ↔ ↔ ↓ ↓ ↔ ↑
00-01 to 01-07 ↔ ↔ ↔ ↔ ↔ ↓↓ 70-71 to 06-07 ↓ ↔ ↓↓ ↓ ↑↑ ↑↑↑
Bihar
60-61 to 70-71 ↓↓ ↑
N N N
↔ ↑ ↑ ↓ 70-71 to 80-81 ↔ ↔ ↑ ↑ ↔ ↑
80-81 to 90-91 ↔ ↑ ↑ ↔ ↓ ↔
90-91 to 00-01 ↓↓↓ ↓↓ ↓↓↓ ↓↓↓ ↓↓ ↓
00-01 to 01-07 ↔ ↔ ↔ ↑ ↔ ↓
70-71 to 06-07 ↓↓↓ ↓↓ ↓↓↓ ↓↓↓ ↓↓ ↓↓
Gujarat
60-61 to 70-71 ↑↑↑ ↓↓ ↓
N
↑↑↑
N
↔ ↔ ↑↑↑
70-71 to 80-81 ↑↑ ↓ ↓ ↔ ↑↑↑ ↔ ↑↑↑
80-81 to 90-91 ↔ ↔ ↔ ↔ ↑↑↑ ↔ ↑
90-91 to 00-01 ↓ ↔ ↔ ↔ ↑ ↔ ↓
00-01 to 01-07 ↑ ↔ ↔ ↔ ↓↓ ↔ ↑↑↑
70-71 to 06-07 ↑ ↔ ↓ ↔ ↑↑↑ ↔ ↑↑↑
*↑ : Rise by 5- 20 per cent ↓↓ : Fall by 20-40 per cent ↑↑ : Rise by 20-40 per cent ↓↓↓ : Fall by more than 40 per cent ↑↑↑ : Rise by more than 40 per cent ↔ : Varying between (-) 5 and 5 percent ↓ : Fall by 5- 20 per cent Red inked land uses (N) indicate that at no point of time, the particular land category had even up to 3 per cent share, the particular land use has no significant role in the state
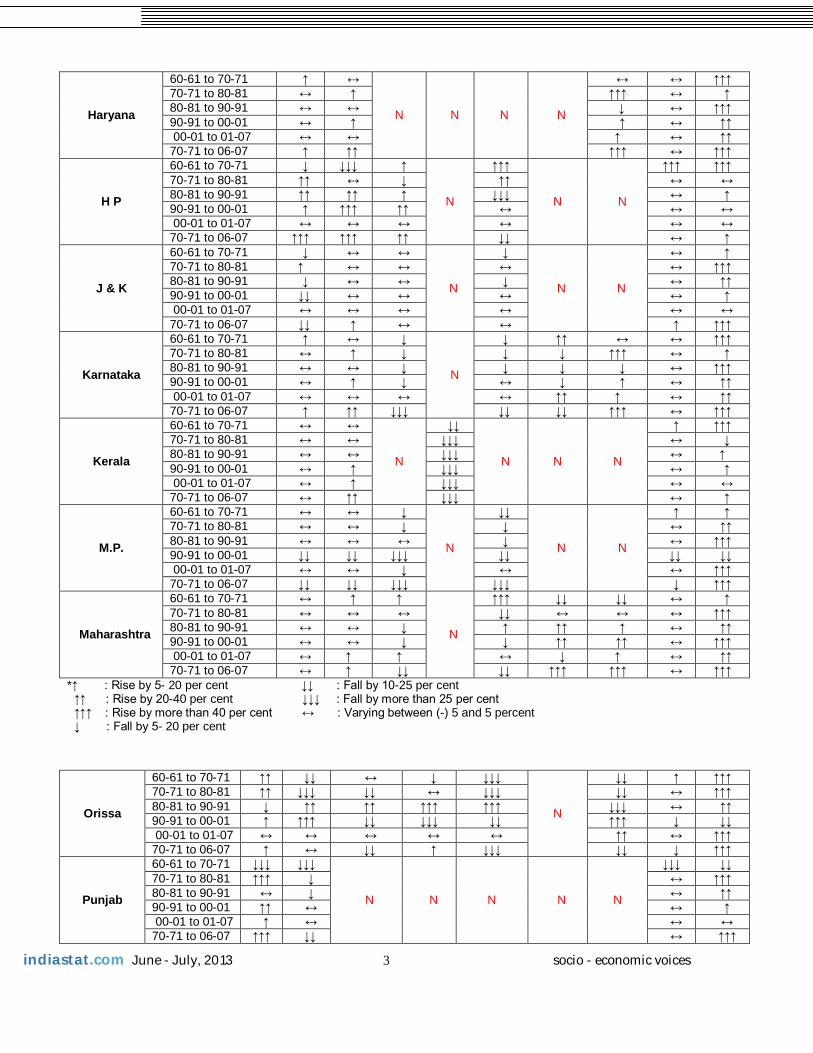
indiastat.com June - July, 2013 3 socio - economic voices
Haryana
60-61 to 70-71 ↑ ↔
N N N N
↔ ↔ ↑↑↑ 70-71 to 80-81 ↔ ↑ ↑↑↑ ↔ ↑
80-81 to 90-91 ↔ ↔ ↓ ↔ ↑↑↑ 90-91 to 00-01 ↔ ↑ ↑ ↔ ↑↑ 00-01 to 01-07 ↔ ↔ ↑ ↔ ↑↑ 70-71 to 06-07 ↑ ↑↑ ↑↑↑ ↔ ↑↑↑
H P
60-61 to 70-71 ↓ ↓↓↓ ↑
N
↑↑↑
N N
↑↑↑ ↑↑↑ 70-71 to 80-81 ↑↑ ↔ ↓ ↑↑ ↔ ↔
80-81 to 90-91 ↑↑ ↑↑ ↑ ↓↓↓ ↔ ↑
90-91 to 00-01 ↑ ↑↑↑ ↑↑ ↔ ↔ ↔
00-01 to 01-07 ↔ ↔ ↔ ↔ ↔ ↔
70-71 to 06-07 ↑↑↑ ↑↑↑ ↑↑ ↓↓ ↔ ↑
J & K
60-61 to 70-71 ↓ ↔ ↔
N
↓
N N
↔ ↑
70-71 to 80-81 ↑ ↔ ↔ ↔ ↔ ↑↑↑ 80-81 to 90-91 ↓ ↔ ↔ ↓ ↔ ↑↑ 90-91 to 00-01 ↓↓ ↔ ↔ ↔ ↔ ↑
00-01 to 01-07 ↔ ↔ ↔ ↔ ↔ ↔
70-71 to 06-07 ↓↓ ↑ ↔ ↔ ↑ ↑↑↑
Karnataka
60-61 to 70-71 ↑ ↔ ↓
N
↓ ↑↑ ↔ ↔ ↑↑↑ 70-71 to 80-81 ↔ ↑ ↓ ↓ ↓ ↑↑↑ ↔ ↑
80-81 to 90-91 ↔ ↔ ↓ ↓ ↓ ↓ ↔ ↑↑↑ 90-91 to 00-01 ↔ ↑ ↓ ↔ ↓ ↑ ↔ ↑↑ 00-01 to 01-07 ↔ ↔ ↔ ↔ ↑↑ ↑ ↔ ↑↑ 70-71 to 06-07 ↑ ↑↑ ↓↓↓ ↓↓ ↓↓ ↑↑↑ ↔ ↑↑↑
Kerala
60-61 to 70-71 ↔ ↔
N
↓↓
N N N
↑ ↑↑↑ 70-71 to 80-81 ↔ ↔ ↓↓↓ ↔ ↓
80-81 to 90-91 ↔ ↔ ↓↓↓ ↔ ↑ 90-91 to 00-01 ↔ ↑ ↓↓↓ ↔ ↑
00-01 to 01-07 ↔ ↑ ↓↓↓ ↔ ↔
70-71 to 06-07 ↔ ↑↑ ↓↓↓ ↔ ↑
M.P.
60-61 to 70-71 ↔ ↔ ↓
N
↓↓
N N
↑ ↑
70-71 to 80-81 ↔ ↔ ↓ ↓ ↔ ↑↑ 80-81 to 90-91 ↔ ↔ ↔ ↓ ↔ ↑↑↑ 90-91 to 00-01 ↓↓ ↓↓ ↓↓↓ ↓↓ ↓↓ ↓↓ 00-01 to 01-07 ↔ ↔ ↓ ↔ ↔ ↑↑↑ 70-71 to 06-07 ↓↓ ↓↓ ↓↓↓ ↓↓↓ ↓ ↑↑↑
Maharashtra
60-61 to 70-71 ↔ ↑ ↑
N
↑↑↑ ↓↓ ↓↓ ↔ ↑
70-71 to 80-81 ↔ ↔ ↔ ↓↓ ↔ ↔ ↔ ↑↑↑ 80-81 to 90-91 ↔ ↔ ↓ ↑ ↑↑ ↑ ↔ ↑↑ 90-91 to 00-01 ↔ ↔ ↓ ↓ ↑↑ ↑↑ ↔ ↑↑↑ 00-01 to 01-07 ↔ ↑ ↑ ↔ ↓ ↑ ↔ ↑↑ 70-71 to 06-07 ↔ ↑ ↓↓ ↓↓ ↑↑↑ ↑↑↑ ↔ ↑↑↑
*↑ : Rise by 5- 20 per cent ↓↓ : Fall by 10-25 per cent ↑↑ : Rise by 20-40 per cent ↓↓↓ : Fall by more than 25 per cent ↑↑↑ : Rise by more than 40 per cent ↔ : Varying between (-) 5 and 5 percent ↓ : Fall by 5- 20 per cent
Orissa
60-61 to 70-71 ↑↑ ↓↓ ↔ ↓ ↓↓↓
N
↓↓ ↑ ↑↑↑ 70-71 to 80-81 ↑↑ ↓↓↓ ↓↓ ↔ ↓↓↓ ↓↓ ↔ ↑↑↑ 80-81 to 90-91 ↓ ↑↑ ↑↑ ↑↑↑ ↑↑↑ ↓↓↓ ↔ ↑↑ 90-91 to 00-01 ↑ ↑↑↑ ↓↓ ↓↓↓ ↓↓ ↑↑↑ ↓ ↓↓ 00-01 to 01-07 ↔ ↔ ↔ ↔ ↔ ↑↑ ↔ ↑↑↑ 70-71 to 06-07 ↑ ↔ ↓↓ ↑ ↓↓↓ ↓↓ ↓ ↑↑↑
Punjab
60-61 to 70-71 ↓↓↓ ↓↓↓
N N N N N
↓↓↓ ↓↓ 70-71 to 80-81 ↑↑↑ ↓ ↔ ↑↑↑ 80-81 to 90-91 ↔ ↓ ↔ ↑↑ 90-91 to 00-01 ↑↑ ↔ ↔ ↑
00-01 to 01-07 ↑ ↔ ↔ ↔
70-71 to 06-07 ↑↑↑ ↓↓ ↔ ↑↑↑
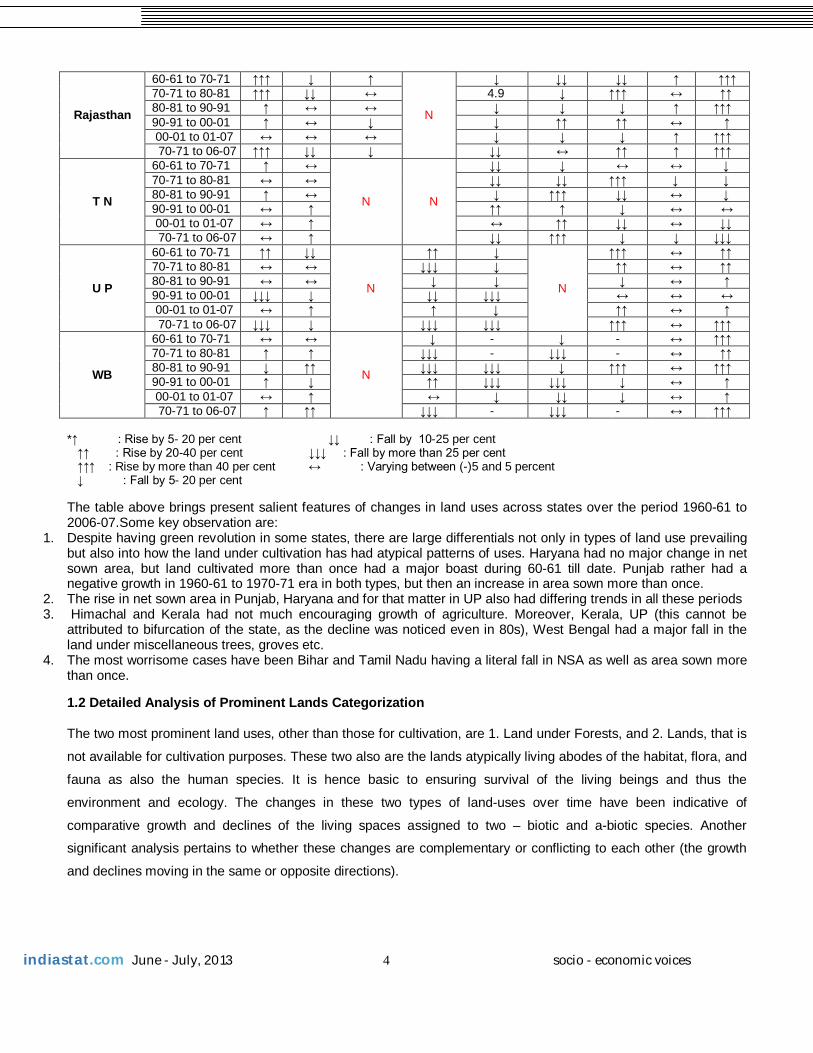
indiastat.com June - July, 2013 4 socio - economic voices
Rajasthan
60-61 to 70-71 ↑↑↑ ↓ ↑
N
↓ ↓↓ ↓↓ ↑ ↑↑↑
70-71 to 80-81 ↑↑↑ ↓↓ ↔ 4.9 ↓ ↑↑↑ ↔ ↑↑ 80-81 to 90-91 ↑ ↔ ↔ ↓ ↓ ↓ ↑ ↑↑↑ 90-91 to 00-01 ↑ ↔ ↓ ↓ ↑↑ ↑↑ ↔ ↑
00-01 to 01-07 ↔ ↔ ↔ ↓ ↓ ↓ ↑ ↑↑↑ 70-71 to 06-07 ↑↑↑ ↓↓ ↓ ↓↓ ↔ ↑↑ ↑ ↑↑↑
T N
60-61 to 70-71 ↑ ↔
N N
↓↓ ↓ ↔ ↔ ↓ 70-71 to 80-81 ↔ ↔ ↓↓ ↓↓ ↑↑↑ ↓ ↓ 80-81 to 90-91 ↑ ↔ ↓ ↑↑↑ ↓↓ ↔ ↓ 90-91 to 00-01 ↔ ↑ ↑↑ ↑ ↓ ↔ ↔
00-01 to 01-07 ↔ ↑ ↔ ↑↑ ↓↓ ↔ ↓↓ 70-71 to 06-07 ↔ ↑ ↓↓ ↑↑↑ ↓ ↓ ↓↓↓
U P
60-61 to 70-71 ↑↑ ↓↓
N
↑↑ ↓
N
↑↑↑ ↔ ↑↑ 70-71 to 80-81 ↔ ↔ ↓↓↓ ↓ ↑↑ ↔ ↑↑ 80-81 to 90-91 ↔ ↔ ↓ ↓ ↓ ↔ ↑
90-91 to 00-01 ↓↓↓ ↓ ↓↓ ↓↓↓ ↔ ↔ ↔
00-01 to 01-07 ↔ ↑ ↑ ↓ ↑↑ ↔ ↑
70-71 to 06-07 ↓↓↓ ↓ ↓↓↓ ↓↓↓ ↑↑↑ ↔ ↑↑↑
WB
60-61 to 70-71 ↔ ↔
N
↓ - ↓ - ↔ ↑↑↑ 70-71 to 80-81 ↑ ↑ ↓↓↓ - ↓↓↓ - ↔ ↑↑ 80-81 to 90-91 ↓ ↑↑ ↓↓↓ ↓↓↓ ↓ ↑↑↑ ↔ ↑↑↑ 90-91 to 00-01 ↑ ↓ ↑↑ ↓↓↓ ↓↓↓ ↓ ↔ ↑
00-01 to 01-07 ↔ ↑ ↔ ↓ ↓↓ ↓ ↔ ↑
70-71 to 06-07 ↑ ↑↑ ↓↓↓ - ↓↓↓ - ↔ ↑↑↑ *↑ : Rise by 5- 20 per cent ↓↓ : Fall by 10-25 per cent ↑↑ : Rise by 20-40 per cent ↓↓↓ : Fall by more than 25 per cent ↑↑↑ : Rise by more than 40 per cent ↔ : Varying between (-)5 and 5 percent ↓ : Fall by 5- 20 per cent The table above brings present salient features of changes in land uses across states over the period 1960-61 to 2006-07.Some key observation are:
1. Despite having green revolution in some states, there are large differentials not only in types of land use prevailing but also into how the land under cultivation has had atypical patterns of uses. Haryana had no major change in net sown area, but land cultivated more than once had a major boast during 60-61 till date. Punjab rather had a negative growth in 1960-61 to 1970-71 era in both types, but then an increase in area sown more than once.
2. The rise in net sown area in Punjab, Haryana and for that matter in UP also had differing trends in all these periods 3. Himachal and Kerala had not much encouraging growth of agriculture. Moreover, Kerala, UP (this cannot be
attributed to bifurcation of the state, as the decline was noticed even in 80s), West Bengal had a major fall in the land under miscellaneous trees, groves etc.
4. The most worrisome cases have been Bihar and Tamil Nadu having a literal fall in NSA as well as area sown more than once. 1.2 Detailed Analysis of Prominent Lands Categorization The two most prominent land uses, other than those for cultivation, are 1. Land under Forests, and 2. Lands, that is
not available for cultivation purposes. These two also are the lands atypically living abodes of the habitat, flora, and
fauna as also the human species. It is hence basic to ensuring survival of the living beings and thus the
environment and ecology. The changes in these two types of land-uses over time have been indicative of
comparative growth and declines of the living spaces assigned to two – biotic and a-biotic species. Another
significant analysis pertains to whether these changes are complementary or conflicting to each other (the growth
and declines moving in the same or opposite directions).
indiastat.com June - July, 2013 5 socio - economic voices
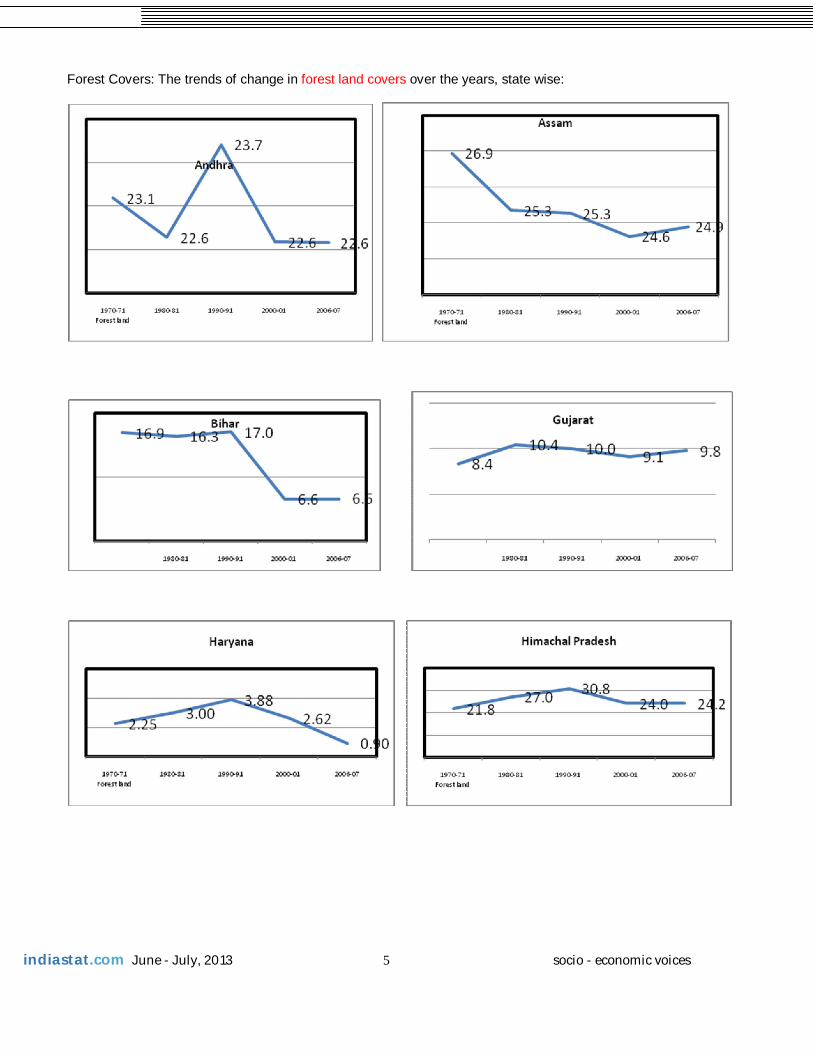
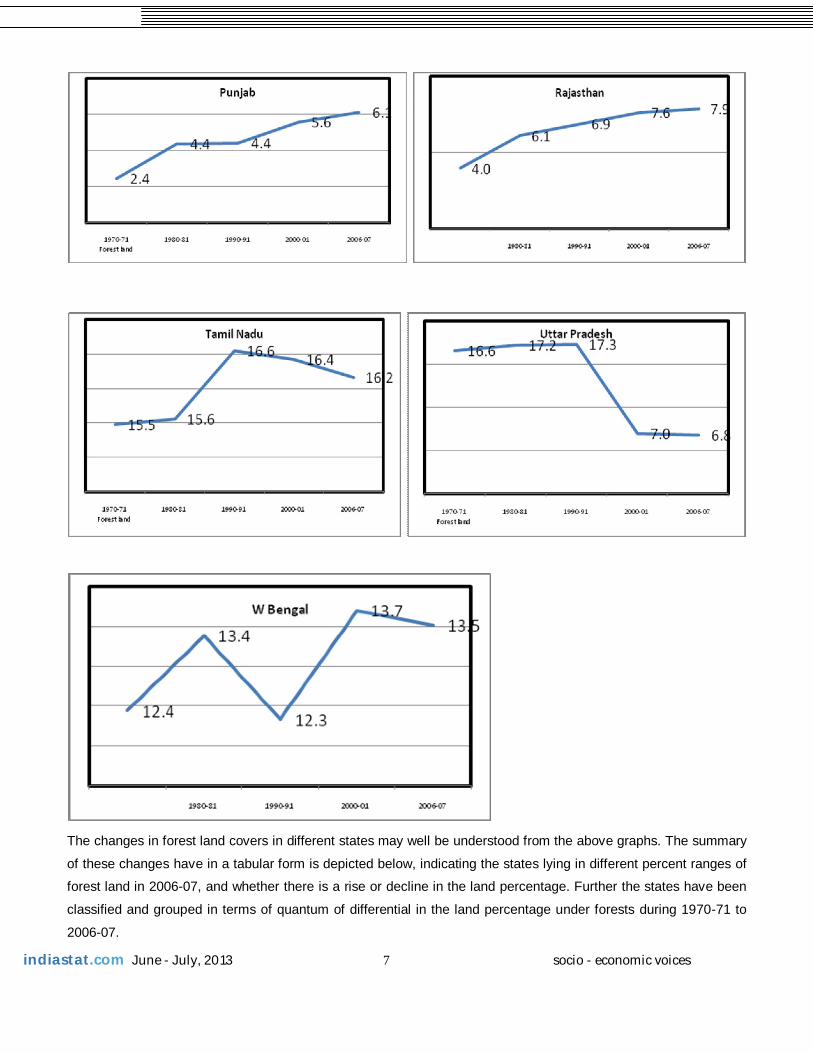
Forest Covers: The trends of change in forest land covers over the years, state wise:
indiastat.com June - July, 2013 6 socio - economic voices
indiastat.com June - July, 2013 7 socio - economic voices
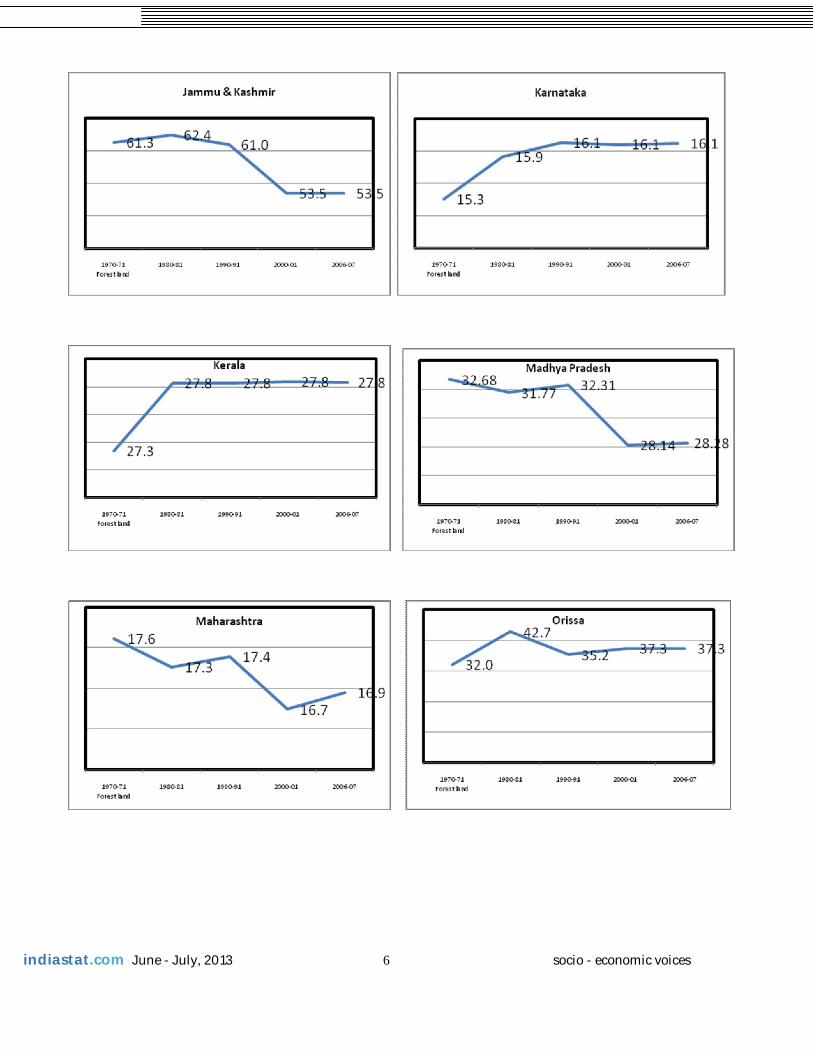
The changes in forest land covers in different states may well be understood from the above graphs. The summary
of these changes have in a tabular form is depicted below, indicating the states lying in different percent ranges of
forest land in 2006-07, and whether there is a rise or decline in the land percentage. Further the states have been
classified and grouped in terms of quantum of differential in the land percentage under forests during 1970-71 to
2006-07.
indiastat.com June - July, 2013 8 socio - economic voices
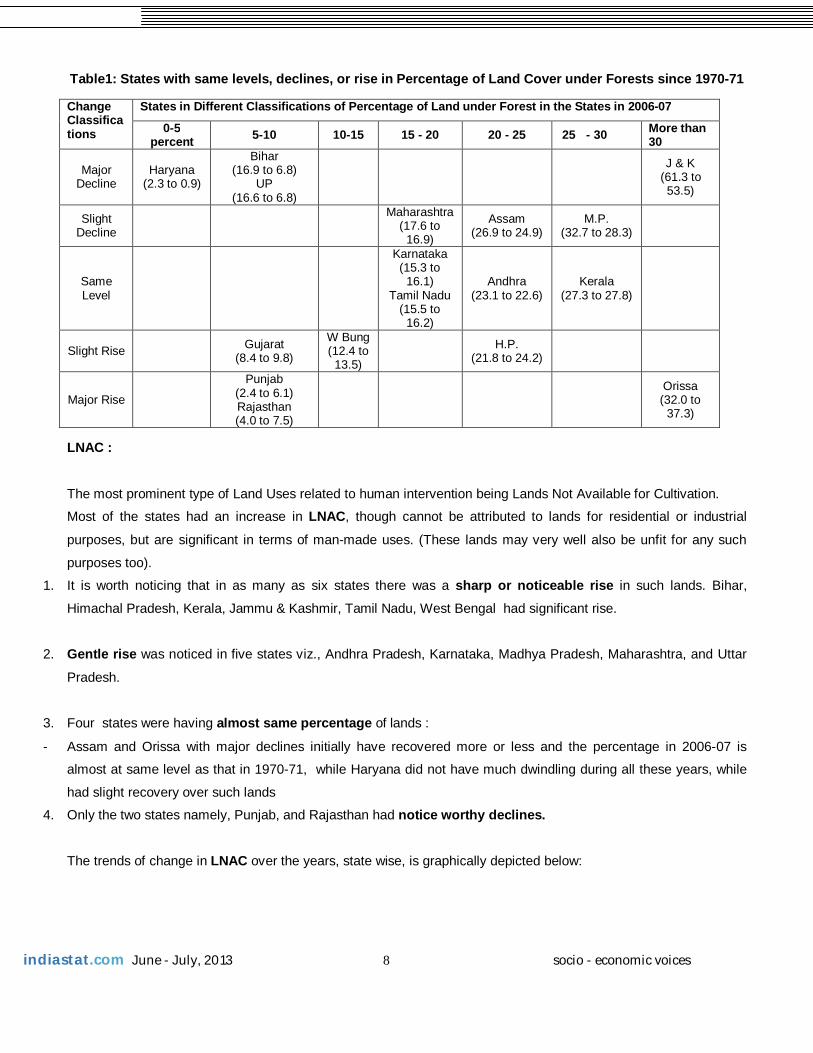
Table1: States with same levels, declines, or rise in Percentage of Land Cover under Forests since 1970-71 Change Classifications
States in Different Classifications of Percentage of Land under Forest in the States in 2006-07
0-5 percent 5-10 10-15 15 - 20 20 - 25 25 - 30 More than
30
Major Decline
Haryana (2.3 to 0.9)
Bihar (16.9 to 6.8)
UP (16.6 to 6.8)
J & K
(61.3 to 53.5)
Slight Decline
Maharashtra (17.6 to
16.9)
Assam (26.9 to 24.9)
M.P. (32.7 to 28.3)
Same Level
Karnataka (15.3 to
16.1) Tamil Nadu
(15.5 to 16.2)
Andhra (23.1 to 22.6)
Kerala (27.3 to 27.8)
Slight Rise Gujarat (8.4 to 9.8)
W Bung (12.4 to 13.5)
H.P. (21.8 to 24.2)
Major Rise
Punjab (2.4 to 6.1) Rajasthan (4.0 to 7.5)
Orissa (32.0 to
37.3) LNAC :
The most prominent type of Land Uses related to human intervention being Lands Not Available for Cultivation.
Most of the states had an increase in LNAC, though cannot be attributed to lands for residential or industrial
purposes, but are significant in terms of man-made uses. (These lands may very well also be unfit for any such
purposes too).
1. It is worth noticing that in as many as six states there was a sharp or noticeable rise in such lands. Bihar,
Himachal Pradesh, Kerala, Jammu & Kashmir, Tamil Nadu, West Bengal had significant rise.
2. Gentle rise was noticed in five states viz., Andhra Pradesh, Karnataka, Madhya Pradesh, Maharashtra, and Uttar
Pradesh.
3. Four states were having almost same percentage of lands :
- Assam and Orissa with major declines initially have recovered more or less and the percentage in 2006-07 is
almost at same level as that in 1970-71, while Haryana did not have much dwindling during all these years, while
had slight recovery over such lands
4. Only the two states namely, Punjab, and Rajasthan had notice worthy declines.
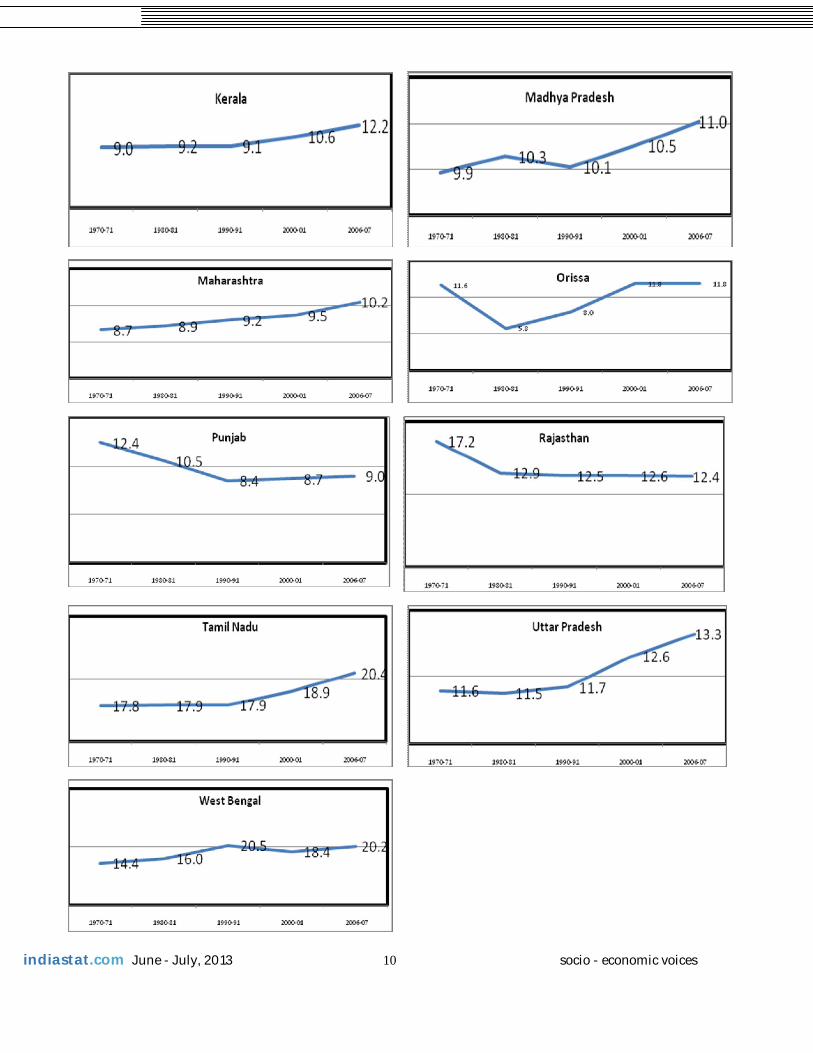
The trends of change in LNAC over the years, state wise, is graphically depicted below:
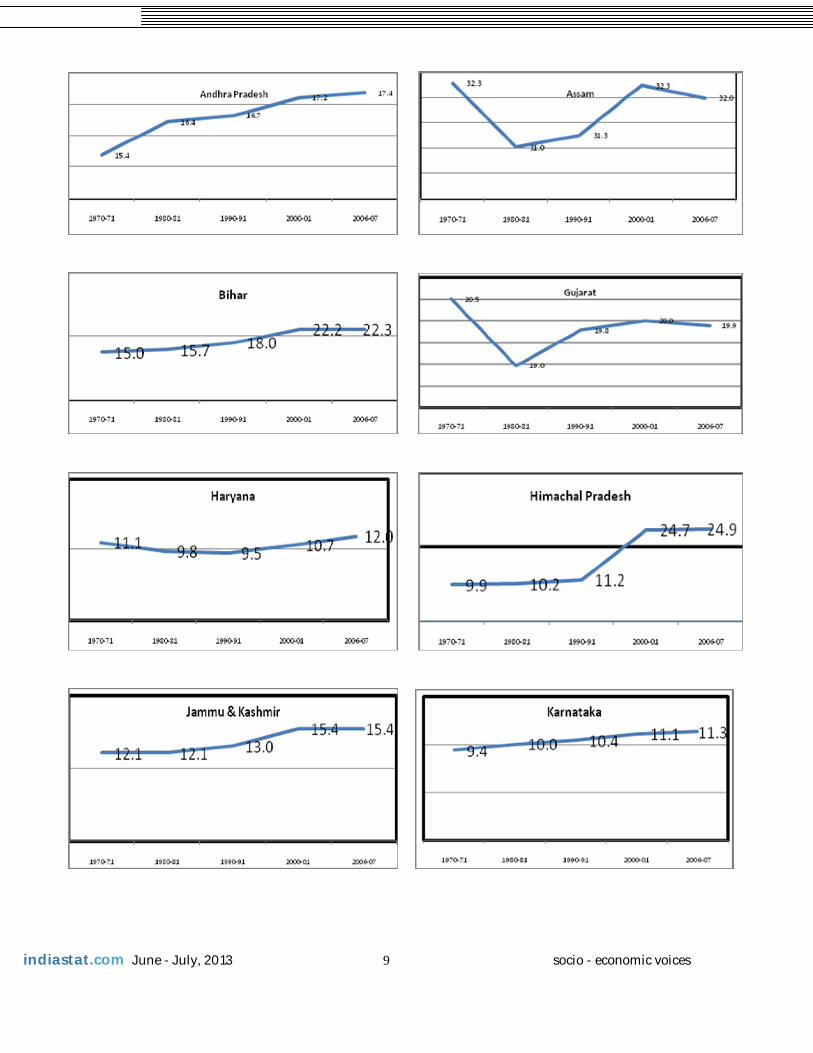
indiastat.com June - July, 2013 9 socio - economic voices
indiastat.com June - July, 2013 10 socio - economic voices
indiastat.com June - July, 2013 11 socio - economic voices
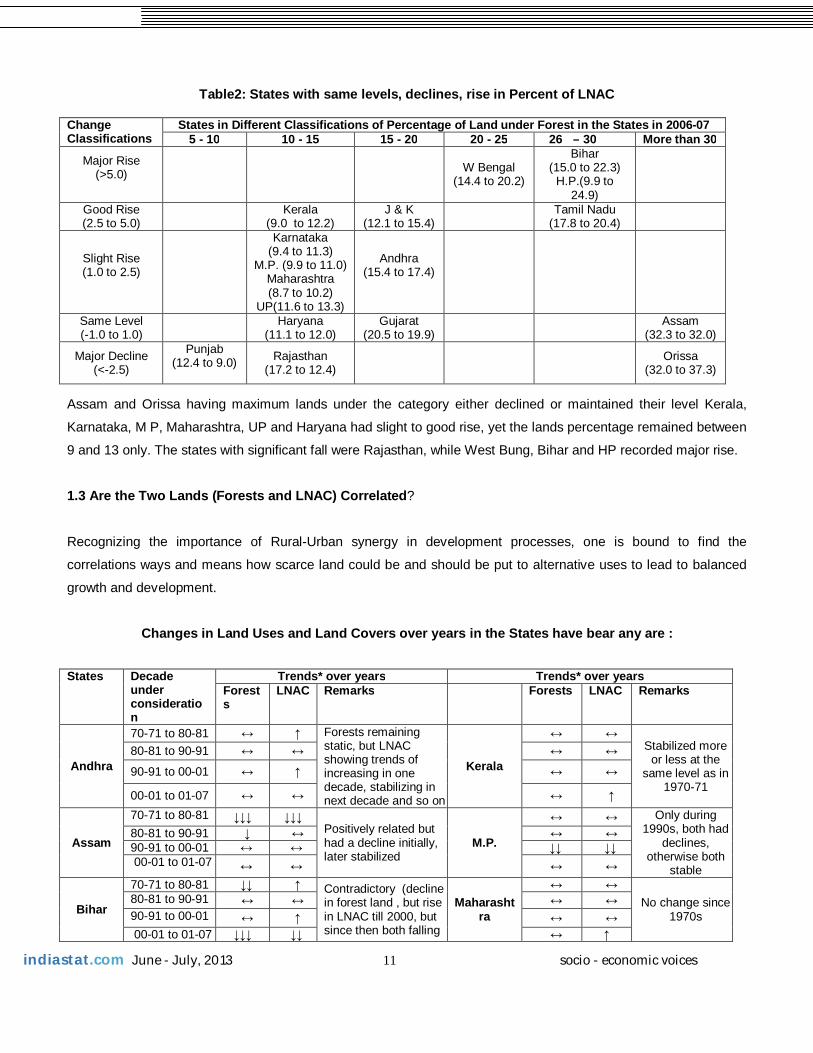
Table2: States with same levels, declines, rise in Percent of LNAC
Change Classifications
States in Different Classifications of Percentage of Land under Forest in the States in 2006-07 5 - 10 10 - 15 15 - 20 20 - 25 26 – 30 More than 30
Major Rise (>5.0)
W Bengal
(14.4 to 20.2)
Bihar (15.0 to 22.3)
H.P.(9.9 to 24.9)
Good Rise (2.5 to 5.0) Kerala
(9.0 to 12.2) J & K
(12.1 to 15.4) Tamil Nadu (17.8 to 20.4)
Slight Rise (1.0 to 2.5)
Karnataka (9.4 to 11.3)
M.P. (9.9 to 11.0) Maharashtra (8.7 to 10.2)
UP(11.6 to 13.3)
Andhra (15.4 to 17.4)
Same Level (-1.0 to 1.0) Haryana
(11.1 to 12.0) Gujarat
(20.5 to 19.9) Assam (32.3 to 32.0)
Major Decline (<-2.5)
Punjab (12.4 to 9.0)
Rajasthan (17.2 to 12.4) Orissa
(32.0 to 37.3) Assam and Orissa having maximum lands under the category either declined or maintained their level Kerala,
Karnataka, M P, Maharashtra, UP and Haryana had slight to good rise, yet the lands percentage remained between
9 and 13 only. The states with significant fall were Rajasthan, while West Bung, Bihar and HP recorded major rise.
1.3 Are the Two Lands (Forests and LNAC) Correlated?
Recognizing the importance of Rural-Urban synergy in development processes, one is bound to find the
correlations ways and means how scarce land could be and should be put to alternative uses to lead to balanced
growth and development.
Changes in Land Uses and Land Covers over years in the States have bear any are :
States Decade under consideration
Trends* over years Trends* over years Forests
LNAC Remarks Forests LNAC Remarks
Andhra
70-71 to 80-81 ↔ ↑ Forests remaining static, but LNAC showing trends of increasing in one decade, stabilizing in next decade and so on
Kerala
↔ ↔
Stabilized more or less at the
same level as in 1970-71
80-81 to 90-91 ↔ ↔ ↔ ↔
90-91 to 00-01 ↔ ↑ ↔ ↔
00-01 to 01-07 ↔ ↔ ↔ ↑
Assam
70-71 to 80-81 ↓↓↓ ↓↓↓ Positively related but had a decline initially, later stabilized
M.P.
↔ ↔ Only during 1990s, both had
declines, otherwise both
stable
80-81 to 90-91 ↓ ↔ ↔ ↔
90-91 to 00-01 ↔ ↔ ↓↓ ↓↓ 00-01 to 01-07 ↔ ↔ ↔ ↔
Bihar
70-71 to 80-81 ↓↓ ↑ Contradictory (decline in forest land , but rise in LNAC till 2000, but since then both falling
Maharashtra
↔ ↔
No change since 1970s
80-81 to 90-91 ↔ ↔ ↔ ↔
90-91 to 00-01 ↔ ↑ ↔ ↔
00-01 to 01-07 ↓↓↓ ↓↓ ↔ ↑
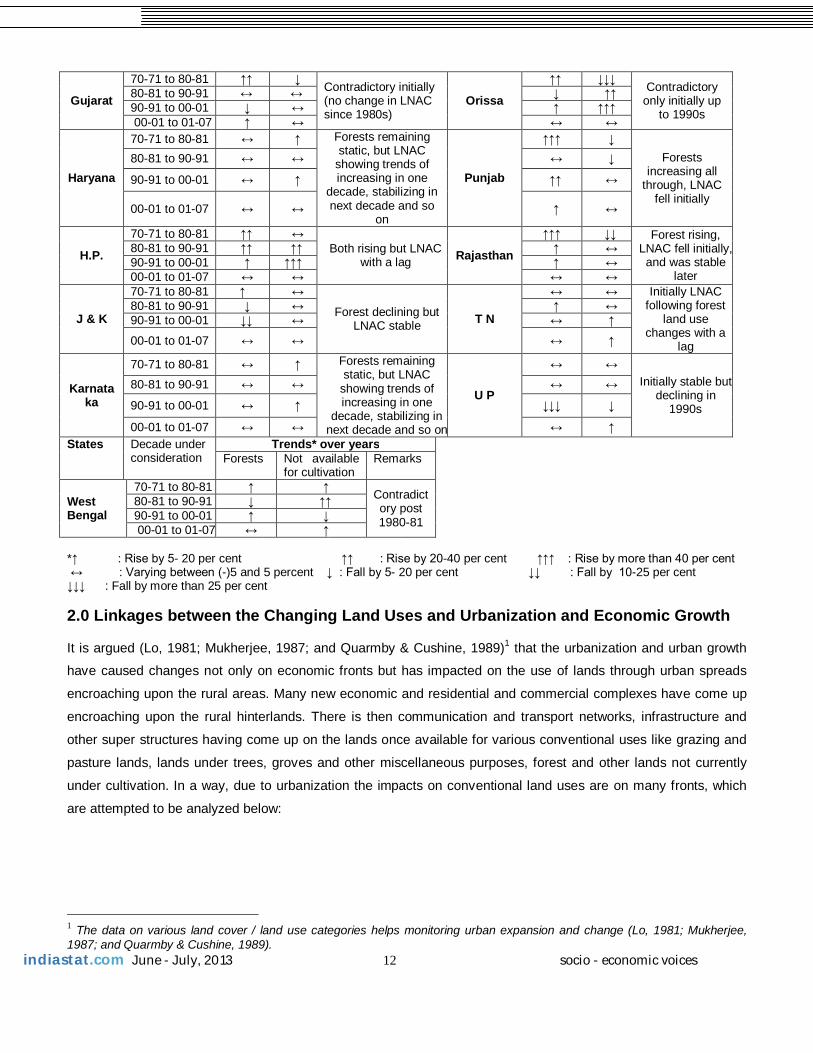
indiastat.com June - July, 2013 12 socio - economic voices
Gujarat
70-71 to 80-81 ↑↑ ↓
Contradictory initially (no change in LNAC since 1980s)
Orissa
↑↑ ↓↓↓ Contradictory only initially up
to 1990s
80-81 to 90-91 ↔ ↔ ↓ ↑↑ 90-91 to 00-01 ↓ ↔ ↑ ↑↑↑ 00-01 to 01-07 ↑ ↔ ↔ ↔
Haryana
70-71 to 80-81 ↔ ↑ Forests remaining static, but LNAC
showing trends of increasing in one
decade, stabilizing in next decade and so
on
Punjab
↑↑↑ ↓
Forests increasing all
through, LNAC fell initially
80-81 to 90-91 ↔ ↔ ↔ ↓
90-91 to 00-01 ↔ ↑ ↑↑ ↔
00-01 to 01-07 ↔ ↔ ↑ ↔
H.P.
70-71 to 80-81 ↑↑ ↔
Both rising but LNAC with a lag Rajasthan
↑↑↑ ↓↓ Forest rising, LNAC fell initially, and was stable
later
80-81 to 90-91 ↑↑ ↑↑ ↑ ↔
90-91 to 00-01 ↑ ↑↑↑ ↑ ↔
00-01 to 01-07 ↔ ↔ ↔ ↔
J & K
70-71 to 80-81 ↑ ↔
Forest declining but LNAC stable T N
↔ ↔ Initially LNAC following forest
land use changes with a
lag
80-81 to 90-91 ↓ ↔ ↑ ↔
90-91 to 00-01 ↓↓ ↔ ↔ ↑
00-01 to 01-07 ↔ ↔ ↔ ↑
Karnataka
70-71 to 80-81 ↔ ↑ Forests remaining static, but LNAC
showing trends of increasing in one
decade, stabilizing in next decade and so on
U P
↔ ↔
Initially stable but declining in
1990s
80-81 to 90-91 ↔ ↔ ↔ ↔
90-91 to 00-01 ↔ ↑ ↓↓↓ ↓
00-01 to 01-07 ↔ ↔ ↔ ↑
States Decade under consideration
Trends* over years Forests Not available
for cultivation Remarks
West Bengal
70-71 to 80-81 ↑ ↑
Contradictory post 1980-81
80-81 to 90-91 ↓ ↑↑ 90-91 to 00-01 ↑ ↓
00-01 to 01-07 ↔ ↑
*↑ : Rise by 5- 20 per cent ↑↑ : Rise by 20-40 per cent ↑↑↑ : Rise by more than 40 per cent ↔ : Varying between (-)5 and 5 percent ↓ : Fall by 5- 20 per cent ↓↓ : Fall by 10-25 per cent ↓↓↓ : Fall by more than 25 per cent 2.0 Linkages between the Changing Land Uses and Urbanization and Economic Growth It is argued (Lo, 1981; Mukherjee, 1987; and Quarmby & Cushine, 1989)1 that the urbanization and urban growth
have caused changes not only on economic fronts but has impacted on the use of lands through urban spreads
encroaching upon the rural areas. Many new economic and residential and commercial complexes have come up
encroaching upon the rural hinterlands. There is then communication and transport networks, infrastructure and
other super structures having come up on the lands once available for various conventional uses like grazing and
pasture lands, lands under trees, groves and other miscellaneous purposes, forest and other lands not currently
under cultivation. In a way, due to urbanization the impacts on conventional land uses are on many fronts, which
are attempted to be analyzed below:
1 The data on various land cover / land use categories helps monitoring urban expansion and change (Lo, 1981; Mukherjee, 1987; and Quarmby & Cushine, 1989).
indiastat.com June - July, 2013 13 socio - economic voices
Plotting Forest Land vs. Urbanization level in the states: 1980-81 vs. 2006-07 1980-81 Urbanization level Forest Land %
Highest More than Average
Average Less than average
Least
Highest Jammu & Kashmir Orissa More than Average Madhya Pradesh
Himachal
Pradesh Average Maharashtra
Tamil Nadu Karnataka Kerala
Andhra Pradesh Uttar Pradesh
Assam Bihar Haryana
Less than average Gujarat West Bengal Least Punjab Rajasthan 2006-07 Urbanization level Forest Land%
Highest More than Average
Average Less than average
Least
Highest Jammu & Kashmir Orissa More than Average
Kerala Madhya Pradesh
Average Maharashtra Tamil Nadu
Karnataka Andhra Pradesh West Bengal
Assam Himachal Pradesh
Less than average
Gujarat Rajasthan Uttar Pradesh
Least Punjab Bihar Haryana
States lying below the diagonal cells are having more Forest lands than Urbanization level and vice versa (those above the diagonal cells have less Forest lands and more Urbanization level), farther the distance, more severe is the difference. Changing Forest Land Cover vs. Urbanization Levels – 1980-81 vs.2006-07 Relative Positions of the states States having Forest Land less than Balanced Level of Urbanization in
1980-81
States having Forest Land more than Balanced Level of Urbanization in 1980-81
States having Forest Land equal to Balanced Level of Urbanization
in 1980-81 States 1980-81
position2006-07 Position
Net difference
States 1980-81 position
2006-07 Position
Net difference
States 1980-81 position
2006-07 Position
Net difference
Maharashtra 31 31 - J & K 13 13 - A.P. 33 33 -
Tamil Nadu 31 31 - M. P. 23 23 - U. P. 33 43 (-)1
Gujarat 41 41 - Orissa 15 14 (-)1 Karnataka 32 32 - H.P. 25 35 (-)1 Kerala 32 23 2 Assam 35 35 - West Bengal 42 33 2 Bihar 35 55 (-)2
Punjab 52 42 1 Haryana 35 55 (-)2 Rajasthan 53 43 1 5 states are virtually worse off (those with negative net difference), while four states are better off while forest lands vs. level of urbanization at two times 1980-81 vis-à-vis 2006-07 are compared, i.e., as urbanization level has gone up in 2006-07 compared to 1980-81, comparative forest lands position has gone down in case of five states, while improvements in relative forest lands positions are seen in the states Kerala, West Bengal, Punjab and Rajasthan.
indiastat.com June - July, 2013 14 socio - economic voices
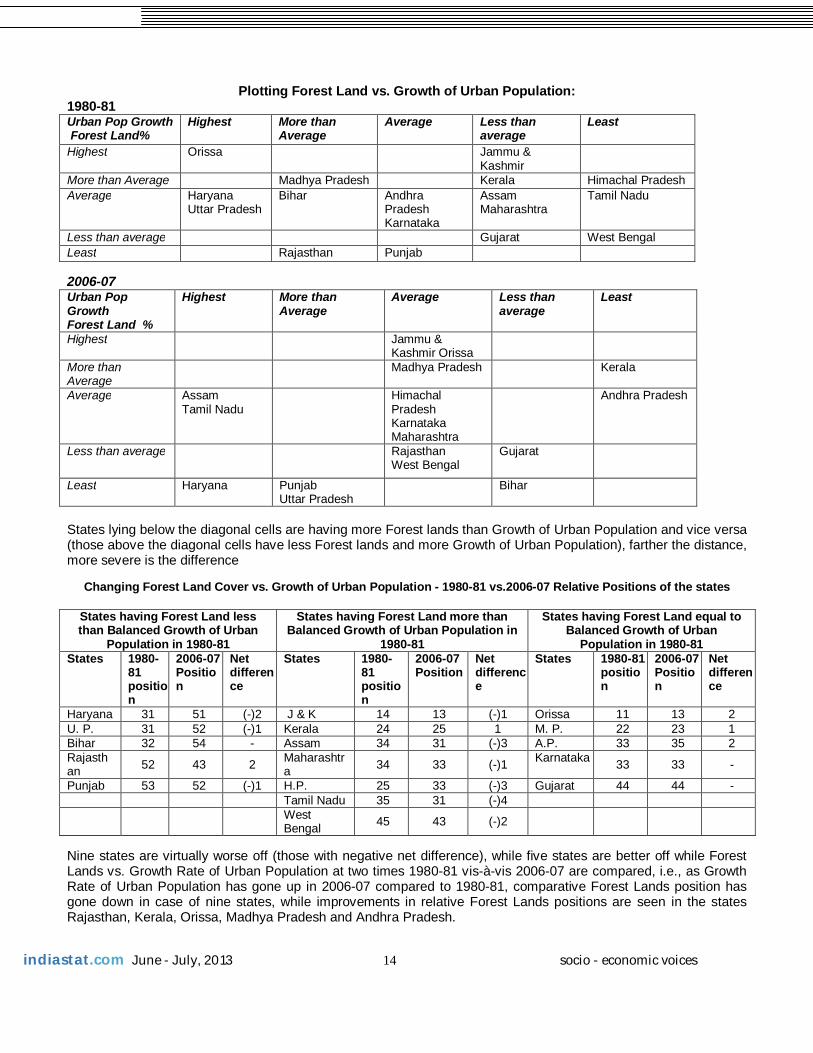
Plotting Forest Land vs. Growth of Urban Population:
1980-81 Urban Pop Growth Forest Land%
Highest More than Average
Average Less than average
Least
Highest Orissa Jammu & Kashmir
More than Average Madhya Pradesh Kerala Himachal Pradesh Average Haryana
Uttar Pradesh Bihar
Andhra Pradesh Karnataka
Assam Maharashtra
Tamil Nadu
Less than average Gujarat West Bengal Least Rajasthan Punjab 2006-07 Urban Pop Growth Forest Land %
Highest More than Average
Average Less than average
Least
Highest Jammu & Kashmir Orissa
More than Average
Madhya Pradesh Kerala
Average Assam Tamil Nadu
Himachal Pradesh Karnataka Maharashtra
Andhra Pradesh
Less than average Rajasthan West Bengal
Gujarat
Least Haryana
Punjab Uttar Pradesh
Bihar
States lying below the diagonal cells are having more Forest lands than Growth of Urban Population and vice versa (those above the diagonal cells have less Forest lands and more Growth of Urban Population), farther the distance, more severe is the difference
Changing Forest Land Cover vs. Growth of Urban Population - 1980-81 vs.2006-07 Relative Positions of the states
States having Forest Land less than Balanced Growth of Urban
Population in 1980-81
States having Forest Land more than Balanced Growth of Urban Population in
1980-81
States having Forest Land equal to Balanced Growth of Urban
Population in 1980-81 States 1980-
81 position
2006-07 Position
Net difference
States 1980-81 position
2006-07 Position
Net difference
States 1980-81 position
2006-07 Position
Net difference
Haryana 31 51 (-)2 J & K 14 13 (-)1 Orissa 11 13 2 U. P. 31 52 (-)1 Kerala 24 25 1 M. P. 22 23 1 Bihar 32 54 - Assam 34 31 (-)3 A.P. 33 35 2 Rajasthan 52 43 2 Maharashtr
a 34 33 (-)1 Karnataka 33 33 -
Punjab 53 52 (-)1 H.P. 25 33 (-)3 Gujarat 44 44 - Tamil Nadu 35 31 (-)4 West
Bengal 45 43 (-)2 Nine states are virtually worse off (those with negative net difference), while five states are better off while Forest Lands vs. Growth Rate of Urban Population at two times 1980-81 vis-à-vis 2006-07 are compared, i.e., as Growth Rate of Urban Population has gone up in 2006-07 compared to 1980-81, comparative Forest Lands position has gone down in case of nine states, while improvements in relative Forest Lands positions are seen in the states Rajasthan, Kerala, Orissa, Madhya Pradesh and Andhra Pradesh.
indiastat.com June - July, 2013 15 socio - economic voices
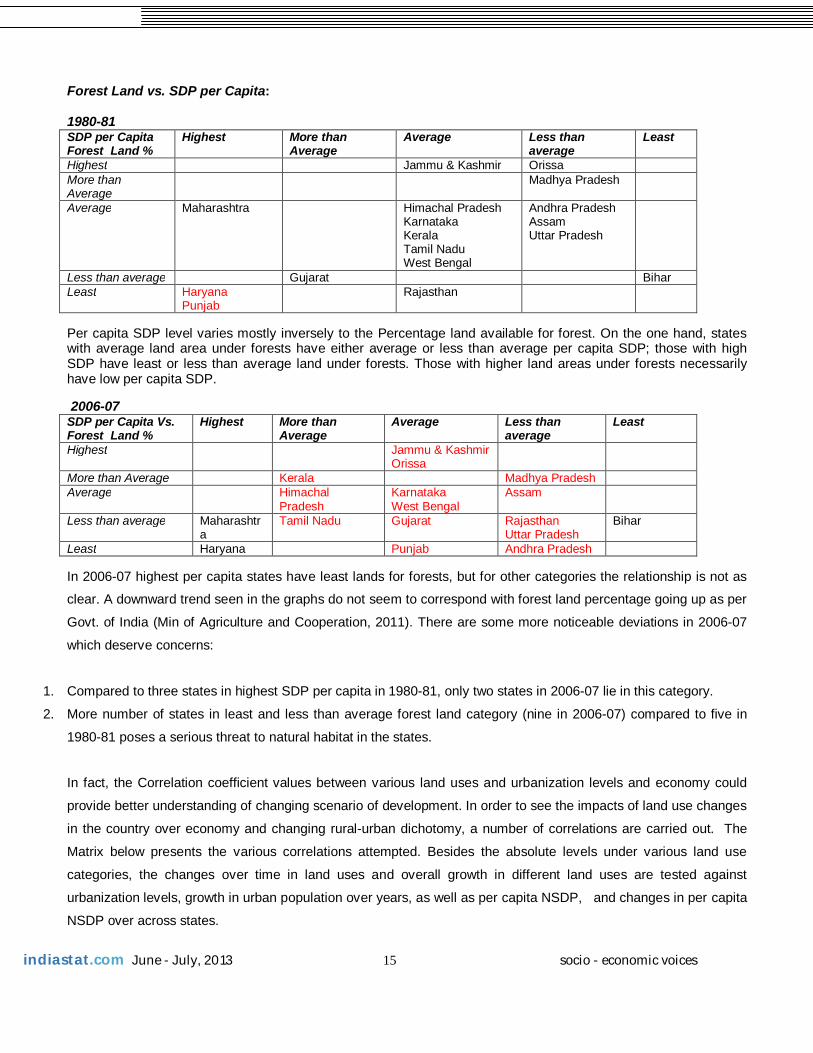
Forest Land vs. SDP per Capita: 1980-81 SDP per Capita Forest Land %
Highest More than Average
Average Less than average
Least
Highest Jammu & Kashmir Orissa More than Average
Madhya Pradesh
Average Maharashtra Himachal Pradesh Karnataka Kerala Tamil Nadu West Bengal
Andhra Pradesh Assam Uttar Pradesh
Less than average Gujarat Bihar Least Haryana
Punjab Rajasthan
Per capita SDP level varies mostly inversely to the Percentage land available for forest. On the one hand, states with average land area under forests have either average or less than average per capita SDP; those with high SDP have least or less than average land under forests. Those with higher land areas under forests necessarily have low per capita SDP. 2006-07 SDP per Capita Vs. Forest Land %
Highest More than Average
Average Less than average
Least
Highest Jammu & Kashmir Orissa
More than Average Kerala Madhya Pradesh Average Himachal
Pradesh Karnataka West Bengal
Assam
Less than average Maharashtra
Tamil Nadu Gujarat Rajasthan Uttar Pradesh
Bihar
Least Haryana Punjab Andhra Pradesh In 2006-07 highest per capita states have least lands for forests, but for other categories the relationship is not as
clear. A downward trend seen in the graphs do not seem to correspond with forest land percentage going up as per
Govt. of India (Min of Agriculture and Cooperation, 2011). There are some more noticeable deviations in 2006-07
which deserve concerns:
1. Compared to three states in highest SDP per capita in 1980-81, only two states in 2006-07 lie in this category.
2. More number of states in least and less than average forest land category (nine in 2006-07) compared to five in
1980-81 poses a serious threat to natural habitat in the states.
In fact, the Correlation coefficient values between various land uses and urbanization levels and economy could
provide better understanding of changing scenario of development. In order to see the impacts of land use changes
in the country over economy and changing rural-urban dichotomy, a number of correlations are carried out. The
Matrix below presents the various correlations attempted. Besides the absolute levels under various land use
categories, the changes over time in land uses and overall growth in different land uses are tested against
urbanization levels, growth in urban population over years, as well as per capita NSDP, and changes in per capita
NSDP over across states.
indiastat.com June - July, 2013 16 socio - economic voices
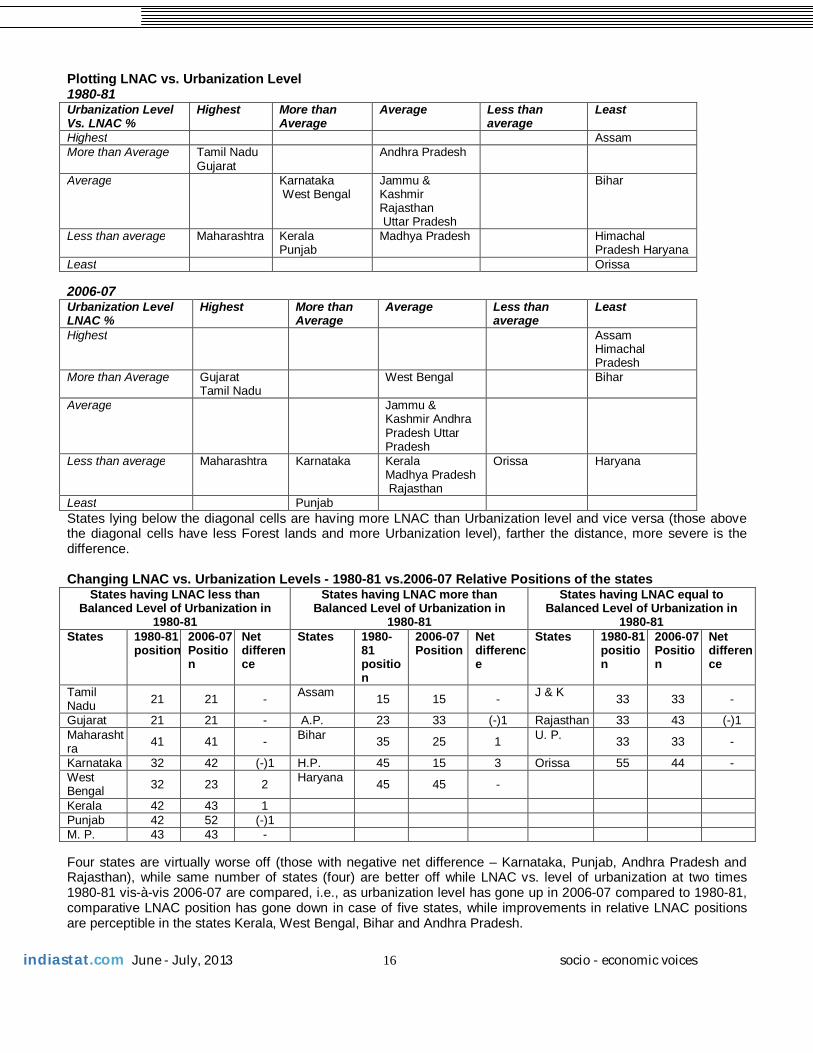
Plotting LNAC vs. Urbanization Level 1980-81 Urbanization Level Vs. LNAC %
Highest More than Average
Average Less than average
Least
Highest Assam More than Average Tamil Nadu
Gujarat Andhra Pradesh
Average Karnataka West Bengal
Jammu & Kashmir Rajasthan Uttar Pradesh
Bihar
Less than average Maharashtra Kerala Punjab
Madhya Pradesh
Himachal Pradesh Haryana
Least Orissa 2006-07 Urbanization Level LNAC %
Highest More than Average
Average Less than average
Least
Highest Assam Himachal Pradesh
More than Average Gujarat Tamil Nadu
West Bengal Bihar
Average Jammu & Kashmir Andhra Pradesh Uttar Pradesh
Less than average Maharashtra Karnataka
Kerala Madhya Pradesh Rajasthan
Orissa Haryana
Least Punjab States lying below the diagonal cells are having more LNAC than Urbanization level and vice versa (those above the diagonal cells have less Forest lands and more Urbanization level), farther the distance, more severe is the difference. Changing LNAC vs. Urbanization Levels - 1980-81 vs.2006-07 Relative Positions of the states
States having LNAC less than Balanced Level of Urbanization in
1980-81
States having LNAC more than Balanced Level of Urbanization in
1980-81
States having LNAC equal to Balanced Level of Urbanization in
1980-81 States 1980-81
position2006-07 Position
Net difference
States 1980-81 position
2006-07 Position
Net difference
States 1980-81 position
2006-07 Position
Net difference
Tamil Nadu 21 21 - Assam 15 15 - J & K 33 33 -
Gujarat 21 21 - A.P. 23 33 (-)1 Rajasthan 33 43 (-)1 Maharashtra 41 41 - Bihar 35 25 1 U. P. 33 33 -
Karnataka 32 42 (-)1 H.P. 45 15 3 Orissa 55 44 - West Bengal 32 23 2 Haryana 45 45 -
Kerala 42 43 1 Punjab 42 52 (-)1 M. P. 43 43 -
Four states are virtually worse off (those with negative net difference – Karnataka, Punjab, Andhra Pradesh and Rajasthan), while same number of states (four) are better off while LNAC vs. level of urbanization at two times 1980-81 vis-à-vis 2006-07 are compared, i.e., as urbanization level has gone up in 2006-07 compared to 1980-81, comparative LNAC position has gone down in case of five states, while improvements in relative LNAC positions are perceptible in the states Kerala, West Bengal, Bihar and Andhra Pradesh.
indiastat.com June - July, 2013 17 socio - economic voices
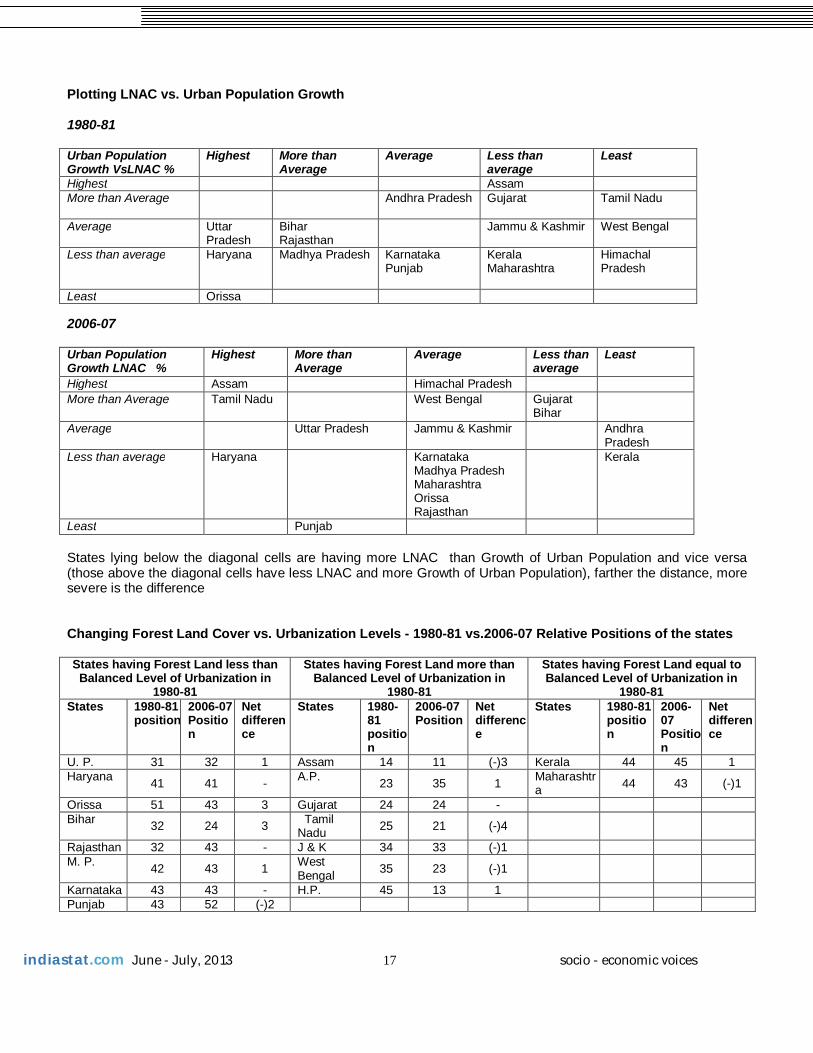
Plotting LNAC vs. Urban Population Growth 1980-81 Urban Population Growth VsLNAC %
Highest More than Average
Average Less than average
Least
Highest Assam More than Average Andhra Pradesh
Gujarat
Tamil Nadu
Average Uttar Pradesh
Bihar Rajasthan
Jammu & Kashmir West Bengal
Less than average Haryana Madhya Pradesh Karnataka Punjab
Kerala Maharashtra
Himachal Pradesh
Least Orissa 2006-07 Urban Population Growth LNAC %
Highest More than Average
Average Less than average
Least
Highest Assam Himachal Pradesh More than Average Tamil Nadu
West Bengal Gujarat
Bihar
Average Uttar Pradesh Jammu & Kashmir Andhra Pradesh
Less than average Haryana
Karnataka Madhya Pradesh Maharashtra Orissa Rajasthan
Kerala
Least Punjab States lying below the diagonal cells are having more LNAC than Growth of Urban Population and vice versa (those above the diagonal cells have less LNAC and more Growth of Urban Population), farther the distance, more severe is the difference Changing Forest Land Cover vs. Urbanization Levels - 1980-81 vs.2006-07 Relative Positions of the states States having Forest Land less than Balanced Level of Urbanization in
1980-81
States having Forest Land more than Balanced Level of Urbanization in
1980-81
States having Forest Land equal to Balanced Level of Urbanization in
1980-81 States 1980-81
position2006-07 Position
Net difference
States 1980-81 position
2006-07 Position
Net difference
States 1980-81 position
2006-07 Position
Net difference
U. P. 31 32 1 Assam 14 11 (-)3 Kerala 44 45 1 Haryana 41 41 - A.P. 23 35 1 Maharashtr
a 44 43 (-)1
Orissa 51 43 3 Gujarat 24 24 - Bihar 32 24 3 Tamil
Nadu 25 21 (-)4
Rajasthan 32 43 - J & K 34 33 (-)1 M. P. 42 43 1 West
Bengal 35 23 (-)1
Karnataka 43 43 - H.P. 45 13 1 Punjab 43 52 (-)2
indiastat.com June - July, 2013 18 socio - economic voices
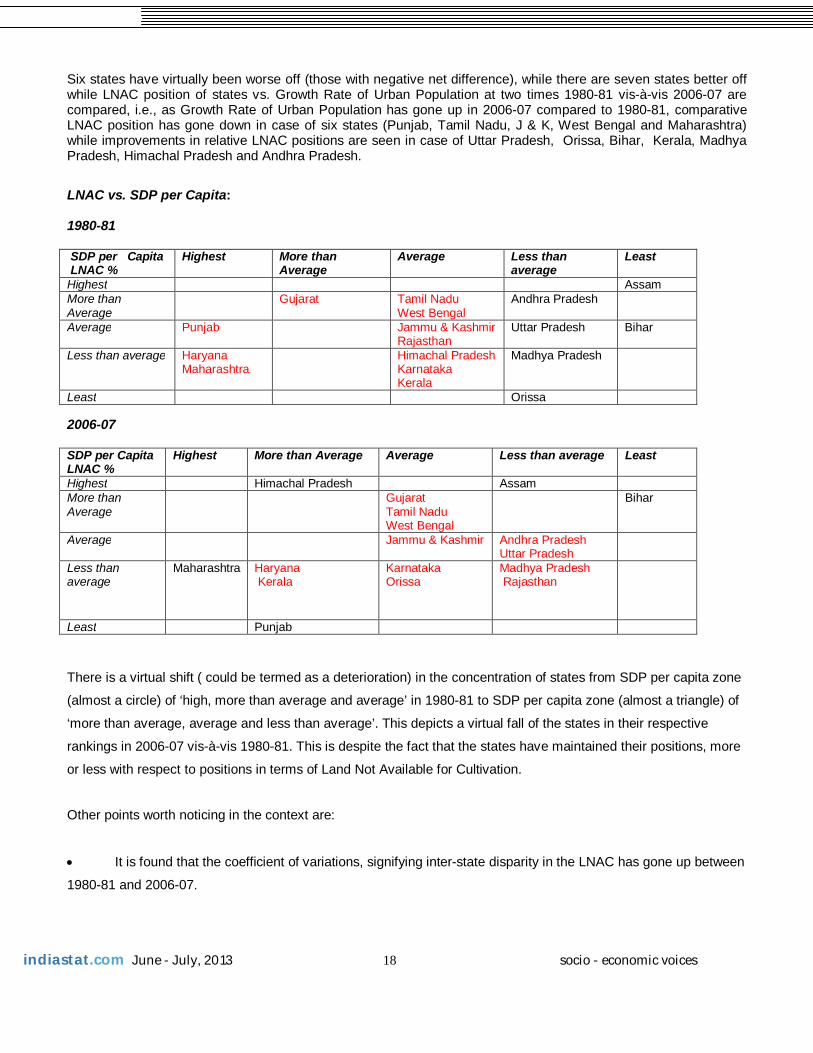
Six states have virtually been worse off (those with negative net difference), while there are seven states better off while LNAC position of states vs. Growth Rate of Urban Population at two times 1980-81 vis-à-vis 2006-07 are compared, i.e., as Growth Rate of Urban Population has gone up in 2006-07 compared to 1980-81, comparative LNAC position has gone down in case of six states (Punjab, Tamil Nadu, J & K, West Bengal and Maharashtra) while improvements in relative LNAC positions are seen in case of Uttar Pradesh, Orissa, Bihar, Kerala, Madhya Pradesh, Himachal Pradesh and Andhra Pradesh. LNAC vs. SDP per Capita: 1980-81 SDP per Capita LNAC %
Highest More than Average
Average Less than average
Least
Highest Assam More than Average
Gujarat
Tamil Nadu West Bengal
Andhra Pradesh
Average Punjab Jammu & Kashmir Rajasthan
Uttar Pradesh Bihar
Less than average Haryana Maharashtra
Himachal Pradesh Karnataka Kerala
Madhya Pradesh
Least Orissa 2006-07 SDP per Capita LNAC %
Highest More than Average Average Less than average Least
Highest Himachal Pradesh Assam More than Average
Gujarat Tamil Nadu West Bengal
Bihar
Average Jammu & Kashmir
Andhra Pradesh Uttar Pradesh
Less than average
Maharashtra Haryana Kerala
Karnataka Orissa
Madhya Pradesh Rajasthan
Least Punjab
There is a virtual shift ( could be termed as a deterioration) in the concentration of states from SDP per capita zone
(almost a circle) of ‘high, more than average and average’ in 1980-81 to SDP per capita zone (almost a triangle) of
‘more than average, average and less than average’. This depicts a virtual fall of the states in their respective
rankings in 2006-07 vis-à-vis 1980-81. This is despite the fact that the states have maintained their positions, more
or less with respect to positions in terms of Land Not Available for Cultivation.
Other points worth noticing in the context are:
It is found that the coefficient of variations, signifying inter-state disparity in the LNAC has gone up between
1980-81 and 2006-07.
indiastat.com June - July, 2013 19 socio - economic voices
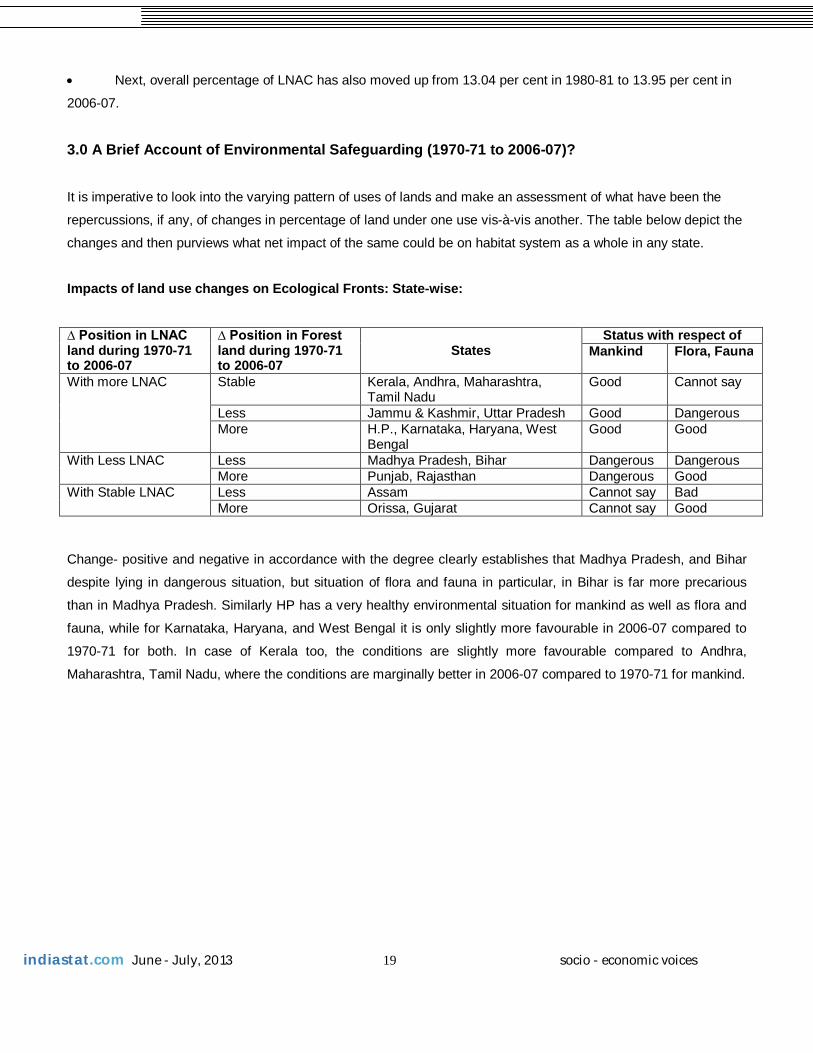
Next, overall percentage of LNAC has also moved up from 13.04 per cent in 1980-81 to 13.95 per cent in
2006-07.
3.0 A Brief Account of Environmental Safeguarding (1970-71 to 2006-07)?
It is imperative to look into the varying pattern of uses of lands and make an assessment of what have been the
repercussions, if any, of changes in percentage of land under one use vis-à-vis another. The table below depict the
changes and then purviews what net impact of the same could be on habitat system as a whole in any state.
Impacts of land use changes on Ecological Fronts: State-wise:
∆ Position in LNAC land during 1970-71 to 2006-07
∆ Position in Forest land during 1970-71 to 2006-07
States Status with respect of
Mankind Flora, Fauna
With more LNAC Stable Kerala, Andhra, Maharashtra, Tamil Nadu
Good Cannot say
Less Jammu & Kashmir, Uttar Pradesh Good Dangerous More H.P., Karnataka, Haryana, West
Bengal Good Good
With Less LNAC Less Madhya Pradesh, Bihar Dangerous Dangerous More Punjab, Rajasthan Dangerous Good
With Stable LNAC Less Assam Cannot say Bad More Orissa, Gujarat Cannot say Good
Change- positive and negative in accordance with the degree clearly establishes that Madhya Pradesh, and Bihar
despite lying in dangerous situation, but situation of flora and fauna in particular, in Bihar is far more precarious
than in Madhya Pradesh. Similarly HP has a very healthy environmental situation for mankind as well as flora and
fauna, while for Karnataka, Haryana, and West Bengal it is only slightly more favourable in 2006-07 compared to
1970-71 for both. In case of Kerala too, the conditions are slightly more favourable compared to Andhra,
Maharashtra, Tamil Nadu, where the conditions are marginally better in 2006-07 compared to 1970-71 for mankind.
indiastat.com June - July, 2013 20 socio - economic voices
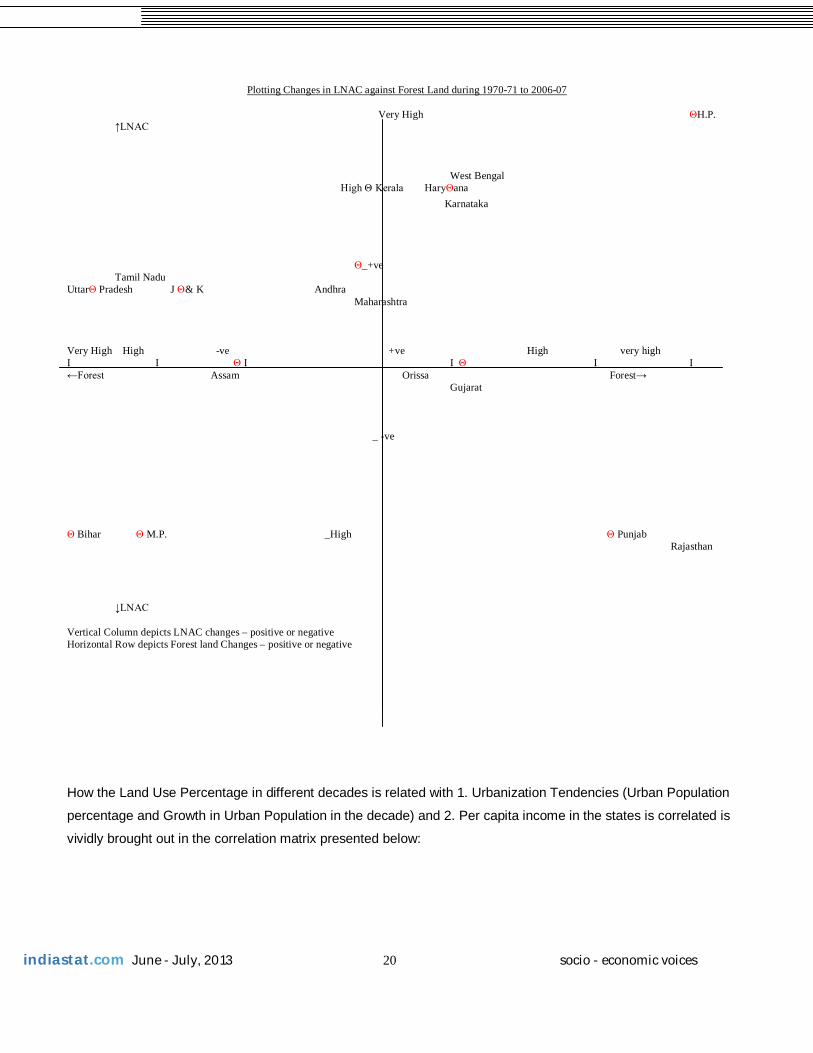
Plotting Changes in LNAC against Forest Land during 1970-71 to 2006-07
Very High ΘH.P.
↑LNAC West Bengal High Θ Kerala HaryΘana Karnataka Θ_+ve
Tamil Nadu UttarΘ Pradesh J Θ& K Andhra Maharashtra Very High High -ve +ve High very high І І Θ І І Θ І І ←Forest Assam Orissa Forest→ Gujarat _ -ve Θ Bihar Θ M.P. _High Θ Punjab Rajasthan
↓LNAC Vertical Column depicts LNAC changes – positive or negative Horizontal Row depicts Forest land Changes – positive or negative How the Land Use Percentage in different decades is related with 1. Urbanization Tendencies (Urban Population
percentage and Growth in Urban Population in the decade) and 2. Per capita income in the states is correlated is
vividly brought out in the correlation matrix presented below:
indiastat.com June - July, 2013 21 socio - economic voices
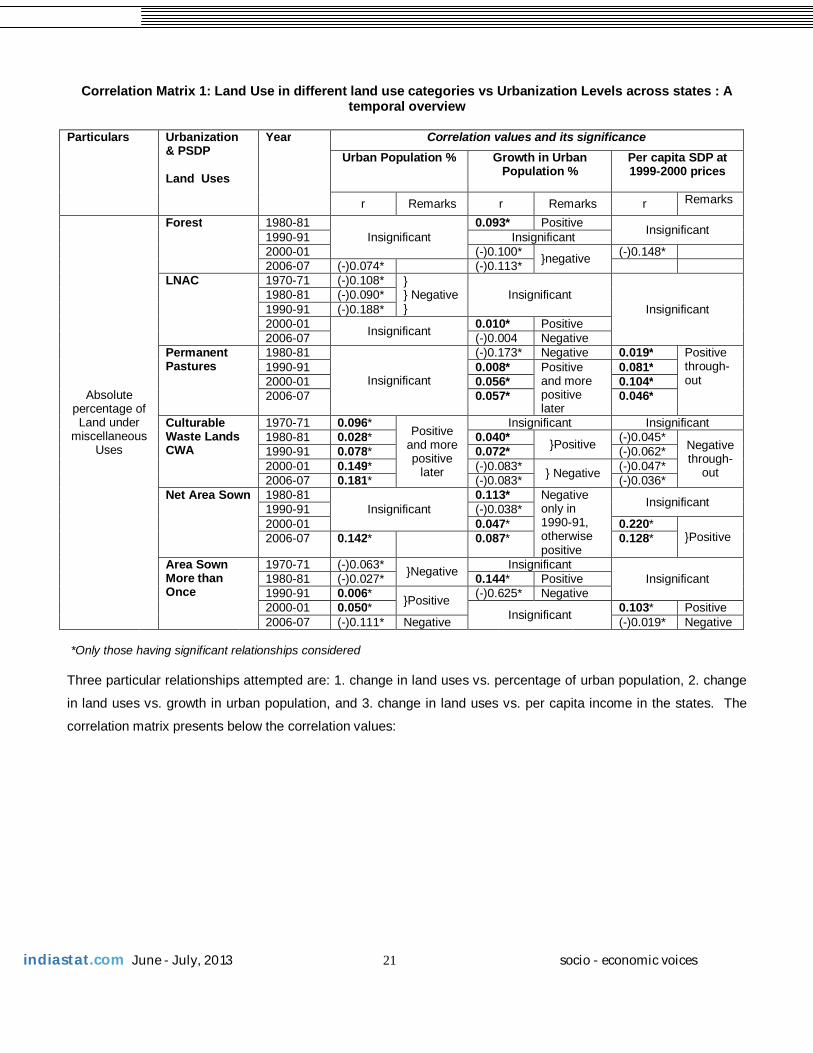
Correlation Matrix 1: Land Use in different land use categories vs Urbanization Levels across states : A
temporal overview
Particulars Urbanization & PSDP Land Uses
Year Correlation values and its significance Urban Population % Growth in Urban
Population %
Per capita SDP at 1999-2000 prices
r Remarks r Remarks r Remarks
Absolute percentage of Land under
miscellaneous Uses
Forest 1980-81 Insignificant
0.093* Positive Insignificant 1990-91 Insignificant 2000-01 (-)0.100* }negative (-)0.148* 2006-07 (-)0.074* (-)0.113*
LNAC 1970-71 (-)0.108* } } Negative }
Insignificant Insignificant
1980-81 (-)0.090* 1990-91 (-)0.188* 2000-01 Insignificant 0.010* Positive 2006-07 (-)0.004 Negative
Permanent Pastures
1980-81
Insignificant
(-)0.173* Negative 0.019* Positive through-out
1990-91 0.008* Positive and more positive later
0.081* 2000-01 0.056* 0.104* 2006-07 0.057* 0.046*
Culturable Waste Lands CWA
1970-71 0.096* Positive
and more positive
later
Insignificant Insignificant 1980-81 0.028* 0.040* }Positive (-)0.045* Negative
through-out
1990-91 0.078* 0.072* (-)0.062* 2000-01 0.149* (-)0.083* } Negative (-)0.047* 2006-07 0.181* (-)0.083* (-)0.036*
Net Area Sown 1980-81 Insignificant
0.113* Negative only in 1990-91, otherwise positive
Insignificant 1990-91 (-)0.038* 2000-01 0.047* 0.220*
}Positive 2006-07 0.142* 0.087* 0.128*
Area Sown More than Once
1970-71 (-)0.063* }Negative Insignificant Insignificant 1980-81 (-)0.027* 0.144* Positive
1990-91 0.006* }Positive (-)0.625* Negative 2000-01 0.050* Insignificant 0.103* Positive 2006-07 (-)0.111* Negative (-)0.019* Negative
*Only those having significant relationships considered Three particular relationships attempted are: 1. change in land uses vs. percentage of urban population, 2. change
in land uses vs. growth in urban population, and 3. change in land uses vs. per capita income in the states. The
correlation matrix presents below the correlation values:
indiastat.com June - July, 2013 22 socio - economic voices
Correlation Matrix 2: Changes in Land Uses vs. Urbanization Levels across states : A temporal overview Particulars Urbanization
& PSDP Land Uses
Decade Correlation values and its significance Urban Population
% Growth in Urban Population %
Per capita SDP at 1999-2000 prices
r Remarks r Remarks r Remarks
Decadal variation in the percentage of Land under
miscellaneous Uses
Forest
1971-81 Insignificant Insignificant (-)0.014* Negative 1981-91 0.078* Positive 0.001* Positive Insignificant 1991-01 Insignificant (-)0.175* Negative 2001-07 Insignificant (-)0.032* Negative
LNAC
1971-81
Insignificant Insignificant (-)0.513* Inverse but
reducing 1981-91 (-)0.368* 1991-01 0.114* Positive (-)0.047* 2001-07 (-)0.130* Negative 0.191* Positive
Permanent Pastures
1971-81
Insignificant Insignificant (-)0.002* Negative
1981-91 Insignificant 1991-01 0.177* Positive 0.173* Positive 2001-07 0.001* Insignificant
CWA
1971-81 (-)0.185* Negative Insignificant Insignificant
1981-91 0.145* Positive 0.019* Positive (-)0.126* Negative 1991-01 Insignificant Insignificant Insignificant 2001-07 0.043* Positive
NAS
1971-81 Insignificant
0.103* Positive 0.172* Positive 1981-91 0.177* 0.155* 1991-01 (-)0.054* Negative Insignificant 2001-07 (-)0.156* Negativ
e Insignificant (-)0.095* Negative
Area Sown More than
Once
1971-81 0.017*
Positive
Insignificant Insignificant 1981-91 0.112* (-)0.081* Negative 1991-01 0.136* Insignificant 0.101* Positive 2001-07 0.152* 0.173*
*Only those having significant relationships considered, Those having positive highlighted Hypothesis 1: ‘Land degradation results mainly due to population pressure which leads to intense land use without proper management practices’: A positive correlation between changing culturable waste lands and
growth in urban population as also changing urbanization levels during 1980s and 1990s seem to reinforce the
hypothesis.
Relationships Computations Period of Consideration Remarks 1981-91 1991-2001 2001-07
Percentage Changes in CWA to % Change in Urban Population
r 0.148833 0.683583 -0.63644 Positive during 1980s and 1990s t test values 1.25E-05 0.000136 0.946622
Percentage Changes in CWA to Urban Population Growth
r 0.019089 0.29367 0.037525 Positive all through t test values 1.75E-08 1.96E-10 2.68E-08
Percentage Changes in CWA to Absolute change in SDP
r -0.2191 0.151151 0.397733 Positive t test values 3.49E-06 0.002131 4.74E-05
indiastat.com June - July, 2013 23 socio - economic voices
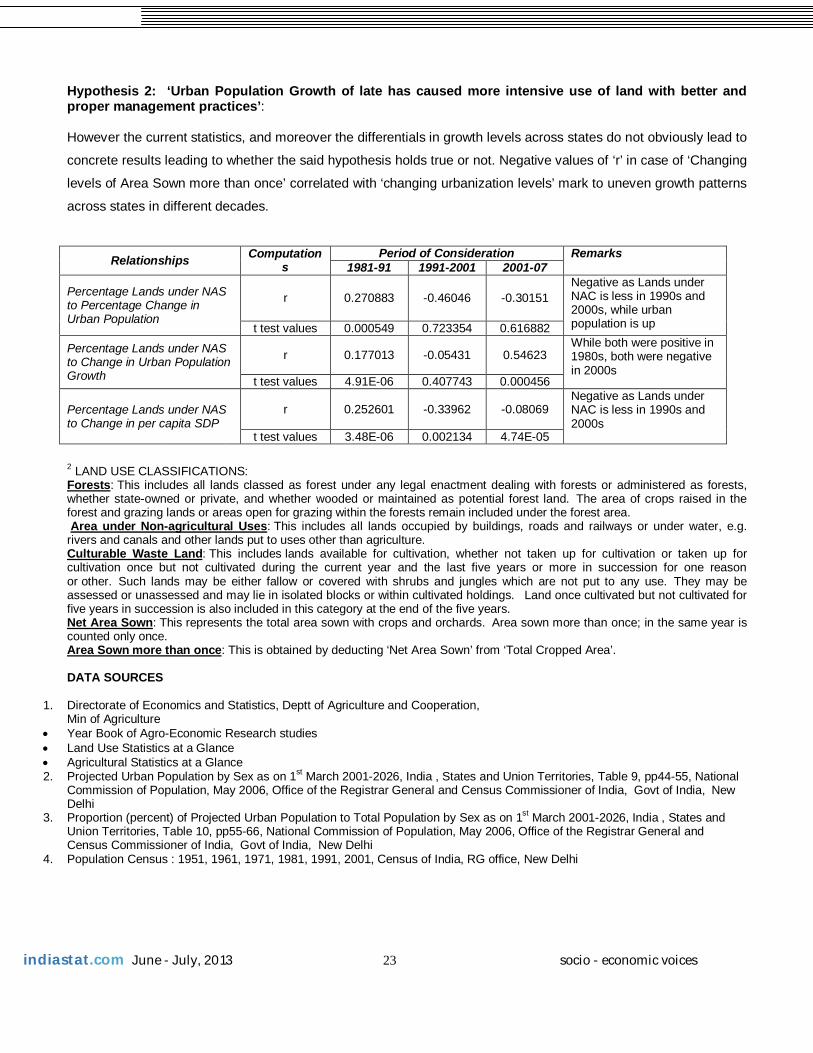
Hypothesis 2: ‘Urban Population Growth of late has caused more intensive use of land with better and proper management practices’: However the current statistics, and moreover the differentials in growth levels across states do not obviously lead to
concrete results leading to whether the said hypothesis holds true or not. Negative values of ‘r’ in case of ‘Changing
levels of Area Sown more than once’ correlated with ‘changing urbanization levels’ mark to uneven growth patterns
across states in different decades.
Relationships Computations
Period of Consideration Remarks 1981-91 1991-2001 2001-07
Percentage Lands under NAS to Percentage Change in Urban Population
r 0.270883 -0.46046 -0.30151 Negative as Lands under NAC is less in 1990s and 2000s, while urban population is up t test values 0.000549 0.723354 0.616882
Percentage Lands under NAS to Change in Urban Population Growth
r 0.177013 -0.05431 0.54623 While both were positive in 1980s, both were negative in 2000s
t test values 4.91E-06 0.407743 0.000456
Percentage Lands under NAS to Change in per capita SDP
r 0.252601 -0.33962 -0.08069 Negative as Lands under NAC is less in 1990s and 2000s
t test values 3.48E-06 0.002134 4.74E-05
2 LAND USE CLASSIFICATIONS: Forests: This includes all lands classed as forest under any legal enactment dealing with forests or administered as forests, whether state-owned or private, and whether wooded or maintained as potential forest land. The area of crops raised in the forest and grazing lands or areas open for grazing within the forests remain included under the forest area. Area under Non-agricultural Uses: This includes all lands occupied by buildings, roads and railways or under water, e.g. rivers and canals and other lands put to uses other than agriculture. Culturable Waste Land: This includes lands available for cultivation, whether not taken up for cultivation or taken up for cultivation once but not cultivated during the current year and the last five years or more in succession for one reason or other. Such lands may be either fallow or covered with shrubs and jungles which are not put to any use. They may be assessed or unassessed and may lie in isolated blocks or within cultivated holdings. Land once cultivated but not cultivated for five years in succession is also included in this category at the end of the five years. Net Area Sown: This represents the total area sown with crops and orchards. Area sown more than once; in the same year is counted only once. Area Sown more than once: This is obtained by deducting ‘Net Area Sown’ from ‘Total Cropped Area’. DATA SOURCES
1. Directorate of Economics and Statistics, Deptt of Agriculture and Cooperation, Min of Agriculture
Year Book of Agro-Economic Research studies Land Use Statistics at a Glance Agricultural Statistics at a Glance 2. Projected Urban Population by Sex as on 1st March 2001-2026, India , States and Union Territories, Table 9, pp44-55, National
Commission of Population, May 2006, Office of the Registrar General and Census Commissioner of India, Govt of India, New Delhi
3. Proportion (percent) of Projected Urban Population to Total Population by Sex as on 1st March 2001-2026, India , States and Union Territories, Table 10, pp55-66, National Commission of Population, May 2006, Office of the Registrar General and Census Commissioner of India, Govt of India, New Delhi
4. Population Census : 1951, 1961, 1971, 1981, 1991, 2001, Census of India, RG office, New Delhi
indiastat.com June - July, 2013 24 socio - economic voices
Annexure
States Urban Population Percentage Urban Population Growth Rate SDP at 1999-00 prices 1971 1981 1991 2001 2001 1971-81 1981-
91 1991-01 2001-07 1980-81 1990-91 2000-01 2006-07
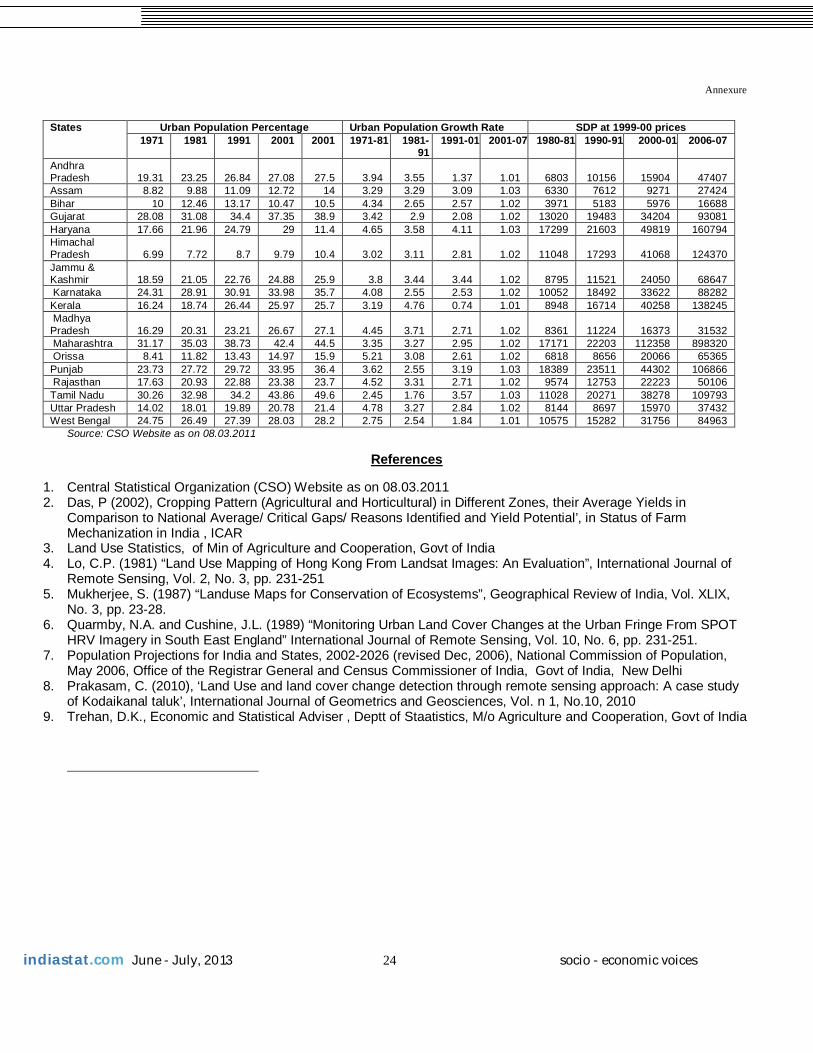
Andhra Pradesh 19.31 23.25 26.84 27.08 27.5 3.94 3.55 1.37 1.01 6803 10156 15904 47407 Assam 8.82 9.88 11.09 12.72 14 3.29 3.29 3.09 1.03 6330 7612 9271 27424 Bihar 10 12.46 13.17 10.47 10.5 4.34 2.65 2.57 1.02 3971 5183 5976 16688 Gujarat 28.08 31.08 34.4 37.35 38.9 3.42 2.9 2.08 1.02 13020 19483 34204 93081 Haryana 17.66 21.96 24.79 29 11.4 4.65 3.58 4.11 1.03 17299 21603 49819 160794 Himachal Pradesh 6.99 7.72 8.7 9.79 10.4 3.02 3.11 2.81 1.02 11048 17293 41068 124370 Jammu & Kashmir 18.59 21.05 22.76 24.88 25.9 3.8 3.44 3.44 1.02 8795 11521 24050 68647 Karnataka 24.31 28.91 30.91 33.98 35.7 4.08 2.55 2.53 1.02 10052 18492 33622 88282 Kerala 16.24 18.74 26.44 25.97 25.7 3.19 4.76 0.74 1.01 8948 16714 40258 138245 Madhya Pradesh 16.29 20.31 23.21 26.67 27.1 4.45 3.71 2.71 1.02 8361 11224 16373 31532 Maharashtra 31.17 35.03 38.73 42.4 44.5 3.35 3.27 2.95 1.02 17171 22203 112358 898320 Orissa 8.41 11.82 13.43 14.97 15.9 5.21 3.08 2.61 1.02 6818 8656 20066 65365 Punjab 23.73 27.72 29.72 33.95 36.4 3.62 2.55 3.19 1.03 18389 23511 44302 106866 Rajasthan 17.63 20.93 22.88 23.38 23.7 4.52 3.31 2.71 1.02 9574 12753 22223 50106 Tamil Nadu 30.26 32.98 34.2 43.86 49.6 2.45 1.76 3.57 1.03 11028 20271 38278 109793 Uttar Pradesh 14.02 18.01 19.89 20.78 21.4 4.78 3.27 2.84 1.02 8144 8697 15970 37432 West Bengal 24.75 26.49 27.39 28.03 28.2 2.75 2.54 1.84 1.01 10575 15282 31756 84963
Source: CSO Website as on 08.03.2011
References
1. Central Statistical Organization (CSO) Website as on 08.03.2011 2. Das, P (2002), Cropping Pattern (Agricultural and Horticultural) in Different Zones, their Average Yields in
Comparison to National Average/ Critical Gaps/ Reasons Identified and Yield Potential’, in Status of Farm Mechanization in India , ICAR
3. Land Use Statistics, of Min of Agriculture and Cooperation, Govt of India 4. Lo, C.P. (1981) “Land Use Mapping of Hong Kong From Landsat Images: An Evaluation”, International Journal of
Remote Sensing, Vol. 2, No. 3, pp. 231-251 5. Mukherjee, S. (1987) “Landuse Maps for Conservation of Ecosystems”, Geographical Review of India, Vol. XLIX,
No. 3, pp. 23-28. 6. Quarmby, N.A. and Cushine, J.L. (1989) “Monitoring Urban Land Cover Changes at the Urban Fringe From SPOT
HRV Imagery in South East England” International Journal of Remote Sensing, Vol. 10, No. 6, pp. 231-251. 7. Population Projections for India and States, 2002-2026 (revised Dec, 2006), National Commission of Population,
May 2006, Office of the Registrar General and Census Commissioner of India, Govt of India, New Delhi 8. Prakasam, C. (2010), ‘Land Use and land cover change detection through remote sensing approach: A case study
of Kodaikanal taluk’, International Journal of Geometrics and Geosciences, Vol. n 1, No.10, 2010 9. Trehan, D.K., Economic and Statistical Adviser , Deptt of Staatistics, M/o Agriculture and Cooperation, Govt of India