
Exploring Discharged Dry Cell as an Electrocatalyst for ...
19
doi.org/10.26434/chemrxiv.6935789.v2 Exploring Discharged Dry Cell as an Electrocatalyst for Oxygen Evolution Reaction Esakki Karthik, sanjit Mondal, Lipipushpa Sahoo, Ujjal K. Gautam Submitted date: 17/08/2018 • Posted date: 17/08/2018 Licence: CC BY-NC-ND 4.0 Citation information: Karthik, Esakki; Mondal, sanjit; Sahoo, Lipipushpa; Gautam, Ujjal K. (2018): Exploring Discharged Dry Cell as an Electrocatalyst for Oxygen Evolution Reaction. ChemRxiv. Preprint. High oxophilic d-block compounds of dry cell based manganese materials such as MnO2, Mn3O4, and ZnxMn3O4ကx have excellent electrocatalytic property in oxygen evolution reaction (OER). To seek a way for disposing these dry cell materials, which are unlike rechargeable batteries, these discharged cells result in environmental hazards. Here we optimized these manganese oxides for an energy related applications, particularly for OER. With this aim, we have examined electrocatalytic behavior of both used and fresh dry cells in OER. We have observed that the used dry cell material exhibited 10 mA. cmက2 at an overpotential of 525 mV but fresh dry cell needed 100 mV higher overpotential to achieve same current density. The nature of these fresh and used materials have been analyzed using XRD, SEM, TGA, Raman spectra, FT-IR and contact angle experiments. The higher activity of used dry cell could be ascribed to the generation of highly active Mn3O4 from MnO2 and graphene oxide while discharging conditions. File list (3) download file view on ChemRxiv Electronic supplementry information.pdf (1.82 MiB) download file view on ChemRxiv TOC.jpg (76.98 KiB) download file view on ChemRxiv Manuscript.pdf (1.38 MiB)
Transcript of Exploring Discharged Dry Cell as an Electrocatalyst for ...
doi.org/10.26434/chemrxiv.6935789.v2
Exploring Discharged Dry Cell as an Electrocatalyst for Oxygen EvolutionReactionEsakki Karthik, sanjit Mondal, Lipipushpa Sahoo, Ujjal K. Gautam
Submitted date: 17/08/2018 • Posted date: 17/08/2018Licence: CC BY-NC-ND 4.0Citation information: Karthik, Esakki; Mondal, sanjit; Sahoo, Lipipushpa; Gautam, Ujjal K. (2018): ExploringDischarged Dry Cell as an Electrocatalyst for Oxygen Evolution Reaction. ChemRxiv. Preprint.
High oxophilic d-block compounds of dry cell based manganese materials such as MnO2, Mn3O4, andZnxMn3O4ကx have excellent electrocatalytic property in oxygen evolution reaction (OER). To seek a way fordisposing these dry cell materials, which are unlike rechargeable batteries, these discharged cells result inenvironmental hazards. Here we optimized these manganese oxides for an energy related applications,particularly for OER. With this aim, we have examined electrocatalytic behavior of both used and fresh drycells in OER. We have observed that the used dry cell material exhibited 10 mA. cmက2 at an overpotential of525 mV but fresh dry cell needed 100 mV higher overpotential to achieve same current density. The nature ofthese fresh and used materials have been analyzed using XRD, SEM, TGA, Raman spectra, FT-IR andcontact angle experiments. The higher activity of used dry cell could be ascribed to the generation of highlyactive Mn3O4 from MnO2 and graphene oxide while discharging conditions.
File list (3)
download fileview on ChemRxivElectronic supplementry information.pdf (1.82 MiB)
download fileview on ChemRxivTOC.jpg (76.98 KiB)
download fileview on ChemRxivManuscript.pdf (1.38 MiB)

Exploring discharged dry cell battery as an electrocatalyst for
oxygen evolution reaction
P. Esakki Karthik*, Sanjit Mondal, Lipipupa Sahoo, Ujjal K. Gautam
Department of Chemical Sciences, IISER-Mohali, Punjab, India
S.No. Compound Source OER activity Reference
1 MnOx
Electrodeposition
from MnCl2.4H2O
470 and 540 mV in
neutral and acid medium
@ 0.1 mA.cm-2
D. G. Nocera et al., J.
Am. Chem. Soc. 137, 47,
14887.
2 α-MnO2
KMnO4 and
Mn(OAc)2 and α-
MnO2
0.490 V @ 10 mA.cm-2
(0.1M KOH)
S. L. Suib et al., J. Am.
Chem Soc. 136, 2014,
11452.
3 Pd-Mn3O4/C Mn(NO3)2
0.405V @ 5.0 mA cm-2
(0.1M KOH)
X. Lu et al., J. Mater.
Chem. A, 2014, 2, 18236.
4 Pt-Mn3O4 /C Mn(NO3)2
0.405 V @ 3.9 mA cm-2
(0.1M KOH)
C-w Xu et
al,Electrochimica Acta,
146, 2014, 119.
5
Pd-Mn3O4 on 3D
hierarchical porous
graphene
Mn(NO3)2
0.405 V @ 5.3 mA cm-2
(0.1M KOH)
C-W. Xu et al. Ionics,
doi.org/10.1007/s11581-
018-2435-4
6 Mn3O4
Mn(CH3COO)2.4H2O
+octadecylamine
0.946 V @ 10mA.cm-2
(0.1M KOH)
S. Bhattacharyya, J. Phys.
Chem. C 121, 45, 25594.
8 Mn3O4 Mn(NO3)2
0.46 V @ 5 mA.cm-2
(0.1M KOH)
X. Lu et al, Nanoscale,
2014, 6, 10896.
9 Mn3O4 /Nio MnSO4
0.570V @ 10 mA.cm-2 (1
M KOH)
S. Fiechter et al., J. Phys.
Chem. C 2014, 118,
14073.
10 Mn3O4+ZnMnO4 Used dry cell battery 10 mA.cm-2 at 526 mV This work
Table S1. Comparison of electrocatalytic activity of different type of manganese oxides from literature.
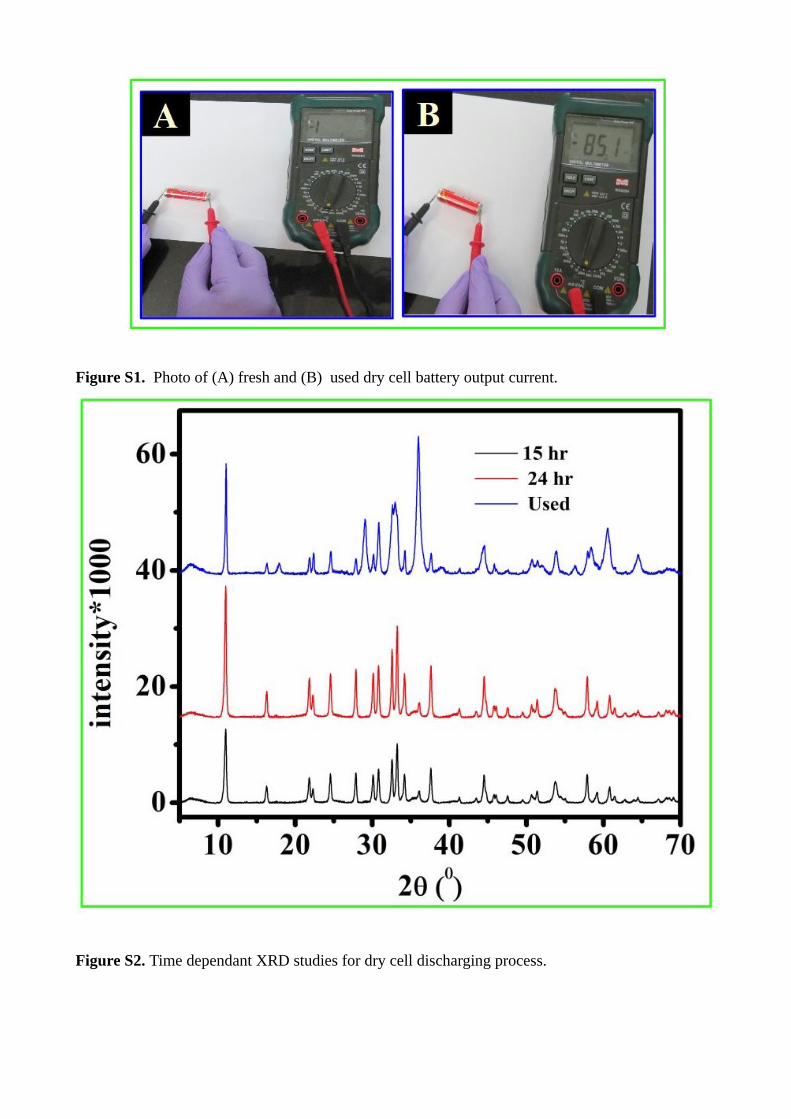
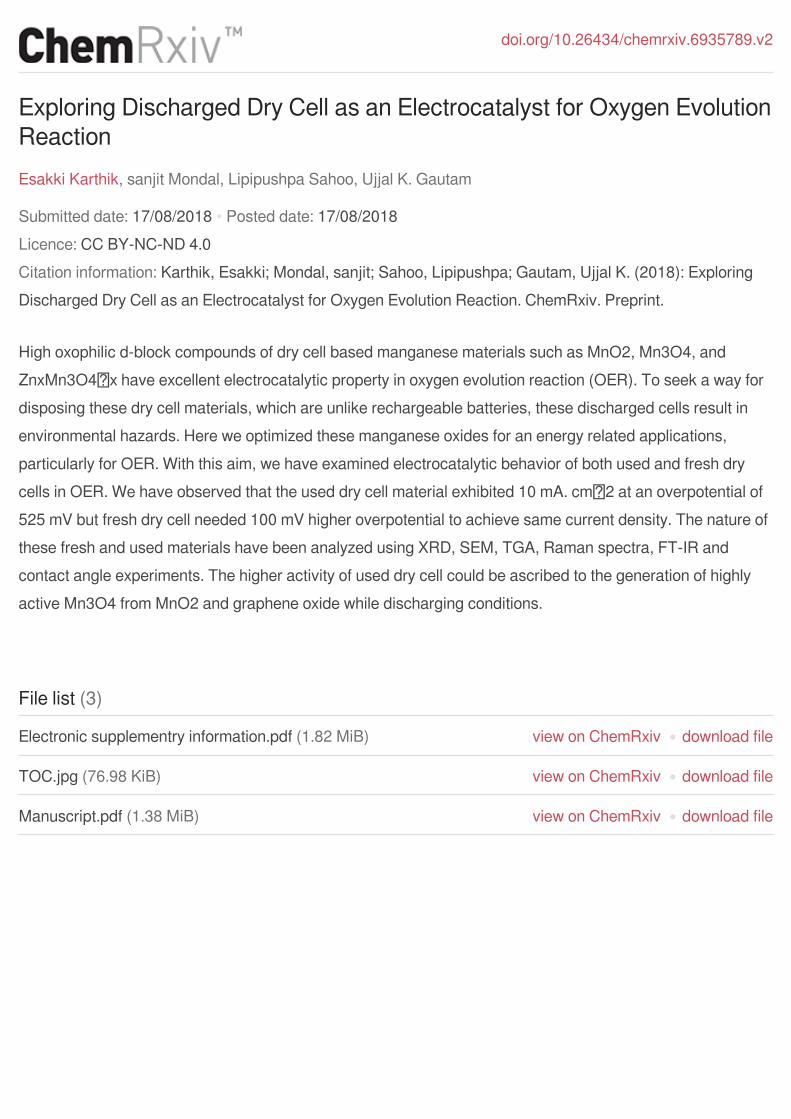
Figure S1. Photo of (A) fresh and (B) used dry cell battery output current.
Figure S2. Time dependant XRD studies for dry cell discharging process.
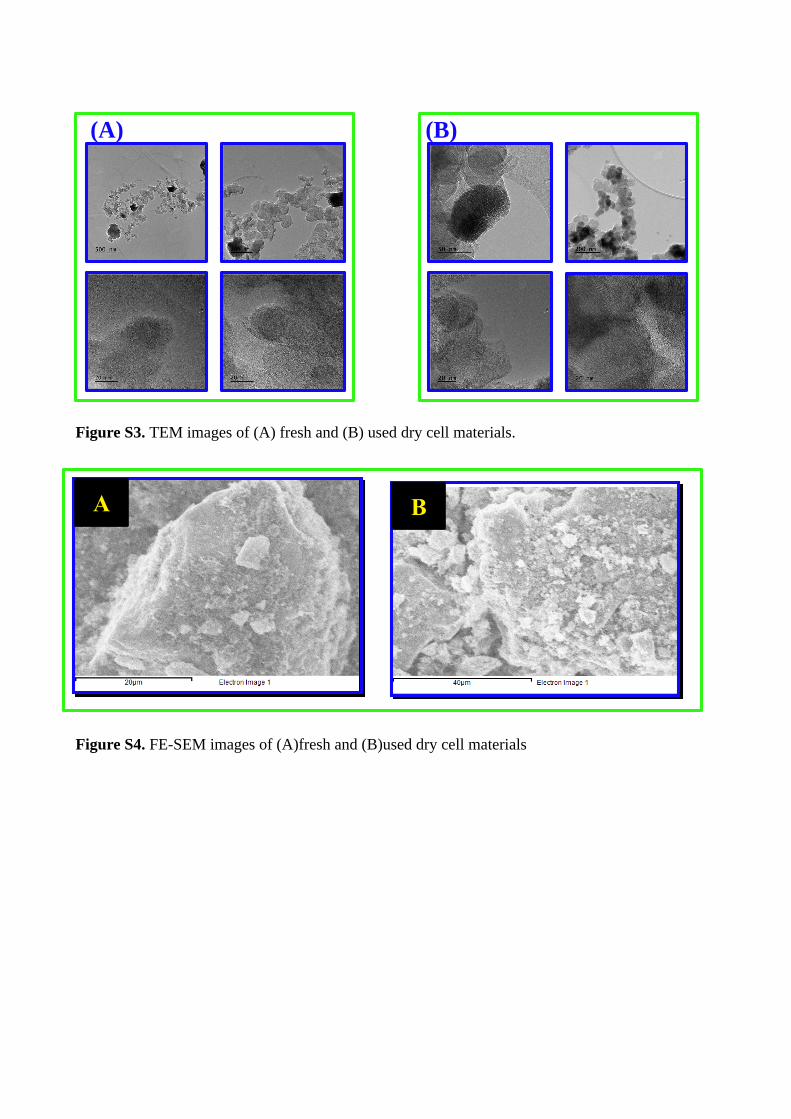
Figure S3. TEM images of (A) fresh and (B) used dry cell materials.
Figure S4. FE-SEM images of (A)fresh and (B)used dry cell materials
(A) (B)
A B
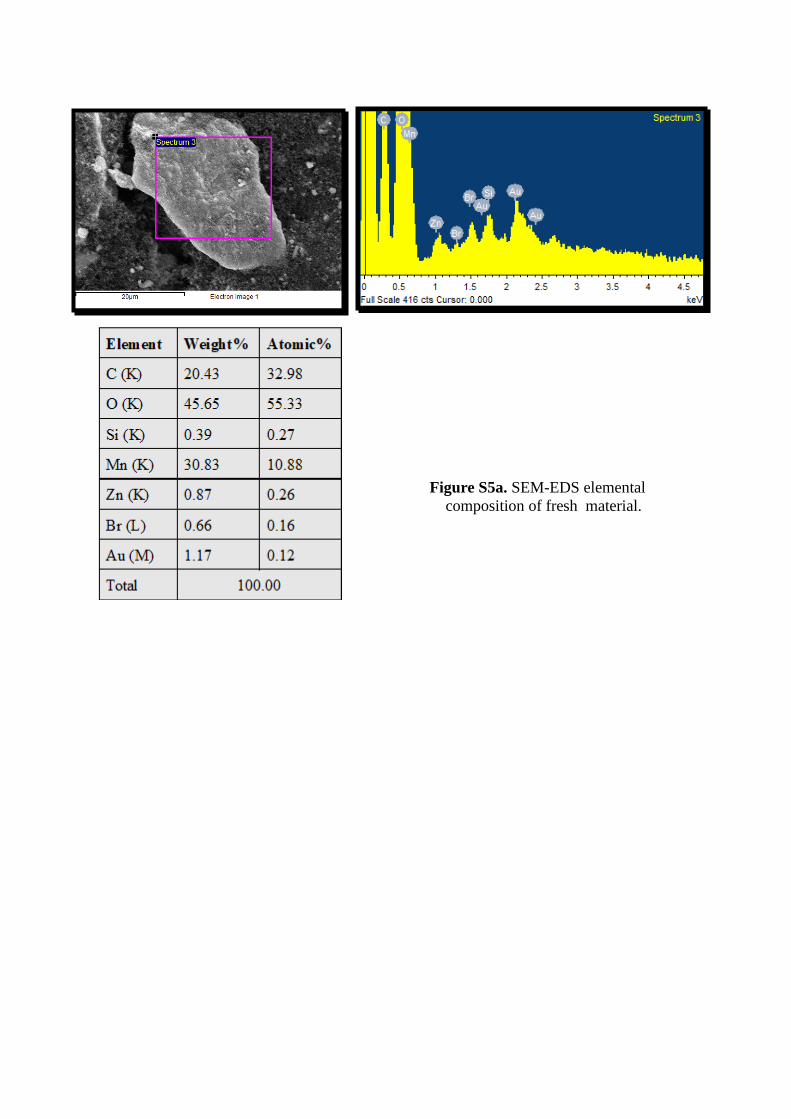
Figure S5a. SEM-EDS elemental composition of fresh material.
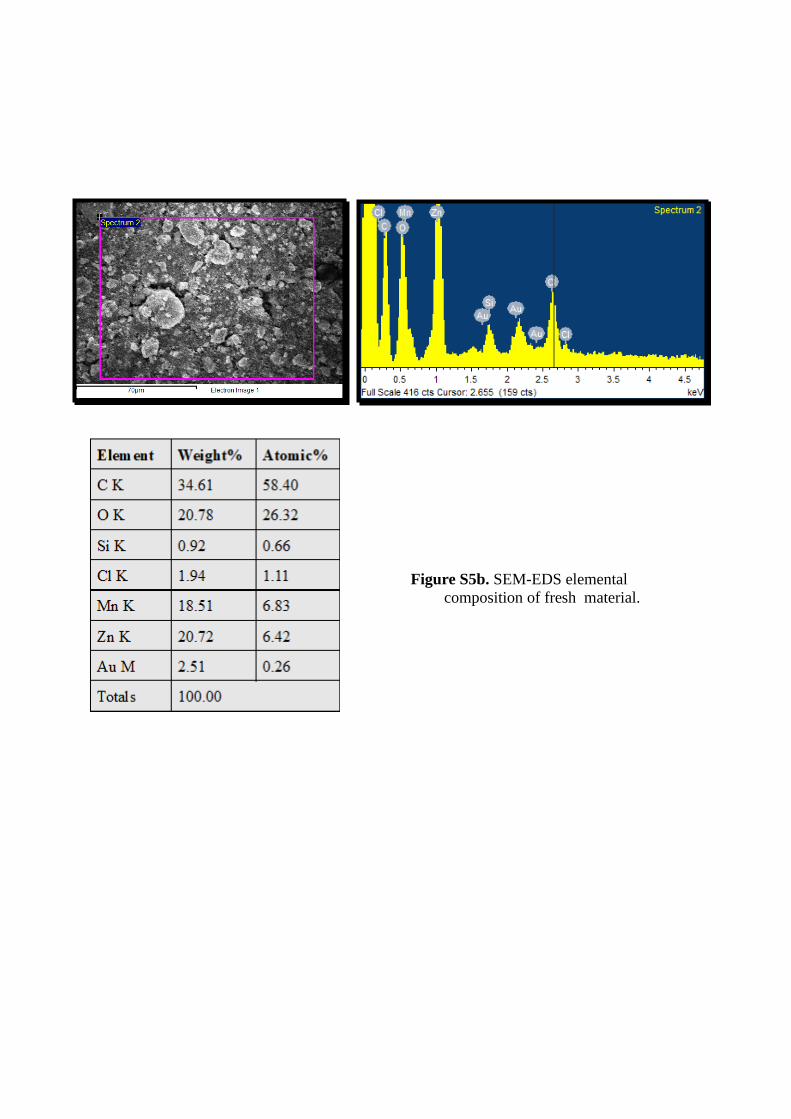
Figure S5b. SEM-EDS elemental composition of fresh material.
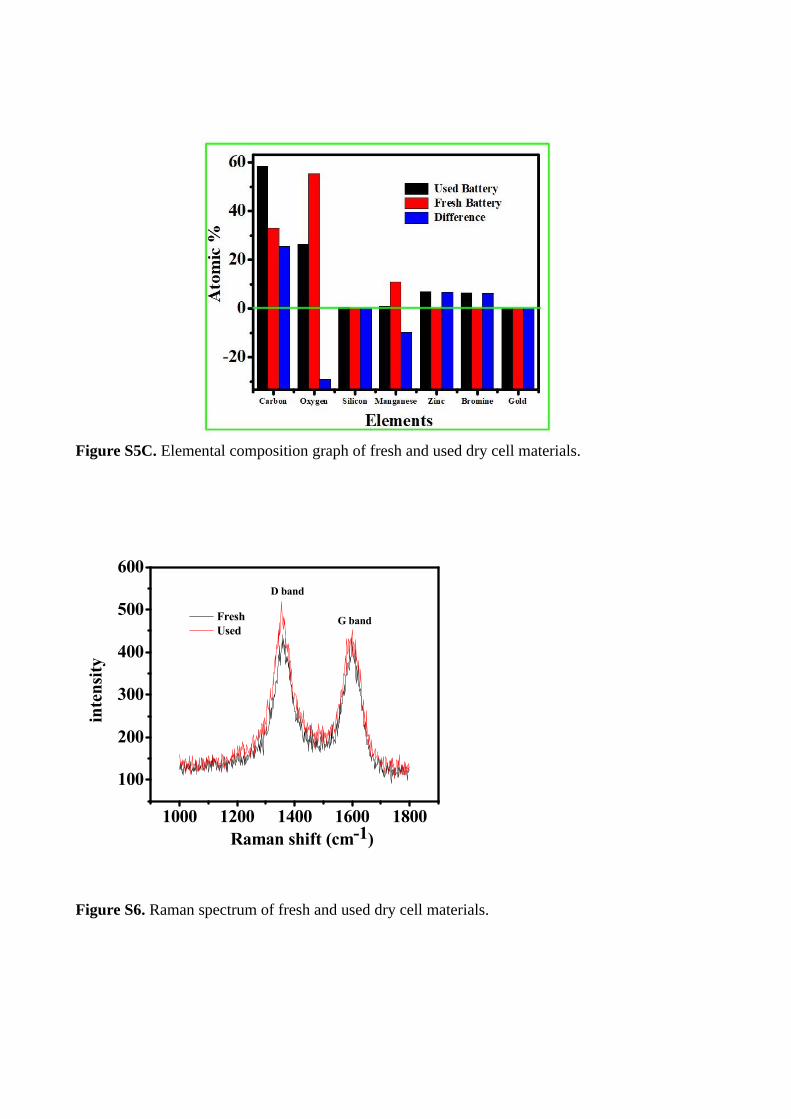
Figure S5C. Elemental composition graph of fresh and used dry cell materials.
1000 1200 1400 1600 1800
100
200
300
400
500
600
G band
inte
nsit
y
Raman shift (cm-1)
Fresh Used
D band
Figure S6. Raman spectrum of fresh and used dry cell materials.
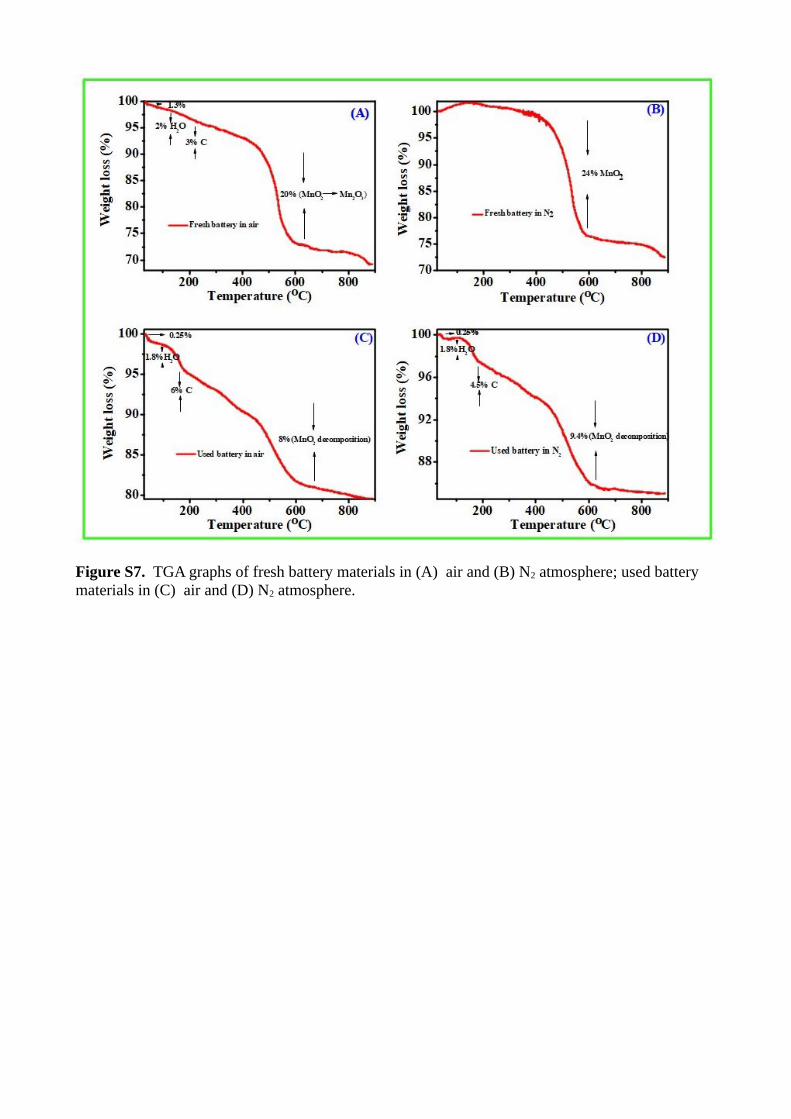
Figure S7. TGA graphs of fresh battery materials in (A) air and (B) N2 atmosphere; used battery materials in (C) air and (D) N2 atmosphere.

download fileview on ChemRxivElectronic supplementry information.pdf (1.82 MiB)

download fileview on ChemRxivTOC.jpg (76.98 KiB)

Exploring discharged dry cell as an electrocatalyst foroxygen evolution reaction†
Pitchiah Esakki Karthik,∗a Sanjit Mondal,a,Lipipuspa Sahoo,a and Ujjal K. Gautama
High oxophilic d-block compounds of dry cell based manganese materials such as MnO2, Mn3O4,and ZnxMn3O4−x have excellent electrocatalytic property in oxygen evolution reaction (OER). Toseek a way for disposing these dry cell materials, which are unlike rechargeable batteries, thesedischarged cells result in environmental hazards. Here we optimized these manganese oxidesfor an energy related applications, particularly for OER. With this aim, we have examined elec-trocatalytic behavior of both used and fresh dry cells in OER. We have observed that the useddry cell material exhibited 10 mA. cm−2 at an overpotential of 525 mV but fresh dry cell needed100 mV higher overpotential to achieve same current density. The nature of these fresh and usedmaterials have been analyzed using XRD, SEM, TGA, Raman spectra, FT-IR and contact angleexperiments. The higher activity of used dry cell could be ascribed to the generation of highlyactive Mn3O4 from MnO2 and graphene oxide while discharging conditions.
1 IntroductionDrycell is an old technology to generate electricity from chemicalenergy for commercial applications, which utilizes chemicalpotential difference between manganese oxide1 and zincmetal.2 3. Due to high abundance of manganese oxides on ourearth crust, the dry cell productions and usages are huge. AfterIron, aluminium and copper, manganese is consumed more byhumans and it is placed at fourth position. While considering theconsumption of Manganese, it is mainly used in steel industry,4
dry cell productions,2 as an oxidation catalyst and pigments5 forchemical companies.6 As a result of these continuous supply ofMn to versatile applications, there is a decrease in the percentageof Mn in soil.7 Among all applications, because of irreversible ox-ide’s reduction nature of manganese, it’s application is restrictedand this happens especially in dry cells, therefore after used theyare considered to be waste materials.8 The consequence of thismass production and usage, the contamination of manganesecompounds to the environment is increasing day-by day. ThoughManganese is not a heavy metal, lethal dosage half populationof this material appreciably high (acute oral LD50 of > 3478mg/kg with reference to rat)9 and non carcinogenic compound,it creates lot of several health issues at high concentration levelin drinking water such as Alzheimer, Parkinson like disease and
a Department of Chemical Sciences, IISER-Mohali, SAS Nagar, Punjab, India.Fax:2240266,2240124; Tel:9840671987; E-mail:[email protected]† Electronic Supplementary Information (ESI) available: [Table of various Mn3O4and MnO2 catalyst activity in OER, FE-SEM images and EDS elemental composition,TEM images, Raman spectra and TGA graphs]. See DOI: 10.1039/b000000x/
neurological disorders.10 Recently, M. Aschner et al. reportedthat the health hazardous effect and seriousness of manganesecontamination in drinking water, soil and air. In that, theyhave shown manganese neurotoxicity effect from C.elegansto human.11 12 Further manganese elements react with otherpollutant compound such as DDT, which affects river livesseverely. S. Medrano et al. reported that the toxic effect of theseco-pollutant nature of Mn is much more harmful than pesticidesalone.13 S. F. Ali et al. reported that the generation of ReactiveOxygen species(ROS)from manganese based pollutant and theireffects, also he confirmed that manganese in valency of threeis more potential to generate ROS than Mn(II).14 H. Ahsan etal reported that the reactive oxygen species can be a cause ofcancer, which facilitate the DNA oxidative damages.15 Thesereports exemplified the harmful nature of manganese basedpollutants. The dry cell is fully made up of MnO2 compound,which is converted to several reduced form of lower oxidesduring discharging process, which scientific society has not beenfully aware about the effect of this waste. Thus, the waste drycell could solely be a main cause of manganese based pollution.Though this is an old technology, material based investigation islimited in modern literature. The environmental cause and highusage of this technology alarm us to revisit these materials withthe help of modern science & technology. Because of portability,cheap and easy fabrication of this energy conversion technologycannot be forbidden and our modern world needs more batteriesto solve energy crisis. Recently researchers are showing interestin the area of investigating electrochemical application on waste
Journal Name, [year], [vol.], 1–8 | 1

batteries such as supercapacitor application and water splittingreaction from used lithium ion battery materials(LiCoO2).16 17
These reports emphasized that currently scientists are tryingto find suitable methodology to utilize the waste material,specifically electrochemical applications for attaining pollutionfree environment. Further, dry cell is a type of non-rechargeablebattery, it has inside hazardous multi-oxides of manganesematerials, which either has to be disposed properly or reusedin another applications to avoid aforementioned environmentalproblem. General chemical reaction of discharging process ofthis cell is shown in equation (1)18
Zn + 2MnO2 + 2NH4ClDischarging−−−−−−−→ ZnCl2 + Mn2O3 + 2NH3 +
H2O.....(1)ZnCl2 + 2NH3 → Zn(NH3)2 Cl2.....(2)
In addition to 1 and 2 reactions, there are other reactionslike Mn3O4 formation, reaction of Zn2+ with MnO2 and Mn3O4whereby the penetration of Zn2+ to MnO2 and Mn3O4 result inthe formation of Zn doped Mn oxides. This zinc doping also de-pends on the rate of discharging, temperature and inside mate-rial quality such as membrane (ammonium chloride electrolytesoaked cotton served as an ionic conductive membrane) and dis-tance between carbon rod (+) and Zn-plate(-).In general, the manganese based oxides have excellent stabilityagainst chemical,19 electrochemical20 and thermal condition andit cannot be easily converted to source element manganese. Pyro-metallurgy and hydro-metallurgical methods are present indus-trial routes for waste battery recycling process,21 but it needsenormous energy. High thermal reaction, electrolysis or vigor-ous chemical treatment such as H2SO4 with oxalic acid as re-ducing agent may be useful to recycle and purify this waste ma-terials.22 Unfortunately these multi-oxide solid manganese ma-terials recycling technology needs more energy than manganesemining. Owing to this high cost problem, people are not show-ing interest on recycling technology. Hence, we need focus onreusing these waste materials to save our environment from bat-tery waste. All manganese based oxides showed appreciable elec-trocatalytic activity towards water oxidation23 and reduction re-action.24 Manganese has exhibited excellent potential to stabilizethe oxo-compound, it is evident that many manganese based oxo-compound is reported in literature.25 26 27 This oxo-phillic natureof manganese based oxides makes superior electrochemical wateroxidation catalyst than reduction.28 Mn based oxides can thermochemically oxidize the water at low temperature, it is evident thatthis compound become a excellent electrocatalyst.29 D. G. Noceraet al., reported the OER activity of MnO2, he proposed Mn3O4
intermediate formation from MnO2 during OER, which later con-verted to disordered γ-MnO2. This report suggested that OERon manganese oxides involve several intermediate oxides such asfrom MnO2, Mn3O4 and MnOX .30 These materials might be prob-ably generated during dry cell discharging process, which is in-vestigated in this report. S Fiechter et al., thoroughly studied theelectrocatalytic efficiency in oxygen evolution reaction on variousmanganese based oxides namely MnOx, Mn2O3, and Mn3O4 andamong them Mn2O3 showed better performance.31 In this study,we have analyzed the fresh and used dry cell materials with the
help of XRD, SEM-EDS, TEM, Raman and contact angle studies.The electrocatalytic activity of these material was studied in OER,we have observed the discharged dry cell material exhibited OERbench marking current 10mA.cm−1 at 525 mV, which is 100 mVlesser than fresh dry cell material activity as shown in Fig1. Thiselectrocatalytic efficiency of used dry cell is comparable with pre-vious literature reported manganese based electrocatalyts shownin Table (ESI-1).
Fig. 1 Schematic of OER activity on fresh and used dry cells, insertpicture: appearance of fresh and used drycell material.
2 Experimental2.1 Materials
Analytical grade(A.R) chemicals such as acetone, propanol,sodium hydroxide and 5% Nafion solution were purchased fromSigma Aldrich Inc. Fresh and used commercial dry cells were col-lected from local shop. All solutions were prepared using Milli-Qwater(Resistance=18.2 MΩ.cm).
2.2 Components of dry cells
Figure2 shows the components of commercial dry cell. After re-moving commercial outside cover, inside polymer material in-sulated zinc plate covered cylindrical dry cell32 shown in fig-ure2(A)I, observed polymer insulation prevent the dry cell fromshort circuit. The graphite rod (cathode), Zn plate (anode) andionic conductive cotton paper between cathode and anode werepresented in Figure 2.
2.3 Extraction of Manganese oxides from dry cell
Commercial dry cell outside cover was carefully removed and fol-lowed by detaching insulating material, as shown in Fig.2AII. In-side zinc plate and carbon rod were manually separated fromdry cell oxides. In the case of used dry cell, zinc would bepenetrated to dry cell material during discharging process, zinc
2 | 1–8Journal Name, [year], [vol.],
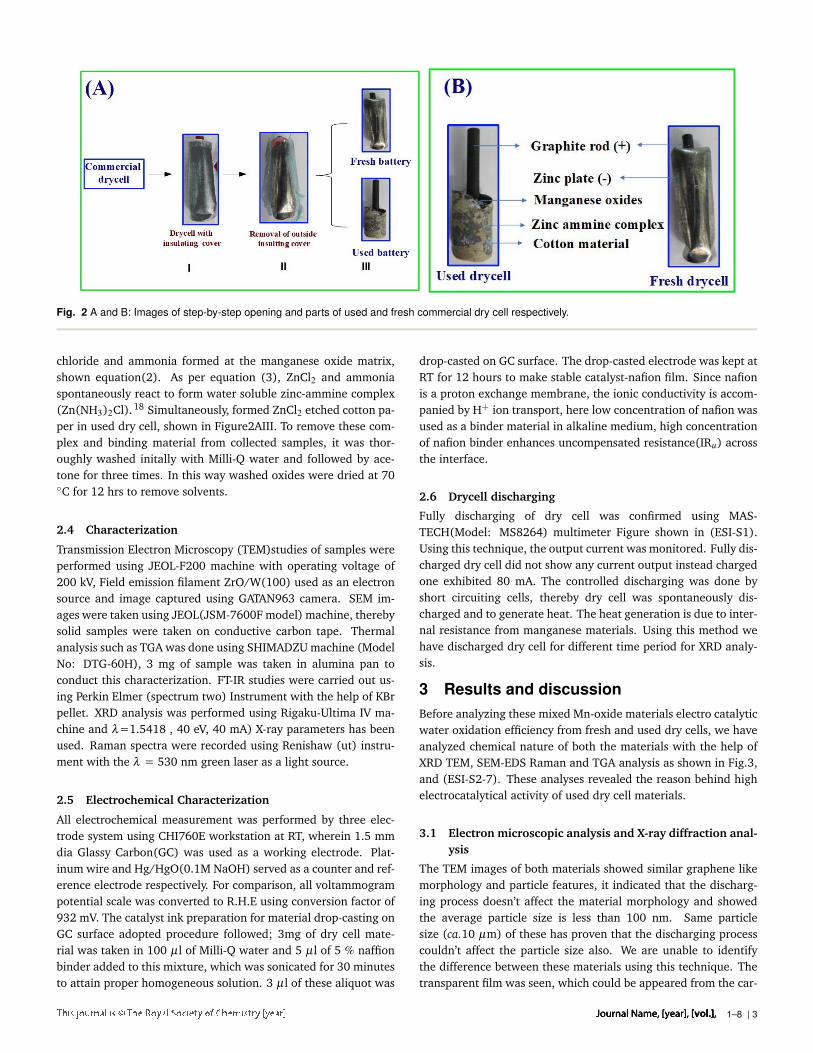
Fig. 2 A and B: Images of step-by-step opening and parts of used and fresh commercial dry cell respectively.
chloride and ammonia formed at the manganese oxide matrix,shown equation(2). As per equation (3), ZnCl2 and ammoniaspontaneously react to form water soluble zinc-ammine complex(Zn(NH3)2Cl).18 Simultaneously, formed ZnCl2 etched cotton pa-per in used dry cell, shown in Figure2AIII. To remove these com-plex and binding material from collected samples, it was thor-oughly washed initally with Milli-Q water and followed by ace-tone for three times. In this way washed oxides were dried at 70C for 12 hrs to remove solvents.
2.4 Characterization
Transmission Electron Microscopy (TEM)studies of samples wereperformed using JEOL-F200 machine with operating voltage of200 kV, Field emission filament ZrO/W(100) used as an electronsource and image captured using GATAN963 camera. SEM im-ages were taken using JEOL(JSM-7600F model) machine, therebysolid samples were taken on conductive carbon tape. Thermalanalysis such as TGA was done using SHIMADZU machine (ModelNo: DTG-60H), 3 mg of sample was taken in alumina pan toconduct this characterization. FT-IR studies were carried out us-ing Perkin Elmer (spectrum two) Instrument with the help of KBrpellet. XRD analysis was performed using Rigaku-Ultima IV ma-chine and λ=1.5418 , 40 eV, 40 mA) X-ray parameters has beenused. Raman spectra were recorded using Renishaw (ut) instru-ment with the λ = 530 nm green laser as a light source.
2.5 Electrochemical Characterization
All electrochemical measurement was performed by three elec-trode system using CHI760E workstation at RT, wherein 1.5 mmdia Glassy Carbon(GC) was used as a working electrode. Plat-inum wire and Hg/HgO(0.1M NaOH) served as a counter and ref-erence electrode respectively. For comparison, all voltammogrampotential scale was converted to R.H.E using conversion factor of932 mV. The catalyst ink preparation for material drop-casting onGC surface adopted procedure followed; 3mg of dry cell mate-rial was taken in 100 µl of Milli-Q water and 5 µl of 5 % naffionbinder added to this mixture, which was sonicated for 30 minutesto attain proper homogeneous solution. 3 µl of these aliquot was
drop-casted on GC surface. The drop-casted electrode was kept atRT for 12 hours to make stable catalyst-nafion film. Since nafionis a proton exchange membrane, the ionic conductivity is accom-panied by H+ ion transport, here low concentration of nafion wasused as a binder material in alkaline medium, high concentrationof nafion binder enhances uncompensated resistance(IRu) acrossthe interface.
2.6 Drycell discharging
Fully discharging of dry cell was confirmed using MAS-TECH(Model: MS8264) multimeter Figure shown in (ESI-S1).Using this technique, the output current was monitored. Fully dis-charged dry cell did not show any current output instead chargedone exhibited 80 mA. The controlled discharging was done byshort circuiting cells, thereby dry cell was spontaneously dis-charged and to generate heat. The heat generation is due to inter-nal resistance from manganese materials. Using this method wehave discharged dry cell for different time period for XRD analy-sis.
3 Results and discussionBefore analyzing these mixed Mn-oxide materials electro catalyticwater oxidation efficiency from fresh and used dry cells, we haveanalyzed chemical nature of both the materials with the help ofXRD TEM, SEM-EDS Raman and TGA analysis as shown in Fig.3,and (ESI-S2-7). These analyses revealed the reason behind highelectrocatalytical activity of used dry cell materials.
3.1 Electron microscopic analysis and X-ray diffraction anal-ysis
The TEM images of both materials showed similar graphene likemorphology and particle features, it indicated that the discharg-ing process doesn’t affect the material morphology and showedthe average particle size is less than 100 nm. Same particlesize (ca.10 µm) of these has proven that the discharging processcouldn’t affect the particle size also. We are unable to identifythe difference between these materials using this technique. Thetransparent film was seen, which could be appeared from the car-
Journal Name, [year], [vol.], 1–8 | 3
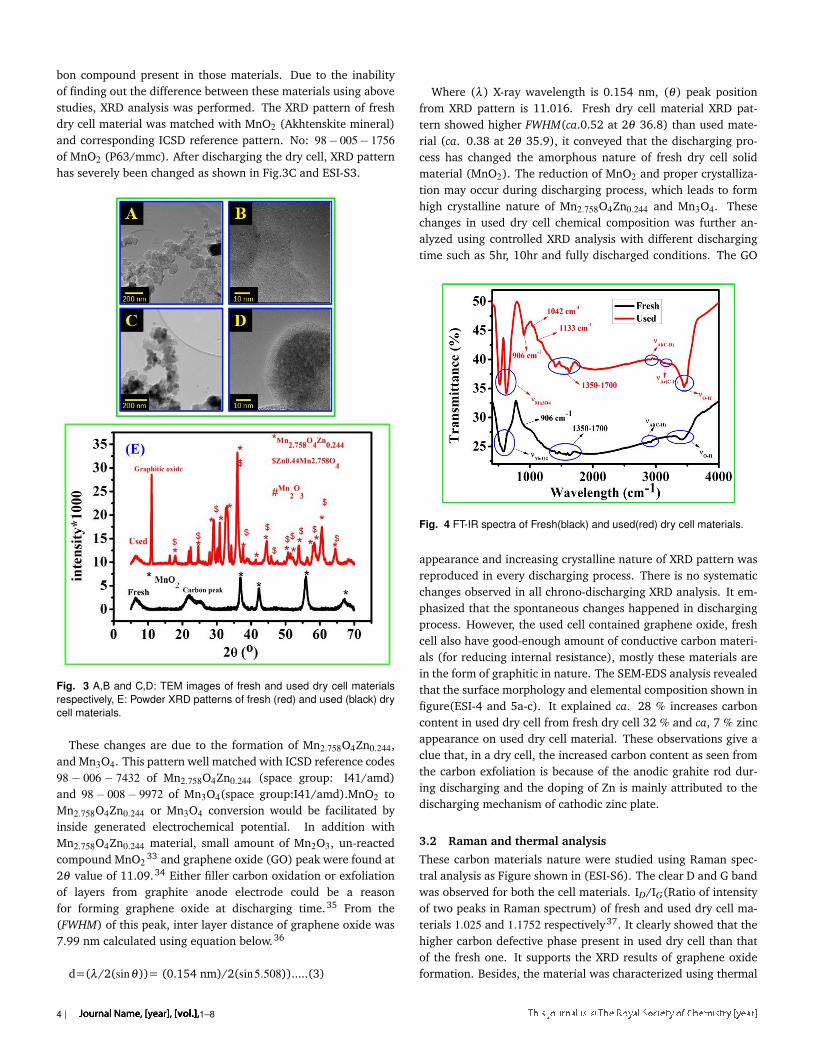
bon compound present in those materials. Due to the inabilityof finding out the difference between these materials using abovestudies, XRD analysis was performed. The XRD pattern of freshdry cell material was matched with MnO2 (Akhtenskite mineral)and corresponding ICSD reference pattern. No: 98− 005− 1756of MnO2 (P63/mmc). After discharging the dry cell, XRD patternhas severely been changed as shown in Fig.3C and ESI-S3.
Fig. 3 A,B and C,D: TEM images of fresh and used dry cell materialsrespectively, E: Powder XRD patterns of fresh (red) and used (black) drycell materials.
These changes are due to the formation of Mn2.758O4Zn0.244,and Mn3O4. This pattern well matched with ICSD reference codes98− 006− 7432 of Mn2.758O4Zn0.244 (space group: I41/amd)and 98− 008− 9972 of Mn3O4(space group:I41/amd).MnO2 toMn2.758O4Zn0.244 or Mn3O4 conversion would be facilitated byinside generated electrochemical potential. In addition withMn2.758O4Zn0.244 material, small amount of Mn2O3, un-reactedcompound MnO2
33 and graphene oxide (GO) peak were found at2θ value of 11.09.34 Either filler carbon oxidation or exfoliationof layers from graphite anode electrode could be a reasonfor forming graphene oxide at discharging time.35 From the(FWHM) of this peak, inter layer distance of graphene oxide was7.99 nm calculated using equation below.36
d=(λ/2(sinθ))= (0.154 nm)/2(sin5.508)).....(3)
Where (λ) X-ray wavelength is 0.154 nm, (θ) peak positionfrom XRD pattern is 11.016. Fresh dry cell material XRD pat-tern showed higher FWHM(ca.0.52 at 2θ 36.8) than used mate-rial (ca. 0.38 at 2θ 35.9), it conveyed that the discharging pro-cess has changed the amorphous nature of fresh dry cell solidmaterial (MnO2). The reduction of MnO2 and proper crystalliza-tion may occur during discharging process, which leads to formhigh crystalline nature of Mn2.758O4Zn0.244 and Mn3O4. Thesechanges in used dry cell chemical composition was further an-alyzed using controlled XRD analysis with different dischargingtime such as 5hr, 10hr and fully discharged conditions. The GO
Fig. 4 FT-IR spectra of Fresh(black) and used(red) dry cell materials.
appearance and increasing crystalline nature of XRD pattern wasreproduced in every discharging process. There is no systematicchanges observed in all chrono-discharging XRD analysis. It em-phasized that the spontaneous changes happened in dischargingprocess. However, the used cell contained graphene oxide, freshcell also have good-enough amount of conductive carbon materi-als (for reducing internal resistance), mostly these materials arein the form of graphitic in nature. The SEM-EDS analysis revealedthat the surface morphology and elemental composition shown infigure(ESI-4 and 5a-c). It explained ca. 28 % increases carboncontent in used dry cell from fresh dry cell 32 % and ca, 7 % zincappearance on used dry cell material. These observations give aclue that, in a dry cell, the increased carbon content as seen fromthe carbon exfoliation is because of the anodic grahite rod dur-ing discharging and the doping of Zn is mainly attributed to thedischarging mechanism of cathodic zinc plate.
3.2 Raman and thermal analysis
These carbon materials nature were studied using Raman spec-tral analysis as Figure shown in (ESI-S6). The clear D and G bandwas observed for both the cell materials. ID/IG(Ratio of intensityof two peaks in Raman spectrum) of fresh and used dry cell ma-terials 1.025 and 1.1752 respectively37. It clearly showed that thehigher carbon defective phase present in used dry cell than thatof the fresh one. It supports the XRD results of graphene oxideformation. Besides, the material was characterized using thermal
4 | 1–8Journal Name, [year], [vol.],
studies such as thermogravimetric (TGA) analysis, Figure shownin (ESI-S6). The temperature vs. weight loss TGA curve of freshmaterial has different thermal decomposition characteristics fromused dry cell, shown in figure (ESI-S7).
Fig. 5 A and B: Nyquist and bode impedance plot of dry cell material atequilibrium condition.
Material from fresh dry cell in N2 atmosphere did not showany weight loss upto 400 C but in an air atmosphere showedseries of weight losses starting from 27.5 to 610 C. The initial1.3 % weight loss upto 100 C could be attributed to evaporationof easily volatile compound from sample. The next 2 % weightloss started from 100 to 240 C may be from loss of moisture.Followed by 3.5 % weight loss appeared in the range of 240 to400 C,38 which would be from loss of carbon. In the range of440-610 C almost 20 and 24 % weight loss were observed inair and N2 atmosphere respectively, which could be ascribed tothe loss of oxygen from MnO2. 3.5 % increased weight loss inN2 medium is due to oxygen removal accompanied with carbonoxidation by oxygen from MnO2 decomposition reaction. TheO2 removal from MnO2 at 483 C to form Mn2O3, shown inequation(4)39
MnO2 483oC−−−→ 2Mn2O3 + O2.....(4)
Conversely, used dry cell material showed similar weight losspattern in N2 and air atmosphere. Apart from initial 2.3 % H2O
loss, next 6.3 and 4 % carbon loss was seen in air and N2 atmo-sphere from graphene oxide(GO) in the range 169-421 C. Thishigher weight loss was seen in air atmosphere may be understoodthat the complete oxidation of carbon under air. Next 8 and 9.6% weight losses were seen in air and N2 atmosphere in the rangeof 420-640 C, it is from unreacted MnO2 decomposition at dis-charging process. Because of unoxidized carbon might oxidized inN2 atmoshphere at higher thermal region of 420-640 C, thus re-flect 1.6 % higher weight loss than air. In used dry cell, carbon de-composition was observed even at N2 atmosphere also, this couldbe understood that the presence of graphene oxide(GO), whichcan supply oxygen for carbon decomposition. MnO2 thermal de-composition has been shown in equation (4). For comparison,fresh and used dry cell material properties are tabulated in table1.
3.3 Mechanism of formation of graphitic oxide in dry cell
The graphene oxide formation in Lechlanche cell could be ex-plained through oxygen reduction reaction (ORR), this processaccompanied with Mn02 reduction at graphite-Mn02 interface.Anode manganese dioxide reduction with cathode Zn oxidationis overall electrochemical reaction in this cell, shown in equation(5)
2Mn02 + 2NH4+ + 2e−D ischarging−−−−−−−→Mn2O3 + 2NH3 + H20.....(5)
O2 + e− −→ [O2-. +4H+]intermediate−→ 2H2O.....(6)
In the above equation, product water and Mn203 are formingfrom reactant Mn02, in which the electrochemical potential dif-ference between Znoxidation and Mn02reduction is not only reduc-ing Mn203 but also oxygen too. The result of oxygen reductiongives water through super oxide intermediates, shown in equa-tion (1). The oxygen reduction coupled with zinc oxidation is wellknown the area of Zn-air batteries40, overall potential (O2reduction-Znoxidation)=1.23-0.76V=0.47V. This over all positive potentialfacilitate ORR at the graphitic anode electrode with MnO2 matrix.These extremely reactive super oxides convert graphite anode tographitic-oxide materials by etching carbon surfaces.
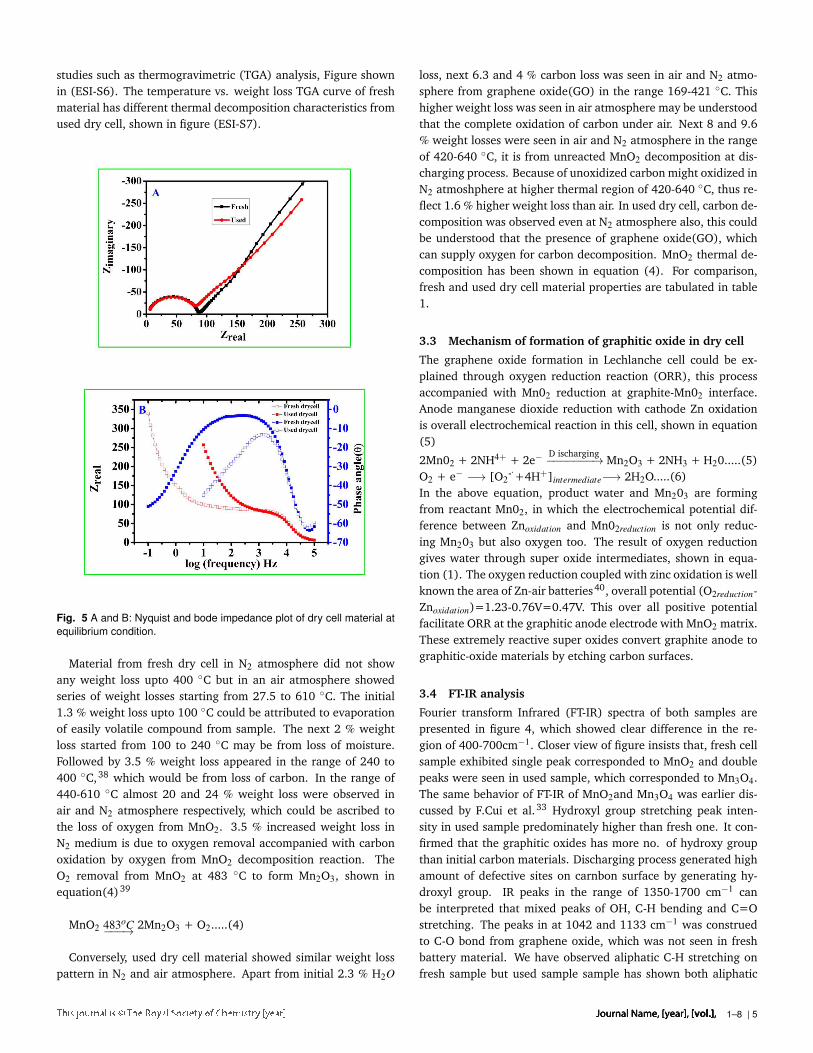
3.4 FT-IR analysis
Fourier transform Infrared (FT-IR) spectra of both samples arepresented in figure 4, which showed clear difference in the re-gion of 400-700cm−1. Closer view of figure insists that, fresh cellsample exhibited single peak corresponded to MnO2 and doublepeaks were seen in used sample, which corresponded to Mn3O4.The same behavior of FT-IR of MnO2and Mn3O4 was earlier dis-cussed by F.Cui et al.33 Hydroxyl group stretching peak inten-sity in used sample predominately higher than fresh one. It con-firmed that the graphitic oxides has more no. of hydroxy groupthan initial carbon materials. Discharging process generated highamount of defective sites on carnbon surface by generating hy-droxyl group. IR peaks in the range of 1350-1700 cm−1 canbe interpreted that mixed peaks of OH, C-H bending and C=Ostretching. The peaks in at 1042 and 1133 cm−1 was construedto C-O bond from graphene oxide, which was not seen in freshbattery material. We have observed aliphatic C-H stretching onfresh sample but used sample sample has shown both aliphatic
Journal Name, [year], [vol.], 1–8 | 5

and aromatic C-H stretching.
Table 1 Comparison of fresh and used dry cell material properties
Property Fresh dry cell material Used dry cell material
Appearance Black powder Black powder
Chemical nature MnO2 Mn2.758O4Zn0.244
Carbon nature Conductive carbon Conductive carbon withgraphene oxide
Wettablity Hydrophobic Hydrophilic
Electrocatalysis inOER (η , j0) 3.11*10−8, 626 mV 5.68*10−6, 526 mV
Nature of Manganese MnO2 Mn3O4, MnZnO4
3.5 Electrocatalytic studies
Electro-catalytical efficiency of oxygen evolution reaction(OER)of fresh and used dry cell material is shown in Fig.6. It corrob-orated the higher electrocatlytic activity of used dry cell, nearly100 mV decreased overpotential observed at OER current den-sity of 10mA.cm−2 than fresh one. The fresh dry cell materialshowed higher background current than used one, which con-veyed ca. 5 times higher double layer capacitance(Cdl) nature.Further we have observed the OER onset potential of used drycell material is 120 mV lower than fresh one. For comparisonwith earlier report, IR corrected oxygen evolution has been pre-sented in Fig. 6B, it indicated absolute OER activity and showedη=526 mV @ 10 mA.cm−2. IR correction of 6Ω from solutionresistance (Rs) was done using impedance analysis as shown infig5. Comparison with Mn2O3, MnO2 exhibited poor electro-catalytic activity towards OER, which was recently observed byFiechter et al.31 When dry cell discharges, the inside MnO2 re-duced to form highly electroactive Mn2O3 and various amount ofzinc doped with Mn2O3 present with some un-reacted Zn-dopedMnO2. Hence, this used material exhibited better OER electro-catalytic activity than fresh dry cell MnO2. The plot betweenoverpotential(η) vs. log j Tafel analysis is shown in Fig.7, it pre-sented the high electrocatalytic activity of used dry cell materialTafel slope of 105 mV/decade, which is lower than fresh dry cellmaterials slope of 140 mV. Lower Tafel slope of used dry cell ma-terial corroborated the facile electron transfer in OER41.42 Equi-librium exchange current density (j0) of fresh and used dry cellmaterial was calculated by extrapolating Tafel plot, which was3.11*10−8 mA.cm−2 and 5.68*10−6 mA.cm−2 respectively. Theused dry cell (j0) was two decades higher than fresh dry cell ma-terials, it supported fast kinetics of electron transfer on used drycell material than fresh one.43 The onset of OER was also 100 mVnegatively shifted. The high capacitance of fresh dry cell may becorrelated by high surface area such that electrochemical activeMnO2 would be masked by carbon matrix. In the case of used drycell, the active manganese oxide protrude outside and exposed tothe electrolytes, thus gave lower capcitance since both have sameparticle size. Manganese oxide protruding could be facilitated by
Fig. 6 A: Linear Scan Voltammetry (LSV) of fresh and used dry cellmaterial water oxidation curve and B: LSV of water oxidation reaction onused dry cell material with and without IR compensation at a scan rate of5 mV/s in 0.1M NaOH.
discharging process The accelerated stability test of used dry cellmaterial using 5000 potential cycling in OER range of 0.2 to 1.8V vs. R.H.E. Fig. 7B has shown only 0.2% current reduction at1.852V after 5000 accelerated potential cycling. Small amountof decrease in material leaches was seen in decreasing doublelayer capacitance in figure 7B shown by inserting circle. Equilib-rium state impedance analysis of these materials was presented inFigure5, Nyquist plot impedance analysis revealed charge trans-fer resistances (Rct)s’ of fresh and used dry cell materials are 84and 87Ω respectively. Due to capacitance difference of used andfresh dry cell, these impedance-spectra were performed in dif-ferent applied frequencies to achieve Warburg impedance, whichwas clearly seen in Bode plot. Bode plot explicit that operatingfrequency range 10 to 10 5 Hz and 0.1 to 10 5 Hz. High capaci-tance nature of fresh dry cell material and resistance increase thetime constant(RC=τ), thus shifted Warburg impedance to lowerfrequency region .Contact angle experiment revealed that the amount of water in-teraction with catalyst, as shown in Fig. 7C and D. It displayedused dry cell material has 19 contact angle (θ = 100) lesserthan fresh dry cell material (θ = 119), the lower contact anglecould be understood by formation of high surface polarity Mn3O4
6 | 1–8Journal Name, [year], [vol.],
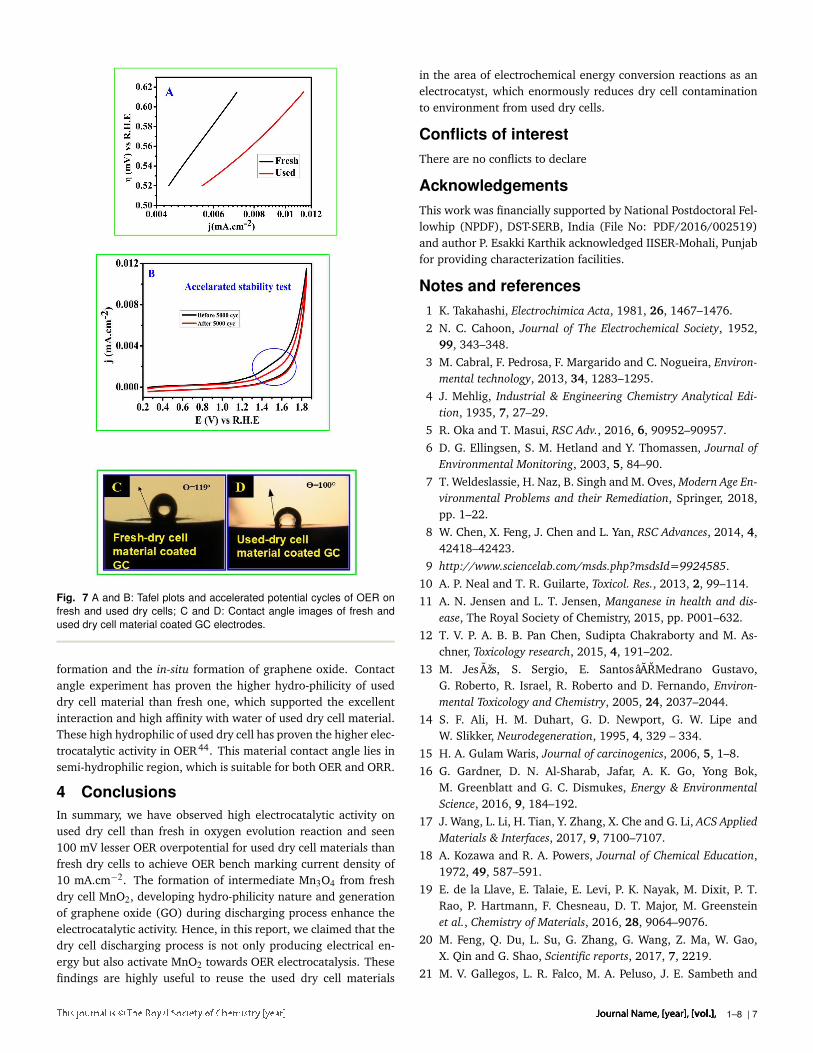
Fig. 7 A and B: Tafel plots and accelerated potential cycles of OER onfresh and used dry cells; C and D: Contact angle images of fresh andused dry cell material coated GC electrodes.
formation and the in-situ formation of graphene oxide. Contactangle experiment has proven the higher hydro-philicity of useddry cell material than fresh one, which supported the excellentinteraction and high affinity with water of used dry cell material.These high hydrophilic of used dry cell has proven the higher elec-trocatalytic activity in OER44. This material contact angle lies insemi-hydrophilic region, which is suitable for both OER and ORR.
4 ConclusionsIn summary, we have observed high electrocatalytic activity onused dry cell than fresh in oxygen evolution reaction and seen100 mV lesser OER overpotential for used dry cell materials thanfresh dry cells to achieve OER bench marking current density of10 mA.cm−2. The formation of intermediate Mn3O4 from freshdry cell MnO2, developing hydro-philicity nature and generationof graphene oxide (GO) during discharging process enhance theelectrocatalytic activity. Hence, in this report, we claimed that thedry cell discharging process is not only producing electrical en-ergy but also activate MnO2 towards OER electrocatalysis. Thesefindings are highly useful to reuse the used dry cell materials
in the area of electrochemical energy conversion reactions as anelectrocatyst, which enormously reduces dry cell contaminationto environment from used dry cells.
Conflicts of interestThere are no conflicts to declare
AcknowledgementsThis work was financially supported by National Postdoctoral Fel-lowhip (NPDF), DST-SERB, India (File No: PDF/2016/002519)and author P. Esakki Karthik acknowledged IISER-Mohali, Punjabfor providing characterization facilities.
Notes and references1 K. Takahashi, Electrochimica Acta, 1981, 26, 1467–1476.2 N. C. Cahoon, Journal of The Electrochemical Society, 1952,
99, 343–348.3 M. Cabral, F. Pedrosa, F. Margarido and C. Nogueira, Environ-
mental technology, 2013, 34, 1283–1295.4 J. Mehlig, Industrial & Engineering Chemistry Analytical Edi-
tion, 1935, 7, 27–29.5 R. Oka and T. Masui, RSC Adv., 2016, 6, 90952–90957.6 D. G. Ellingsen, S. M. Hetland and Y. Thomassen, Journal of
Environmental Monitoring, 2003, 5, 84–90.7 T. Weldeslassie, H. Naz, B. Singh and M. Oves, Modern Age En-
vironmental Problems and their Remediation, Springer, 2018,pp. 1–22.
8 W. Chen, X. Feng, J. Chen and L. Yan, RSC Advances, 2014, 4,42418–42423.
9 http://www.sciencelab.com/msds.php?msdsId=9924585.10 A. P. Neal and T. R. Guilarte, Toxicol. Res., 2013, 2, 99–114.11 A. N. Jensen and L. T. Jensen, Manganese in health and dis-
ease, The Royal Society of Chemistry, 2015, pp. P001–632.12 T. V. P. A. B. B. Pan Chen, Sudipta Chakraborty and M. As-
chner, Toxicology research, 2015, 4, 191–202.13 M. JesÞs, S. Sergio, E. SantosâARMedrano Gustavo,
G. Roberto, R. Israel, R. Roberto and D. Fernando, Environ-mental Toxicology and Chemistry, 2005, 24, 2037–2044.
14 S. F. Ali, H. M. Duhart, G. D. Newport, G. W. Lipe andW. Slikker, Neurodegeneration, 1995, 4, 329 – 334.
15 H. A. Gulam Waris, Journal of carcinogenics, 2006, 5, 1–8.16 G. Gardner, D. N. Al-Sharab, Jafar, A. K. Go, Yong Bok,
M. Greenblatt and G. C. Dismukes, Energy & EnvironmentalScience, 2016, 9, 184–192.
17 J. Wang, L. Li, H. Tian, Y. Zhang, X. Che and G. Li, ACS AppliedMaterials & Interfaces, 2017, 9, 7100–7107.
18 A. Kozawa and R. A. Powers, Journal of Chemical Education,1972, 49, 587–591.
19 E. de la Llave, E. Talaie, E. Levi, P. K. Nayak, M. Dixit, P. T.Rao, P. Hartmann, F. Chesneau, D. T. Major, M. Greensteinet al., Chemistry of Materials, 2016, 28, 9064–9076.
20 M. Feng, Q. Du, L. Su, G. Zhang, G. Wang, Z. Ma, W. Gao,X. Qin and G. Shao, Scientific reports, 2017, 7, 2219.
21 M. V. Gallegos, L. R. Falco, M. A. Peluso, J. E. Sambeth and
Journal Name, [year], [vol.], 1–8 | 7
H. J. Thomas, Waste Management, 2013, 33, 1483 – 1490.22 R. N. Sahoo, P. K. Naik and S. C. Das, Hydrometallurgy, 2001,
62, 157–163.23 M. M. Najafpour, G. Renger, M. HoÅCyÅDska, A. N. Moghad-
dam, E.-M. Aro, R. Carpentier, H. Nishihara, J. J. Eaton-Rye,J.-R. Shen and S. I. Allakhverdiev, Chemical Reviews, 2016,116, 2886–2936.
24 B. Maryam and S. Keith, ChemCatChem, 2017, 9, 4049–4052.25 S. Hong, Y.-M. Lee, M. Sankaralingam, A. K. Vardhaman,
Y. J. Park, K.-B. Cho, T. Ogura, R. Sarangi, S. Fukuzumi andW. Nam, Journal of the American Chemical Society, 2016, 138,8523–8532.
26 A. Gunay and K. H. Theopold, Chemical reviews, 2010, 110,1060–1081.
27 B. S. Mandimutsira, B. Ramdhanie, R. C. Todd, H. Wang, A. A.Zareba, R. S. Czernuszewicz and D. P. Goldberg, Journal of theAmerican Chemical Society, 2002, 124, 15170–15171.
28 N. Danilovic, R. Subbaraman, K.-C. Chang, S. H. Chang, Y. J.Kang, J. Snyder, A. P. Paulikas, D. Strmcnik, Y.-T. Kim, D. My-ers et al., The journal of physical chemistry letters, 2014, 5,2474–2478.
29 B. Xu, Y. Bhawe and M. E. Davis, Proceedings of the NationalAcademy of Sciences, 2012, 109, 9260–9264.
30 M. Huynh, C. Shi, S. J. L. Billinge and D. G. Nocera, Journalof the American Chemical Society, 2015, 137, 14887–14904.
31 A. Ramírez, P. Hillebrand, D. Stellmach, M. M. May, P. Bog-danoff and S. Fiechter, The Journal of Physical Chemistry C,2014, 118, 14073–14081.
32 U. Mejia, Mario Y. AlvarezOscar, 1981 (1981-02-03)Us4248945a.
33 J. Zhao, J. Nan, Z. Zhao, N. Li, J. Liu and F. Cui, AppliedCatalysis B: Environmental, 2017, 202, 509–517.
34 A. Jabbar, G. Yasin, W. Q. Khan, M. Y. Anwar, R. M. Ko-rai, M. N. Nizam and G. Muhyodin, RSC Advances, 2017, 7,31100–31109.
35 H. Wang, C. Wei, K. Zhu, Y. Zhang, C. Gong, J. Guo, J. Zhang,L. Yu and J. Zhang, ACS applied materials & interfaces, 2017,9, 34456–34466.
36 Y. Sheng, X. Tang, E. Peng and J. Xue, Journal of MaterialsChemistry B, 2013, 1, 512–521.
37 A. C. Ferrari and J. Robertson, Physical review B, 2000, 61,14095–14107.
38 Y.-F. Lee, K.-H. Chang, C.-C. Hu and K.-M. Lin, Journal of Ma-terials Chemistry, 2010, 20, 5682–5688.
39 K. Terayama and M. Ikeda, Transactions of the Japan instituteof metals, 1983, 24, 754–758.
40 J.-S. Lee, S. Tai Kim, R. Cao, N.-S. Choi, M. Liu, K. T. Lee andJ. Cho, Advanced Energy Materials, 2011, 1, 34–50.
41 P. E. Karthik, C. Jeyabharathi and K. L. Phani, Chemical Com-munications, 2014, 50, 2787–2790.
42 N.-T. Suen, S.-F. Hung, Q. Quan, N. Zhang, Y.-J. Xu and H. M.Chen, Chemical Society Reviews, 2017, 46, 337–365.
43 S. Anantharaj, S. R. Ede, K. Karthick, S. S. Sankar,K. Sangeetha, P. E. Karthik and S. Kundu, Energy & Environ-mental Science, 2018, 11, 744–771.
44 Y. Chen, Q. Zhou, G. Zhao, Z. Yu, X. Wang, S. X. Dou andW. Sun, Advanced Functional Materials, 2018, 28, 1705583.
8 | 1–8Journal Name, [year], [vol.],

download fileview on ChemRxivManuscript.pdf (1.38 MiB)


![NL 5 Beatrix Clerckx [Read-Only] - fresubin.be · Cumulative proportion weaned alive from MV Cumulative proportion discharged alive from ICU Cumulative proportion discharged alive](https://static.fdocuments.in/doc/165x107/5d03708c88c9936e148b4f75/nl-5-beatrix-clerckx-read-only-cumulative-proportion-weaned-alive-from-mv.jpg)