Introductory Course Delft3D-QUICKIN Bathymetry schematisation.
Exploring DELFT3D as an operational tool
Coastal Risk exploratory
Project
George Breyiannis
Thomas I Petroliagkis
Alessandro Annunziato
2016
EUR 28336 EN
This publication is a Technical report by the Joint Research Centre (JRC) the European Commissionrsquos science
and knowledge service It aims to provide evidence-based scientific support to the European policymaking
process The scientific output expressed does not imply a policy position of the European Commission Neither
the European Commission nor any person acting on behalf of the Commission is responsible for the use that
might be made of this publication
Contact information
Name George Breyiannis
Address Via E Fermi 2749 21027 ISPRA (VA) Italy
Email georgebreyiannisjrceceuropaeu
Tel +39 0332 785238
JRC Science Hub
httpseceuropaeujrc
JRC104897
EUR 28336 EN
PDF ISBN 978-92-79-64589-1 ISSN 1831-9424 doi102788783821
Luxembourg Publications Office of the European Union 2016
copy European Union 2016
The reuse of the document is authorised provided the source is acknowledged and the original meaning or
message of the texts are not distorted The European Commission shall not be held liable for any consequences
stemming from the reuse
How to cite this report Breyiannis G Petroliagkis T I Annunziato A Exploring DELFT3D as an
operational tool EUR 28336 EN doi102788783821
All images copy European Union 2016
i
Contents
Abstract 2
1 Introduction 3
2 Implementation 4
21 Performance 5
3 Assessment 6
31 Storm Surge 6
32 Tides 7
33 Waves 9
4 Functionality 12
5 Outlook 13
References 14
Acknowledgements 15
List of abbreviations and definitions 16
List of figures 17
2
Abstract
One of the deliverables foreseen within the Coastal Risk exploratory research project was
a prototype of an operational system that can tackle the task of an early information and
awareness platform
The proposed prototype aimed to include an extensive range of physical processes
including tides waves and fluvial flows One of the very few suites of codes that can handle
the plethora of interactions considered and an open sourced one is Delft3D
(httpsossdeltaresnlwebdelft3d) Thus the focus has been to develop a functional
workflow based on this model and expand it to meet the requirements of the foreseen
system
The capabilities of DELFT3D have been validated and tested extensively (see corresponding
document at httpossdeltaresnlwebdelft3ddownload) However its basic usage is to
be used through a GUI based on MATLAB and on a case by case basis In order to make
the tools versatile enough to be used within a script-based operational system with on-
demand functionality a wrapper needed to be developed Thus a number of Python scripts
have been written that provide pre-processing setup of the simulations avoiding the
dependency on MATLAB These command line scripts could form the basis of the operating
system
The Mediterranean Sea was selected as a test case for validating and benchmarking the
various components as well as testing the integration to an operational prototype The
outcome of this research suggest that a prototype system is feasible but there are still
issues to be addressed An overview and the status of development is presented below
3
1 Introduction
Sea level rise due to extreme weather events are perilous to coastal communities Current
trends in climate change research suggest that these events will likely increase in the
future There is a need for models that can provide awareness and insight These systems
can be used as a test bed for risk mitigation studies and crisis management tools Tides
storm surge and waves contribute to coastal conditions Tides are the result of gravitational
forces while storm surge and wave height are produced by meteorological conditions
(wind pressure) Their combined effect determines the inundation risk for coastal areas
Currently there is a model that estimates the storm surge due to data received by weather
numerical simulations (Annunziato A amp Probst P 2016) In an effort to extent this
configuration to include the tidal and wave components a feasibility study was performed
within the Coastal Risk exploratory project to assess whether the DELFT3D suit of codes
can provide an acceptable solution The Delft3D suite has many modules that can be run
independently or in coupled mode The FLOW module can be used to evaluate the
hydrodynamic response of a mass of water to various forcing components such as tides
and winds It can run on a rectilinear or curvilinear boundary fitted grid in 2D or 3D mode
The 2D mode solves the depth-averaged hydrodynamic equations most applicable to storm
surge computations while the 3D mode is required in dealing with transport processes
The model solves the Navier Stokes equations for an incompressible fluid under the
shallow water and Boussinesq assumptions This is coupled with a hydrostatic equation for
pressure The grid is staggered with the velocity computed on the vertices and the height
of the water (pressure points) in the center of the grid cell The numerical method is based
on finite differences The time integration is fully implicit utilizing a variation of the ADI-
method providing 2nd order accuracy both in space and time The code is written in
Fortran90 and is using MPI (mpich) to run in parallel mode
The WAVE component uses a variation of the SWAN model (Simulating WAves Nearshore)
to simulate the evolution of random short-crested wind-generating waves It is a fully
implicit and fully spectral code that can handle all wave directions
More information is available within the extensive collection of manuals provided by
Deltares (httpossdeltaresnlwebdelft3dmanuals)
4
2 Implementation
Deltares software is usually managed through a GUI that facilitates the creation of the grid
and setting up the boundary conditions Visualization of the results is provided through
additional tools This platform is based on the proprietary MATLAB environment Some
aspects of the platform might also be Windows OS restricted
The above described setup poses a number of issues The aim of the project is to provide
an operational module that can handle daily or on demand a simulation of arbitrary
attributes such as location time frame resolution etc Our computational environment
consists of Linux Virtual Machines
The code itself is written in Fortran90 and utilizes MPI (mpich) for parallelization Therefore
the execution of the code is straightforward However the prepost processing needs to
be done in a way that provides transparency portability and flexibility More so it has to
be amenable to a high degree of automation
The open source version of DELFT3D has a number of community based tools and scripts
that are provided through the publicly available repository dubbed OpenEarthTools
(httpspublicwikideltaresnldisplayOETOpenEarth) Based on the python scripts
available there and developing additional scripts to mimic the GUI functionality the prepost
processing needs are addressed
The code has been compiled (version tag 5740) on 2 Linux flavoured operational systems
namely UBUNTU 1604 and CENTOS 7 The setup procedure including all required
dependencies has been documented and can be easily reproduced
A number of python scripts are available that comprise the workflow for setting up
executing and post-processing the simulations The workflow setup is presented below
Step 1 The required input variables are the time frame the Lat-Lon window and the grid
resolution Using these information a setup script provides wind velocity and pressure
based on ECMWF HR data to be used as quasi-stationary forcing terms (ie constant for
every hour which is the forecast interval) The corresponding bathymetry is also computed
through interpolation on GEBCO (httpwwwgebconet) data
Step 2 The evaluated data (Lat Lon u v p bathymetry) are written to the corresponding
files (meteo bathymetry grid) consistent with DELFT3D requirements In addition the
main preference file can be edited accordingly
Step 3 The code can now be launched
As this stage the code is run in parallel mode on multiple cores A more systematic
scalability study is presented below The output is in NetCDF format in order to facilitate
easy analysis However the restart files are written in Deltaresrsquos own binary format (Nefis)
The code output is controlled by corresponding flags in the main configuration file The
output includes a number of attributes for the whole computational grid and also a time
series of data for specific observation points that were pre-described Note that the pre-
processing tools include this capability
Time frame of the execution on 700x260 grid for 72 hours of forecasting is around 30
minutes on 4 cores
Visualization and analysis is done by python scripts but since the output format is in NetCDF
there is no imposed restriction In fact through a post-processing modification of the
output files the results can be imported into the in-house developed visualization tool
Tsunami Analysis Tool (TAT) as well
A master script that can set up a new run based on the ECMWF input (every 12 hours) and
the restart files of the run of the previous time stamp was developed
5
21 Performance
The ability of the model to meet the required operational constrains and the overall
efficiency is measured through scaling experiments within our computational resources
The model run in parallel mode utilizing MPI with fixed grid and an ever increasing number
of computational cores Also tested was the compiler depended performance and the added
benefit of running the simulation on RAMDISK thus avoiding IO delays It turned out that
the latter was not important for the case considered although this could change for other
cases We opted to use the RAMDISK approach and perform the scaling experiment for
both INTEL and GNU compilers The results are presented below
Figure 1 - Execution time vs number of core of DELFT3D-FLOW
It is seen that the performance of the INTEL based executable is better for modest
number of cores but deteriorates for large number However for the current setup (hardware software simulated case etc) there seem to be an optimum number
of cores (~32) for both versions Thus the configuration which includes the INTEL compiled version and 32 cores was adopted for the operational runs
6
3 Assessment
The different components of the proposed system are tested utilizing the DELFT3D suite
31 Storm Surge
A first comparison of the storm surge calculations can be made with the results of the
operational HyFlux code for the test case of the Mediterranean Sea
Figure 2 - Comparison between HyFlux and DELFT3D for storm surge forecasting
7
Such a comparison is presented in Figure 2 for the forecast of 28 Feb 2016 0000 Note
that the Delft3D-Flow has started on the 18th of Feb with a cold start (all hydrodynamic
variables set to zero) Differences can be attributed to a number of issues including grid
bathymetry and forcing A more detailed quantitative analysis is in progress
Comparison with measured data is presented below for a specific case of an extreme event
in Venice The first figure depicts the forecasting and the markers indicate the combined
line consisting of the 12-hour forecasting of each result based on analysis wind data The
range of the colored lines is indicative of the uncertainty of the extreme event The second
figure shows the comparison of the combined result with the measured storm surge Note
that the last part of the combined curve is the full forecast based on the analysis of
2822016
Figure 3 - Analysis and comparison with observations
It is seen that the specific event is well captured A more systematic analysis of a 3 year
hindcast is under way for verification purposes that could provide a more comprehensive
overview of the modelrsquos capabilities
32 Tides
The tidal component can be introduced in 2 ways Either by assigning an astronomical
boundary condition on the boundaries andor activating the tidal component within the
code In general terms when a relative small area is considered assigning a boundary
time series should produce the proper tidal response due to the relative small mass of
water considered For larger basins or areas with deep oceans one has to consider also
the direct contribution of the gravitational forces on the water motion Thus activation of
the tidal component might be required to achieve the desired behaviour A number of tests
were performed in accessing the applicability of the tidal component Preliminary tests
indicate that also the value of the bottom friction is important in optimizing the simulation
In the case below an astronomical boundary condition is imposed at Gibraltar This
condition is extracted from a tidal solution provided by Deltares for the Mediterranean Sea
8
The results produced after 20 days of simulation should approach the expected one from
the given solution matrix No other process is considered (no wind forcing etc)
Fig 4 shows that for the case of Ravenna (IT)
When only the boundary forcing at Gibraltar is imposed the tide does not
propagate correctly into the Adriatic sea and the curve (red in the plot) shows too
low amplitude
the inclusion of the tidal component in the calculation (gravity force applied to the
whole calculation domain black full curve) produces an amplitude that is closer to
the expected solution by Deltares (dotted curve) Thus the tidal component is
necessary in order to achieve the expected result
Fig 5 shows instead the case of Palermo (IT) where
the option of imposing only the boundary condition shows a better response in
respect to the case of Ravenna However there are oscillations developed at a later
stage which suggest instability in both cases (with or without tidal component in
the calculation domain) These can be ameliorated by modifying the bottom friction
coefficient which however creates lagging and potential amplitude reduction More
analysis is required for addressing this issue
a)
b)
Figure 4 ndash a) Comparison between expected tide and the computed value withwithout the tidal component for Ravenna IT b) Close up detail
9
a)
b)
Figure 5 ndash a) Comparison between expected tide and the computed value withwithout the tidal
component for Palermo IT b) Close up detail
33 Waves
Benchmarking of the waves module within DELFT3D (swan) is done by comparing with the
results of the global wave simulation provided by ECMWF The comparison is presented in
Fig 6 for up to 48 hours forecast The first line of graphs show the difference between the
2 models in term of wind forcing The qualitative comparison is promising The maximum
values are comparable The graphs in the second part of the figure provide a depiction of
the variation between the results of the two models
A systematic investigation in terms of grid dependency applicable parameter space and
coressponding comparison with observed data is needed for further validation
10
a)
b)
Figure 6 - a) Comparison of the wind forcing between local (right) and ECMWF (left)
implementation b) Wave height estimate of wind waves by DELFT3D-WAVE (right) and ECMWF (left)
In addition to utilizing the wave component of DELFT3D suite (SWAN) there is the option
of coupling the DELFT3D-FLOW results to the output of a standalone wave solver For
testing this option a virtual machine was setup running Wave Watch III a third generation
11
wave model from NOAANCEP based on previous iterations developed at Delft University
of Technology and NASA Goddard Space Flight Center
More info can be found at httppolarncepnoaagovwaveswavewatch The model is
currently being maintained by an extensive team of core developers spanning the world
The use of such an advance wave model is likely to be more important away from the shore
line and especially in the North Atlantic A more systematic analysis is required in order to
assess the capabilities and added benefits of this model
12
4 Functionality
The prototype workflow based on python scripts can be used for setting up and performing
simulations on demand The pre-processing script create the input files for the simulation
The required input are latlon window resolution forecast range etc The corresponding
command looks like this
gtpython setuppy -100 -50 5 35 med 2016092800 72 05 MED True
which refers to minlon maxlon minlat maxlat basename date (YYYYMMDDHH) number
of forecasts resolution (decimal degrees) path compute uvp(T|F)
A folder is created on the defined path (in the above case rsquoMEDrsquo with name that of the
time stamp specified (ie 2016092800) Within this folder the required files for simulating
the storm surge based on ECMWF data are stored This script runs only once in order to
setup the simulation and one can either create a composite script or execute the simulation
manually from the corresponding folder Note that a preference file is written on the top
folder (in this case rsquoMEDrsquo) with the input variables
After the first run has been concluded another script can handle the subsequent runs by
copying the restart files from the previous run as well as the unmodified input files while
modifing appropriately the preference file and creating the uvp files for the corresponding
new time stamp A complete date range simulation can be performed with a command line
like the one below
gtpython rerunpy 2016092812 2016101112 rsquoMEDrsquo
which corresponds to start_time end_time and path The script looks for the previous time
stamp folder in the defined path and carries on the simulation In the above example the
2016092800 folder should be present in the rsquoMEDrsquo location Within the folder the restart
files for every 12 hours are present after the initial first run The new computation starts
with the 2016092812 time stamp and continues all the way to include also the
2016101112 run The attributes of these runs are read from the preference file created
by the setup script Further improvements can provide more functionality The output is
given in netCDF format and a number of post analysis tools can be used to visualize and
manipulate them
13
5 Outlook
The different components of the DELFT3D suit have been used in order to gain insight into
coupled simulations in an automated fashion within a proposed large-scale coastal flood amp
inundation tool The dependency on MATLAB has been overcome and a script based
command line tool is available for launching the simulations Validation and verification
tests were performed that can serve as guideline for future development There are
however some open issues before the scope of the project can be achieved The more
challenging are
The setup of a nesting computation There are still issues with stability and
automation but the development is ongoing
Coupled run with the DELFT3D FLOW ndash WAVE modules Preliminary runs have been
performed but the numerical resources requirements andor applicability issues are
still under investigation
Handling of fluvial flows where present Issues like grid and boundary conditions
have not been addressed
Further statistical analysis and expansion to a pan European model will provide a test bed
for addressing the numerical problems described above drawing upon the experiences and
competences developed through the Coastal Risk project
14
References
Annunziato A and Probst P JRC storm surge system for Europe JRC SSCS
bulletins and the new GDACS system EUR 2016
15
Acknowledgements
The authors would like to thank all colleagues who supported the development of this
prototype system
Authors
George Breyiannis Thomas I Petroliagkis Alessandro Annunziato
16
List of abbreviations and definitions
ECMWF European Centre for Medium Weather Forecast
GDACS Global Disasters Alerts and Coordination System
JRC Joint Research Centre
netCDF Network Common Data Form
GEBCO General Bathymetric Chart of the Oceans
TAT Tsunami Analysis Tool
HR High Resolution
NOAA National Oceanic and Atmospheric Administration
NCEP National Centers for Environmental Prediction
MPI Message Passage Interface
SWAN Simulating WAves Nearshore
17
List of figures
Figure 1 - Execution time vs number of core of DELFT3D-FLOW 5
Figure 2 - Comparison between HyFlux and DELFT3D for storm surge forecasting 6
Figure 3 - Analysis and comparison with observations 7
Figure 4 ndash a) Comparison between expected tide and the computed value withwithout
the tidal component for Ravenna IT b) Close up detail 8
Figure 5 ndash a) Comparison between expected tide and the computed value withwithout
the tidal component for Palermo IT b) Close up detail 9
Figure 6 - a) Comparison of the wind forcing between local (right) and ECMWF (left)
implementation b) Wave height estimate of wind waves by DELFT3D-WAVE (right) and
ECMWF (left) 10
18
Europe Direct is a service to help you find answers
to your questions about the European Union
Freephone number ()
00 800 6 7 8 9 10 11 () The information given is free as are most calls (though some operators phone boxes or hotels may
charge you)
More information on the European Union is available on the internet (httpeuropaeu)
HOW TO OBTAIN EU PUBLICATIONS
Free publications
bull one copy
via EU Bookshop (httpbookshopeuropaeu)
bull more than one copy or postersmaps
from the European Unionrsquos representations (httpeceuropaeurepresent_enhtm)from the delegations in non-EU countries (httpeeaseuropaeudelegationsindex_enhtm)
by contacting the Europe Direct service (httpeuropaeueuropedirectindex_enhtm) orcalling 00 800 6 7 8 9 10 11 (freephone number from anywhere in the EU) ()
() The information given is free as are most calls (though some operators phone boxes or hotels may charge you)
Priced publications
bull via EU Bookshop (httpbookshopeuropaeu)
LB-N
A-2
8336-E
N-N
doi102788783821
ISBN 978-92-79-64589-1
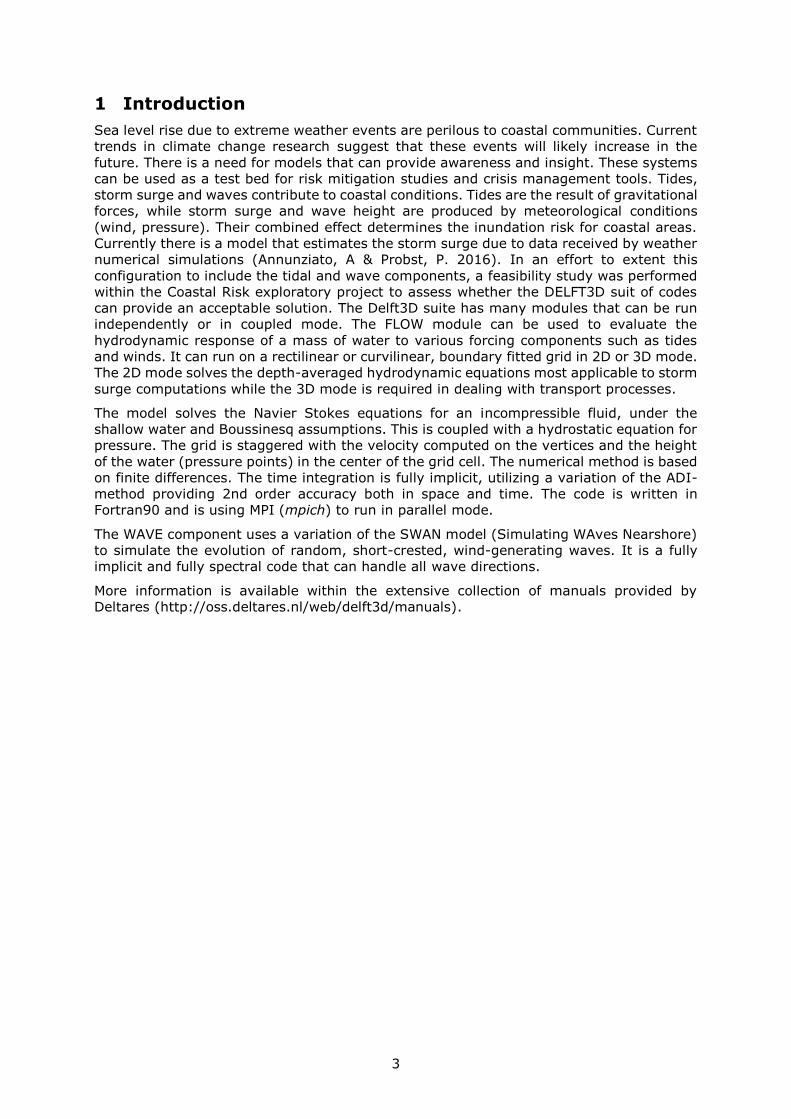
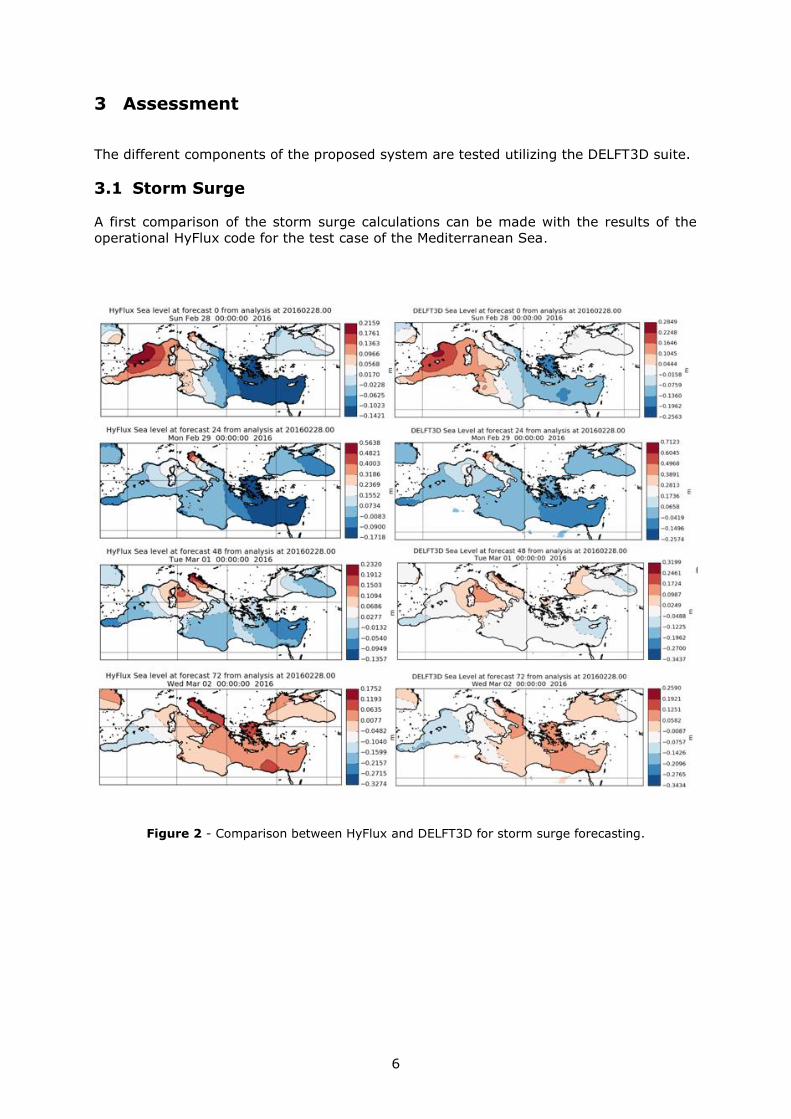
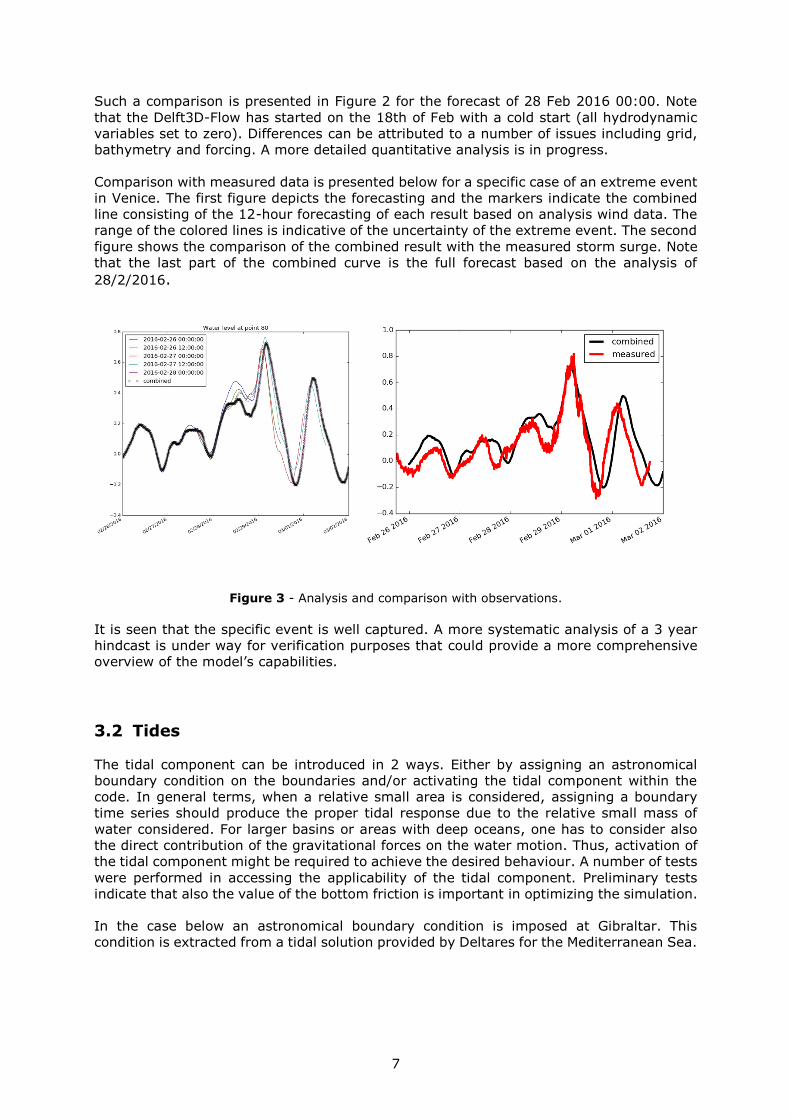

LB-N
A-2
8336-E
N-N
doi102788783821
ISBN 978-92-79-64589-1