Exploitation of the far-offshore wind energy resource by ...
14
Wind Energ. Sci., 6, 1191–1204, 2021 https://doi.org/10.5194/wes-6-1191-2021 © Author(s) 2021. This work is distributed under the Creative Commons Attribution 4.0 License. Exploitation of the far-offshore wind energy resource by fleets of energy ships – Part 2: Updated ship design and cost of energy estimate Aurélien Babarit 1,2 , Félix Gorintin 2,3 , Pierrick de Belizal 3 , Antoine Neau 3 , Giovanni Bordogna 4 , and Jean-Christophe Gilloteaux 1 1 LHEEA, École Centrale de Nantes – CNRS, Nantes, 44300, France 2 INNOSEA, Nantes, 44300, France 3 Farwind Energy, Nantes, 44300, France 4 Blue Wasp Marine, Rotterdam, 3035TA, the Netherlands Correspondence: Aurélien Babarit ([email protected]) Received: 9 May 2021 – Discussion started: 7 June 2021 Revised: 4 August 2021 – Accepted: 16 August 2021 – Published: 15 September 2021 Abstract. This paper deals with a new concept for the conversion of far-offshore wind energy into sustainable fuel. It relies on autonomous sailing energy ships and manned support tankers. Energy ships are wind-propelled ships that generate electricity using water turbines attached underneath their hull. Since energy ships are not grid-connected, they include onboard power-to-X plants for storage of the produced energy. In the present work, the energy vector X is methanol. In the first part of this study, an energy ship design was proposed, and its energy performance was assessed. In this second part, the aim is to update the energy and economic performance of such a system based on design progression. In collaboration with ocean engineering, marine renewable energy and wind-assisted propulsion experts, the energy ship design of the first part has been revised. Based on this new design, a complete FARWIND energy system is proposed, and its costs (CAPEX and OPEX) are estimated. Results of the models show (i) that this FARWIND system could produce approximately 70 000 t of methanol per annum (approximately 400 GWh per annum of chemical energy) at a cost in the range EUR 1.2 to 3.6/kg, (ii) that this cost may be comparable to that of methanol produced by offshore wind farms in the long term and (iii) that FARWIND-produced methanol (and methanol produced by offshore wind farms) could compete with gasoline on the EU transportation fuel market in the long term. 1 Introduction To date, fuels such as oil, natural gas and coal account for approximately 80 % of primary energy consumption globally (BP, 2018). Although this share is expected to decrease with the development of renewable power generation and the elec- trification of the global economy, some sectors may be diffi- cult to electrify (e.g., aviation, freight). Therefore, if a global temperature change of less than 2 ◦ C – as set out in the Paris agreement – is to be achieved, there is a critical need to de- velop carbon-neutral alternatives to fossil fuels. To address this challenge, we proposed in Babarit et al. (2019) an energy system (FARWIND) which could con- vert the far-offshore wind energy resource into a sustain- able fuel using fleets of energy ships; see Fig. 1. Energy ships are ships propelled by the wind which generate elec- tricity by means of water turbines attached underneath their hulls. The generated electricity is converted into fuel using onboard power-to-gas (PtG) or power-to-liquid (PtL) plants. Hydrogen was not retained because it was found in Babarit et al. (2018) that hydrogen storage and transportation costs could account for nearly half of the cost of the delivered hy- Published by Copernicus Publications on behalf of the European Academy of Wind Energy e.V.
Transcript of Exploitation of the far-offshore wind energy resource by ...

Wind Energ. Sci., 6, 1191–1204, 2021https://doi.org/10.5194/wes-6-1191-2021© Author(s) 2021. This work is distributed underthe Creative Commons Attribution 4.0 License.
Exploitation of the far-offshore wind energy resource byfleets of energy ships – Part 2: Updated ship design and
cost of energy estimate
Aurélien Babarit1,2, Félix Gorintin2,3, Pierrick de Belizal3, Antoine Neau3, Giovanni Bordogna4, andJean-Christophe Gilloteaux1
1LHEEA, École Centrale de Nantes – CNRS, Nantes, 44300, France2INNOSEA, Nantes, 44300, France
3Farwind Energy, Nantes, 44300, France4Blue Wasp Marine, Rotterdam, 3035TA, the Netherlands
Correspondence: Aurélien Babarit ([email protected])
Received: 9 May 2021 – Discussion started: 7 June 2021Revised: 4 August 2021 – Accepted: 16 August 2021 – Published: 15 September 2021
Abstract. This paper deals with a new concept for the conversion of far-offshore wind energy into sustainablefuel. It relies on autonomous sailing energy ships and manned support tankers. Energy ships are wind-propelledships that generate electricity using water turbines attached underneath their hull. Since energy ships are notgrid-connected, they include onboard power-to-X plants for storage of the produced energy. In the present work,the energy vector X is methanol.
In the first part of this study, an energy ship design was proposed, and its energy performance was assessed.In this second part, the aim is to update the energy and economic performance of such a system based on designprogression.
In collaboration with ocean engineering, marine renewable energy and wind-assisted propulsion experts, theenergy ship design of the first part has been revised. Based on this new design, a complete FARWIND energysystem is proposed, and its costs (CAPEX and OPEX) are estimated. Results of the models show (i) that thisFARWIND system could produce approximately 70 000 t of methanol per annum (approximately 400 GWh perannum of chemical energy) at a cost in the range EUR 1.2 to 3.6/kg, (ii) that this cost may be comparable to thatof methanol produced by offshore wind farms in the long term and (iii) that FARWIND-produced methanol (andmethanol produced by offshore wind farms) could compete with gasoline on the EU transportation fuel marketin the long term.
1 Introduction
To date, fuels such as oil, natural gas and coal account forapproximately 80 % of primary energy consumption globally(BP, 2018). Although this share is expected to decrease withthe development of renewable power generation and the elec-trification of the global economy, some sectors may be diffi-cult to electrify (e.g., aviation, freight). Therefore, if a globaltemperature change of less than 2 ◦C – as set out in the Parisagreement – is to be achieved, there is a critical need to de-velop carbon-neutral alternatives to fossil fuels.
To address this challenge, we proposed in Babarit etal. (2019) an energy system (FARWIND) which could con-vert the far-offshore wind energy resource into a sustain-able fuel using fleets of energy ships; see Fig. 1. Energyships are ships propelled by the wind which generate elec-tricity by means of water turbines attached underneath theirhulls. The generated electricity is converted into fuel usingonboard power-to-gas (PtG) or power-to-liquid (PtL) plants.Hydrogen was not retained because it was found in Babaritet al. (2018) that hydrogen storage and transportation costscould account for nearly half of the cost of the delivered hy-
Published by Copernicus Publications on behalf of the European Academy of Wind Energy e.V.

1192 A. Babarit et al.: Exploitation of the far-offshore wind energy resource by fleets of energy ships – Part 2
drogen when it is produced far offshore (because of the lowvolumetric energy density at ambient temperature and pres-sure conditions which is a well-known challenge for hydro-gen storage and transportation). In contrast, the other pos-sible energy vector options (synthetic natural gas (SNG),methanol, or Fischer–Tropsch fuel (FT fuel), Graves et al.,2011, and ammonia, Morgan, 2013) are much simpler tostore, transport and distribute (particularly methanol and FTfuel, as they are liquid under standard conditions of tem-perature and pressure). Moreover, they can be incorporatedinto existing infrastructure with little to no modification. Thedrawback is that they each require the supply of an additionalfeedstock (carbon dioxide or nitrogen depending on the en-ergy vector) and an additional conversion step in the energyconversion process. The additional conversion step decreasesthe overall energy efficiency and increases the size and com-plexity of the PtX plant. In a previous study (Babarit et al.,2019), we investigated whether these drawbacks could becompensated for by the easier storage, transportation and dis-tribution of the products, and we found that methanol is themost promising solution; hence it is retained as the energyvector in this study.
The produced methanol is collected by tankers which arealso used to supply the energy ships with the necessary feed-stock (carbon dioxide) for power-to-methanol conversion.Of course, the CO2 supply source must be carbon-neutralfor that system to produce sustainable methanol. There-fore, the CO2 must be captured either directly or indirectlyfrom the atmosphere. Possible options include direct air cap-ture (Keith et al., 2018), CO2 capture from flue gases frombiomass or FARWIND-produced methanol combustion, andCO2 from biogas upgrading (Li et al., 2017; Irlam, 2017).
The overall aim of the present study is to investigate theenergy and economic performance of the FARWIND energysystem. A preliminary energy ship design was proposed inBabarit et al. (2020a), and its energy performance was in-vestigated. The cost of energy was estimated in Babarit etal. (2020b). It was found that an initial FARWIND systemcould produce approximately 100 000 t of methanol per an-num at a cost in the range of EUR 0.9 to 2.1/kg.
This preliminary design has been reviewed by ocean engi-neering and marine renewable energy’s experts of the MarineEnergy Alliance European project (EMEC, 2020) and wind-assisted propulsion experts (Blue WASP, 2020). Based ontheir feedback, the ship design has progressed, and the eco-nomic model has been refined. The aim of the present paperis to present that improved design, the economic model andthe resulting levelized cost of energy. The present study alsoprovides an example of how cost estimates develop through-out subsequent design stages.
The remainder of this paper is organized as follows. InSect. 2, the specifications of the updated design and its ve-locity and power performance are presented. In Sect. 3, thespecifications of the proposed energy system are presented,and its annual methanol production is estimated. Estimates
of expenditures for the proposed energy system are providedand discussed in Sect. 4. Using those estimates and the es-timates of annual methanol production, the cost of energy isestimated in Sect. 5 and market perspectives are discussed.Conclusions are presented in Sect. 6.
2 Specifications of the updated energy ship design
The energy ship design considered in this study is a revisionof that presented in Babarit et al. (2020a); see Fig. 2. It isstill an 80 m long catamaran with four 5 m diameter Flettnerrotors and two water turbines. The hull shape is the same.However, the height of the Flettner rotors is increased from30 to 35 m, and the rated power of each water turbine is re-duced from 900 to 800 kW. The complete characteristics ofthe ship are summarized in Table 1. Explanations for the datashown in the table are provided in the following sections.
2.1 Rotors
The rotors’ technical specifications (dimensions, mass, max-imum rotor drive power) used in this study are based on thatof the largest currently available Flettner rotor (Norsepower,2021).
The propulsive force (thrust) T of a Flettner rotor dependson the lift coefficient CL, the drag coefficient CD, the appar-ent wind speed V , the apparent wind angle α, the rotor areaA (height times diameter) and the air density ρa :
T =12ρaAV
2 (CL sinα−CD cosα) . (1)
The lift coefficient and the drag coefficient depend on the ra-tio of the rotational velocity of the rotor to the apparent windspeed (spin ratio, SR). In Babarit et al. (2020a), we used theexperimental data of Charrier (1979) for the aerodynamic co-efficients of a Flettner’s rotor as a function of the rotor’s spinratio SR. However, these experiments were carried out at lowReynolds numbers (∼ 10000), with the Reynolds number de-fined as
Re=VD
ν, (2)
where ν is the kinematic viscosity and D is the rotor diam-eter. Recently, formulas based on full-scale data (Reynoldsnumber over 106) have been published (Tillig and Ringsberg,2020). Those data have been used in the present study (Fig. 3)as they correspond better to real conditions.
Moreover, rotors must be powered for them to spin. InBabarit et al. (2020a), we assumed that the rotors’ powerconsumption is constant (4 times 40 kW), whereas in prac-tice it depends on the wind loading. In their work, Tillig andRingsberg (2020) have developed a formula to estimate a ro-tor’s power consumption as a function of the spin ratio. Weused that formula in the present study.
Wind Energ. Sci., 6, 1191–1204, 2021 https://doi.org/10.5194/wes-6-1191-2021

A. Babarit et al.: Exploitation of the far-offshore wind energy resource by fleets of energy ships – Part 2 1193
Figure 1. The concept of sustainable methanol production from far-offshore wind energy by FARWIND energy systems.
Figure 2. Artist’s view of the proposed energy ship design.
In Babarit et al. (2020a), the effect of aerodynamic inter-actions between rotors was neglected. In the present study, ithas been estimated using the approach proposed by Roncinand Kobus (2004) in which each rotor is modeled by a horse-shoe vortex. The implementation follows that of Bordogna(2020).
The total propulsive force (with and without aerodynamicinteractions) and the propulsive force from each rotor areshown in Fig. 4 for rated conditions (10 m/s true wind speed,90◦ true wind direction, SR= 3, 10 m/s ship velocity). Theyshow that the interaction effect cannot be neglected as thetotal propulsive force is 69 % of that without interactions.A similar interaction effect has been found for other wind
speeds (not reported here). Consequently, the model has beenupdated. The total propulsive force (Eq. 1) has been reducedby a constant factor of 30 % for all wind conditions.
The Earth atmospheric boundary layer was also not con-sidered in the energy performance estimate in Babarit etal. (2020a). In the present study, a power law has been as-sumed with an exponent of 0.14. Thus, in the updated model,the wind speedW in Eq. (3) of Babarit et al. (2020a) is givenby
W =W10
(Z
10
)0.14
, (3)
where Z is 22.5 m (half the height of the rotor +5 m).
2.2 Hull
The hull shape is the same as for the preliminary design.However, the hull mass estimate has been refined. The re-vised mass estimate is based on a preliminary scantling of thehull structure which has been developed using rule NR600of Bureau Veritas (2018). The corresponding hull weight es-timate is 560 t, which is more than twice the estimate of thepreliminary design. Moreover, the updated design assumestaller rotors (35 m), which are 20 t heavier than the 30 m ro-tors of the preliminary design. Consequently, the total dis-placement of the updated design is 1035 t (660 t for the pre-liminary design). The draft has increased from 1.6 m for theinitial design to 2.1 m for the updated design.
Due to the increased displacement, the wetted surface in-creases to 1064 m2. The wave resistance coefficient has alsobeen updated (see Fig. 5). As for the preliminary design, itwas calculated using the software REVA (Delhommeau and
https://doi.org/10.5194/wes-6-1191-2021 Wind Energ. Sci., 6, 1191–1204, 2021

1194 A. Babarit et al.: Exploitation of the far-offshore wind energy resource by fleets of energy ships – Part 2
Figure 3. Comparison of aerodynamic coefficients of Flettner rotors according to Charrier (1979) and Tillig and Ringsberg (2020).
Figure 4. Effect of aerodynamic interactions on the propulsive force.
Maisonneuve, 1987). One can see that the residuary resis-tance coefficient (wave making) is greater for the updated de-sign than for the initial design, which is due to the increaseddisplacement.
2.3 Water turbine
The water turbines’ dimensions are the same as for the ini-tial design (4 m diameter rotor). However, their mass is in-creased to 15 t each (7.4 t each for the initial design). Basedon expert advice, the water turbine’s energy efficiency hasbeen reduced to 75 % (80 % for the initial design). The ratedpower is decreased to 800 kW (900 kW for the initial design).
2.4 Power-to-methanol plant
For rated wind conditions (10 m/s true wind speed, 90◦ truewind angle), the ship velocity is almost 10 m/s (see Sect. 2.7).The water turbines’ power production is 1600 kW. The Flet-tner rotors’ power consumption is approximately 420 kW.Assuming a further 50 kW power consumption for the aux-iliary subsystems, the net power production available tothe electrolyzer of the power-to-methanol plant is 1130 kW(1420 kW for the initial design). The weight estimate of an
electrolyzer of such rated power is 28 t (35 t for the initialdesign).
Assuming the same 60 % efficiency for the electrolyzerand the same 78 % efficiency for the hydrogen-to-methanolplant as for the initial design (Babarit et al., 2020a), the ratedpower of the hydrogen-to-methanol plant is 680 kW (850 kWfor the initial design). Its weight estimate is 17 t (24 t for theinitial design).
2.5 Storage tanks
The capacities of the storage tanks (CO2 and methanol) areset such as they can accommodate 7 d of production at ratedpower (approx. 17 t of methanol). Thus, the CO2 tank weightis 15 t, and that of the methanol tank is 4 t (Babarit et al.,2020a).
2.6 Auxiliary equipment
As for the initial design (Babarit et al., 2020a), the weight ofthe auxiliary subsystems is taken equal to 10 % of the totalmass budget excluding the hull weight (41 t).
Wind Energ. Sci., 6, 1191–1204, 2021 https://doi.org/10.5194/wes-6-1191-2021

A. Babarit et al.: Exploitation of the far-offshore wind energy resource by fleets of energy ships – Part 2 1195
Figure 5. (a) Wave pattern around the ship hull of the updated design for a Froude number= 0.357 (10 m/s ship velocity). (b) Hydrodynamiccoefficients of the initial and updated design.
2.7 Power production charts
The velocity and power performance of the updated designhas been calculated using the model presented in Babarit etal. (2020a). The results are shown in Fig. 6 as a function ofthe wind conditions (true wind speed and true wind angle).Note that for each data point the water turbine’s inductionfactor and the rotors’ spin ratio were optimized in order tomaximize power production while satisfying the constraints(maximum rotation velocity and thrust force for the rotors,maximum power generation for the water turbine).
Overall, the velocity and power performance of the up-dated design resemble those of the initial design (albeit10 % to 20 % smaller). As for the initial design, rated power(1600 kW) is achieved from a true wind speed of 10 m/s anda true wind angle of 90◦. However, a major difference is thatthe rotors’ power consumption depends on the spin ratio inthe updated design velocity and power performance predic-tion model, whereas it was fixed in Babarit et al. (2020a).Therefore, the net power keeps increasing with increasingwind speed (see panel d) despite the generated power hav-ing reached rated power (1600 kW).
As for the initial design, the water turbine’s induction fac-tor and the rotors’ spin ratio were optimized to maximizepower production for each data point while satisfying con-straints (maximum rotation velocity and thrust force for therotors, maximum power generation for the water turbine).Due to those constraints, there can be several settings (induc-tion factor, spin ratio) for the same power generation, whichexplain the noisy behavior for the ship velocity in panel (a).
3 Specifications of the proposed FARWIND energysystem
In the FARWIND energy system concept, the energy shipsare deployed in fleets and are supported by tankers whichcollect the produced methanol and transport it to a shore-based terminal; see Fig. 1. The tankers also provide the en-ergy ships with CO2. In this section, we estimate the char-acteristics and number of tankers as well as the number ofenergy ships in a FARWIND system.
3.1 Tanker design
In the considered energy ship design, the methanol storagetank capacity allows storage of 1 week of methanol produc-tion at full capacity. Therefore, each energy ship of the fleetmust meet a tanker for methanol collection and CO2 refill atleast once a week (to avoid stops in the production processbecause the methanol tank is full or because the CO2 tank isempty).
Thus, let us estimate the number of energy ships thatcan be served by one tanker. This depends on the dura-tion of the CO2-loading and methanol-unloading operations.We assume that these operations take 6 h on average andthat they are carried out continuously (including at night).Therefore, one tanker can service 28 energy ships per week(7 d/week× 24 h/d/6 h/operation). As the capacity of an en-ergy ship’s methanol tank is 17 t (23 t for the CO2 tank), thetanker may collect up to 473 t of methanol and supply 650 tof CO2 every week.
It is assumed that the tankers are operated by a crewand that the duration of their mission is 4 weeks. At theend of each 4-week mission, the tanker returns to a shore-based terminal to change crew, unload the methanol, and load
https://doi.org/10.5194/wes-6-1191-2021 Wind Energ. Sci., 6, 1191–1204, 2021

1196 A. Babarit et al.: Exploitation of the far-offshore wind energy resource by fleets of energy ships – Part 2
Figure 6. Ship velocity (a), power generation (b), rotors’ power consumption (c) and net power (d) of the updated ship design as functionof wind conditions. TWA stands for true wind angle.
CO2. Therefore, their total methanol capacity must be 1891 t(4 weeks× 473 t/week) and their total CO2 capacity mustbe 2601 t (4 weeks× 650 t/week). Assuming the CO2 will bestored as liquid in a cryogenic storage tank, and extrapolat-ing from Chart (2019), the empty weight of a 2600 t capacityCO2 storage vessel is estimated to be 1700 t. For methanol,the mass of the required tank is estimated to be 410 t. Thetanker will be carrying maximum cargo weight (4720 t) when
it leaves the terminal (full CO2 tank and empty methanoltank). This cargo weight is relatively similar to the aver-age vessel size of small crude oil (3600 deadweight (dwt)),chemical (4900 dwt) and LPG vessels (3500 dwt) (Lindstadet al., 2012). According to MAN Energy Solutions (2019),the propulsion power of a 5000 t deadweight bulk carrier is1410 kW for a service speed of 12 knots. These are the values
Wind Energ. Sci., 6, 1191–1204, 2021 https://doi.org/10.5194/wes-6-1191-2021

A. Babarit et al.: Exploitation of the far-offshore wind energy resource by fleets of energy ships – Part 2 1197
Table 1. Specifications of the updated energy ship design.
Unit Value
Hull
Length m 80Breadth m 31.7Draft m 2.1Displacement t 1035Structural mass t 560
Wind propulsion
Type – Flettner rotorsNumber – 4Rotor height m 35Rotor diameter m 5Rotor mass t 79Rotor drive power (max) kW 143
Water turbine
Number – 2Turbine diameter m 4Rotor-to-electricity efficiency (η3) – 75 %Turbine mass t 15Rated power kW 800
Auxiliaries subsystems
Power consumption kW 50Auxiliaries subsystem mass t 41
Power-to-methanol plant
Electrolyzer rated power kW 1130Electrolyzer mass t 28Desalination unit rated power kW NegligibleDesalination unit mass t NegligibleH2tMeOH plant capacity kg/h 100H2tMeOH plant mass t 17
Storage tanks
CO2 storage capacity t 23CO2 storage tank mass (empty) t 15Methanol storage capacity t 17Storage tank mass t 4
which we used for the service speed and propulsion power ofthe tanker.
3.2 FARWIND system design
Following Babarit et al. (2018), it is assumed that the fleet ofenergy ships is deployed at a distance of 1000 km from theterminal. Therefore, the tankers must travel 1000 km to meetthe energy ships and a further 1000 km when returning to theterminal. At a service speed of 12 knots, the tanker’s round-trip will take 90 h. Considering the duration of unloading–loading operations and other maintenance operations, we es-
timate that the tanker will be away from the fleet of energyships for a duration of 1 week.
To ensure continuous operation of the energy ships, thetanker must be replaced immediately when it leaves the pro-duction zone. Therefore, each group of 28 energy ships mustbe supported by more than one tanker. It can be shown thatthe minimum number of tankers per fleet must be at least1.25, meaning that the optimal FARWIND system comprisesa fleet of 112 energy ships supported by five tankers. Overa year, the number of round-trips between the terminal andthe production zone is 10.4 for each tanker. The maximummethanol production of that system (assuming 100 % capac-ity factor for the energy ships) is approximately 100 000 t perannum.
3.3 Annual methanol production of the proposedFARWIND system design
Since energy ships are mobile, their route schedules can bedynamically optimized based on weather forecasts in orderto maximize energy production. This was performed usinga modified version of the weather-routing software QTVLM(Abd-Jamil et al., 2019). The coordinates of the starting andarrival point are 50.5◦ N, 18.9◦W (approximately 1000 kmfrom the port of Brest, France). Over the 3 years 2015, 2016and 2017, it was found that an average capacity factor of over75 % can be achieved.
That estimate does not consider downtime due to main-tenance (availability). According to Sheng (2013) and Pfaf-fel et al. (2017), the failure rate of wind turbines is on theorder of one failure per annum. Given the greater complex-ity of the energy ship system (additional energy conversionsubsystems in comparison to a wind turbine, e.g., power-to-methanol plant), it is assumed that the average failure rateof energy ships is two failures per annum. The correspond-ing downtime is driven by accessibility and repair time. Asaccessibility at sea can be challenging and as energy shipsare mobile, it is assumed that most of the repairs are per-formed at a port. Moreover, it is assumed that despite thefailure, the energy ship is able to sail to that port at an av-erage velocity of 10 knots (corresponding to half the ratedvelocity) without assistance (e.g., tug boat). Assuming thatthe distance between the production area and a port (with adedicated shipyard) is 1000 km, it would take approximately2 d for that energy ship to go to the port. Assuming a further3 d for the repair and 2 d for the energy ship to go back to theproduction area, the downtime per failure is 7 d. Thus, for afailure rate of two failures per annum, the total downtime perannum is 2 weeks corresponding to a 96 % availability.
Taking into account that availability estimate, it appearsthat a capacity factor of 72 % can be achieved. The corre-sponding annual methanol production would be 70 600 t perannum. Note that it would require the supply of 97 400 t ofCO2, as the production of 1 kg of methanol requires 1.38 kgof CO2.
https://doi.org/10.5194/wes-6-1191-2021 Wind Energ. Sci., 6, 1191–1204, 2021

1198 A. Babarit et al.: Exploitation of the far-offshore wind energy resource by fleets of energy ships – Part 2
Table 2. Estimates of the capital cost of a prototype of the proposedenergy ship.
Cost (EUR)
Energy ship
Hull 1.1–2.2 millionFlettner rotors 4.2–4.9 millionWater turbines 1.3–2.7 millionAuxiliaries, assembly and system inte-gration
1.3–2 million
Electrolyzer 1.1–2.2 millionH2-to-methanol plant 400 000–700 000Fresh water production unit NegligibleLiquid CO2 tank NegligibleMethanol tank NegligiblePower-to-methanol plant indirect cost(installation, assembly, etc.)
300 000–2.9 million
Total 9.3–16.7 million
For the sake of illustration, let us estimate the number of5000 t bulk carriers which could be powered by a FARWINDsystem. As mentioned in Sect. 3.1, their propulsion power is1410 kW for a service speed of 12 knots. Assuming that theywould sail at that speed 292 d per year (80 % of the time)and that their engine efficiency is 40 %, the required chem-ical energy is approximately 24 700 MWh per year. With atotal of 70 600 t of methanol corresponding to approximately386 000 MWh of chemical energy, the designed FARWINDenergy system could power approximately sixteen 5000 tcargo vessels.
4 Estimation of expenditures
4.1 Capital cost of a first-of-a-kind energy ship
Table 2 shows estimates of the capital cost of a prototype ofthe proposed energy ship.
The hull cost estimate was obtained using the usual ap-proach which is to multiply the hull weight by a price permetric ton of fabricated steel. That price includes procure-ment and workforce required for hull construction. Thus, itdepends on steel market price and shipyard location. The typ-ical cost range is EUR 2000/t (South-East Asia construction)to EUR 4000/t (northern Europe). The hull weight estimatebeing 560 t, we retain a hull cost in the range of EUR 1.1 mil-lion to 2.2 million.
According to Jukka Kuuskoski (personal communication,2019), the cost of four 30 m Flettner rotors is in the range ofEUR 3 million to 3.5 million. For four 45 m tall Flettner ro-tors, we assumed that the cost is approximately proportionalto the rotor mass excluding foundation. That mass being 42 tfor a 30 m tall rotor and 59 t for a 35 m tall rotor (Norse-
power, 2021), we retain a Flettner rotor cost in the range ofEUR 4.2 million to 4.9 million.
The water turbine cost estimate assumes that it is propor-tional to its rated power. We assume that the price is in therange of EUR 800 to 1700/kW, which yields a water turbinecost in the range EUR 1.28 million to 1.72 million.
Ship common systems, ship assembly and system integra-tion typically represent 20 % of the total cost of a ship ac-cording to Shetelig (2013). We applied this ratio to the sumof the hull cost, Flettner rotor cost and water turbine cost.The other equipment was not taken into account because itsinstallation factor is taken into account separately.
Holl et al. (2016) have developed scaling laws for thecost of the electrolyzer and the freshwater production unitbased on market surveys. They depend on the nominal powerof the equipment. Applying the electrolyzer scaling lawto the 1130 kW capacity electrolyzer of the energy shipresults in an estimated cost of EUR 1.4 million, equiva-lent to EUR 1250/kW. This is in agreement with the rangeEUR 1000 to 1950/kW reported in Schmidt et al. (2017) forpolymer electrolyte membrane (PEM) electrolyzers (whichwe used in this study). As for the freshwater production, theapplication of the scaling law of Holl et al. (2016) yielded acost estimate of EUR 9000, which is very small in compari-son to the other costs.
According to Brynolf et al. (2018), the cost of a hydrogen-to-methanol plant is in the range EUR 600–1200/kW ofmethanol. As the estimated efficiency of the power-to-methanol conversion process is 49 % (Babarit et al., 2020a),it corresponds to EUR 300 to 600/kW of electrolyzer in-put power. Thus, we retain EUR 400 000–700 000 for thehydrogen-to-methanol plant capital cost.
For the liquid CO2 and methanol storage tanks, suppliersand prices can be found on the internet (e.g., Gitank, 2021;Chart, 2019); typical costs are EUR 300/t of capacity formethanol and EUR 1000/t of capacity for liquid CO2. Over-all, their costs are negligible in comparison to other costs.
The electrolyzer and hydrogen-to-methanol costs do notinclude installation and assembly, transportation, building,etc. Those costs are usually taken into account using an in-stallation factor. According to Parks et al. (2014), the lowerend of the installation factor is 1.2 and up to 2 for the higherend. This leads to a cost of EUR 300 000–2.9 million.
4.2 Capital cost of a first-of-a-kind FARWIND energysystem
According to the discussion in Sect. 3.2, a FARWIND en-ergy system should include a fleet of 112 energy ships andfive tankers. One can expect the unit cost for a fleet of 112energy ships to be significantly smaller than the cost of anenergy ship prototype. To take this into account, a learningrate of 10 % was assumed on the unit cost of the energy shipas function of the built capacity; see Table 2. It can be notedthat such a learning rate corresponds to what was observed
Wind Energ. Sci., 6, 1191–1204, 2021 https://doi.org/10.5194/wes-6-1191-2021

A. Babarit et al.: Exploitation of the far-offshore wind energy resource by fleets of energy ships – Part 2 1199
Table 3. Estimates of the operation and maintenance of a first-of-a-kind FARWIND energy system.
O&M cost (in % of capitalcost of equipment per year)
Energy ship
Hull 2 %Flettner rotors 3.5 %Water turbine 4 %–13 %Auxiliaries 2 %Electrolyzer 7.5 %–11.5 %H2-to-methanol plant 9 %–13 %Fresh water production unit 10 %–20 %Liquid CO2 tank 2 %Methanol tank 2 %
Total 4.8 %–8.5 %Tanker 4 %–10 %
FARWIND system
Energy ship maintenance EUR 24–58 million/yearTankers O&M EUR 3–10 million/yearCO2 supply EUR 2–19 million/yearInsurance cost EUR 4–15 million/year
Total (including CO2 supplyand insurance cost)
4.5 %–8.3 %
for wind turbines (Lindman and Soderholm, 2012). It leadsto a range of capital cost of EUR 620 million to 1.11 billionfor the first fleet of energy ships. It corresponds to an averageunit cost of EUR 5.5 million to 9.9 million per energy ship.
For the tanker, according to Lindstad et al. (2012), theprice of commercial ships is in the range of EUR 500 to 4750per metric ton of deadweight, depending on the type of shipand size. The lower price is for crude oil tankers greater than140 000 dwt, while the higher price is for roll-in/roll-off (ro-ro) ships of 7000 dwt. In the present study, we retain a costrange of EUR 2500 to 4000/t of deadweight, leading to atanker cost in the range of EUR 12.5 million to 20 million.
Thus, overall, the total capital cost of a FARWIND sys-tem comprised of 112 energy ships and five tankers is ex-pected to be in the range of EUR 680 million to 1.21 billion(EUR 3.7 million to 6.7 million per megawatt of installed ca-pacity).
4.3 Operational expenditures
Expected operation and maintenance (O&M) costs, includ-ing the cost of CO2 supply, are summarized in Table 3 anddetailed below.
4.3.1 Energy ship and tanker operation andmaintenance cost
According to Holl et al. (2016), the maintenance cost of thewater turbine is in the range 4 % to 13 % of the capital cost,and that of the freshwater production unit is between 10 and20 %. According to Chardonnet et al. (2017), the mainte-nance cost for the electrolyzer is on the order of 4 % of cap-ital cost. It is 2 %–5 % according to Brynolf et al. (2018). Itis unclear whether that maintenance considers stack replace-ment. Indeed, PEM electrolyzers’ stack lifetime is on the or-der of 50 000 h. Thus, assuming a capacity factor of 72 %,they would have to be replaced every 8 years. According toBrynholf et al. (2018), stack replacement cost is 60 % of theelectrolyzer cost. It leads to an additional 7.5 % maintenancecost for the electrolyzer. Thus, we retain 7.5 %–11.5 % forthe maintenance cost of the electrolyzer. The same range isassumed for the hydrogen-to-methanol plant.
For the Flettner rotors, the maintenance cost is expected tobe on the order of 3.5 % of the rotors’ capital cost (Jukka Ku-uskoski, personal communication, 2020). For the other sub-systems (hull, auxiliaries, storage tanks), it is expected thatthe maintenance costs would be small; a 2 % maintenancecost was arbitrarily selected. Overall maintenance costs forthe energy ship are thus on the order of 3.7 % to 5.3 %.
For the tanker, following Holl et al. (2016), we estimateoperation and maintenance costs to be 4 % to 10 %.
4.3.2 CO2 supply cost
The ambition of the FARWIND energy system is to pro-vide a sustainable alternative to the use of liquid fossil fuels(e.g., oil). Therefore, as mentioned in the introduction, theCO2 must be captured directly or indirectly from the atmo-sphere.
According to Keith et al. (2018), the cost for direct aircapture (DAC) using large-scale wet absorption DAC tech-nology is in the range of EUR 80 to 204/t of CO2. The costof CO2 capture from biogas upgrading is on the order ofEUR 15 to 100/t of CO2 (Li et al., 2017). In the case ofCO2 capture from flue gases from combustion of biomassor FARWIND-produced methanol, the cost of carbon cap-ture is on the order of EUR 35 to 50/t (assuming that it wouldbe similar to that for capture of CO2 from power productionprocesses involving coal or natural gas; Irlam, 2017). Notethat for both biogas upgrading and biomass or methanol com-bustion, the CO2 concentration in the source is much greaterthan in ambient air, which results in a more effective capturethan with DAC.
Carbon dioxide may also be extracted from seawater(Willauer et al., 2012). Indeed, some of the CO2 present inthe atmosphere dissolves in the ocean. However, this newtechnology is in its early stages of development (Willaueret al., 2017).
https://doi.org/10.5194/wes-6-1191-2021 Wind Energ. Sci., 6, 1191–1204, 2021

1200 A. Babarit et al.: Exploitation of the far-offshore wind energy resource by fleets of energy ships – Part 2
In any case, the captured CO2 must be liquefied for effi-cient transportation. The energy requirement for CO2 lique-faction is on the order of 0.1 kWh/kgCO2 according to Oi etal. (2016), which is low; hence its associated cost is expectedto be negligible.
Therefore, we estimate the cost of CO2 production to be inthe range of EUR 20 to 200/t. As 97 400 t of CO2 is requiredto produce 70 600 t of methanol, the CO2 supply cost is esti-mated to be in the range of EUR 2–20 million per annum.
4.3.3 Insurance cost
Insurance cost is generally taken as 0.6 % of CAPEX per yearfor vessels at the concept stage. However, for a new technol-ogy, this percentage of CAPEX may be higher, potentiallyas high as 1 %–2 %. In this study, we have retained 0.6 %–1.2 %.
5 Cost of energy estimates
5.1 Short-term cost
The levelized cost of methanol (LCOM) can be calculated as(Holl et al., 2016)
LCOM=CRF+ λ
AMPI, (4)
where I is the total capital cost, λ is the total O&M rate, AMPis the annual methanol production and CRF= i(1+i)n
((1+i)n−1) isthe capital recovery factor, in which i is the weighted aver-age cost of capital (WACC) and n is the lifetime in years.Assuming a WACC in the range of 6 %–10 % and a lifetimeof 20–25 years, the capital recovery factor is in the rangeof 7.8 %–11.7 %. The methanol cost is thus in the range ofEUR 1.2–3.6/kg (EUR 225 to 660/MWhth). Note that the lowend of the range (high end) was obtained by using the mostoptimistic cost data (most pessimistic cost data).
This cost is 3 to 9 times greater than the current mar-ket price for methanol (EUR 0.4/kg≈EUR 72/MWh in thefirst quarter of 2021). However, it does not consider a priceon greenhouse gas (GHG) emissions. At least 0.675 kg ofCO2 is produced per kilogram of methanol produced usingconventional processes (which are based on coal or naturalgas) (Martin and Grossmann, 2017). In 2018, the carbon taxwas EUR 44.6/t in France and EUR 110/t in Sweden; if CO2emissions were taken into account, the methanol price wouldincrease by EUR 6/MWhth and EUR 13/MWhth respectively.Thus, unfortunately, even with a rather significant carbon tax,the cost of methanol produced with a first-of-a-kind FAR-WIND system would not be competitive.
Figure 7 shows the cost breakdown for an average cost sce-nario. One can see that the main cost sources are the financ-ing cost (33 % of total methanol cost), the energy ship’s cap-ital cost (hull+Flettner rotors+water turbines+ auxiliariesand integration, 17 % of total methanol cost), and operation
Figure 7. Cost breakdown of methanol produced by a first-of-a-kind FARWIND system. The shown data correspond to an averagecost scenario (methanol cost equal to EUR 2.4/kg).
and maintenance cost of the FARWINDERs (16 %). The to-tal cost of energy storage – including the power-to-methanolplants’ capital cost and maintenance cost, CO2 supply, andtanker capital cost and operation and maintenance cost – ac-counts for 25 % of total cost.
5.2 Comparison with methanol production by offshorewind turbines
Let us compare the cost of methanol production by FAR-WIND systems and offshore wind turbines. In this respect,we assume that the first-of-a-kind FARWIND system is de-ployed by 2030. At that time, according to IRENA (2019),the global offshore wind energy capacity will have reached230 GW.
The key economic drivers in power-to-gas or power-to-liquid processes are the cost of input electricity to the power-to-gas/liquid plant and the power-to-gas/liquid plant capac-ity factor (Fasihi et al., 2016; Ioannou and Brennan, 2019).Based on those data, one can calculate the methanol produc-tion cost using
LCOM=
(CRF+ λ′
)I ′
8760×CF×Prated× ηMeOH
+LCOEelec
ηMeOH+ 1.38×
CCO2
LHVMeOH, (5)
where I ′ is the capital cost of the power-to-methanol plant, λ′
is the O&M rate of the power-to-methanol plant plus the in-surance rate, CF is the plant capacity factor, Prated is the ratedpower of the plant, ηMeOH is the plant efficiency (49 %; seeBabarit et al., 2020a), LCOEelec is the cost of input electricityto the power-to-methanol plant,CCO2 is the CO2 cost per unitmass and LHVMeOH is the lower heating value of methanolper unit mass (the factor 1.38 corresponds to the fact that ittakes 1.38 kg of CO2 to produce 1 kg of methanol).
Table 4 shows the cost assumption for the power-to-methanol plant of the offshore wind farm. The capital cost is
Wind Energ. Sci., 6, 1191–1204, 2021 https://doi.org/10.5194/wes-6-1191-2021
A. Babarit et al.: Exploitation of the far-offshore wind energy resource by fleets of energy ships – Part 2 1201
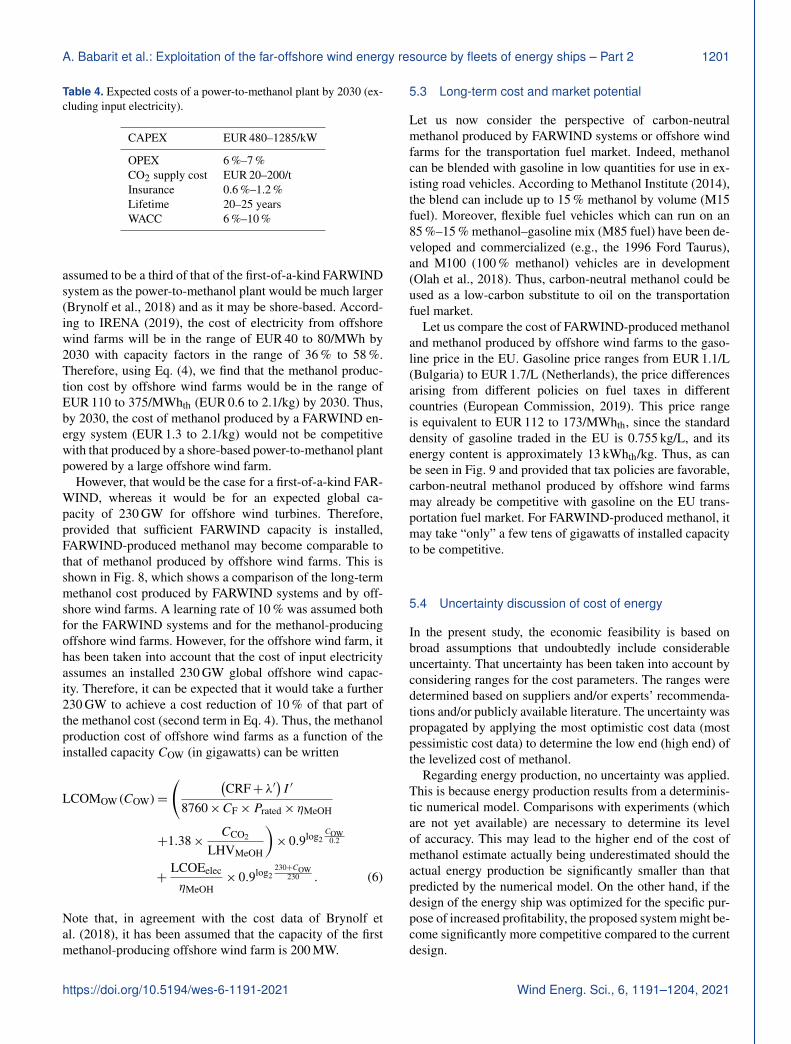
Table 4. Expected costs of a power-to-methanol plant by 2030 (ex-cluding input electricity).
CAPEX EUR 480–1285/kW
OPEX 6 %–7 %CO2 supply cost EUR 20–200/tInsurance 0.6 %–1.2 %Lifetime 20–25 yearsWACC 6 %–10 %
assumed to be a third of that of the first-of-a-kind FARWINDsystem as the power-to-methanol plant would be much larger(Brynolf et al., 2018) and as it may be shore-based. Accord-ing to IRENA (2019), the cost of electricity from offshorewind farms will be in the range of EUR 40 to 80/MWh by2030 with capacity factors in the range of 36 % to 58 %.Therefore, using Eq. (4), we find that the methanol produc-tion cost by offshore wind farms would be in the range ofEUR 110 to 375/MWhth (EUR 0.6 to 2.1/kg) by 2030. Thus,by 2030, the cost of methanol produced by a FARWIND en-ergy system (EUR 1.3 to 2.1/kg) would not be competitivewith that produced by a shore-based power-to-methanol plantpowered by a large offshore wind farm.
However, that would be the case for a first-of-a-kind FAR-WIND, whereas it would be for an expected global ca-pacity of 230 GW for offshore wind turbines. Therefore,provided that sufficient FARWIND capacity is installed,FARWIND-produced methanol may become comparable tothat of methanol produced by offshore wind farms. This isshown in Fig. 8, which shows a comparison of the long-termmethanol cost produced by FARWIND systems and by off-shore wind farms. A learning rate of 10 % was assumed bothfor the FARWIND systems and for the methanol-producingoffshore wind farms. However, for the offshore wind farm, ithas been taken into account that the cost of input electricityassumes an installed 230 GW global offshore wind capac-ity. Therefore, it can be expected that it would take a further230 GW to achieve a cost reduction of 10 % of that part ofthe methanol cost (second term in Eq. 4). Thus, the methanolproduction cost of offshore wind farms as a function of theinstalled capacity COW (in gigawatts) can be written
LCOMOW (COW)=
( (CRF+ λ′
)I ′
8760×CF×Prated× ηMeOH
+1.38×CCO2
LHVMeOH
)× 0.9log2
COW0.2
+LCOEelec
ηMeOH× 0.9log2
230+COW230 . (6)
Note that, in agreement with the cost data of Brynolf etal. (2018), it has been assumed that the capacity of the firstmethanol-producing offshore wind farm is 200 MW.
5.3 Long-term cost and market potential
Let us now consider the perspective of carbon-neutralmethanol produced by FARWIND systems or offshore windfarms for the transportation fuel market. Indeed, methanolcan be blended with gasoline in low quantities for use in ex-isting road vehicles. According to Methanol Institute (2014),the blend can include up to 15 % methanol by volume (M15fuel). Moreover, flexible fuel vehicles which can run on an85 %–15 % methanol–gasoline mix (M85 fuel) have been de-veloped and commercialized (e.g., the 1996 Ford Taurus),and M100 (100 % methanol) vehicles are in development(Olah et al., 2018). Thus, carbon-neutral methanol could beused as a low-carbon substitute to oil on the transportationfuel market.
Let us compare the cost of FARWIND-produced methanoland methanol produced by offshore wind farms to the gaso-line price in the EU. Gasoline price ranges from EUR 1.1/L(Bulgaria) to EUR 1.7/L (Netherlands), the price differencesarising from different policies on fuel taxes in differentcountries (European Commission, 2019). This price rangeis equivalent to EUR 112 to 173/MWhth, since the standarddensity of gasoline traded in the EU is 0.755 kg/L, and itsenergy content is approximately 13 kWhth/kg. Thus, as canbe seen in Fig. 9 and provided that tax policies are favorable,carbon-neutral methanol produced by offshore wind farmsmay already be competitive with gasoline on the EU trans-portation fuel market. For FARWIND-produced methanol, itmay take “only” a few tens of gigawatts of installed capacityto be competitive.
5.4 Uncertainty discussion of cost of energy
In the present study, the economic feasibility is based onbroad assumptions that undoubtedly include considerableuncertainty. That uncertainty has been taken into account byconsidering ranges for the cost parameters. The ranges weredetermined based on suppliers and/or experts’ recommenda-tions and/or publicly available literature. The uncertainty waspropagated by applying the most optimistic cost data (mostpessimistic cost data) to determine the low end (high end) ofthe levelized cost of methanol.
Regarding energy production, no uncertainty was applied.This is because energy production results from a determinis-tic numerical model. Comparisons with experiments (whichare not yet available) are necessary to determine its levelof accuracy. This may lead to the higher end of the cost ofmethanol estimate actually being underestimated should theactual energy production be significantly smaller than thatpredicted by the numerical model. On the other hand, if thedesign of the energy ship was optimized for the specific pur-pose of increased profitability, the proposed system might be-come significantly more competitive compared to the currentdesign.
https://doi.org/10.5194/wes-6-1191-2021 Wind Energ. Sci., 6, 1191–1204, 2021

1202 A. Babarit et al.: Exploitation of the far-offshore wind energy resource by fleets of energy ships – Part 2
Figure 8. Comparison of long-term methanol cost produced by FARWIND systems and offshore wind farms as function of the installedcapacity.
Figure 9. Cost of methanol produced by FARWIND systems and offshore wind farms as a function of the installed capacity and comparisonwith current market price of gasoline in the EU.
6 Conclusions
In this paper, we proposed an energy system for sustainablemethanol production from the far-offshore wind energy re-source. It is based on an autonomous fleet of 112 energyships and five manned tankers for the collection and trans-port of the produced methanol, as well as the supply of CO2to the energy ships. The system’s methanol production is ex-pected to be on the order of 70 600 t per annum (approxi-mately 390 GWh per annum of chemical energy). The costof this methanol is expected to be in the range of EUR 1.2–3.6/kg for the first-of-a-kind FARWIND system, which issignificantly greater than the current market price for fossil-fuel-derived methanol (EUR 0.4/kg). However, methanol canbe used as a substitute to fossil fuels on the fuel transporta-tion market: since the price of transportation fuel is highin most European countries. Assuming that a cost reduction
similar to that observed for land-based wind energy can beachieved, the cost of FARWIND-produced methanol couldcompete with gasoline in the EU.
The cost of methanol produced by a first-of-a-kind FAR-WIND system is unlikely to be competitive with that pro-duced by a large shore-based power-to-methanol plant pow-ered by an offshore wind farm. However, provided that suffi-cient FARWIND capacity is installed, FARWIND-producedmethanol may become comparable to that of methanol pro-duced by offshore wind farms.
However, one should note that the present study is basedon many broad assumptions that include considerable uncer-tainty. Further work is needed to confirm the findings. More-over, one should note that the cost of FARWIND-producedmethanol is based on a particular energy ship design, whichmight be optimized to reduce costs.
Wind Energ. Sci., 6, 1191–1204, 2021 https://doi.org/10.5194/wes-6-1191-2021

A. Babarit et al.: Exploitation of the far-offshore wind energy resource by fleets of energy ships – Part 2 1203
Code and data availability. The code and data supporting thefindings of this study are available from the corresponding authorupon request.
Author contributions. AB and JCG conceived of the presentedidea. AB developed the theory and performed the computations. GBcontributed to the modeling of the aerodynamic interactions. PdB,AN and FG performed the structural analysis of the hull. AB wrotethe manuscript in consultation with all other co-authors.
Competing interests. Aurélien Babarit and Félix Gorintin areco-founders of Farwind Energy: http://www.farwind-energy.com(last access: 14 September 2021), which aims at commercializingthe technology described in the paper.
Disclaimer. Publisher’s note: Copernicus Publications remainsneutral with regard to jurisdictional claims in published maps andinstitutional affiliations.
Acknowledgements. This research was partially carried out inthe Marine Energy Alliance project, which is financially supportedby Interreg North-West Europe.
Financial support. This research has been supported by the In-terreg North-West Europe (Marine Energy Alliance project).
Review statement. This paper was edited by Amir R. Nejad andreviewed by two anonymous referees.
References
Abd-Jamil, R., Chaigneau, A., Gilloteaux, J.-C., Lelong, P., andBabarit, A.: Comparison of the capacity factor of stationary windturbines and weather-routed energy ships in the far-offshore, J.Phys.-Conf. Ser., 1356, 2019.
Babarit, A., Gilloteaux, J-C., Clodic, G., Duchet, M., Si-moneau, A., and Platzer, M. F.: Techno-economic feasibil-ity of fleets of far offshore hydrogen-producing wind en-ergy converters, Int. J. Hydrogen Energy, 43, 7266–7289,https://doi.org/10.1016/j.ijhydene.2018.02.144, 2018.
Babarit, A., Gilloteaux, J.-C., Body, E., and Hetet, J.-F.: Energy andeconomic performance of the FARWIND energy system for sus-tainable fuel production from the far-offshore wind energy re-source, in: Proc. Of the 14th International conference on eco-logical vehicles and renewable energies (EVER 2019), Monaco,https://doi.org/10.1109/EVER.2019.8813563, 2019.
Babarit, A., Clodic, G., Delvoye, S., and Gilloteaux, J.-C.: Exploita-tion of the far-offshore wind energy resource by fleets of energyships – Part 1: Energy ship design and performance, Wind En-erg. Sci., 5, 839–853, https://doi.org/10.5194/wes-5-839-2020,2020a.
Babarit, A., Delvoye, S., Clodic, G., and Gilloteaux, J.-C.: Exploita-tion of the far-offshore wind energy resource by fleets of en-ergy ships. Part B. Cost of energy, Wind Energ. Sci. Discuss.[preprint], https://doi.org/10.5194/wes-2019-101, 2020b.
Blue WASP: Preliminary analysis of Flettner rotor aerodynamicinteraction for two given conditions, Technical report, 9 pp.,November 2020.
Bordogna, G.: Aerodynamics of wind-assisted ships, PhD thesis,Delft University of Technology, Delft, 2020.
BP: BP Statistical review of world energy, 67th edition, BP, London,UK, June 2018.
Brynolf, S., Taljegard, M., Grahn, M., and Hansson, J.:Electrofuels for the transport sector: a review of pro-duction costs, Renew. Sust. Energ. Rev., 81, 1887–1905,https://doi.org/10.1016/j.rser.2017.05.288, 2018.
Bureau Veritas: NR600 Hull structure and arrangement for theclassification of cargo ships less than 65 m and non cargoships less than 90 m, Edition November 2018, available at:available at: https://marine-offshore.bureauveritas.com/nr600-hull-structure-and-arrangement-classification-cargo-ships-less-65-m-and-non-cargo-ships-less (last access: 19 February 2021),2018.
Chardonnet, C., De Vos, L., Genoese, F., Roig, G., Giordano, V.,Rapoport, S., Bart, F., De Lacroix, T., Ha, T., Van Genabet, B.,Lanoix, J.-C., and Vanhoudt, W.: Study on early business casesfor H2 in energy storage and more broadly power to H2 applica-tions, Tractebel & Hinicio, Final report, 2017.
Charrier, D.: Etude théorique et expérimentale de l’effet “Magnus”destiné à la propulsion des navires, PhD thesis, Université deParis VI, Paris, 1979.
Chart: Technical manual: carbon dioxide storage tank, Manual#11650869 Rev, Chart industries, Ball ground, USA, 2019.
Delhommeau, G. and Maisonneuve, J.-J.: Extensions du code decalcul de résistance de vagues REVA : prise en compte des ef-fets de fond et de portance, Compte-rendu des 1e Journées del’hydrodynamique, Nantes, France, 1987.
EMEC: Marine Energy Alliance – FARWIND: feasibility review,Technical report, 24 pp., October 2020.
European Commission: Consumer prices of petroleum products in-clusive of duties and taxes, Prices in force on 18 November 2019,2019.
Fasihi, M., Bogdanov, D., and Breyer, C.: Techno-economic assess-ment of power-to-liquids (PtL) fuels production and global trad-ing based on hybrid PV-wind power plants, Energ. Procedia, 99,243–268, https://doi.org/10.1016/j.egypro.2016.10.115, 2016.
Gitank: GI Chemical Technical Brochure, available at: https://www.gitank.com/methanol-storage-tanks, last access: 9 July 2021.
Graves, C., Ebbesen, S. D., Mogensen, M., and Lackner, K. S.: Sus-tainable hydrocarbon fuels by recycling CO2 and H2O with re-newable or nuclear energy, Renew. Sust. Energ. Rev., 15, 1–23,https://doi.org/10.1016/j.rser.2010.07.014, 2011.
Holl, M., Rausch, L., and Pelz, P. F.: New methods for new sys-tems – how to find techno-economically optimal hydrogen con-version system, Int. J. Hydrogen Energy, 42, 22641–22654,https://doi.org/10.1016/j.ijhydene.2017.07.061, 2017.
Ioannou, A. and Brennan, F.: A techno-economic compari-son between a grid-connected and non-grid connected off-shore floating wind farm, in: Proc. Of the IEEE 2019 Off-
https://doi.org/10.5194/wes-6-1191-2021 Wind Energ. Sci., 6, 1191–1204, 2021

1204 A. Babarit et al.: Exploitation of the far-offshore wind energy resource by fleets of energy ships – Part 2
shore energy and storage summit (OSES), Brest, France,https://doi.org/10.1109/OSES.2019.8867350, 2019.
IRENA: Future of wind – deployment, investment, technology, gridintegration and socio-economic aspects, International RenewableEnergy Agency, Abu Dhabi, October 2019.
Irlam, L.: Global costs of carbon capture and storage – 2017 update,Global CCS institute, Melbourne, Australia, June 2017.
Keith, D. W., Holmes, G., St Angelo, D., and Heidel, K.: A processfor capturing CO2 from the atmosphere, Joule, 2, 1573–1594,https://doi.org/10.1016/j.joule.2018.05.006, 2018.
Li, H., Tan, Y., Ditaranto, M., Yan, J., and Yu, Z.: CapturingCO2 from biogas plants, Energ. Procedia, 114, 6030–6035,https://doi.org/10.1016/j.egypro.2017.03.1738, 2017.
Lindman, A. and Soderholm, P.: Wind power learning rates: a con-ceptual review and meta-analysis, Energ. Econom., 34, 754–761,https://doi.org/10.1016/j.eneco.2011.05.007, 2012.
Lindstad, H., Asbjornslett, B. E., and Stromman, A. H.: Theimportance of economies of scale for reductions in green-house gas emissions from shipping, Energ. Policy, 46, 386–398,https://doi.org/10.1016/j.enpol.2012.03.077, 2012.
MAN Energy solutions: propulsion trends in bulk carriers, avail-able at: https://www.man-es.com/docs/default-source/marine/propulsion-trends-in-bulk-carriers-manpm-00-0615-preview.pdf?sfvrsn=2aa2ebbf_6 (last access: 14 September 2021), 2019.
Martin, M. and Grossmann, I. E.: Towards zero CO2 emis-sions in the production of methanol from switchgrass.CO2 to methanol, Comput. Chem. Eng., 105, 308–316,https://doi.org/10.1016/j.compchemeng.2016.11.030, 2017.
Methanol Institute: M15 methanol gasoline blends: 35 years of re-search and experience supports its use, Methanol facts, MethanolInstitute, Singapore, 2014.
Morgan, E. R.: Techno-economic feasibility study of ammoniaplants powered by offshore wind, Dissertations 697, Universityof Massachussets, Amherst, 2013.
Norsepower: Rotor Sail Technology, Commercial brochure, avail-able at: https://www.norsepower.com/download/brochure.pdf,last access: 19 February 2021.
Oi, L. E., Eldrup, N., Adhikari, U., Bentsen, M. H.,Badalge, L., and Yang, S.: Simulation and cost compar-ison of CO2 liquefaction, Energ. Procedia, 86, 500–510,https://doi.org/10.1016/j.egypro.2016.01.051, 2016.
Olah, G. A., Goeppert, A., and Surya Prakash, G. K.: Beyond Oiland Gas: the methanol economy. Third, updated and enlargededition, Wiley-VCH, 2018.
Parks, G., Boyd, R., Cornish, J., and Remick, R.: Hydrogen stationcompression, storage, and dispensing: technical status and costs,Technical report NREL/BK-6A10-58564, National RenewableEnergy Laboratory, 2014.
Pfaffel, S., Faulstich, S., and Rohrig, K.: Performance and re-liability of wind turbines: a review, Energies, 10, 1904,https://doi.org/10.3390/en10111904, 2017.
Roncin, K. and Kobus, J.-M.: Dynamic simulation of two sail-ing boats in match racing, Sports Engineering, 7, 139–152,https://doi.org/10.1007/BF02844052, 2004.
Schmidt, O., Gambhir, A., Staffel, I., Hawkes, A., Nelson, J., andFew, S.: Future cost and performance of water electrolysis: an ex-pert elicitation study, Int. J. Hydrogen Energy, 42, 30470–30492,https://doi.org/10.1016/j.ijhydene.2017.10.045, 2017.
Sheng, S.: Report on wind turbine subsystem reliability: a survey ofvarious databases. Presentation NREL/PR-5000-59111, NationalRenewable Energy Laboratory, Golden, CO, June 2013.
Shetelig, K.: Shipbuilding cost estimation: parametric approach,Norwegian University of Science and Technology, Trondheim,Norway. 61 pp., 2013.
Tillig, F. and Ringsberg, J. W.: Design, operation and analy-sis of wind-assisted cargo ships, Ocean Eng., 211, 107603,https://doi.org/10.1016/j.oceaneng.2020.107603, 2020.
Willauer, H. D., Hardy, D. R., Schultz, K. R., and Williams, F. W.:The feasibility and current estimated capital costs of producingjet fuel at sea using carbon dioxide and hydrogen, J. Renew. Sust.Energy, 4, 033111, https://doi.org/10.1063/1.4719723, 2012.
Willauer, H. D., DiMascio, F., and Hardy, D. R.: Extraction of car-bon dioxide and hydrogen from seawater by an electrolytic cationexchange module (E-CEM) part V: E-CEM effluent dischargecomposition as a function of electrode water composition, Navalresearch laboratory, Washington D.C., 2017.
Wind Energ. Sci., 6, 1191–1204, 2021 https://doi.org/10.5194/wes-6-1191-2021