
Explaining Trade Flows: Traditional and New Determinants...
34
Journal of Economic Integration 24(1), March 2009; 53-86 Explaining Trade Flows: Traditional and New Determinants of Trade Patterns Julien Gourdon World Bank CERDI Abstract An empirical tradition in international trade seeks to establish whether the predictions of factor abundance theory match with the data. In this paper, we test if the “new” determinants used in the factor content version of H-O-V models (differences in productivity, in returns to scale or in consumers’ preferences) help us to improve our estimation of trade patterns in commodities. The results show that conventional factors are still important in determining trade structure although new determinants need to be included to determine comparative advantage. Turning to the change across periods, differences in factor endowments have not diminished over time: we observe an increase in specialization according to skill endowment. Hence, those “new” determinants are not new forces that drive trade flows. • JEL Classification : F11, F14, F2 • Key Words: international trade, Hecksher-Ohlin model I. Introduction In the neo-classical general equilibrium model of international trade, countries trade with each other because of their differences. The Heckscher-Ohlin model, developed by Eli Heckscher and Bertil Ohlin, holds on to the idea that trade patterns depend on the relative differences of countries’ factor endowments. *Corresponding address: Julien Gourdon: The World Bank, 1818 H Street, NW, Washington, DC 20433 USA, CERDI, Clermont-Ferrand, Fance, e-mail: [email protected] ©2009-Center for International Economics, Sejong Institution, Sejong University, All Rights Reserved.
Transcript of Explaining Trade Flows: Traditional and New Determinants...
Journal of Economic Integration24(1), March 2009; 53-86
Explaining Trade Flows: Traditional and New Determinants of Trade Patterns
Julien Gourdon
World BankCERDI
Abstract
An empirical tradition in international trade seeks to establish whether the
predictions of factor abundance theory match with the data. In this paper, we test
if the “new” determinants used in the factor content version of H-O-V models
(differences in productivity, in returns to scale or in consumers’ preferences) help
us to improve our estimation of trade patterns in commodities. The results show
that conventional factors are still important in determining trade structure
although new determinants need to be included to determine comparative
advantage. Turning to the change across periods, differences in factor
endowments have not diminished over time: we observe an increase in
specialization according to skill endowment. Hence, those “new” determinants
are not new forces that drive trade flows.
• JEL Classification : F11, F14, F2
• Key Words: international trade, Hecksher-Ohlin model
I. Introduction
In the neo-classical general equilibrium model of international trade, countriestrade with each other because of their differences. The Heckscher-Ohlin model,developed by Eli Heckscher and Bertil Ohlin, holds on to the idea that tradepatterns depend on the relative differences of countries’ factor endowments.
*Corresponding address: Julien Gourdon: The World Bank, 1818 H Street, NW, Washington, DC 20433USA, CERDI, Clermont-Ferrand, Fance, e-mail: [email protected]
©2009-Center for International Economics, Sejong Institution, Sejong University, All Rights Reserved.
54 Julien Gourdon
Empirical studies, however, have often shown a weak link between factorendowments and trade flows, both within countries (between regions) and betweenthem. Those studies have tested two versions of the H-O model: the commodityversion and the factor content version. In the commodity version, a capital-abundant country will export capital-intensive goods. In the generalization of afactor version (Vanek, 1968), a capital-abundant country will export capitalservices.
Many improvements on the factor content version have been introduced andtested, but their implications concerning net trade in commodities seem relativelyweak.1 Predicting net trade in commodities in an nxn world is not straightforward,notably because input-output linkages preclude a linear relation between factorendowments and net exports. Furthermore, unlike in the Ricardian model, in the H-O model a ladder of comparative advantage cannot be obtained. This paper is acontribution to the body of literature on trade patterns of developing countries.
The Heckscher-Ohlin-Vanek (H-O-V) theorem has been frequently rejected infavor of statistical hypotheses such as a zero correlation between factorendowments and trade patterns. The prevailing view in the mid-1990’s shaped byunclear results, can be encapsulated by Leamer and Levinsohn’s appraisal (1995)of the empirical performance of factor endowment theories: “It is more convenientto estimate the speed of arbitrage rather than test if the arbitrage is perfect andinstantaneous”.
During the same period, an expanding body of literature on the determinants oftrade patterns used differences in consumers’ preferences, technology, or returns toscale. Differences in technology, suggested by Ricardo, have been frequently used(Trefler 1995, Davis and Weinstein 2001) and, not surprisingly, have considerablyimproved the prediction of trade in factor services. On the other hand, differencesin consumer’s preferences could relate to home bias consumption (Trefler 1995) ornon-homothetic preferences due to differences in income per capita (Markusen1986 or Jones et al. 1999). Finally, increasing returns to scale in some sectors isalso relevant in explaining some factor service trade flows (Antweiler and Trefler2002, Head and Ries 2001).
To learn more about the determinants of comparative advantage one needs toinclude many countries and, if possible, over a sufficiently long period of time, to
1There are also improvements concerning the literature on specialization in production: some authors (e.g.Harrigan 1997) argue that it is more important to look at the pattern of specialization rather than thepattern of trade since economists won’t be able to understand trade until they understand specialization.

Explaining Trade Flows: Traditional and New Determinants of Trade Patterns 55
observe if those determinants have changed through time. In the absence of reliableinput-output data needed to compute the net factor content of trade, one can studythe determinants of net trade in commodities (i.e. rely on the commodity version ofthe H-O-V theorem). Lederman and Xu (2001) include these “new” determinantsin a commodity version for a panel of 57 countries over 25 years for 10 products’clusters introduced by Leamer (1984). They used a probit estimation to test theimpact of factor endowments on net exports which is a better way of controling fornon-linearity than the one used in previous commodity studies (Leamer 1984 and1987).
This paper extends the commodity version analysis in several ways. First, itincludes differences in consumers’ preferences and differences in returns to scaleas determinants of comparative advantage and not only as determinants of tradeintensity. Second, total factor productivity is used as a measure for differences intechnology, rather than expenditure in research and development. Third, a sampleof 71 countries over 40 years (see Table A1. in Appendices) makes it possible todiscern two periods: pre-1980 and post-1980, and isolate any changes in therelative importance of conventional and new factors during the period underreview. Fourth, we use a more disaggregated classification than Leamer, leading tobetter results on manufactured commodities.2 Finally, rather than using“unadjusted” factor endowments measures, we use a measure of relative factorendowment (relative to the world endowment) in order to be closer to the theory.
The results show that the H-O-V is “alive and well” and, furthermore, the “new”determinants do not have a greater explanatory power in the 1980-2000 period thanthey do in the 1960-1980 period. Nonetheless, adding the new determinants offactor content studies helps us improve the prediction of specialization in differentmanufactured products. Similar results have been found in previous studies. Theimportance of factor endowments is especially strong concerning specialization inthe human capital endowment. This finding may come as a result of distinguishingamong three sets of skills: unskilled, primary skilled, and highly skilled. Tradepatterns are also determined by trade intensity; here difference in technology, tradepolicy, transport, and transaction costs explain the difference in trade intensity.
The paper is organized as follows. Section II provides an overview of the H-Omodel and the amendments added in the factor content studies. Section IIIdescribes the empirical approach, the data used and their organization between
2The manufactured commodities’ clusters are more detailed.

56 Julien Gourdon
explanatory variables for comparative advantage and for trade intensity, and thecluster’s construction. Section IV presents the econometric results followed bysection V, which concludes.
II. Theoretical Approaches to Explain Trade Patterns
The traditional explanation of trade based on the H-O theorem states that underperfect competition, identical technology, identical and homothetic tastes, and noimpediments to trade, net trade for country c, T c is a linear function of technology,
A, consumption share and factor endowment V c, according to the well-knownrelation:
(1)
where w stands for the vector of factor prices and p stands for the vector ofcommodity prices which are set equal to unity by choice of units.
Several studies linking the pattern of trade (i.e. net exports) to endowments havefound the relation to be non-linear. More recent investigations have relaxed theabove “strict” formulation by allowing for “new” determinants: (i) differences intotal factor productivity (TFP) taking place at the country level, which are capturedby scaling the endowment vector at the country level δ c; (ii) economies of scale atthe industry level, µ; (iii) identical, but quasi-homothetic preferences so thatconsumption shares are a function of income per capita y, i.e
(2)
Frictions (trade barriers,3 transaction and transport costs) should also be takeninto account. As Leamer (1984) showed, these impediments are reflected in adeviation of domestic prices from international prices. In matrix notation, let θsubscript indicate variables that depend on trade impediments. Then, the zero profitcondition Aw = p becomes AθWθ = θpw = pθ . We may then write the trade vector invalue terms as:
(3)
Typically, to include new determinants, these extensions are introduced in factorcontent version. In this paper, we take the view that investigating the H-O
s yc( )c
pTc
wA1–
Vc
scV
w–( ) with Aw p and p w 1≡ ≡==
s yc( )c
Tc µ( ) A
1– δcV
cs yc( )
cV
w–( )=
pθTc µ( ) Aθ
1–wθ δ c
Vc
sθ yc( )c
wwVw
–( )=
3Travis (1964) argues that tariffs on labor intensive imports can explain the Leontief finding that US in1947 was net exporter of labor services.

Explaining Trade Flows: Traditional and New Determinants of Trade Patterns 57
“theorem” is best done by studying net export patterns rather than the factorcontent - which requires input-output (IO) matrices4 - or the industrial version -which is further away from H-O.5
Using new determinants found in factor content versions in a commodityversion, allows us to learn more about the determinants of comparative advantage.As noted earlier in the paper, a study like this needs to include many countries and,if possible, over a sufficiently long period of time in order to observe possiblechanges in determinants through time. In the absence of reliable input-output dataneeded to compute the net factor content of trade, one may study the determinantsof net trade on commodities.
III. Empirical Approach
We model export intensity as a Heckman selection model. That is, country-specific characteristics or factor endowments determine comparative advantage —proxied by the condition of having positive net exports — on one hand, anddomestic and foreign market sizes, the macroeconomic environment, transactioncosts, and institutions determine export intensity, on the other hand. Moreover, weallow the estimates of trade intensity for the net-importer and the net-exporter sub-samples to differ.
A. Selection Model
To implement equation (3) one could regress the net exports of a country c for aproduct i in year t, NXict, on endowment in different factors j, Ejct, on k newdeterminants (difference in productivity, in consumers preferences and returns toscale) Nkct, on m variables determining trade intensity (or impediments) Tlmct andon regional dummies DRrt and year dummies DYt in the following way:
(4)
However, trade impediment variables do not have the same impact on net tradefor net importers and net exporters since trade liberalization increases the net traderatio for net importers and decreases the net trade ratio for net exporters. In other
NXict β0 β1 jEjct β2kNmct β3MTImct DRrt DYt εct+ + +m 1 5,=∑+
k 1 3,=∑+
j 1 5,=∑+=
4They often cover just one year, or do not use real input output matrix from all countries, or do notaccount for natural resources.
5The H-O theorem is based on international trade and data on production by sector is less available thandata on trade by sector, so the sample of countries is often small.
58 Julien Gourdon
words, it is unlikely that the coefficients of the explanatory variables for tradeintensity are the same for all countries, especially for importing and exportingcountries of the same commodity. In a linear homogenous implementation, theeffects of many variables would be washed out by this heterogeneity.
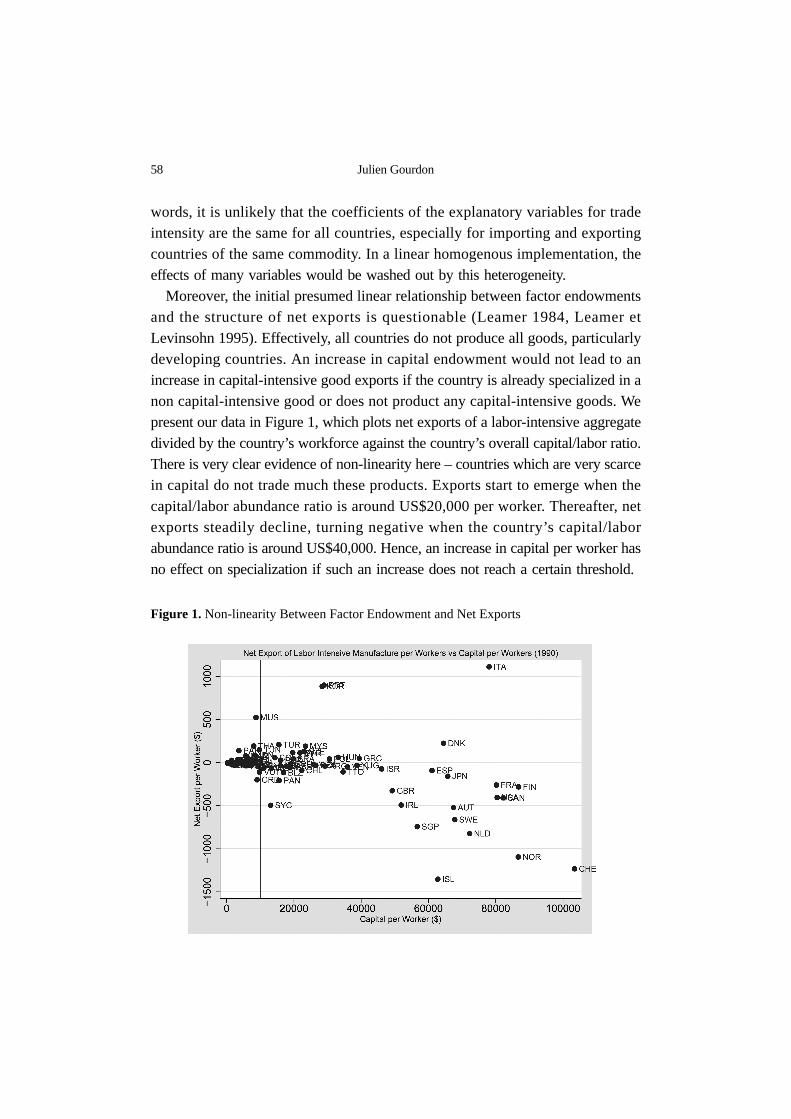
Moreover, the initial presumed linear relationship between factor endowmentsand the structure of net exports is questionable (Leamer 1984, Leamer etLevinsohn 1995). Effectively, all countries do not produce all goods, particularlydeveloping countries. An increase in capital endowment would not lead to anincrease in capital-intensive good exports if the country is already specialized in anon capital-intensive good or does not product any capital-intensive goods. Wepresent our data in Figure 1, which plots net exports of a labor-intensive aggregatedivided by the country’s workforce against the country’s overall capital/labor ratio.There is very clear evidence of non-linearity here – countries which are very scarcein capital do not trade much these products. Exports start to emerge when thecapital/labor abundance ratio is around US$20,000 per worker. Thereafter, netexports steadily decline, turning negative when the country’s capital/laborabundance ratio is around US$40,000. Hence, an increase in capital per worker hasno effect on specialization if such an increase does not reach a certain threshold.
Figure 1. Non-linearity Between Factor Endowment and Net Exports
Explaining Trade Flows: Traditional and New Determinants of Trade Patterns 59
To control for the heterogeneity in the trade impediment variables, we can havethe trade intensity variables interact with a dummy, indicating the status Sct of thecountry (where 1 indicates a net exporter status and 0 a net importer status).
Using a probit estimation for the status allows a non-linear relationship betweenfactor endowment and the net export, meaning that the marginal impact of anincrease in factor endowment is greater when the factor endowment is alreadysufficiently high to allow countries to specialize in the good. An estimable modelwould have the following form:
(5)
where with β2 > 0 and β3 < 0
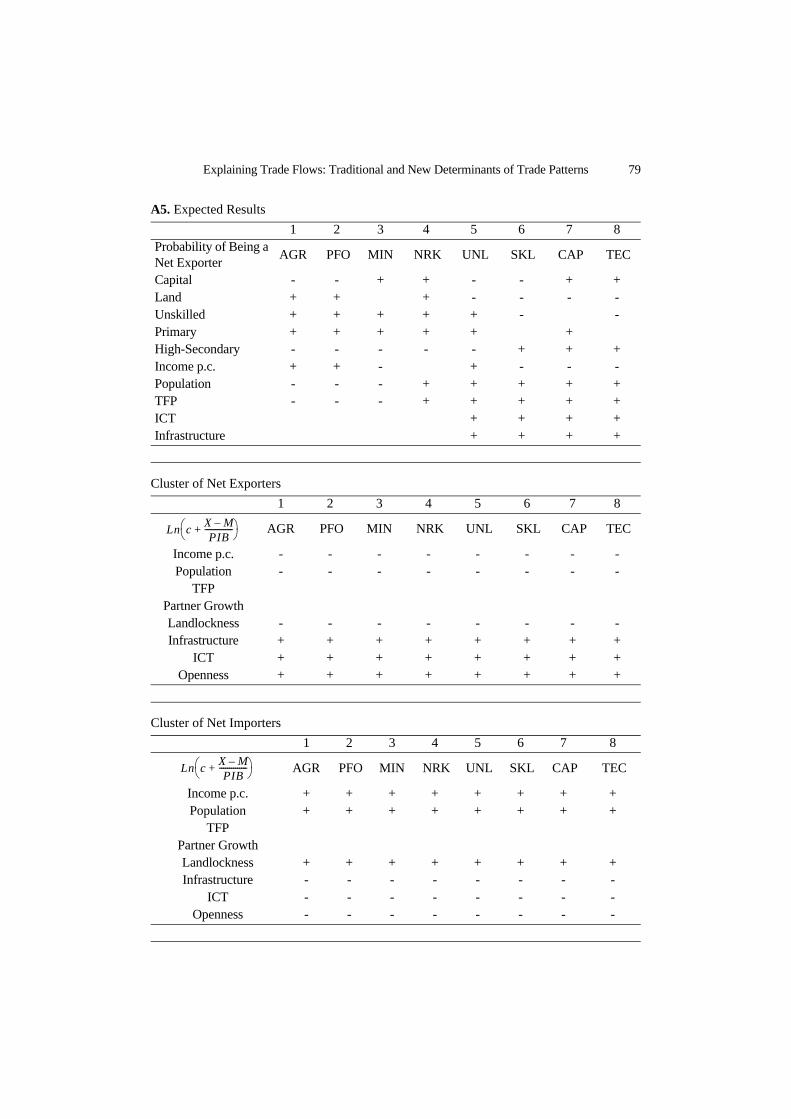
With a linear estimation, we would have biased results in case of correlationbetween εct and µct. It is plausible that the unobservable variables for the statuswould be correlated with unobservable variables for the amount of net exports.Following Lederman and Xu (2001), we use a Heckman procedure to control forthat. We initially test in equation (6) the probability of being a net exporter of agood (i.e. the status). We assume that the probability of having positive net exportsSct is determined by the conventional explanatory variables, factor endowments,Ejct ,and by “new” determinants Nkct. We assume increasing returns to scale andTFP should lead to be net exporter of manufactured products, at the expanse nonmanufacture products. Differences in consumers’ preferences are also potentialsdeterminants in this comparative advantage equation since theory suggests thatdemand for superior goods increases as income rises, whereas demand falls for aninferior good. So we expect that a rise in income par capita will decrease theprobability of being a net importer in superior goods since this will increaseimports and/or decrease exports of superior goods to respond to the local demand.Moreover, some determinants of trade intensity TImct (e.g. infrastructure andinformation and communication technology-ICT) could also determine thecomparative advantage, since products are differently sensitive to transport andtransactions costs.6 Manufactured products and mainly most sophisticated
NXict β0 β1kNkct β2M Sct*TImct( ) β3MTImct β4MScr DYt εct+ + +m 1 5,=∑+
m 1 5,=∑+
k 1 3,=∑+=
Sct α0 α1jEjct α2kNkct DRrt DYt µct+ + +k 1 3,=∑+
j 1 5,=∑+=
6In a Heckman procedure all determinants of the second step (here trade intensity variables) have to beincluded in the first step if they are significant in this first step. The same variables that determine howbig a country's net exports of a particular good (or commodity group) also determine that probability thata country will export these goods at all.
60 Julien Gourdon
manufactures should be more sensitive to ICT. Bougheas and al (2000) showedthat increasing infrastructure tends to raise the specialization in manufactureproducts since it could be considered as a cost-reducing technology for themanufactured sector.
(6)
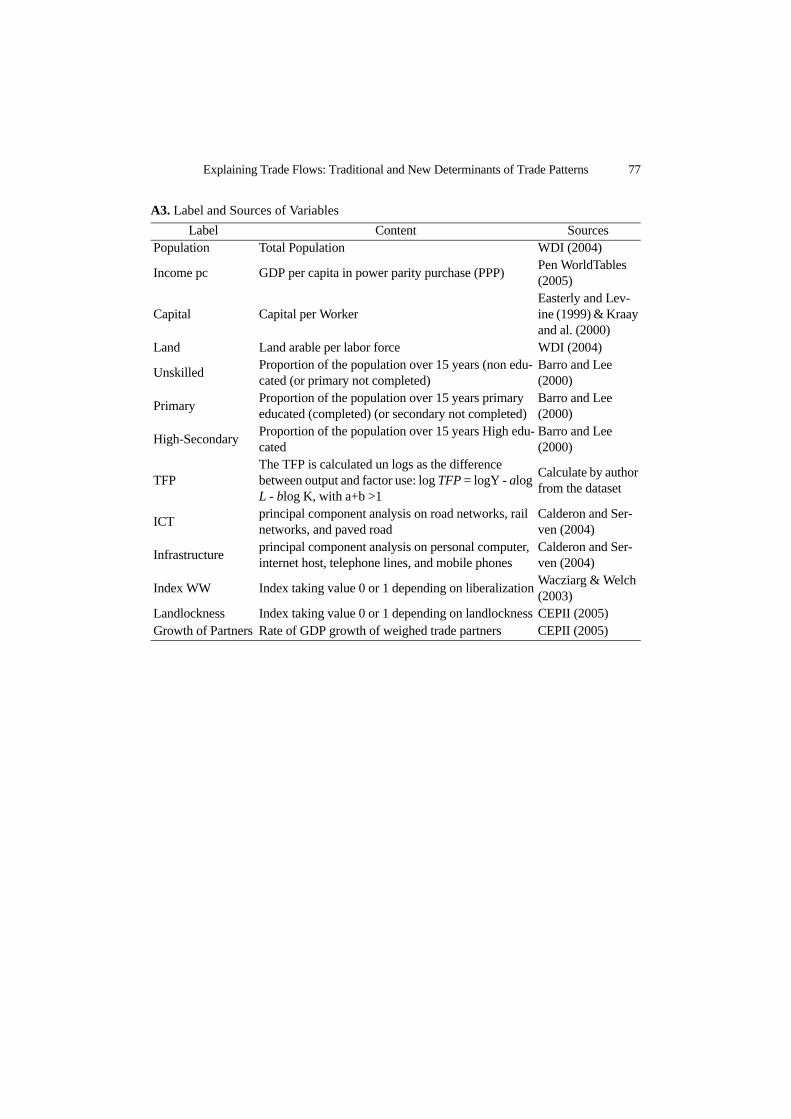
Following this, we continue by testing the explanatory variables on the samplesof net exporters (equation 7) and net importers (equation 8) relative to tradeintensity. To the usual determinant of trade intensity, we add new determinants thatare as important as in the comparative advantage estimate. We expect a significantimportance of frictions (trade barriers, transaction and transport costs). The sign ofvariables capturing increasing returns to scale (total population) and consumers’preferences (income per capita) might be unclear since those variables might alsocapture size market effects. All those explanatory variables are presented inAppendices, Table A3.
(7)
(8)
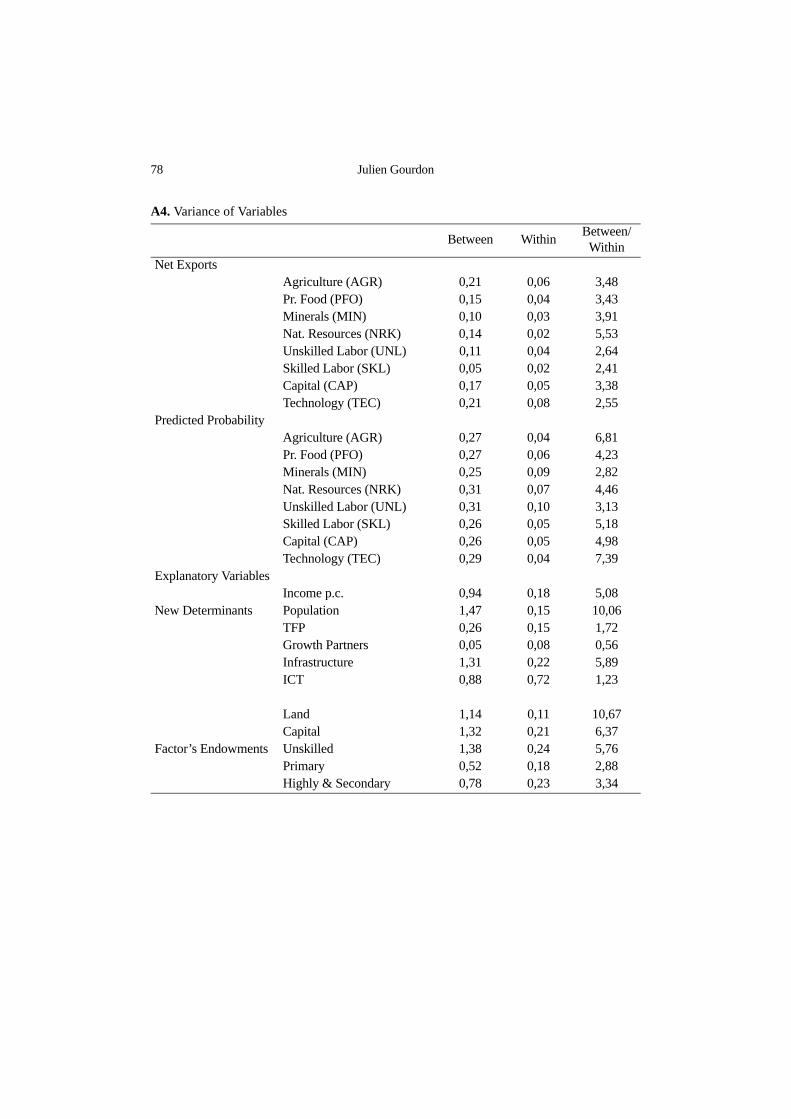
Following Lederman and Xu (2001), we consider that factor endowmentsshould not be added in the second step. Our justification is statistical, we see inTable A4 provided in the Appendices that the condition of being a net exporter hasan even higher cross-country variance (column “between”) relative to cross-timevariance (column “within”) than the value of net exports for most sectors. Therelative factor endowment variables (in bold) are also relatively more stable overtime than among countries.7
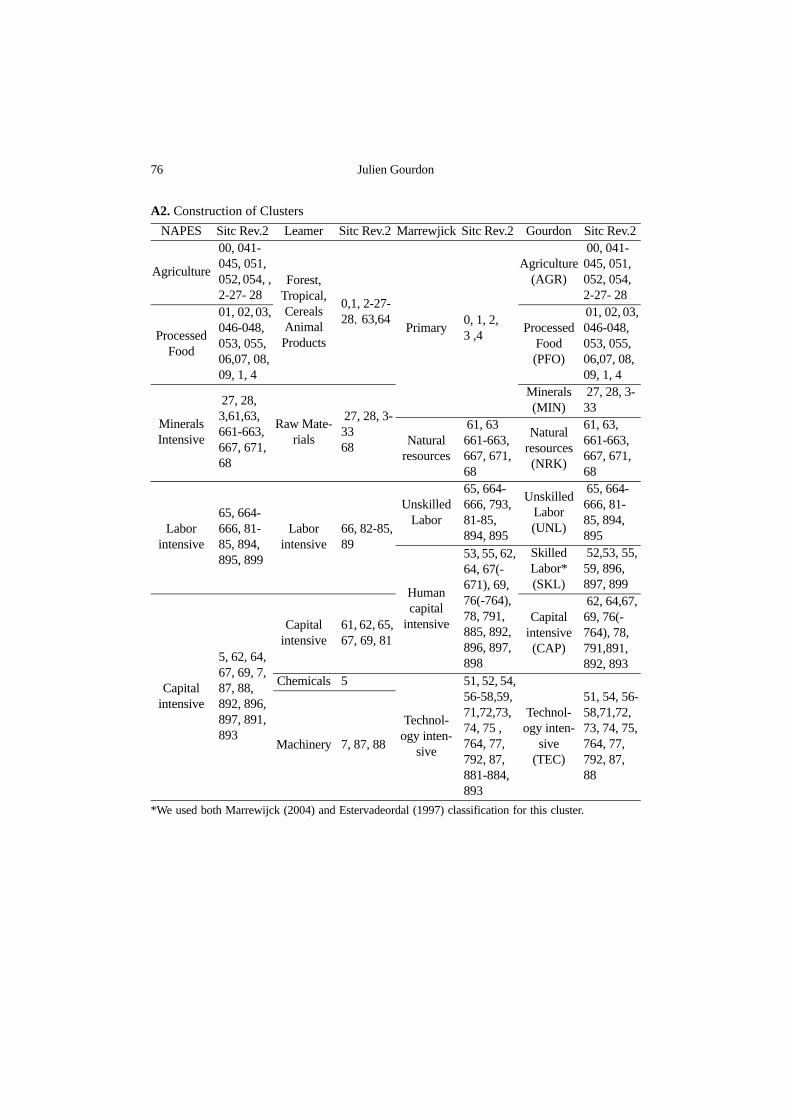
B. Construction and Measure for Commodities’ Clusters
Our classification (Table A2. in the Appendices) is less detailed than Leamer’swith regard to the categories of primary products for which the determinants ofcomparative advantage have often been estimated. We construct three clusters of
Sct α0 α1jEjct α2kNkct α3mTImct DRrt DYt µct+ + +m 1 2,=∑ +
m 1 3,=∑+
j 1 5,=∑+=
NXict β0 β1kNkct β2MTImct DYt εct if S 1=+ +m 1 5,=∑+
k 1 3,=∑+=
NXict β0 β1kNkct β2MTImct DYt εct if S 0=+ +m 1 5,=∑+
k 1 3,=∑+=
7Nevertheless we have run the second step including the factor endowments, the results for the factorsendowment variables are not often significant, though they have the expected sign when significant.
Explaining Trade Flows: Traditional and New Determinants of Trade Patterns 61
primary products, agricultural products (AGR), processed food products (PFO) andmineral products (MIN). We obtain five clusters for manufactured products:intensive in natural resources and capital (NRK), intensive in unskilled labor(UNL), intensive in skilled labor (SKL), intensive in capital (CAP), and intensivein technology (TEC). This level of detail is more precise compared to what theexisting literature offers, and should allow us to obtain better results than usingonly a two digit classification.
C. Construction and Measure for Factors Endowments
The H-O model framework considers relative factor endowments among manyfactors but also among many countries. It is more suitable to use a ratio of acountry’s per capita endowment of a factor to the world per capita endowment ofthat factor as we deal with relative advantage in factor endowments (Harrigan andZakrajsek, 2002). We use the formula constructed by Spilimbergo et al. (1999).8
The ratios are weighted by the degree of openness to take into account thatendowments of closed countries do not compete in the world markets with otherfactors.
To measure human capital endowment, we prefer to use an educational-basedclassification rather than an occupational-based one for the reasons exposed byHarrigan (1997). In contrast to Estervadeordal (1997) or Schott (2003) who usedonly the distinction between skilled and unskilled workers, we use, like Harrigan(1997) three sets of skills: unskilled, primary skilled, and highly skilled.
The well-known Ethier-Svensson-Gaisford (ESG) model with mobile (capital)and immobile (land and labor) factors shows that capital is a determinant of patternof trade for a country, depending on capital intensity of the goods in which itsimmobile factors give it a comparative advantage. Following Leamer (1999), weadopt the Kraay et al. (1999) measure of capital stock per worker.
The measure for natural resources endowment is arable land per inhabitant, soour measure does not include mineral and fuel resources which are not availablefor a large sample in the period under review.
8Eif is the endowment of country i in factor f and the measure of relative endowment is
and REif InEif( )E*f( )
-------------= Ef*
Eif popiX M+GDP---------------⎝ ⎠⎛ ⎞
i××
⎝ ⎠⎛ ⎞
i∑
popiX M+GDP---------------⎝ ⎠⎛ ⎞
i×⎝ ⎠
⎛ ⎞
i∑
----------------------------------------------------------------=
62 Julien Gourdon
D. Construction and Measure of “New” Determinants of Trade
Concerning differences in technology, we measure total factor productivity(TFP). This measure was used by Harrigan (1997) to explain how differences intechnology associated with factor endowments could help explain specialization inproduction. We construct a TFP index from our dataset as the residual of a growthregression (assuming increasing returns to scale9). We use a proxy of scaleeconomic effect that could lead the country to be specialized in some increasingreturns to scale sectors, measured by the number of habitants. We also control fordifferences in consumer’s preferences via income per inhabitant, since an increaseof per capita income should lead the consumer to prefer physical and humancapital intensive goods and hence to be a net importer of those products.
E. Construction and Measure of Trade Intensity Explanatory Variables
Variables that determine trade intensity can be separated in two groups:structural variables and political variables. The first set of variables representslanlockness of the country, the demand of its partners (proxied by the average rateof growth of main partners) and the size of its domestic market, which is measuredby population and GDP per inhabitant. Domestic transport infrastructure andtransaction costs determine the amount that a country exports or imports. For thosevariables, we use an index constructed as a principal component: road networks,rail networks, and paved road for the infrastructure index; and personal computer,internet host, telephone lines, and mobile phones for the ICT index. Finally,openness depends on the degree of outwardness of the country. We measure thisposition by an indicator carefully computed by Wacziarg and Welch (2003), whichis a dummy variable taking value 0 or 1 depending on liberalization.
IV. Results
The main objective of this study is to improve the prediction of patterns of trade.So we have to assess the reliability of the prediction of export/import status for
9We get the α and β from the following classical growth equation on our sample
where H= (1.1)yearsofschool which means that we relate
human capital (H) to average years of schooling fron Barro and Lee (2000) assuming a 10 percent returnto each year. We get α=0.5 and β=0.7. Then we calculate the TFP as TFP= (Y/L) / ((( K / L ).5) * ( H.7 ))
LnYL---⎝ ⎠⎛ ⎞ αLn
KL----⎝ ⎠⎛ ⎞ βLn
H L⋅L
------------ µi vt εi t,+ + + +=
Explaining Trade Flows: Traditional and New Determinants of Trade Patterns 63
each country. This is done in section IV.A. A substantial part of this study alsodeals with the importance of “new” determinants of comparative advantage. Insection IV.B, using an Anova estimate, we compare the importance of the “new”determinants of comparative advantage relative to the traditional factors andanalyze changes during two periods, 1960-1980 and 1980-2000. Subsequently, weinterpret the results of the Heckman estimation. In section IV.C, we present resultsfor the first step, the selection equation on comparative advantage, which is alsoestimated for the two periods noted earlier. The last section, IV.D, deals with thesecond step, the trade intensity, where we interpret the results on net exporters andnet importers of each cluster.10
A. Goodness of Fit
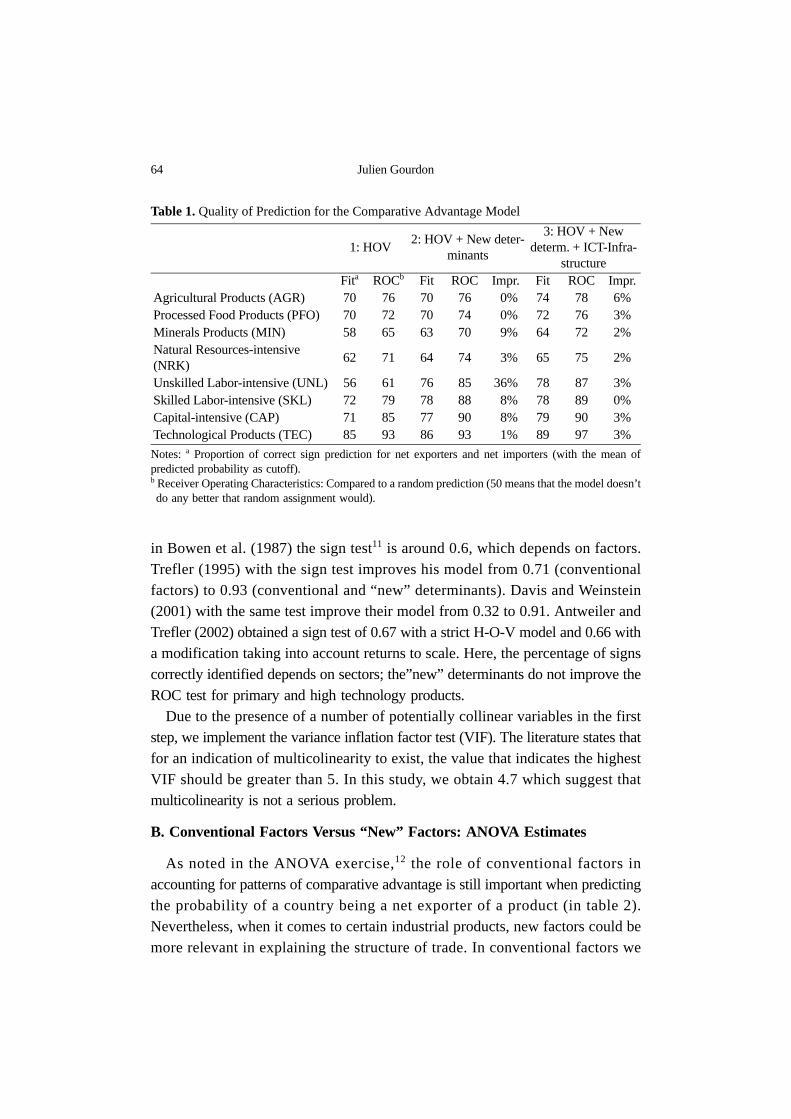
One way to assess whether the model is fit is to concentrate on its predictivepower by looking at prediction statistics. In the first part of table 1 we present thegoodness of fit for a model with only factor endowments. In the second part, weadd new factors - productivity differences, scale returns, and consumers’preferences - and in the last part we add ICT and infrastructure. For each part, thefirst column gives us the predictive success rate calculated with the sensitivity,percentage of positive sign (net exporter) correctly identified, and the specificity,percentage of negative sign (net importer) correctly identified. In the secondcolumn, we add a test which compares the predicted results to a randomassignment. For the second and third parts, the third column presents theimprovement in the goodness of fit (measured by the Fit test) compared to theprevious part. For example, for the capital intensive cluster (CAP), accounting fornew determinants improves the goodness of fit by 8%, and if we account fordifference in ICT and Infrastructure we improve the goodness of fit by 3%.
We conclude that adding “new” determinants for trade patterns helps us improvethe prediction of being a net exporter of manufactured products as well as mineralsproducts. Improvement due to the inclusion of ICT and infrastructure seems toconcern all clusters, and especially primary commodity cluster. As a comparison,
10Since we use generated variables (mills ratio, principal component index), we have to recalculate all thestandard errors of this variables; to do this, and to construct the confidence intervals, we employ thebootstrap technique. For a generated variable, the confidence interval in the second step is not correctas it refers to the first step. So we built a sampling distribution based on the initial sample from whichrepeated sample are drawn to obtain a correct distribution and correct standards errors
11Proportion of observations for which excess in factor endowments and excess in factor content in netexport have the same sign.
64 Julien Gourdon
in Bowen et al. (1987) the sign test11 is around 0.6, which depends on factors.Trefler (1995) with the sign test improves his model from 0.71 (conventionalfactors) to 0.93 (conventional and “new” determinants). Davis and Weinstein(2001) with the same test improve their model from 0.32 to 0.91. Antweiler andTrefler (2002) obtained a sign test of 0.67 with a strict H-O-V model and 0.66 witha modification taking into account returns to scale. Here, the percentage of signscorrectly identified depends on sectors; the”new” determinants do not improve theROC test for primary and high technology products.
Due to the presence of a number of potentially collinear variables in the firststep, we implement the variance inflation factor test (VIF). The literature states thatfor an indication of multicolinearity to exist, the value that indicates the highestVIF should be greater than 5. In this study, we obtain 4.7 which suggest thatmulticolinearity is not a serious problem.
B. Conventional Factors Versus “New” Factors: ANOVA Estimates
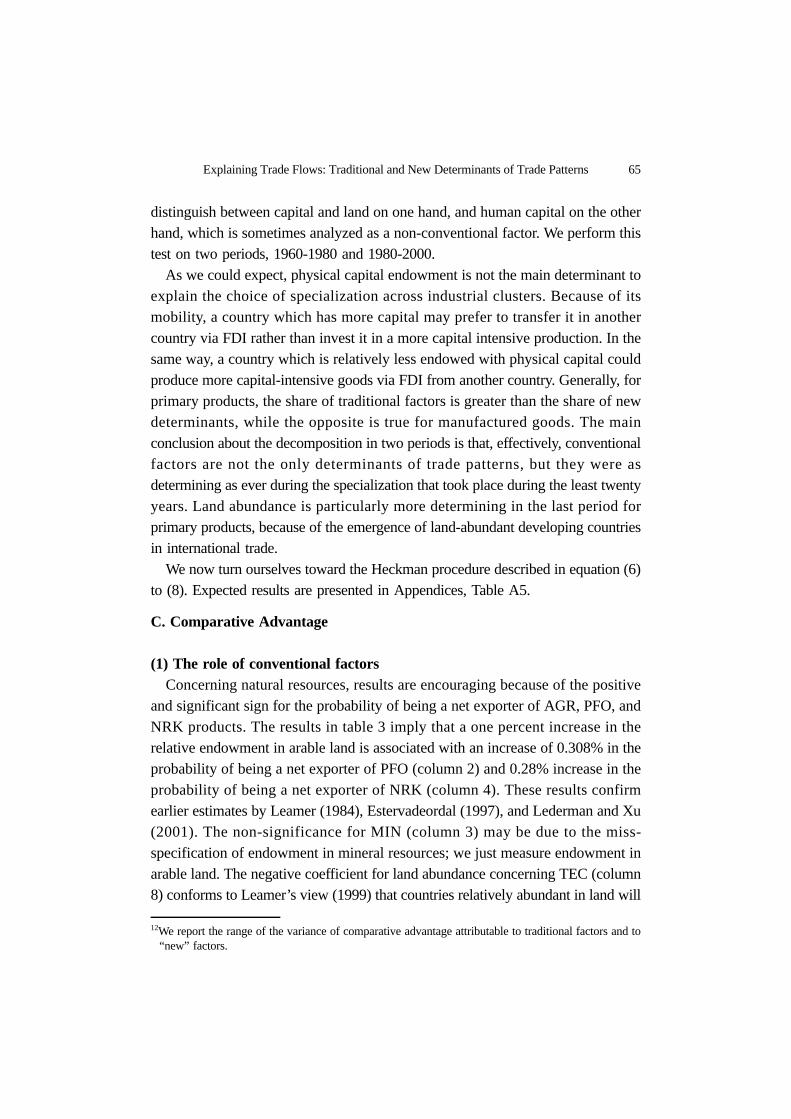
As noted in the ANOVA exercise,12 the role of conventional factors inaccounting for patterns of comparative advantage is still important when predictingthe probability of a country being a net exporter of a product (in table 2).Nevertheless, when it comes to certain industrial products, new factors could bemore relevant in explaining the structure of trade. In conventional factors we
Table 1. Quality of Prediction for the Comparative Advantage Model
1: HOV2: HOV + New deter-
minants
3: HOV + New determ. + ICT-Infra-
structureFita ROCb Fit ROC Impr. Fit ROC Impr.
Agricultural Products (AGR) 70 76 70 76 30% 74 78 6%Processed Food Products (PFO) 70 72 70 74 30% 72 76 3%Minerals Products (MIN) 58 65 63 70 39% 64 72 2%Natural Resources-intensive (NRK)
62 71 64 74 33% 65 75 2%
Unskilled Labor-intensive (UNL) 56 61 76 85 36% 78 87 3%Skilled Labor-intensive (SKL) 72 79 78 88 38% 78 89 0%Capital-intensive (CAP) 71 85 77 90 38% 79 90 3%Technological Products (TEC) 85 93 86 93 31% 89 97 3%
Notes: a Proportion of correct sign prediction for net exporters and net importers (with the mean ofpredicted probability as cutoff). b Receiver Operating Characteristics: Compared to a random prediction (50 means that the model doesn’tdo any better that random assignment would).
Explaining Trade Flows: Traditional and New Determinants of Trade Patterns 65
distinguish between capital and land on one hand, and human capital on the otherhand, which is sometimes analyzed as a non-conventional factor. We perform thistest on two periods, 1960-1980 and 1980-2000.
As we could expect, physical capital endowment is not the main determinant toexplain the choice of specialization across industrial clusters. Because of itsmobility, a country which has more capital may prefer to transfer it in anothercountry via FDI rather than invest it in a more capital intensive production. In thesame way, a country which is relatively less endowed with physical capital couldproduce more capital-intensive goods via FDI from another country. Generally, forprimary products, the share of traditional factors is greater than the share of newdeterminants, while the opposite is true for manufactured goods. The mainconclusion about the decomposition in two periods is that, effectively, conventionalfactors are not the only determinants of trade patterns, but they were asdetermining as ever during the specialization that took place during the least twentyyears. Land abundance is particularly more determining in the last period forprimary products, because of the emergence of land-abundant developing countriesin international trade.
We now turn ourselves toward the Heckman procedure described in equation (6)to (8). Expected results are presented in Appendices, Table A5.
C. Comparative Advantage
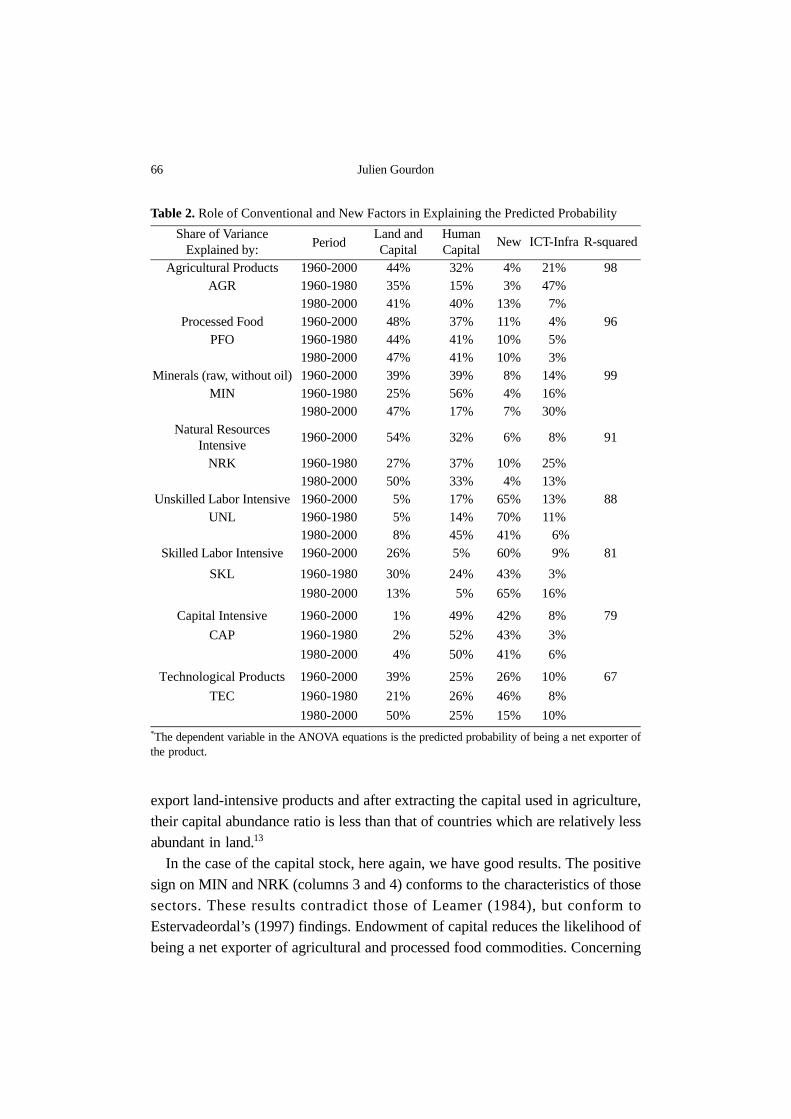
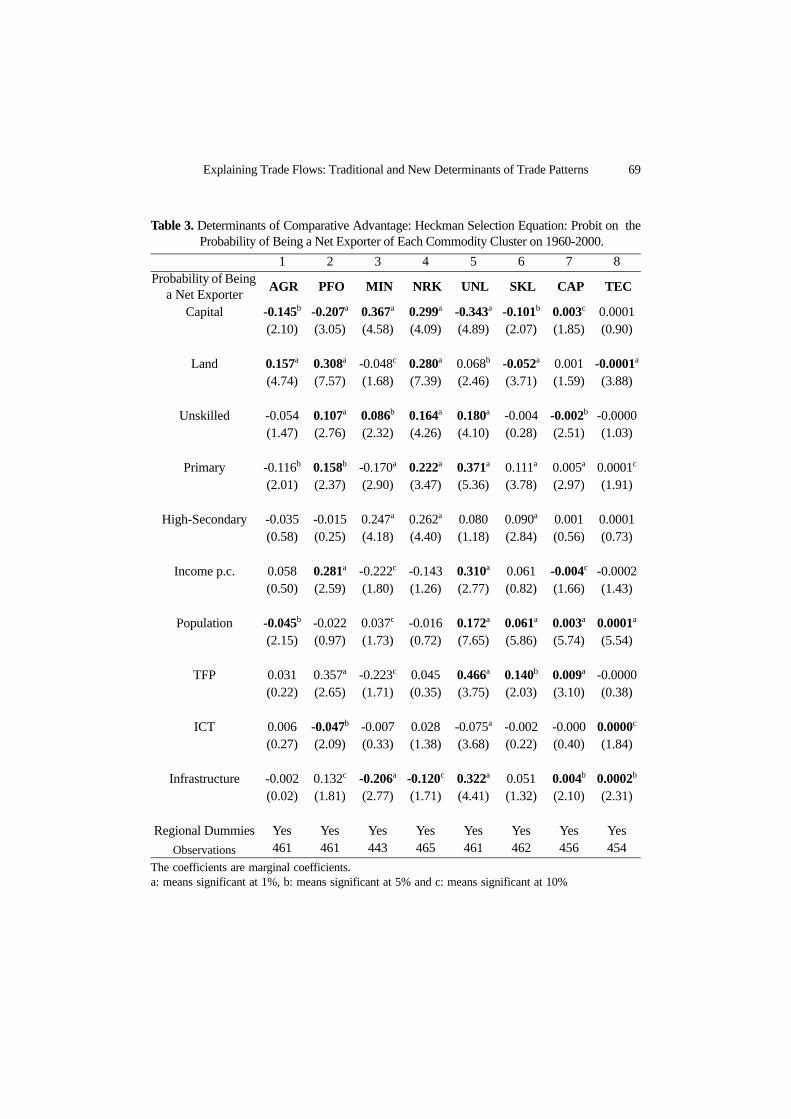
(1) The role of conventional factors Concerning natural resources, results are encouraging because of the positive
and significant sign for the probability of being a net exporter of AGR, PFO, andNRK products. The results in table 3 imply that a one percent increase in therelative endowment in arable land is associated with an increase of 0.308% in theprobability of being a net exporter of PFO (column 2) and 0.28% increase in theprobability of being a net exporter of NRK (column 4). These results confirmearlier estimates by Leamer (1984), Estervadeordal (1997), and Lederman and Xu(2001). The non-significance for MIN (column 3) may be due to the miss-specification of endowment in mineral resources; we just measure endowment inarable land. The negative coefficient for land abundance concerning TEC (column8) conforms to Leamer’s view (1999) that countries relatively abundant in land will
12We report the range of the variance of comparative advantage attributable to traditional factors and to“new” factors.
66 Julien Gourdon
export land-intensive products and after extracting the capital used in agriculture,their capital abundance ratio is less than that of countries which are relatively lessabundant in land.13
In the case of the capital stock, here again, we have good results. The positivesign on MIN and NRK (columns 3 and 4) conforms to the characteristics of thosesectors. These results contradict those of Leamer (1984), but conform toEstervadeordal’s (1997) findings. Endowment of capital reduces the likelihood ofbeing a net exporter of agricultural and processed food commodities. Concerning
Table 2. Role of Conventional and New Factors in Explaining the Predicted Probability
Share of VarianceExplained by: Period
Land and Capital
Human Capital
New ICT-Infra R-squared
Agricultural Products 1960-2000 44% 32% 34% 21% 98AGR 1960-1980 35% 15% 33% 47%
1980-2000 41% 40% 13% 37%Processed Food 1960-2000 48% 37% 11% 34% 96
PFO 1960-1980 44% 41% 10% 35%1980-2000 47% 41% 10% 33%
Minerals (raw, without oil) 1960-2000 39% 39% 38% 14% 99MIN 1960-1980 25% 56% 34% 16%
1980-2000 47% 17% 37% 30%Natural Resources
Intensive1960-2000 54% 32% 36% 38% 91
NRK 1960-1980 27% 37% 10% 25%1980-2000 50% 33% 34% 13%
Unskilled Labor Intensive 1960-2000 35% 17% 65% 13% 88UNL 1960-1980 35% 14% 70% 11%
1980-2000 38% 45% 41% 336%Skilled Labor Intensive 1960-2000 26% 5% 60% 339% 81
SKL 1960-1980 30% 24% 43% 33%
1980-2000 13% 35% 65% 16%
Capital Intensive 1960-2000 31% 49% 42% 38% 79
CAP 1960-1980 32% 52% 43% 33%
1980-2000 34% 50% 41% 36%
Technological Products 1960-2000 39% 25% 26% 10% 67
TEC 1960-1980 21% 26% 46% 8%
1980-2000 50% 25% 15% 10%*The dependent variable in the ANOVA equations is the predicted probability of being a net exporter ofthe product.
Explaining Trade Flows: Traditional and New Determinants of Trade Patterns 67
manufactured commodities, there is no evidence yet of a significant impact ofcapital endowment on labor- and capital-intensive goods.14 In this study, bydiscerning more clusters, we find a negative impact on UNL (column 5) and SKL(column 6) and a positive, but weak, impact on CAP (column 7).
Previous studies did not obtain good results on the human capital component.Estervadeordal (1997) found that skilled labor was significantly positive as was thecase with labor-intensive and capital-intensive goods; Lederman and Xu (2001)found that it was significantly negative for all manufactured goods. Bydistinguishing three sets of skills, we obtain relatively better results, and the resultsroughly conform to expectations. An increase in the share of non-educated labor orprimary educated labor increases the probability of being a net exporter of UNL-intensive products. We observe that the increase in this probability is greater for a1% increase in the share of primary educated labor (+0.37%) than for a 1%increase in the share of non-educated (+0.18%), which means that the UNL-intensive sector needs more primary educated labor than non-educated labor.
The coefficients appearing in table 3 are marginal effects calculated for the meanvalue of the variable. However, we assumed a non-linear relationship, i.e. theimpact of an increase in capital per labor differs according to the value of thevariable. In the Appendices, we show graphs (Graphs A6.) for several clusterspresenting the relationship between the rise in factor endowments and theprobability of becoming a net exporter. We can observe that increasing theendowment in a factor has no impact until a sufficient level of the endowment hasbeen reached; in addition, the impact is strong until such a point where additionalendowment does not play a role anymore in the probability of becoming netexporter.
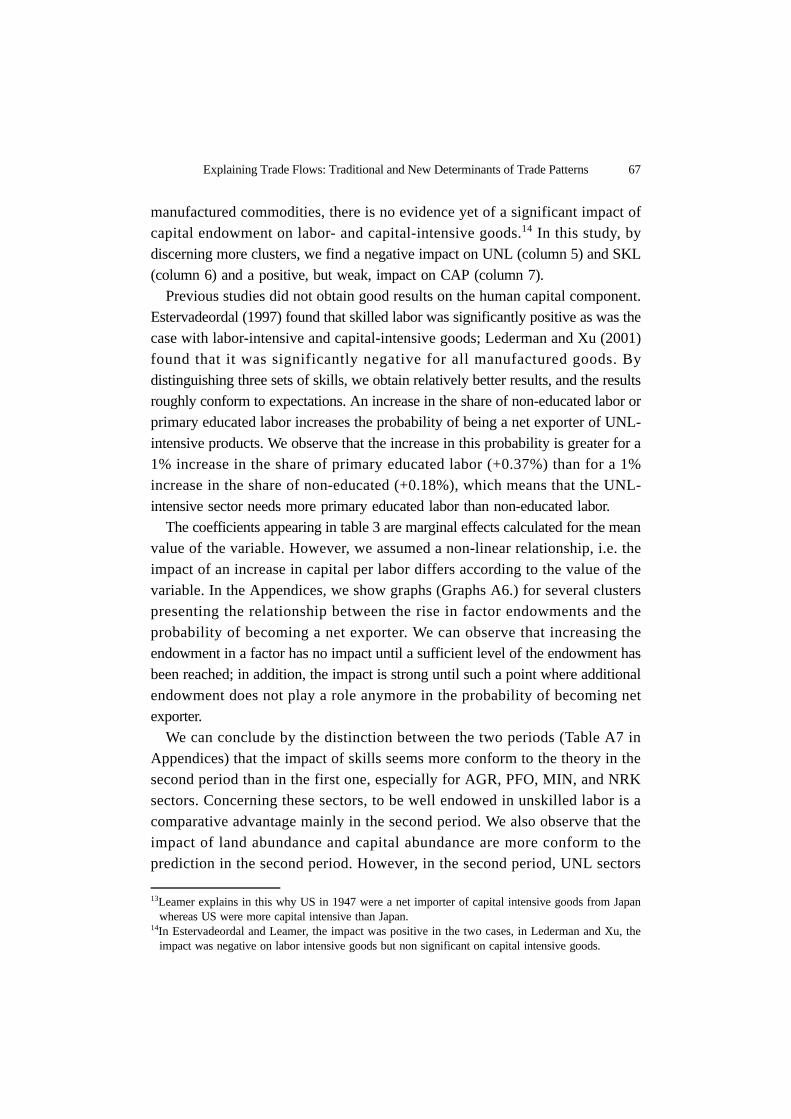
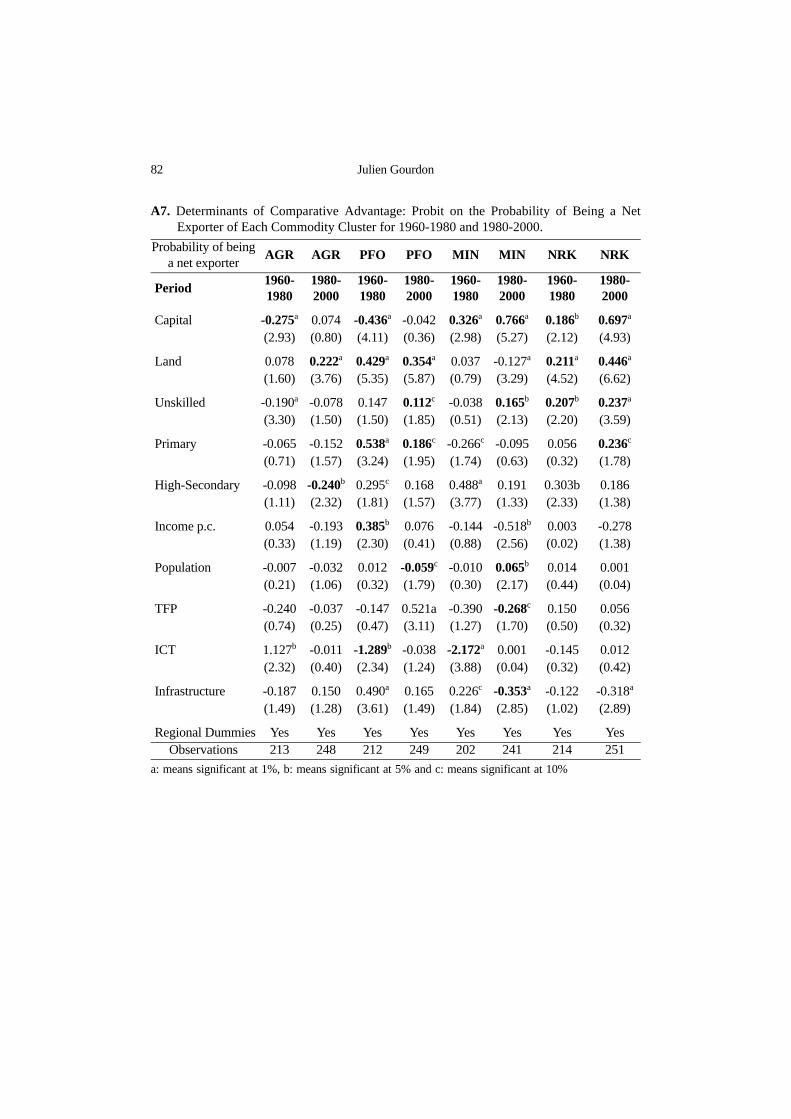
We can conclude by the distinction between the two periods (Table A7 inAppendices) that the impact of skills seems more conform to the theory in thesecond period than in the first one, especially for AGR, PFO, MIN, and NRKsectors. Concerning these sectors, to be well endowed in unskilled labor is acomparative advantage mainly in the second period. We also observe that theimpact of land abundance and capital abundance are more conform to theprediction in the second period. However, in the second period, UNL sectors
13Leamer explains in this why US in 1947 were a net importer of capital intensive goods from Japanwhereas US were more capital intensive than Japan.
14In Estervadeordal and Leamer, the impact was positive in the two cases, in Lederman and Xu, theimpact was negative on labor intensive goods but non significant on capital intensive goods.
68 Julien Gourdon
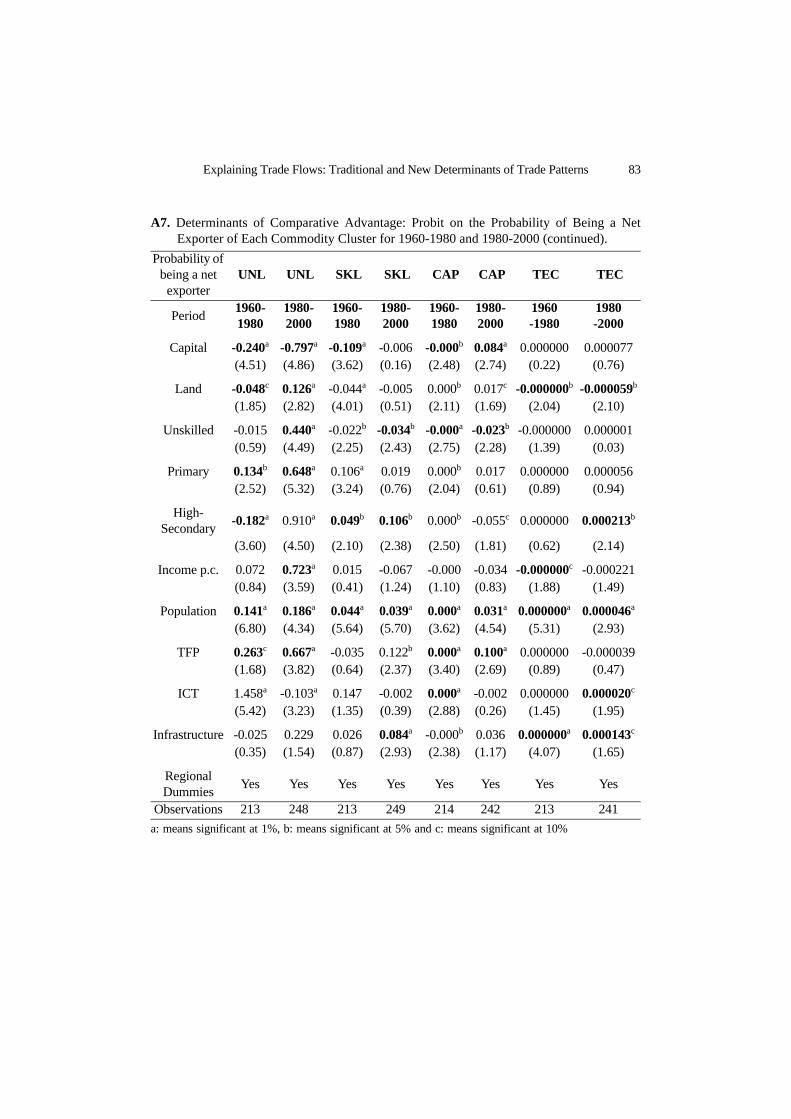
seem more sensitive to skilled labor than in the previous period. As expectedthe endowment in skilled labor is more important in the second period for SKLand TEC sectors. Regarding capital per labor, its impact is more important andconforms to expectations in the second period for all manufactured products(NRK, UNL, CAP and TEC) as well as for MIN sectors, although it ceases tohave an impact on primary sectors (AGR and PFO). Finally, results concerningarable land per labor show an increasing and expected impact in the secondperiod for AGR, PFO, and NRK sectors. However, the results on manufacturedproducts are very mixed and do not conform to expectations except for theTEC sector.
(2) The Role of “New” DeterminantsWe saw that “new” determinants are determining, especially concerning
manufactured products. Among these factors, we assume that because of thepresence of “population” which captures scale effects, the log of income percapita captures demand effects. The sign for demand effects should be negativefor superior goods. Effectively, increasing income per capita tends to increasethe probability of being a net exporter in inferior goods PFO and UNL (column2 and 5) and a net importer in superior goods CAP or MIN (column 3 and 7).The scale effects should be positive for products with increasing returns toscale, in industry and especially high technology industry. The results tend toconfirm that prediction since the size of the population is significantly positivefor all industrial products (UNL, SKL, CAP and TEC). The measure of factorproductivity seems to be more important in the second period (Table A5. inAppendices), and leads countries to be net exporters of manufactured goods orPFO (column 2).
(3) Infrastructure and ICTGenerally, an improvement in infrastructure and ICT leads countries to be
net exporters of manufactured products and net importers of primary products.Results confirm that theory for infrastructure, whereas results for ICT and notsignificant. They not very important in our model, however, so we couldassume that they mainly play a role in trade intensity, but are not verydetermining in terms of trade structure. Nevertheless, the distinction in twoperiods (Table A6. in Appendices) shows us that ICT and infrastructureimprovements tend to increase the chance for a country to develop a
Explaining Trade Flows: Traditional and New Determinants of Trade Patterns 69
Table 3. Determinants of Comparative Advantage: Heckman Selection Equation: Probit on theProbability of Being a Net Exporter of Each Commodity Cluster on 1960-2000.
1 2 3 4 5 6 7 8Probability of Being
a Net Exporter AGR PFO MIN NRK UNL SKL CAP TEC
Capital -0.145b -0.207a 0.367a 0.299a -0.343a -0.101b 0.003c 0.0001(2.10) (3.05) (4.58) (4.09) (4.89) (2.07) (1.85) (0.90)
Land 0.157a 0.308a -0.048c 0.280a 0.068b -0.052a 0.001 -0.0001a
(4.74) (7.57) (1.68) (7.39) (2.46) (3.71) (1.59) (3.88)
Unskilled -0.054 0.107a 0.086b 0.164a 0.180a -0.004 -0.002b -0.0000(1.47) (2.76) (2.32) (4.26) (4.10) (0.28) (2.51) (1.03)
Primary -0.116b 0.158b -0.170a 0.222a 0.371a 0.111a 0.005a 0.0001c
(2.01) (2.37) (2.90) (3.47) (5.36) (3.78) (2.97) (1.91)
High-Secondary -0.035 -0.015 0.247a 0.262a 0.080 0.090a 0.001 0.0001(0.58) (0.25) (4.18) (4.40) (1.18) (2.84) (0.56) (0.73)
Income p.c. 0.058 0.281a -0.222c -0.143 0.310a 0.061 -0.004c -0.0002(0.50) (2.59) (1.80) (1.26) (2.77) (0.82) (1.66) (1.43)
Population -0.045b -0.022 0.037c -0.016 0.172a 0.061a 0.003a 0.0001a
(2.15) (0.97) (1.73) (0.72) (7.65) (5.86) (5.74) (5.54)
TFP 0.031 0.357a -0.223c 0.045 0.466a 0.140b 0.009a -0.0000(0.22) (2.65) (1.71) (0.35) (3.75) (2.03) (3.10) (0.38)
ICT 0.006 -0.047b -0.007 0.028 -0.075a -0.002 -0.000 0.0000c
(0.27) (2.09) (0.33) (1.38) (3.68) (0.22) (0.40) (1.84)
Infrastructure -0.002 0.132c -0.206a -0.120c 0.322a 0.051 0.004b 0.0002b
(0.02) (1.81) (2.77) (1.71) (4.41) (1.32) (2.10) (2.31)
Regional Dummies Yes Yes Yes Yes Yes Yes Yes Yes
Observations 461 461 443 465 461 462 456 454
The coefficients are marginal coefficients.a: means significant at 1%, b: means significant at 5% and c: means significant at 10%
70 Julien Gourdon
comparative advantage in manufacture industry. An interesting result is that aone percent increase in the infrastructure index increases the probability ofbeing net exporter of UNL by 0.32, which is almost as important as a onepercent increase in primary educated labor.
D. Intensity of Trade
Among the structural variables, the size of the country, measured bypopulation, presents strongly significant results in reducing net exports for netexporters (table 4) and net imports for net importers (table 5). Here, populationdoes not capture scale effects but only the country’s size. In fact, having a largedomestic market size reduces trade flows. The results concerning the impact ofincome per capita on consumer preferences are not clear although it is generallyexpected that consumers prefer higher quality goods as their income increases. Itseems that, like population, income per capita captures a market size effectwhich decreases both net exports for net exporters and net imports for netimporters. In the previous section, we have shown that differences in technologycould explain trade specialization; as noted earlier differences in productivitymight affect trade patterns by affecting trade intensity since an improvement inthe productivity leads net exporting as well as net importing countries, toincrease their net exports in manufactured products. Trade flows are significantlydetermined by transport costs (infrastructure) and seem less sensitive totransaction cost (ICT). Infrastructure is really important determinants for capitaland technology intensive product.
Concerning the trade policy measure, the results are interesting. The trade policyvariable increases net exports for net exporters and net imports for net importers.The results are quite different among clusters. For net exporters, the results suggestthat protection favors skilled and unskilled intensive goods and agricultural goods,possibly at the expense of most sophisticated manufactured goods. It seems that fornet importers (Table 5), protection tends to favor capital-intensive andtechnological-intensive products, but also agricultural and processed food goods.The coefficients in table 4 and 5 indicate that even if trade liberalization stimulatedexport growth, it raised import growth by more, as in Santos Paulino and Thirwall(2004).
The Mills’ inverse ratio, which estimates the correlation between the error fromcomparative advantage equation and the error from trade intensity equations, issometimes significant. This suggests that part of trade intensity not explained by

Explaining Trade Flows: Traditional and New Determinants of Trade Patterns 71
the explanatory variables is significantly correlated with unexplained comparativeadvantage, and that explanatory variables in the second step (trade intensity) arecorrelated with unobserved variables in the first step (comparative advantage). So,by correcting for that correlation, we have avoided a bias in the estimation ofparameters in the second step.
V. Conclusions
Using a non-linear estimation, we have attempted to improve the commodityversion of the H-O model by adding “new” determinants - trade impediments, anddifferences in technology, consumers’ preferences, and returns to scale - developed
Table 4. Trade Intensity: Heckman’s Second Equation: OLS on Net Exports for Net Exporters
1 2 3 4 5 6 7 8
AGR PFO MIN NRK UNL SKL CAP TEC
Income p.c. -0.054 -0.073a 0.054b -0.214a -0.155a -0.001 -0.131a -0.160c
(1.50) (2.62) (2.47) (2.75) (4.01) (0.09) (2.94) (1.83)Population -0.054a -0.044a -0.013a -0.073a -0.025b -0.006 -0.045a -0.014
(7.04) (5.32) (4.01) (4.03) (2.53) (1.48) (5.07) (0.62)TFP 0.011 -0.012 0.007 0.057a 0.004 -0.004 0.004 0.007
(0.80) (1.59) (1.06) (2.93) (0.51) (1.40) (0.61) (0.70)Partner Growth 0.087 0.256a -0.288a 0.258 -0.090 0.010 -0.077 0.317c
(0.67) (2.87) (3.03) (1.17) (0.87) (0.25) (0.76) (1.72)Landlockness -0.179a 0.025 0.167b 0.131b -0.095a -0.012 -0.223a 0.180a
(4.30) (0.58) (2.43) (2.23) (3.45) (1.02) (7.32) (2.71)Infrastructure -0.035 0.070a -0.052a 0.072 0.060b -0.011 0.154a 0.281a
(1.16) (3.34) (3.53) (1.50) (2.45) (0.91) (3.65) (2.79)ICT -0.006 -0.010 -0.003 0.011 0.024a 0.008c 0.001 0.012
(0.82) (1.44) (0.85) (1.15) (2.64) (1.82) (0.21) (1.26)Index WW 0.034c 0.001 0.044b -0.078 0.052b 0.017c -0.022 -0.110
(1.90) (0.02) (2.19) (1.25) (2.42) (1.87) (0.62) (1.45)Mills Ratio -0.083a -0.037c -0.031c -0.309a -0.046b -0.003 0.076a 0.121
(2.71) (1.80) (1.71) (3.50) (2.49) (0.19) (3.17) (1.29)Constant 8.321a 7.740a 7.509a 9.786a 9.004a 7.038a 8.987a 7.510a
(19.21) (24.77) (30.21) (11.84) (16.74) (49.74) (16.29) (9.49)Observations 262 234 199 180 151 89 78 62
R-squared 0.34 0.25 0.31 0.42 0.23 0.17 0.51 0.43
a: means significant at 1%, b: means significant at 5% and c: means significant at 10%
Ln cX M–PIB
--------------+⎝ ⎠⎛ ⎞

72 Julien Gourdon
in the factor content literature as well as determinants of trade structure and tradeintensity. Compared to the previous studies, our analysis employed a more detailedcluster classification, leading to more clusters for manufactured products. Thefollowing eight clusters were used: agriculture (AGR), processed food (PFO),minerals (MIN), natural resources based- manufactures (NRK), unskilled labor-intensive (UNL), skilled labor-intensive (SKL), capital-intensive (CAP) andtechnology-intensive (TEC). Furthermore, to ensure a better assessment of thespecialization according to human capital, we distinguished among three sets ofskills: unskilled, primary skilled, and highly skilled.
We implemented the Heckman procedure, where in the first step we estimatedthe probability of being a net exporter for each eight product clusters (what we callthe comparative advantage equation). As explanatory variables in this step, we
Table 5. Trade Intensity: Heckman’s Second Equation: OLS on Net Imports for Net Importers
1 2 3 4 5 6 7 8
AGR PFO MIN NRK UNL SKL CAP TEC
Income p.c. 0.054a 0.007 0.006 -0.000 0.030b 0.032a 0.076a 0.111a
(3.21) (0.44) (1.51) (0.07) (2.36) (5.97) (4.87) (5.07)Population 0.013a 0.016a -0.002b 0.005a 0.020a 0.017a 0.048a 0.043a
(4.47) (4.86) (2.43) (5.83) (6.44) (10.34) (12.81) (9.17)TFP -0.005 0.012a -0.004a 0.003a 0.002 0.001 0.009c 0.007
(1.14) (4.06) (2.61) (3.04) (0.64) (0.81) (1.94) (1.46)Partner Growth 0.068 0.026 0.010 0.006 -0.149a 0.009 -0.036 0.060
(1.13) (0.55) (0.54) (0.41) (3.31) (0.51) (0.55) (0.85)Landlockness 0.034b 0.021b -0.001 -0.001 0.026a 0.011c 0.028c 0.034
(2.28) (2.05) (0.17) (0.12) (3.53) (1.72) (1.83) (1.32)Infrastructure -0.010 0.008 -0.010a 0.001 -0.016c -0.011a -0.029b -0.043a
(0.90) (0.73) (3.26) (0.29) (1.71) (2.81) (2.34) (2.72)ICT 0.005b 0.002 0.003b 0.000 -0.000 -0.007a 0.001 -0.007
(1.98) (0.60) (2.40) (0.28) (0.25) (4.50) (0.10) (1.05)Index WW -0.024c -0.033b -0.006c -0.009b -0.002 -0.010b -0.082a -0.056a
(1.93) (2.52) (1.86) (2.58) (0.25) (2.48) (5.93) (3.54)Mills Ratio 0.043a 0.065a -0.008 0.010a 0.028a 0.004 0.086a 0.154a
(4.49) (5.52) (1.50) (3.42) (3.75) (0.37) (3.39) (4.79)Constant 5.966a 6.467a 6.869a 6.817a 6.666a 6.330a 5.446a 4.909a
(27.11) (50.26) (138.19) (177.41) (74.92) (117.89) (28.88) (20.26)Observations 196 226 240 281 306 369 374 388
R-squared 0.31 0.35 0.20 0.24 0.34 0.47 0.45 0.35
a: means significant at 1%, b: means significant at 5% and c: means significant at 10%
Ln cX M–PIB
--------------+⎝ ⎠⎛ ⎞

Explaining Trade Flows: Traditional and New Determinants of Trade Patterns 73
included factor endowments and the new determinants which may affectspecialization. In the second step, on the other hand, we estimated the tradeintensity of net exports for each cluster, depending on new determinants as well ason trade policy. This procedure helped us control for the correlation between theunobserved variables which explain trade specialization and the explanatoryvariables of trade intensity.
Our major findings are as follows. First, we find that conventional factors arestill important in determining trade structure, arguably because we have a bettermeasure of factor endowment (e.g the factor endowment of a country isweighted by the mean factor endowment of the world) and a better clusterclassification. Second, we find that new determinants (e.g. difference inproductivity, consumers’ preferences, and scale returns) need to be included todetermine comparative advantage, especially for the manufactured products.Controlling for factor endowments, a better technology or scale economiesenhance comparative advantage for manufactured products. Moreover, anincrease in mean income leads consumers to prefer high-quality goods (capital-intensive products or mineral-intensive products) relative to low-quality goods(low skilled labor-intensive products and processed food), which changes the netexports structure. An improvement in information and communicationtechnology or infrastructure also helps a country to reduce dependence onprimary products.
Furthermore, turning to the change across periods, the results indicate thatdifferences in factor endowments have not diminished over time: we observe anincrease in specialization according to skill endowment. Hence, differences inproductivity, in returns to scale or in consumers’ preferences are not new forcesthat drive trade flows, they were also important before 1980. This is an importantconclusion since no study has investigated this aspect before.
Estimation of trade intensity also yields plausible results. First, country sizematters as expected, as trade intensity decreases with population. Second, areduction in our proxy for trade barriers, increases trade intensity for both netexporter and for net importer clusters. However, its effects are not uniform amongsectors. Third, a reduction in barriers to trade increases trade intensity, with astronger effect for infrastructure-related costs than for transaction-related costs.Finally, for manufactured clusters, increases in TFP raises net exports and reducesnet imports for manufactured products. As for the overall two-step procedure, thestatistical test (Mills ratio) accepts the two-step procedure.
74 Julien Gourdon
In sum, the specialization according to factor endowments is always relevant,although “new” determinants of trade patterns are necessary to explainspecialization and trade intensity.
Acknowledgements
The author thanks Jaime de Melo, Marcelo Olarreaga and Lionel Fontagne forhelpful comments on earlier drafts.
Received 11 June 2007, Revised 22 September 2008, Accepted 7 October 2008

Explaining Trade Flows: Traditional and New Determinants of Trade Patterns 75
Appendices
A1. List of Countries Included in the Sample 1970-2000
Countries observations
Latin A
merica
Argentina 8Bolivia 8Brazil 8Chile 8Colombia 8Costa Rica 7Dominican Republic 5Ecuador 8El Salvador 8Guatemala 7Honduras 8Jamaica 7Mexico 8Nicaragua 7Panama 8Paraguay 8Peru 8Trinidad and Tobago 6Uruguay 6Venezuela, RB 8
Total 20 149D
eveloped Countries
Australia 7Austria 7
Belgium 1Canada 7Cyprus 5
Denmark 6Finland 7France 8Greece 8Ireland 8Italy 8Japan 8
Netherlands 7New Zealand 5
Norway 7Portugal 8
Spain 8
Sweden 8Switzerland 8
United Kingdom 8United States 8
Total 21 147A
frica and Middle E
astCountries observations
Algeria 6Egypt, Arab Rep. 5Ghana 7Iran, Islamic Rep. 3Israel 8Jordan 7Kenya 5Mali 7Mauritius 6Rwanda 1Senegal 8Sierra Leone 4South Africa 4Tanzania 2Tunisia 8Turkey 7Uganda 2Zambia 4Zimbabwe 4
Total 19 98
Asia
Bangladesh 5
China 4
India 8
Indonesia 7
Korea, Rep. 8
Malaysia 7
Pakistan 6
Philippines 8
Singapore 8
Sri Lanka 8
Thailand 8
Total 11 77
76 Julien Gourdon
A2. Construction of Clusters
NAPES Sitc Rev.2 Leamer Sitc Rev.2 Marrewjick Sitc Rev.2 Gourdon Sitc Rev.2
Agriculture
00, 041-045, 051, 052, 054, , 2-27- 28
Forest, Tropical, Cereals Animal Products
0,1, 2-27- 28, 63,64
Primary0, 1, 2, 3 ,4
Agriculture(AGR)
00, 041-045, 051, 052, 054, 2-27- 28
Processed Food
01, 02, 03, 046-048, 053, 055, 06,07, 08, 09, 1, 4
Processed Food(PFO)
01, 02, 03, 046-048, 053, 055, 06,07, 08, 09, 1, 4
Minerals Intensive
27, 28, 3,61,63, 661-663, 667, 671, 68
Raw Mate-rials
27, 28, 3-3368
Minerals(MIN)
27, 28, 3-33
Natural resources
61, 63 661-663, 667, 671, 68
Natural resources(NRK)
61, 63, 661-663, 667, 671, 68
Labor intensive
65, 664-666, 81-85, 894, 895, 899
Labor intensive
66, 82-85, 89
Unskilled Labor
65, 664-666, 793, 81-85, 894, 895
Unskilled Labor (UNL)
65, 664-666, 81-85, 894, 895
Human capital
intensive
53, 55, 62, 64, 67(-671), 69, 76(-764), 78, 791, 885, 892, 896, 897, 898
Skilled Labor*(SKL)
52,53, 55, 59, 896, 897, 899
Capital intensive
5, 62, 64, 67, 69, 7, 87, 88, 892, 896, 897, 891, 893
Capital intensive
61, 62, 65, 67, 69, 81
Capital intensive(CAP)
62, 64,67, 69, 76(-764), 78, 791,891, 892, 893
Chemicals 5
Technol-ogy inten-
sive
51, 52, 54, 56-58,59, 71,72,73, 74, 75 , 764, 77, 792, 87, 881-884, 893
Technol-ogy inten-
sive(TEC)
51, 54, 56-58,71,72,73, 74, 75, 764, 77, 792, 87, 88
Machinery 7, 87, 88
*We used both Marrewijck (2004) and Estervadeordal (1997) classification for this cluster.
Explaining Trade Flows: Traditional and New Determinants of Trade Patterns 77
A3. Label and Sources of Variables
Label Content SourcesPopulation Total Population WDI (2004)
Income pc GDP per capita in power parity purchase (PPP)Pen WorldTables (2005)
Capital Capital per WorkerEasterly and Lev-ine (1999) & Kraay and al. (2000)
Land Land arable per labor force WDI (2004)
UnskilledProportion of the population over 15 years (non edu-cated (or primary not completed)
Barro and Lee (2000)
PrimaryProportion of the population over 15 years primary educated (completed) (or secondary not completed)
Barro and Lee (2000)
High-SecondaryProportion of the population over 15 years High edu-cated
Barro and Lee (2000)
TFPThe TFP is calculated un logs as the difference between output and factor use: log TFP = logY - alog L - blog K, with a+b >1
Calculate by author from the dataset
ICTprincipal component analysis on road networks, rail networks, and paved road
Calderon and Ser-ven (2004)
Infrastructureprincipal component analysis on personal computer, internet host, telephone lines, and mobile phones
Calderon and Ser-ven (2004)
Index WW Index taking value 0 or 1 depending on liberalizationWacziarg & Welch (2003)
Landlockness Index taking value 0 or 1 depending on landlockness CEPII (2005)Growth of Partners Rate of GDP growth of weighed trade partners CEPII (2005)
78 Julien Gourdon
A4. Variance of Variables
Between WithinBetween/
WithinNet Exports
Agriculture (AGR) 0,21 0,06 3,48Pr. Food (PFO) 0,15 0,04 3,43Minerals (MIN) 0,10 0,03 3,91Nat. Resources (NRK) 0,14 0,02 5,53Unskilled Labor (UNL) 0,11 0,04 2,64Skilled Labor (SKL) 0,05 0,02 2,41Capital (CAP) 0,17 0,05 3,38Technology (TEC) 0,21 0,08 2,55
Predicted ProbabilityAgriculture (AGR) 0,27 0,04 6,81Pr. Food (PFO) 0,27 0,06 4,23Minerals (MIN) 0,25 0,09 2,82Nat. Resources (NRK) 0,31 0,07 4,46Unskilled Labor (UNL) 0,31 0,10 3,13Skilled Labor (SKL) 0,26 0,05 5,18Capital (CAP) 0,26 0,05 4,98Technology (TEC) 0,29 0,04 7,39
Explanatory Variables
New DeterminantsIncome p.c. 0,94 0,18 5,08Population 1,47 0,15 10,06TFP 0,26 0,15 1,72Growth Partners 0,05 0,08 0,56Infrastructure 1,31 0,22 5,89ICT 0,88 0,72 1,23
Factor’s Endowments
Land 1,14 0,11 10,67Capital 1,32 0,21 6,37Unskilled 1,38 0,24 5,76Primary 0,52 0,18 2,88Highly & Secondary 0,78 0,23 3,34
Explaining Trade Flows: Traditional and New Determinants of Trade Patterns 79
A5. Expected Results
1 2 3 4 5 6 7 8Probability of Being a Net Exporter
AGR PFO MIN NRK UNL SKL CAP TEC
Capital - - + + - - + +Land + + + - - - -Unskilled + + + + + - -Primary + + + + + +High-Secondary - - - - - + + +Income p.c. + + - + - - -Population - - - + + + + +TFP - - - + + + + +ICT + + + +Infrastructure + + + +
Cluster of Net Exporters
1 2 3 4 5 6 7 8
AGR PFO MIN NRK UNL SKL CAP TEC
Income p.c. - - - - - - - -Population - - - - - - - -
TFPPartner GrowthLandlockness - - - - - - - -Infrastructure + + + + + + + +
ICT + + + + + + + +Openness + + + + + + + +
Cluster of Net Importers
1 2 3 4 5 6 7 8
AGR PFO MIN NRK UNL SKL CAP TEC
Income p.c. + + + + + + + +Population + + + + + + + +
TFPPartner GrowthLandlockness + + + + + + + +Infrastructure - - - - - - - -
ICT - - - - - - - -Openness - - - - - - - -
Ln cX M–PIB
--------------+⎝ ⎠⎛ ⎞
Ln cX M–PIB
--------------+⎝ ⎠⎛ ⎞

80 Julien GourdonA
6. G
raph
s N
on-l
inea
rity
Bet
wee
n Fa
ctor
End
owm
ents
and
Pro
babi
lity
of B
eing
Net
Exp
orte
r

Explaining Trade Flows: Traditional and New Determinants of Trade Patterns 81A
6. G
raph
s N
on-l
inea
rity
Bet
wee
n Fa
ctor
End
owm
ents
and
Pro
babi
lity
of
Bei
ng n
et E
xpor
ter(
cont
inue
d)
82 Julien Gourdon
A7. Determinants of Comparative Advantage: Probit on the Probability of Being a NetExporter of Each Commodity Cluster for 1960-1980 and 1980-2000.
Probability of beinga net exporter
AGR AGR PFO PFO MIN MIN NRK NRK
Period1960-1980
1980-2000
1960-1980
1980-2000
1960-1980
1980-2000
1960-1980
1980-2000
Capital -0.275a 0.074 -0.436a -0.042 0.326a 0.766a 0.186b 0.697a
(2.93) (0.80) (4.11) (0.36) (2.98) (5.27) (2.12) (4.93)
Land 0.078 0.222a 0.429a 0.354a 0.037 -0.127a 0.211a 0.446a
(1.60) (3.76) (5.35) (5.87) (0.79) (3.29) (4.52) (6.62)
Unskilled -0.190a -0.078 0.147 0.112c -0.038 0.165b 0.207b 0.237a
(3.30) (1.50) (1.50) (1.85) (0.51) (2.13) (2.20) (3.59)
Primary -0.065 -0.152 0.538a 0.186c -0.266c -0.095 0.056 0.236c
(0.71) (1.57) (3.24) (1.95) (1.74) (0.63) (0.32) (1.78)
High-Secondary -0.098 -0.240b 0.295c 0.168 0.488a 0.191 0.303b 0.186(1.11) (2.32) (1.81) (1.57) (3.77) (1.33) (2.33) (1.38)
Income p.c. 0.054 -0.193 0.385b 0.076 -0.144 -0.518b 0.003 -0.278(0.33) (1.19) (2.30) (0.41) (0.88) (2.56) (0.02) (1.38)
Population -0.007 -0.032 0.012 -0.059c -0.010 0.065b 0.014 0.001(0.21) (1.06) (0.32) (1.79) (0.30) (2.17) (0.44) (0.04)
TFP -0.240 -0.037 -0.147 0.521a -0.390 -0.268c 0.150 0.056(0.74) (0.25) (0.47) (3.11) (1.27) (1.70) (0.50) (0.32)
ICT 1.127b -0.011 -1.289b -0.038 -2.172a 0.001 -0.145 0.012(2.32) (0.40) (2.34) (1.24) (3.88) (0.04) (0.32) (0.42)
Infrastructure -0.187 0.150 0.490a 0.165 0.226c -0.353a -0.122 -0.318a
(1.49) (1.28) (3.61) (1.49) (1.84) (2.85) (1.02) (2.89)
Regional Dummies Yes Yes Yes Yes Yes Yes Yes YesObservations 213 248 212 249 202 241 214 251
a: means significant at 1%, b: means significant at 5% and c: means significant at 10%
Explaining Trade Flows: Traditional and New Determinants of Trade Patterns 83
A7. Determinants of Comparative Advantage: Probit on the Probability of Being a NetExporter of Each Commodity Cluster for 1960-1980 and 1980-2000 (continued).
Probability of being a net
exporter UNL UNL SKL SKL CAP CAP TEC TEC
Period1960-1980
1980-2000
1960-1980
1980-2000
1960-1980
1980-2000
1960-1980
1980-2000
Capital -0.240a -0.797a -0.109a -0.006 -0.000b 0.084a 0.000000 0.000077(4.51) (4.86) (3.62) (0.16) (2.48) (2.74) (0.22) (0.76)
Land -0.048c 0.126a -0.044a -0.005 0.000b 0.017c -0.000000b -0.000059b
(1.85) (2.82) (4.01) (0.51) (2.11) (1.69) (2.04) (2.10)
Unskilled -0.015 0.440a -0.022b -0.034b -0.000a -0.023b -0.000000 0.000001(0.59) (4.49) (2.25) (2.43) (2.75) (2.28) (1.39) (0.03)
Primary 0.134b 0.648a 0.106a 0.019 0.000b 0.017 0.000000 0.000056(2.52) (5.32) (3.24) (0.76) (2.04) (0.61) (0.89) (0.94)
High-Secondary
-0.182a 0.910a 0.049b 0.106b 0.000b -0.055c 0.000000 0.000213b
(3.60) (4.50) (2.10) (2.38) (2.50) (1.81) (0.62) (2.14)
Income p.c. 0.072 0.723a 0.015 -0.067 -0.000 -0.034 -0.000000c -0.000221(0.84) (3.59) (0.41) (1.24) (1.10) (0.83) (1.88) (1.49)
Population 0.141a 0.186a 0.044a 0.039a 0.000a 0.031a 0.000000a 0.000046a
(6.80) (4.34) (5.64) (5.70) (3.62) (4.54) (5.31) (2.93)
TFP 0.263c 0.667a -0.035 0.122b 0.000a 0.100a 0.000000 -0.000039(1.68) (3.82) (0.64) (2.37) (3.40) (2.69) (0.89) (0.47)
ICT 1.458a -0.103a 0.147 -0.002 0.000a -0.002 0.000000 0.000020c
(5.42) (3.23) (1.35) (0.39) (2.88) (0.26) (1.45) (1.95)
Infrastructure -0.025 0.229 0.026 0.084a -0.000b 0.036 0.000000a 0.000143c
(0.35) (1.54) (0.87) (2.93) (2.38) (1.17) (4.07) (1.65)
Regional Dummies
Yes Yes Yes Yes Yes Yes Yes Yes
Observations 213 248 213 249 214 242 213 241
a: means significant at 1%, b: means significant at 5% and c: means significant at 10%

84 Julien Gourdon
References
Antweiler, W., Trefler, D.(2002), “Increased Return and All That: a View from Trade”,The American Economic Review, Vol. 92.
Balassa, B., Bauwens, L.(1988), “Changing Trade Patterns in Manufacturing Goods: anEconometric Investigation”, Amsterdam.
Bosworth G., Collins S.(2003), “The Empirics of Growth: an Update” Brookings Paper onEconomic Activity.
Bougheas, S., Demetriades, P., Mamuneas, T.(2000), “Infrastructure, Specialization andEconomic Growth”, The Canadian Journal of Economics, Vol. 337.
Bowen, H. P., Leamer, E., Sveikauskas, L.(1987), “Multi−country, Multi−factor Test ofthe Factor Abundance Theory”, The American Economic Review, Vol. 77.
Davis, D. Weinstein, D., Bradford, S., Shimpo, K.(1997), “Using International andJapanese Regional Data to Determine When the Factor Abundance Theory of TradeWorks”, American Economic Review, Vol. 87.
Davis, D., Weinstein, D.(2001), “An Account of Global Factor Trade”, AmericanEconomic Review, Vol. 91.
Deardorff, A. V.(1980), “The General Validity of the Law of Comparative Advantage”,Journal of Political Economy, Vol. 88.
Deardorff, A. V.(1984), “Testing Trade Theories and Predicting Trade Flows”, Handbookof International Economics, Vol. 1.
Deardorff, A. V.(1994), “Exploring the Limits of Comparative Advantage”, Review ofWorld Economics, Vol. 130.
Estervadeordal, A.(1997), “Measuring Protection in the Early Twentieth Century”,European Review of Economic History, Vol. 1.
Estervadeordal, A., Taylor, A.M.(2002), “A Century of Missing Trade”, AmericanEconomic Review, Vol. 92.
Estervadeordal, A. Taylor, A.M.(2002), “Testing Trade Theory in Ohlin’s Time” InRonald Findlay, Lars Jonung and Mats Lundhal, eds., Bertil Ohlin: a CentennialCelebration: 1899-1999: Cambridge MIT Press.
Ethier, W. J.(1974), “Some of the Theorems of International Trade with Many Goods andFactors”, Journal of International Economics, Vol. 4.
Ethier, W J., Svensson, L.E.O.(1986), “The Theorems of International Trade with FactorMobility”, Journal of International Economics, Vol. 20.
Feenstra, R.(2004), “Advanced International Trade: Theory and Evidence”, PrincetonUniversity Press.
Forstner, H., Balance, R.(1990), “Competing in a Global Economy: an Empirical Studieson Specialisation and Trade in Manufactures”, London.
Gaisford, J. D.(1995), “International Capital Mobility, the Factor Contents of Trade andLeontief Paradoxes”, Journal of International Economics, Vol. 5.
Harrigan J.(1997), “Technology, Factor supplies and International Specialization:
Explaining Trade Flows: Traditional and New Determinants of Trade Patterns 85
Estimating the neo classical model”, American Economic Review, Vol. 87.Harrigan, J., Zakrajsek, E.(2000), “Factor Supplies and Specialization in the World
Economy”, Mimeo, International Research Department Federal Reserve of New YorkHead, K., Ries, J.(2001), “Increasing returns versus National Product Differentiation as an
Explanation for the Patterns of US-Canada Trade”, American Economic Review, Vol.91.
Hein, S.(1992), “Trade Strategies and the Dependency Hypothesis: A Comparison ofPolicy, Foreign Investment, and Economic Growth in Latin America and East Asia”,Economic Development and Cultural Change, Vol. 40.
Hunter, L.C., Markusen, J.R.(1988), “Per Capita Income as Determinant of Trade”, in R.Feenstra ed. Empirical Methods for International Trade, MIT Press Cambridge NA.
Jones, R., Beladi, H., Marjit, S.(1998), “The Three Faces of Factor Intensities”, Journal ofInternational Economics, Vol. 48.
Jones, R.(2000), “Globalization and the Theory of Input Trade”, Cambridge MIT PressLeamer, E.(1980), “The Leontief Paradox Reconsidered”, Journal of Political Economy,
Vol. 88.Leamer, E.(1984), “Sources of International Comparative Advantage: Theory and
Evidence”, Cambridge: MIT Press.Leamer, E.(1987), “Paths of Development in the 3-factor, N-Good General Equilibrium
Mode”, Journal of Political Economy, Vol. 95.Leamer, E.(1987), “Measures of Openness”, in R. Baldwin (ed.) “Trade Policy Issues and
Empirical Analysis”, Chicago Press.Leamer, E. Levinsohn, J.(1995), “International Trade Theory: the Evidence”, Chapter 3 In
Handbook of International Economics, Vol. 3, Amsterdam North Holland.Leamer, E. Rodriguez, S. Schott, P.K.(1999), “Does Natural Resources Abundance
Increase Latin American Income Inequality?”, Journal of Development Economics,Vol. 59.
Lederman, D. Xu, L.C.(2006), “Comparative Advantage and Trade Intensity: AreTraditional Endowment Destiny?”, in Natural Resources: Neither Curse norDestiny.Daniel Lederman and William F. Maloney, editors, Stanford, CA: StanfordUniversity Press.
Leontief, W.W.(1956), “Factor Proportions and the Structure of American Trade”, Reviewof Economics and Statistics.
Markusen J. (1986), “Explaining the Volume of Trade: an Eclectic Approach”, AmericanEconomic Review, Vol. 76.
Markusen, J. Melvin, J.(1981), “Trade, Factor Prices and Gains from Trade withincreasing Returns to Scale”, Canadian Journal of Economics, Vol. 14
Marrewijck C., Hinloopen J.(2004), “Dynamics of Chinese Comparative Advantage”,Timbergen Institute Discussion Paper 034/2.
Minford, P.(1998), “A labour-Based Theory of International Trade” in J.Black, A.I.MacBeans (eds.), Cause of Changes in the Structural of International Changes 1960-85 Basingstoke.
86 Julien Gourdon
Neary, P.(2003), “Competitive versus Comparative Advantage” World Economy, Vol. 26.Santos-Paulino, A., Thirwall, A.P.(2004), “The Impact of Trade Liberalization on Exports,
Imports and the Balance of Payments of Developing Countries”, The EconomicJournal, Vol.114.
Schott, P.(2003), “One Size Fits All? Hecksher-Ohlin Specialization in GlobalProduction”, American Economic Review, Vol. 93.
Schott, P.(2004), “Across Product versus Within-Product Specialisation in InternationalTrade”, Quarterly Journal of Economics, Vol. 119.
Spilimbergo, A., Londono, JL. Székely, M. (1999), “Income Distribution, FactorEndowments, and Trade Openness”, Journal of Development Economics, Vol. 59.
Travis, W.P.(1964), “The Theory of Trade and Protection”, Cambridge, HarvardUniversity Press.
Trefler, D.(1995), “The case of the Missing Trade and Other Mysteries”, The AmericanEconomic Review, Vol. 85.
Wacziarg, R., Welch. K.H.(2003) “Trade Liberalization and Growth: New Evidence”,NBER Working Papers, n 10152.
Wood, A.(1994), “Give Hecksher and Ohlin a Chance!” Review of World Economics, Vol.130.
Wood, A.(1995), “North-South Trade Employment and Inequality”, Clarendon pressoxford.


