
Experts in Team work - NTNUnorne/wiki/lib/exe/fetch.php?media=english:nw10:... · Experts in Team...
32
Experts in Team work TPG4852 Norne Village 2010 Technical Report Group 3 Isilda Marcelia De Moura Felizardo Ola Terjeson Miljeteig Muhammad Saeed Godfred Inkoom Sina Karampour NTNU Spring 2010
Transcript of Experts in Team work - NTNUnorne/wiki/lib/exe/fetch.php?media=english:nw10:... · Experts in Team...

Experts in Team work
TPG4852 Norne Village 2010
Technical Report
Group 3
Isilda Marcelia De Moura Felizardo
Ola Terjeson Miljeteig
Muhammad Saeed
Godfred Inkoom
Sina Karampour
NTNU
Spring 2010

Norne Village 2010, Group 3
2
Table of Contents Abstract ......................................................................................................................................................... 4
Introduction .................................................................................................................................................. 5
1. Basic petroleum concepts ..................................................................................................................... 5
1.1 Reservoir: ............................................................................................................................................ 5
1.2 Reservoir pressure (FPR) and Bottom hole pressure (BHP): ............................................................... 5
1.3 Production: .......................................................................................................................................... 6
1.4 Injection Wells, production: ................................................................................................................ 6
1.5 Porosity: .............................................................................................................................................. 6
1.6 Permeability: ....................................................................................................................................... 7
1.7 Mobility: .............................................................................................................................................. 7
1.8 Drainage: ............................................................................................................................................. 7
1.9 Imbibitions: ......................................................................................................................................... 7
2. NORNE E-Segment ................................................................................................................................ 8
2.1 Geological overview of the E-Segment ............................................................................................... 8
2.2 Production overview ........................................................................................................................... 8
2.3 Wells over view ................................................................................................................................... 9
3. Common task for all groups .................................................................................................................. 9
3.1 History match the model ............................................................................................................ 10
3.2 Discussion .......................................................................................................................................... 12
3.3 Conclusions ....................................................................................................................................... 14
4. Revising the current drainage strategy ............................................................................................... 15
4.1 Assumptions and Basis: ..................................................................................................................... 15
4.2 Case 1: ............................................................................................................................................... 15
4.3 Case 2 ................................................................................................................................................ 18
4.4 Case 3 ................................................................................................................................................ 19
4.5 Case 4 ................................................................................................................................................ 21
4.6 Case 5 ................................................................................................................................................ 22
4.7 Case 6 ................................................................................................................................................ 23
4.8 Case 7(NW10) ................................................................................................................................... 27
5. Economical evaluation ........................................................................................................................ 29
Norne Village 2010, Group 3
3
6. Conclusions and recommendations .................................................................................................... 31
References .................................................................................................................................................. 32
Table of Figures
Figure 1 Injection and production ................................................................................................................................. 6
Figure 2 porosity in sand stone ..................................................................................................................................... 7
Figure 3 Relative permeability ...................................................................................................................................... 7
Figure 4 Norne E-Segment Simulation by Eclipse 100 ................................................................................................. 10
Figure 5 History matching, Reservoir pressure history ............................................................................................... 11
Figure 6 History matching, E-Segment ....................................................................................................................... 12
Figure 7 Water production ,well E-3AH ...................................................................................................................... 13
Figure 8 Oil production, well E-3AH ............................................................................................................................ 13
Figure 9 Gas production, well E-3AH .......................................................................................................................... 14
Figure 10 E-Segment with no wells in 1997 ................................................................................................................ 16
Figure 11 E-Segment with no wells in 2004 ................................................................................................................ 16
Figure 12 Oil, water, gas production and reservoir pressure comparison, case 1 ...................................................... 17
Figure 13 Oil, water, gas production and reservoir pressure comparison, case 2 ....................................................... 18
Figure 14 Norne E-Segment, case 3 ............................................................................................................................ 19
Figure 15 Effect of change in position of well F-3H, Case 3 ........................................................................................ 20
Figure 16 Oil, water, gas production and reservoir pressure comparison, case 3 ...................................................... 20
Figure 17 Oil, water, gas production and reservoir pressure comparison, case 4 ...................................................... 21
Figure 18 Oil, water, gas production and reservoir pressure comparison, case 5 ...................................................... 22
Figure 19 Oil, water, gas production and reservoir pressure comparison, case 6 ...................................................... 24
Figure 20 well E-2H ...................................................................................................................................................... 25
Figure 21 well E-3H ...................................................................................................................................................... 26
Figure 22 Oil, water, gas production and reservoir pressure, case 7 .......................................................................... 27
Figure 23 Oil production comparison .......................................................................................................................... 28
Figure 24 Oil production and income comparison, case NW10 .................................................................................. 30

Norne Village 2010, Group 3
4
Abstract
TPG4851 – Experts in Team is a mandatory cross-disciplinary course for all Master's students at NTNU. The purpose of this course is to give the students experience in working with students from different backgrounds, trying to create an environment similar to what is existing in the industry. It is an opportunity for the students to evolve both their academic and team working skills.
This report describes the work done by group 3 at the Norne Village, the spring of 2010 on the institute for petroleum technology at NTNU. In this report a "what if" scenario is discussed, a scenario where one examine the potential for additional income if the knowledge obtained while developing the field was known when they started production. The potential was examined using Eclipse 100 to simulate the fluid flow behavior in the Norne reservoir.
We would like to thank the village leader at the Norne Village, Tom Aage Jelmert, for his supervision and academic support. Special thanks to Nan Cheng at Statoil and Jan Ivar Jensen for help with Eclipse and the Norne E-segment model. We would also like to thank Mohsen Dadashpour and our student assistant, Per Einar Kalnæs, for their help with Eclipse.

Norne Village 2010, Group 3
5
Introduction
The Norne village, one of the EiT villages, is held at the petroleum department of NTNU. This village
operates in coordination with Statoil, working on the E-segment of the Norne field. Norne is an offshore
oil producing field located north of Asgard and Heidrun fields. Since the participants of the course is
from different academic background a brief introduction to the E-Segment as well as a basic
introduction to the petroleum engineering was given to us before any tasks were assigned. So it is
important to discuss the basic petroleum engineering concepts related to the work.
1. Basic petroleum concepts
1.1 Reservoir: Subsurface formation containing fluids that can be brought to the surface (produced).
1.2 Reservoir pressure (FPR) and Bottom hole pressure (BHP): The driving potential for production is FPR. Pressure at the bottom of a well is called BHP. In a simple,
homogeneous reservoir with one production well the difference between the FPR and the BHP would be
called the drawdown pressure, and is what drives the fluids from the reservoir into the wellbore. The
BHP in a production well will in all cases have to be lower than the average pressure in its draining area,
and in most cases the BHP will be lower than the FPR (Unless one are considering a reservoir with really
poor connection, where one can have segments with completely different pressures, and the BHP in
production wells in a high pressure area can be higher than the FPR because all the other segments have
much lower pressures). The BHP in injection wells will have the opposite relationship with respect to
FPR, because the intention is to force fluids into the reservoir.

Norne Village 2010, Group 3
6
1.3 Production: Is the term used for the fluids brought to the surface from the reservoir.
1.4 Injection Wells, production: In a reservoir well from which fluid is produced is a production well. And a well through which we inject
water, gas, surfactant into the reservoir to produce oil or maintain reservoir pressure is an injection well.
Figure 1 Injection and production
1.5 Porosity: The voids between the amorphous partials of reservoir rock that contains fluid are pores and the
fraction of pores per unit volume of rock is porosity.

Norne Village 2010, Group 3
7
1.6 Permeability:
The ability of fluid, typically oil to flow in pores is permeability. It's dimension is [L2] and usually the
unit Darcy is used (1 D =10-12 m2)
Fin sand stone
1.7 Mobility: The ability of a fluid to displace others in the reservoir is mobility factor.
1.8 Drainage: Decreasing the saturation of the wetting phase is called drainage.
1.9 Imbibitions: Increasing the saturation of the wetting phase is called drainage.
(Drainage and imbibition
curves for a water-wet rock)
Figure 2 porosity in sand stone
Figure 3 Relative permeability

Norne Village 2010, Group 3
8
Not Fm.
2. NORNE E-Segment
The Norne E-segment is separated from the rest of the field on the assumption of a constant flux
boundary. This means that we have considered a hypothetical boundary across which the flow of fluid
flowing into the E-segment is equal to the liquid flowing out. Hence any change in any other segment of
reservoir, theoretically will have no effect on any parameter inside the reservoir.
The model available is a black oil model and data is available from 1997 till 2004.
The reservoir is physically divided into two sections by a shale layer resulting in gas entrapped in upper
three layers and lower layer called ila formation containing oil and water.
2.1 Geological overview of the E-Segment Reservoir rock = sand stone
Porosity 25-30%
Permeability 50-3000mDarcy
Formation type= anticline and faults
Shale as cap rock
Shale layer separating oil and gas.
2.2 Production overview Initial pressure =273 bar
Gas to oil ratio = 111 sm3/sm3
EOR by water injection
Oil SG = 0.7, Oil viscosity = 0.5 cp
Gas injection to drive the oil out can’t be done due to the shale layer separating the gas from
the oil.

Norne Village 2010, Group 3
9
2.3 Wells over view Production wells: E-2H and E-3AH
Injection wells: F-1H and F-3H
Exploration well: E-3H (Also producing for some time as e vertical producer)
We have 22 layers in the model for the E-segment, each with different oil saturation and different
properties e.g. in layers 5, 6, and 7 the permeability is less than in layers 9 and 10 but the oil saturation
in these layers is higher.
3. Common task for all groups
In this course we were assigned two tasks.
Common task for all groups, getting familiar with the field and the model
Revise the current drainage strategy for our group
The objectives of the first task were :
Familiarize yourself with basics of reservoir engineering:
This task is concerned with knowing the basics mentioned earlier in the report
Familiarize yourself with the Eclipse simulator
Eclipse is the simulation software used to run the model of the E-segment, in this case Eclipse 100, a
black oil simulator. We were given an introduction to eclipse and the model provided of the E-segment.
Our task included running the dynamic model. Orientation about Eclipse Office, GLview and other tools
related to data analysing of results generated from Eclipse was also given. Besides that Mr Nan Chang
from Statoil, Mr. Dadash Pour from NTNU helped us a lot getting started and troubleshooting with
Eclipse.
Familiarize yourself with the Norne E-segment
o Geology
o Oil and gas properties
o Relative permeability / rock types
o Production and injection history, pressure history
o The Eclipse model

Norne Village 2010, Group 3
10
Run the Norne E-segment model
Figure 4 Norne E-Segment Simulation by Eclipse 100
Plot production/injection profiles of measured and simulated data, both for the segment and
for the wells
Visualize flooding patterns in the segment using 2D and 3D maps (Floviz, Petrel RE or
something else)
3.1 History match the model
History matching is a process of correcting the model and bringing it closer to reality by comparing
the predictions of a model with actual values of production of oil, water gas and field pressure.
Whenever a new reservoir is explored, an exploration well is drilled. In our case E-3H was the
exploration well. This well could be used to get core samples of all the formations. In our case there
are 22 layers. The porosity, permeability, rock type of each layer is determined by this coring,
logging.
Norne Village 2010, Group 3
11
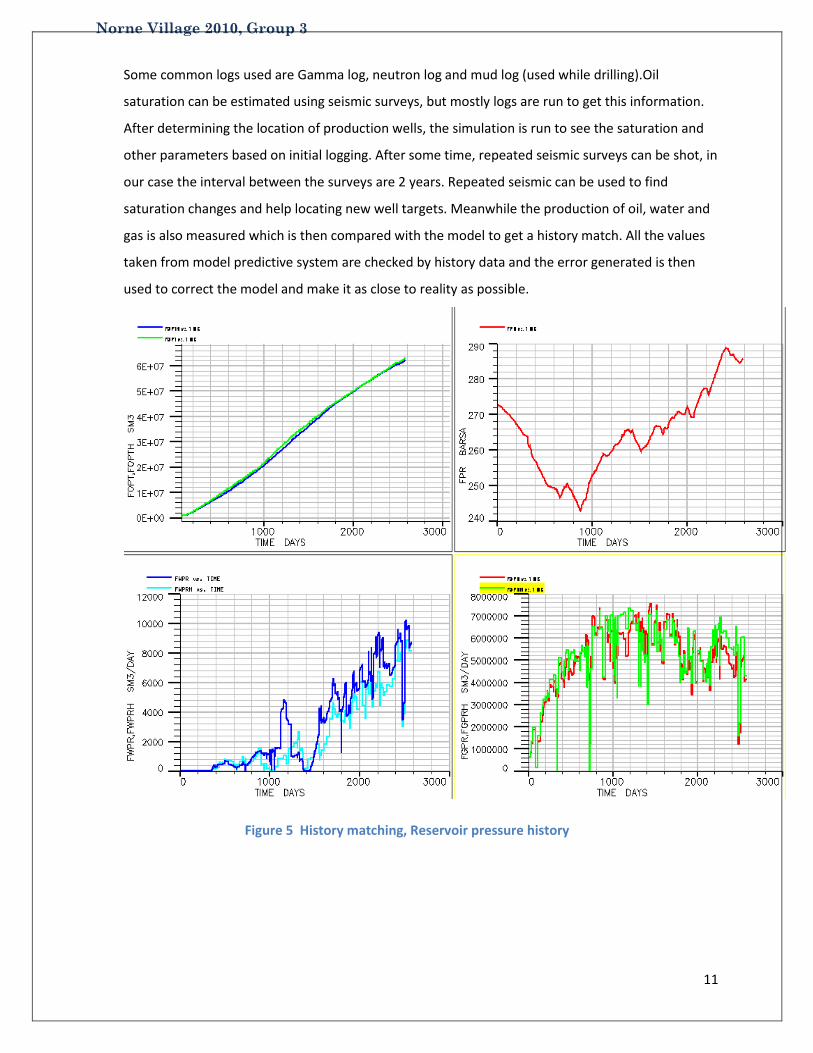
Some common logs used are Gamma log, neutron log and mud log (used while drilling).Oil
saturation can be estimated using seismic surveys, but mostly logs are run to get this information.
After determining the location of production wells, the simulation is run to see the saturation and
other parameters based on initial logging. After some time, repeated seismic surveys can be shot, in
our case the interval between the surveys are 2 years. Repeated seismic can be used to find
saturation changes and help locating new well targets. Meanwhile the production of oil, water and
gas is also measured which is then compared with the model to get a history match. All the values
taken from model predictive system are checked by history data and the error generated is then
used to correct the model and make it as close to reality as possible.
Figure 5 History matching, Reservoir pressure history

Norne Village 2010, Group 3
12
Figure 6 History matching, E-Segment
3.2 Discussion Figure 5 shows that the match is pretty good
A closer look at well E-3AH, in figures 7, 8 and 9, tell us that the model is not perfect. The
production doesn’t match at all, most likely to this well being close to the constant flux
boundary.

Norne Village 2010, Group 3
13
Figure 7 Water production ,well E-3AH
Figure 8 Oil production, well E-3AH
Norne Village 2010, Group 3
14
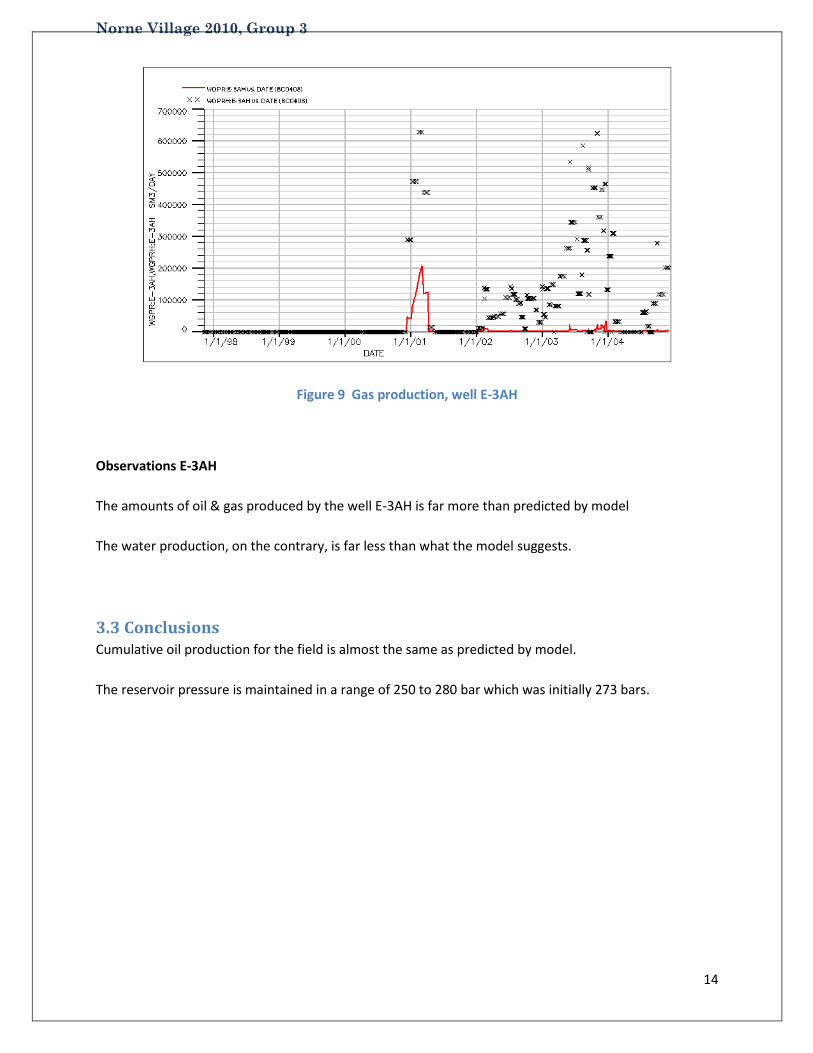
Figure 9 Gas production, well E-3AH
Observations E-3AH
The amounts of oil & gas produced by the well E-3AH is far more than predicted by model
The water production, on the contrary, is far less than what the model suggests.
3.3 Conclusions Cumulative oil production for the field is almost the same as predicted by model.
The reservoir pressure is maintained in a range of 250 to 280 bar which was initially 273 bars.

Norne Village 2010, Group 3
15
4. Revising the current drainage strategy The task involved the following sub objectives.
Based on the same number of wells and total injection find a better drainage strategy
Compare the recovery and economy for different scenarios, current and revised.
To achieve these objectives we tried different well patterns and came up with some results
4.1 Assumptions and Basis: To proceed to our task we made some assumptions
The model provided to us is perfect and is used as reference document to compare our findings.
The condition of constant flux also holds for all the scenarios we simulate.
Oil, water and gas production rate and cumulative production of all of these is considered to be
the basis for judging the effects of any change made in the model.
4.2 Case 1: For a better understanding of the E-segment and the effect of all production and injection wells on the
cumulative field production in this case we removed all the production and injection wells from the
model and compared it with the provided model.

Norne Village 2010, Group 3
16
Figure 10 E-Segment with no wells in 1997
Figure 11 E-Segment with no wells in 2004
Norne Village 2010, Group 3
17
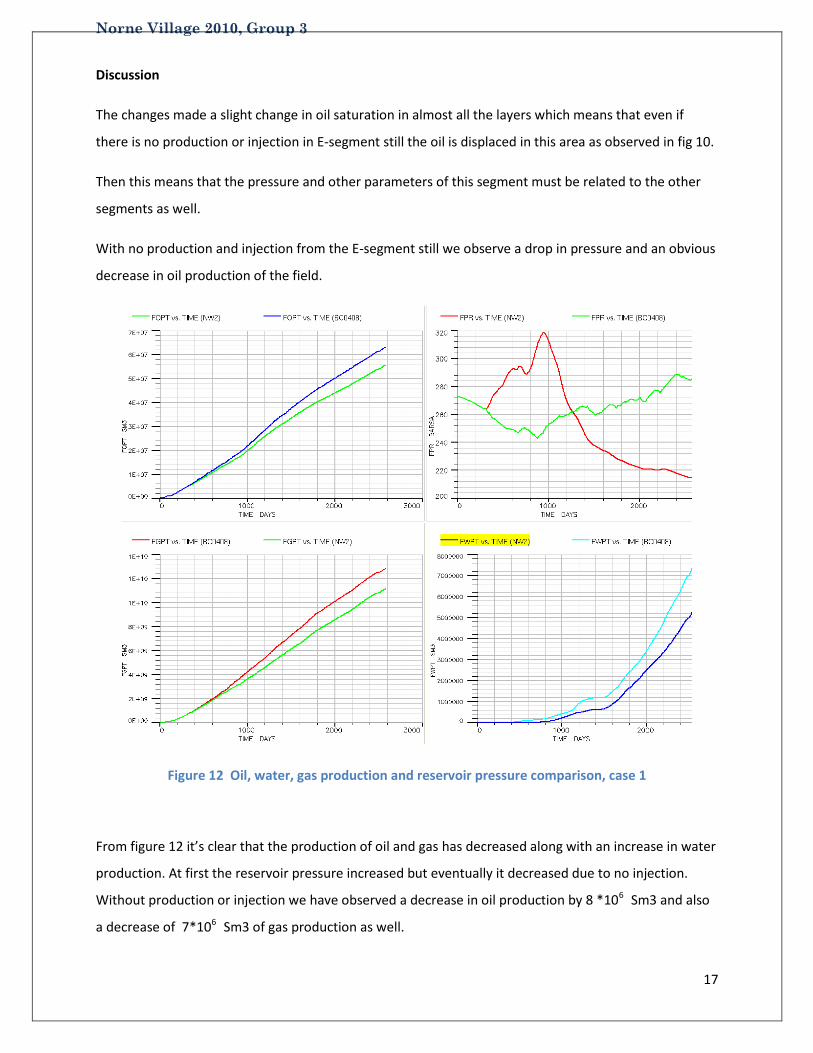
Discussion
The changes made a slight change in oil saturation in almost all the layers which means that even if
there is no production or injection in E-segment still the oil is displaced in this area as observed in fig 10.
Then this means that the pressure and other parameters of this segment must be related to the other
segments as well.
With no production and injection from the E-segment still we observe a drop in pressure and an obvious
decrease in oil production of the field.
Figure 12 Oil, water, gas production and reservoir pressure comparison, case 1
From figure 12 it’s clear that the production of oil and gas has decreased along with an increase in water
production. At first the reservoir pressure increased but eventually it decreased due to no injection.
Without production or injection we have observed a decrease in oil production by 8 *106 Sm3 and also
a decrease of 7*106 Sm3 of gas production as well.

Norne Village 2010, Group 3
18
4.3 Case 2 As observed in previous case the production and injection in E-segment is necessary so let us consider a
case in which the injection wells and injection rate in E-segment is the same as that of base case, where
the production wells are restrained by oil production rate and BHP, not reservoir volume of fluid
replaced as it was in the base case. All the wells – both production wells and injection wells - are placed
in the same position as in the base case.
Figure 13 Oil, water, gas production and reservoir pressure comparison, case 2
Discussion
The changes made results in a decrease in oil production of 4 * 106 Sm3 of oil with constant injection
rate.
The other effect observed is that the reservoir pressure has increased to over 520 bars which is huge
compared to original reservoir pressure. This 90% increase in reservoir pressure can fracture the

Norne Village 2010, Group 3
19
formation, resulting in cracking the shale cap rock and destroy the reservoir. The gas production has
decreased due to the high pressure and the water production has also decreased.
4.4 Case 3 Following changes were made from the base case in this study.
Changed the position of F-1H from (12,85) to (12,80) and set a constant injection rate of 10000
Sm3/d (BHP max 450 bar)
Changed the position of F-3H from (6,57) to (8,57), moved all perforations two steps in positive
x-direction and set constant injection of 10000 (BHP max 450 bar)
E-3H restrained by 7500 Sm3/d ORATE & BHP 200 bar.
Changed position of E-3AH from (7,64) to (9,64), moved perforations & restrained by 7500
Sm3/d ORATE & BHP 200 bar.
Changed perforations of E-2H & & restrained by 7500 Sm3/d ORATE & BHP 200 bar.
Figure 14 Norne E-Segment, case 3
Discussion
The effect of the changes made gives a direct visual indication of isolation of some oil due to moving F-
3H away from the boundary into the reservoir as shown in the fig 14.

Norne Village 2010, Group 3
20
Figure 15 Effect of change in position of well F-3H, Case 3
Figure 16 Oil, water, gas production and reservoir pressure comparison, case 3

Norne Village 2010, Group 3
21
The cumulative oil & gas production has decreased slightly in comparison with the base case. The
reservoir pressure has decreased significantly in comparison with the base case, whereas the cumulative
water production is over twice as big as in the base case. Nevertheless we observe that both the
cumulative oil & gas productions in case 3 exceed that of the base case in the beginning. This means that
this case could have the same profitability as the base case if NPV-calculations are used.
4.5 Case 4 As the results in the case 3 showed a drop in reservoir pressure we increased the injection rate of F-1H
to 12000 Sm3/d. In addition we had some problems with reduced PI (Productivity Index) early in the well
life, so increased the production gradually in E-2H as well as increasing the injection gradually in F-1H.
Figure 17 Oil, water, gas production and reservoir pressure comparison, case 4

Norne Village 2010, Group 3
22
Discussion
Figure 17 show that there is an early increase in production of oil starting around day 1000 of
production and lasting around day 1800 of production. In the beginning an increase of 0, 04* 107 Sm3 of
oil is observed and in the range of day 1200 to 1400 an increase of 0,2* 107 Sm3 of oil is observed.
On the other hand water injection has increased by 1* 107 Sm3 approximately followed by 1,2* 107 Sm3
of water production. The reservoir pressure is still 10% less than the starting pressure.
4.6 Case 5 Case 5 is equal to case 6 except for that E-2H in this case is restrained by a maximum oil production rate
of 5500 Sm3/d.
Figure 18 Oil, water, gas production and reservoir pressure comparison, case 5

Norne Village 2010, Group 3
23
Discussion
The graph of oil production in E-2H shows an early and significant increase in production of oil followed
by a decrease in production. The cumulative effect of the change is not much significant but initially it
gives higher oil production which is desired.
Similarly an early increase in gas production is also observed.
4.7 Case 6 Following changes were made from case 5
Limit for bottom hole pressure for production wells was reduced to 160 Bars.
The injection flow rate 10500 Sm3/hr for F-3H well and 12500 Sm3/hr for F-1H instead of 10000
and 12000 sm3/hr.
Making E-3H a horizontal well in layer 10.
Norne Village 2010, Group 3
24
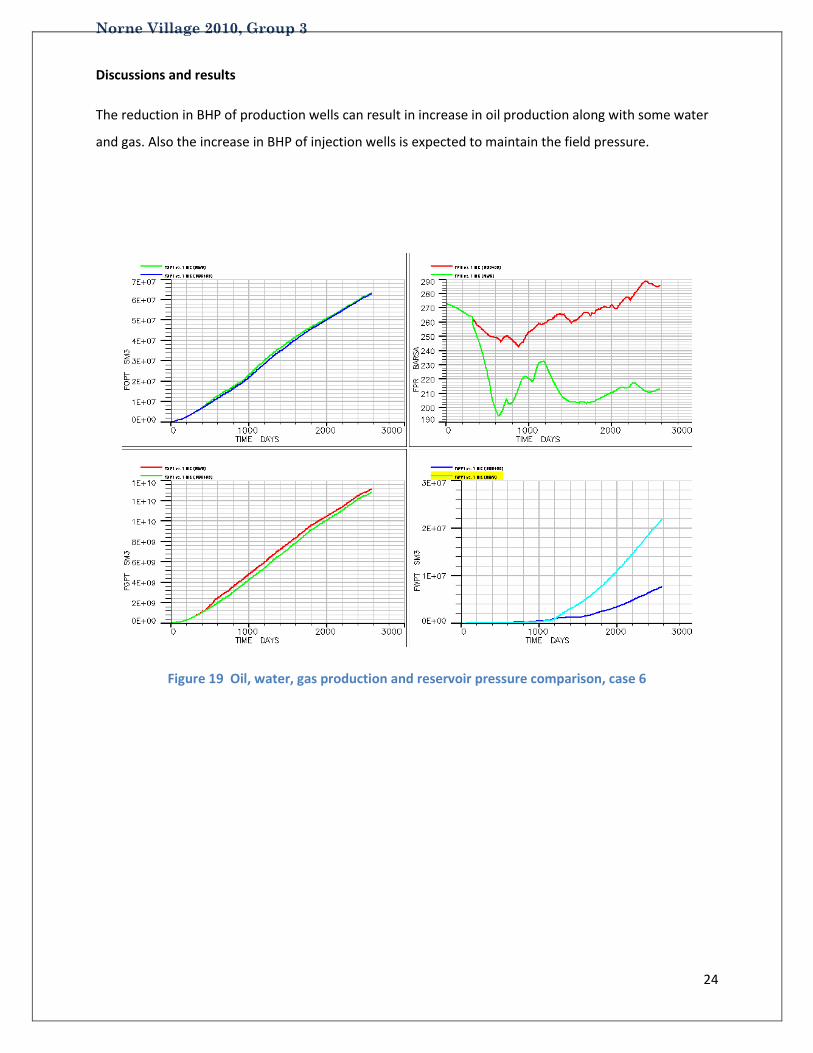
Discussions and results
The reduction in BHP of production wells can result in increase in oil production along with some water
and gas. Also the increase in BHP of injection wells is expected to maintain the field pressure.
Figure 19 Oil, water, gas production and reservoir pressure comparison, case 6

Norne Village 2010, Group 3
25
Figure 20 well E-2H

Norne Village 2010, Group 3
26
Figure 21 well E-3H
As expected by lowering the BHP the GOR increased resulting in an increase in gas production and total
oil production remains almost the same. At lower pressures capacity of oil to dissolve gas decreases as
per Henry’s law.
Solubility is proportional to applied pressure.
Water production has also increased significantly although water cut for E-2H has decreased. For the
well E-3H a significant increases in oil production is observed but a very high water cut results in early
shut down in production, making it economically unfavourable to continue producing from this well.

Norne Village 2010, Group 3
27
4.8 Case 7(NW10) The perforation data used for E-3AH in the previous cases was probably very wrong, so in this case the
perforation data used for the E-3AH well was copied from the perforation data in the corresponding
layers in the E-3H well. Among others, the kh-product was heavily decreased.
Discussion and results
The reduced kh-product was expected to decrease the production rate, but it was also expected to delay
the water breakthrough and reduce the water cut.
Figure 22 Oil, water, gas production and reservoir pressure, case 7
From figure 22 it is clear that the gas production has increased as well as oil production has been
increased by 2 x 10⁶ Sm3, but at the same time the water production has also increased dramatically in
comparison with the base case. The increased water production results in a significant pressure drop,
which is stabilized by injecting more water.
Norne Village 2010, Group 3
28
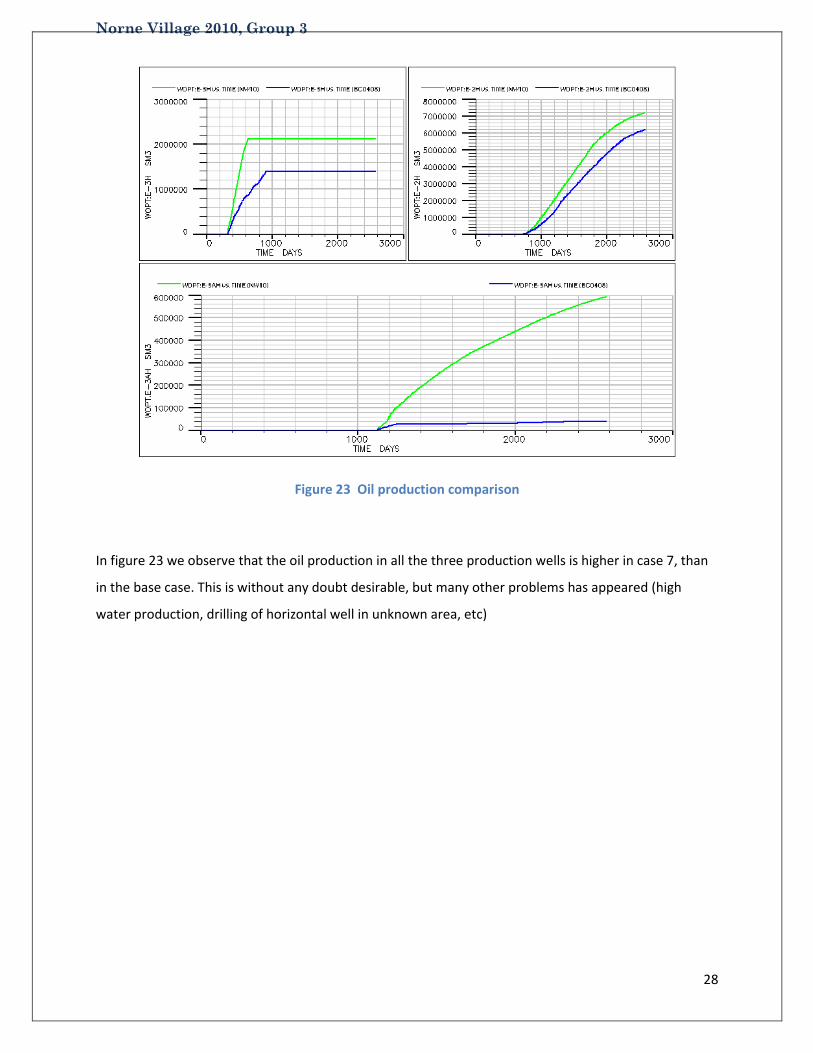
Figure 23 Oil production comparison
In figure 23 we observe that the oil production in all the three production wells is higher in case 7, than
in the base case. This is without any doubt desirable, but many other problems has appeared (high
water production, drilling of horizontal well in unknown area, etc)

Norne Village 2010, Group 3
29
5. Economical evaluation
In this section we have compared the base case and NW10 case from the economic point of view.
Assumptions:
1. As number of wells is equal in both cases and the only big difference is in place where they are drilled, we have ignored the cost of drilling in calculations.
2. Cost of operation and maintenance is not entered into calculations because they are assumed to be equal in both cases.
Note: All data are real and no estimation has used in calculation because analysis are related to the past time (1997-2004).
Method:
As mentioned before, NW10 case results to increase oil production comparing with the base case. Amounts of oil production in calculations are taken from simulation of the E-segment of Norne field by Eclipse.
Calculations:
Oil price [$ / bbl] per year and [$/NOK] rate used in calculations are as follows:
US$ vs NOK, annual average of daily rates
1997 7.0788 1998 7.5465 1999 7.8047 2000 8.8058 2001 8.9879 2002 7.9702 2003 7.0824 2004 6.7372
Year Average oil price
[$ / bbl] 1997 19.1158 1998 13.2858 1999 17.6992 2000 28.3075 2001 24.4117 2002 24.9992 2003 28.8525 2004 38.2975

Norne Village 2010, Group 3
30
This is the summary of oil production and income for the base case:
Year Production Production Income Income [SM3] [Barrels] [US $] [NOK]
1997 426694.2 2.68E+06 51305020.22 3.63E+08 1998 6823130 4.29E+07 570193158.1 4.30E+09 1999 8578546 5.40E+07 955032094.6 7.45E+09 2000 11103450 6.98E+07 1977015629 1.74E+10 2001 11120500 6.99E+07 1707548249 1.53E+10 2002 9240559 5.81E+07 1453031404 1.16E+10 2003 8392352 5.28E+07 1523062714 1.08E+10 2004 7400340 4.65E+07 1782677338 1.20E+10
Total 63085571.2 3.97E+08 10019865607 7.93E+10
This is the summary of oil production and income for the NW10 case:
Year Production Production Income Income [SM3] [Barrels] [US $] [NOK]
1997 426694.2 2.68E+06 51305020.22 3.63E+08 1998 7213592 4.54E+07 602823162.3 4.55E+09 1999 9197614 5.79E+07 1023951677 7.99E+09 2000 11448990 7.20E+07 2038540469 1.80E+10 2001 11642730 7.32E+07 1787736453 1.61E+10 2002 9785480 6.16E+07 1538717489 1.23E+10 2003 8246387 5.19E+07 1496572661 1.06E+10 2004 7383461 4.64E+07 1778611334 1.20E+10
Total 65344948.2 4.11E+08 10318258266 8.18E+10
Comparing the total incomes, it was possible to earn 2.51E+10 NOK (=2510 MNOK) in NW10 case more than the base case.
Figure 24 Oil production and income comparison, case NW10
Norne Village 2010, Group 3
31
6. Conclusions and recommendations
Injection in E-segment is necessary to keep the pressure approximately equal to starting
pressure of 273 bars. For 1st case
Production in E-segment is also necessary to produce the above mentioned quantities of oil and
gas. For 1st case
The oil production must be increased to balance the pressure. For 2nd case
Water injection shall be decreased to keep the pressure constant. For 2nd Case.
Water production has increased. For 3rd case
Reservoir pressure has decreased by 14% of starting value. For 3rd case.
In case 4 along with a slight increase in production a hansom increase in gas and water
production has been observed.
The reservoir pressure decreased to 240 bar.
In case 5 and 6 well E-3H stopped producing earlier due too high water cut.
In case 7 there is an appreciable increase in oil production accompanied by gas and water
production but reservoir pressure is around 280 bar which is near to 273 the initial field
pressure.
Although for petroleum industry gas and oil both are value able products but in case of NORNE the
storage and handling of gas is a challenging issue so in this reservoir a drainage strategy is
recommended which can ensure a higher oil production along with lesser gas production. Reservoir
pressure and water production shall also be considered for maximum life of reservoir along with
optimum production.
Norne Village 2010, Group 3
32
References
1. Frank John, Mark Cook & Mark Graham: Hydrocarbon exploration and production.
Elsevier, Amsterdam, 2008.
2. Bjune JV, KA Macdonald. Failure analysis of drill strings. http://www.sciencedirect.com.
3. Skjæveland, S. M., & Kleppe, J. (1992). SPOR Monograph: Recent advances in improved
oil recovery methods for north sea sandstone reservoirs. NPD - ISBN: 82-7257-340-7.
4. Zolotukhin, & Ursin. (2000). Introduction to petroleum Reservoir Engineering.
Høyskoleforlaget, ISBN: 82-7634-065-2, h.