Experimental Study on the Influence of Geometrical ...
16
1 Experimental Study on the Influence of Geometrical Parameters on the Cavitation Erosion Characteristics of High Speed Submerged Jets Ezddin Hutli 1* , Milos S. Nedeljkovic 2 , Attila Bonyár 3 , Dávid Légrády 1 1a* – Assistant Professor, Ph.D., Institute of Nuclear Techniques (INT) of the Budapest University of Technology and Economics (BME), Budapest, Hungary 1b - Department of Thermohydraulics, Centre for Energy Research, Hungarian Academy of Sciences, Budapest, Hungary [email protected] 2 – Professor, Ph.D., University of Belgrade, Faculty of Mechanical Engineering, member ASME, 3 – Assistant Professor, Ph.D., Budapest University of Technology and Economics, Department of Electronics Technology Abstract The influence of the geometrical working parameters on the cavitation erosion process was experimentally investigated by exposing the surfaces of copper samples (as a kind of Face Centred Cubic material (FCC)) to a high speed submerged cavitating jet for various time periods using a cavitating jet generator. The resulting erosion rate and eroded area is discussed in detail. Influences of the non- dimensional standoff distance, the non-dimensional aspect ratio and the angle of attack is experimentally determined. The results show that the erosion rate and weight loss are strongly depending on these separately investigated parameters. With this test rig facility and applied hydrodynamic parameters the maximum erosion was found to take place with a non-dimensional standoff distance varying between 42- 48 (depending on the nozzle diameter), with a non-dimensional aspect ratio of 11 and with 105° angle of attack. A model to explain the influence of the angle of attack on the erosion rate based on the cavity bubble and target surface interaction is presented. In addition, the obtained results demonstrate that the used small-diameter (0.4 – 0.6 mm) water cutting nozzles could be applied for metal machining by cavitation and cavitation cutting with low power consumption and high cutting efficiency. Keywords: cavitation cloud, cavity, erosion, nozzle, jet 1. Introduction Cavitation is a well-known phenomenon in the field of high speed flows and it is generally considered to be an undesired, sometimes even harmful process in hydraulic systems. However, there are several scientific and industrial applications where cavitation jets are used purposefully e.g. for jet cutting, underwater cleaning and for the improvement of fatigue strength of materials, etc. In these cavitating jets, vortex cavitation is initiated in the low-pressure region of the vortex core, which occurs in the shear layer around a high-speed water jet. The vortex cavitation forms a big cavitation cloud, which shedding is a periodical phenomenon with a frequency in the order of several kHz (Soyama, et al (1994), Kwok, et al, (1997), Soyama, (2005) Hutli, Nedeljkovic, (2008) and Soyama, (2011)). When the cavitating jet hits the surface of a target material shock waves and micro jets are produced as the consequence of the bubble collapse, which cause a significant force of impact (≥1500MPa) (Karimi, Martin, (1986), and Field, et al, (2012)). For the applications where the erosive capabilities of the cavitating jets are utilized it is very important to have high energy impacts, and thus to produce erosive vortex cavitations with the highest possible efficiency (Yamaguchi, Shimizu (1987), Soyama (2004) and Hutli, Nedeljkovic (2008)). Maximizing the efficiency of cavitating jets is not trivial since many parameters have an influence on the erosion process, such as: hydrodynamic conditions, geometrical conditions (nozzle, test chamber and the target), fluid and material properties (Kwok, et al, (1997), Soyama (2011), Yamaguchi, Shimizu (1987), Li, Kang (2016), Soyama, Asahara (1999), Dular (2015)). Therefore an exact solution by either analytical or experimental methods has been out of reach for a long time (Minguan, et al, (2013)). If the relation between the cavitation intensity in a cavitating jet and the erosion rate of materials would be investigated precisely, the key parameter for the prediction of the cavitation erosion rate may be clarified (Yamaguchi, Shimizu (1987), Yamaguchi, Kazama, (2000), and Soyama, et al, (2012)). From
Transcript of Experimental Study on the Influence of Geometrical ...

1
Experimental Study on the Influence of Geometrical Parameters on the
Cavitation Erosion Characteristics of High Speed Submerged Jets
Ezddin Hutli1*, Milos S. Nedeljkovic2, Attila Bonyár3, Dávid Légrády1
1a* – Assistant Professor, Ph.D., Institute of Nuclear Techniques (INT) of the Budapest University
of Technology and Economics (BME), Budapest, Hungary 1b - Department of Thermohydraulics, Centre for Energy Research, Hungarian Academy of
Sciences, Budapest, Hungary [email protected] 2 – Professor, Ph.D., University of Belgrade, Faculty of Mechanical Engineering, member ASME, 3 – Assistant Professor, Ph.D., Budapest University of Technology and Economics, Department of
Electronics Technology
Abstract
The influence of the geometrical working parameters on the cavitation erosion process was
experimentally investigated by exposing the surfaces of copper samples (as a kind of Face Centred Cubic
material (FCC)) to a high speed submerged cavitating jet for various time periods using a cavitating jet
generator. The resulting erosion rate and eroded area is discussed in detail. Influences of the non-
dimensional standoff distance, the non-dimensional aspect ratio and the angle of attack is experimentally
determined. The results show that the erosion rate and weight loss are strongly depending on these
separately investigated parameters. With this test rig facility and applied hydrodynamic parameters the
maximum erosion was found to take place with a non-dimensional standoff distance varying between 42-
48 (depending on the nozzle diameter), with a non-dimensional aspect ratio of 11 and with 105° angle of
attack. A model to explain the influence of the angle of attack on the erosion rate based on the cavity
bubble and target surface interaction is presented. In addition, the obtained results demonstrate that the
used small-diameter (0.4 – 0.6 mm) water cutting nozzles could be applied for metal machining by cavitation and cavitation cutting with low power consumption and high cutting efficiency.
Keywords: cavitation cloud, cavity, erosion, nozzle, jet
1. Introduction
Cavitation is a well-known phenomenon in the field of high speed flows and it is generally considered to
be an undesired, sometimes even harmful process in hydraulic systems. However, there are several
scientific and industrial applications where cavitation jets are used purposefully e.g. for jet cutting,
underwater cleaning and for the improvement of fatigue strength of materials, etc. In these cavitating jets,
vortex cavitation is initiated in the low-pressure region of the vortex core, which occurs in the shear layer
around a high-speed water jet. The vortex cavitation forms a big cavitation cloud, which shedding is a
periodical phenomenon with a frequency in the order of several kHz (Soyama, et al (1994), Kwok, et al,
(1997), Soyama, (2005) Hutli, Nedeljkovic, (2008) and Soyama, (2011)). When the cavitating jet hits the
surface of a target material shock waves and micro jets are produced as the consequence of the bubble
collapse, which cause a significant force of impact (≥1500MPa) (Karimi, Martin, (1986), and Field, et al,
(2012)). For the applications where the erosive capabilities of the cavitating jets are utilized it is very
important to have high energy impacts, and thus to produce erosive vortex cavitations with the highest
possible efficiency (Yamaguchi, Shimizu (1987), Soyama (2004) and Hutli, Nedeljkovic (2008)).
Maximizing the efficiency of cavitating jets is not trivial since many parameters have an influence on the
erosion process, such as: hydrodynamic conditions, geometrical conditions (nozzle, test chamber and the
target), fluid and material properties (Kwok, et al, (1997), Soyama (2011), Yamaguchi, Shimizu (1987),
Li, Kang (2016), Soyama, Asahara (1999), Dular (2015)). Therefore an exact solution by either analytical
or experimental methods has been out of reach for a long time (Minguan, et al, (2013)).
If the relation between the cavitation intensity in a cavitating jet and the erosion rate of materials would
be investigated precisely, the key parameter for the prediction of the cavitation erosion rate may be
clarified (Yamaguchi, Shimizu (1987), Yamaguchi, Kazama, (2000), and Soyama, et al, (2012)). From

2
the erosion point of view, the behaviour of the severely erosive cavitation depends on the pressure
gradient in the jet nozzle, the jet geometry and the material of the target (Soyama, (2011), Yamaguchi,
Shimizu (1987), Li, Kang (2016) and Yamaguchi, Kazama (2000)). Macroscopically, the erosion rate
depends on the ratio of the cavitation intensity and the cavitation resistance.
Based on that the fact that cavitation damage can occur only if the cavitation intensity created by the flow
field exceeds the cavitation resistance of the material, therefore the damage mechanism can be expected
to depend on the ratio of cavitation intensity and cavitation resistance. As this ratio increases above non-
damaging levels the damage mechanism starts from a fatigue-like process over plastic deformation to a
failure mechanism, when the cavitation intensity exceeds the tensile strength of the material. At a low
cavitation impact intensity elastic deformation is taking place (e.g. vibratory cavitation system), while a
higher intensity produces plastic deformation and surface hardening (e.g. high speed submerged
cavitating jet). When the full hardening has occurred, further exposure to cavitational stresses eventually
causes fatigue cracking on the surface (Hart and Whale (2007) and Montalváo e Silva et a. (1990)).
The dependence of the damage mechanism on the test conditions (e.g. geometrical parameters) is one of
the reasons why a unique material property alone is not appropriate to correlate and fully describe the
cavitation resistance. Besides, it is difficult to simulate and understand the reaction of a material which is
exposed to highly localized, non-stationary impact loading. Furthermore, it is also expected that the
microstructure plays a role in this reaction too.
The aim of this study is to investigate the influence of geometrical conditions of a high speed cavitation
jet generator, such as the non-dimensional standoff distance, the non-dimensional aspect ratio, the nozzle
diameter, the angle of attack, etc. on the cavitation erosion process in commercial copper as the test
material, with an aim to maximize erosion efficiency in this target.
2. Experimental procedures
The experimental setup is described in our pervious publication (Hutli, et al (2008)). The schematic
diagram of the test chamber and nozzle geometry is presented in Fig.1. The same protocol, which was
used in our previous work (Hutli, et al (2008)) for determining the cavitation erosion parameters, erosion
quantification and accuracy of the measured quantities is also employed here.
(a) (b)
Fig. 1. Schematic diagram of (a) the test chamber, (b) nozzle body geometry (mm). The apparatus in the facility (including the cavitating jet generator) was calibrated in order to obtain
results with high accuracy. The pressure transducers used to measure the upstream and downstream
pressures were calibrated precisely with a reference pressure transducer (HUBER). The temperature
sensors in the test rig were calibrated perfectly by the use of a NORMA type digital thermometer as the
reference in the calibration process, the uncertainty was of in the order of ±1 ͦ C. The upstream pressure
(P1) and the downstream pressure (P2) were measured at the inlet and outlet of the test chamber,
respectively. The pressure transducers were calibrated by the manufacturer and accuracy certificates were
issued for a maximum error of ±0.2/± 0.21 % FS (Full Scale), respectively. Since the flow rate was
determined by using the P1 and P2 values from a previous nozzle calibration, the uncertainty of the
determination was also in the order of ±0.3 % FS.

3
Since the test rig does not contain a flowmeter, the flow rates were measured manually by measuring the
amount of collected water for a given time period for different nozzles and up- and downstream pressures.
Based on these the volumetric flow rate curve (Q [m3/s]) can be plotted (Eq. 1) against the pressure
difference, where k is the discharge constant for a given nozzle, which can be obtained as the slope of the
curve.
21 PPkQ (1)
By knowing k for the used nozzles, the exit jet velocities (Vj) can be calculated for any applied
hydrodynamic and geometrical working conditions, based on Eq. 1. In our experiments this was
automatically done by a custom Labview software based on the measured pressure differences.
The tested specimens were machined from commercial Cu (99.9% purity copper). For each specimen, the
desired experimental hydrodynamic conditions were achieved by adjusting the up and downstream
pressures (P1 and P2, respectively) by using regulation valves mounted at the inlet and outlet of the test
chamber, as shown in Fig. 1(a). In order to assess the reproducibility and error of the weight loss, three
specimens were exposed to cavitation for every investigated experimental conditions. The average was
used for further calculations. The mass loss was measured by using a high precision balance (METTLER
AE 100), with a sensitivity of 0.1 mg. Roughness measurements on the processed surface were done with
a Talasurf 6 profiler, with a sensitivity in the m range. The tested specimens have disc shape with a
diameter of 14 mm and a thickness of 5 mm, as shown in our previous publication (Hutli, et al (2008)).
Note that this thickness was changed by increments of 3 mm for the investigations in Section 3.1.
The used nozzles with diameters ranging between 0.4 - 0.6 mm were originally produced for water
cutting machines but not for dedicated cavitation cutting techniques.
3. Results and Discussion
3.1. Cavitation Erosion and the Non-Dimensional Standoff Distance ( outdX / )
In order to study the influence of the non-dimensional standoff distance ( outdX / ) and the non-
dimensional aspect ratio ( outdL / ) on the erosion process, experiments with test conditions given in Table
1 were performed.
Table 1. Hydrodynamic conditions for the X/d investigations with 1800 s exposure time
Nozzle
diameter (d)
[mm]
Upstream
Pressure (P1)
[MPa]±0.1
Downstream
Pressure (P2)
[MPa]±0.01
Exit-Jet
Velocity (Vj)
[m/s]±0.5
Cavitation
number
(σ)±0.001
Working
Fluid
Temperature
(T) [°C]±1 0.40 12.36 0.309 101.1 0.040 19
0.45 12.1 0.31 101.4 0.040 19
0.55 14.54 0.31 101.3 0.040 19
A disadvantage of our equipment is that the nozzle is not mobile, neither forwards nor backwards. Our
test rig is not compatible with standards such as the ASTM G134, which is used by H. Soyama (ASTM
G134 is abbreviation for American Standard Test Method for Erosion of Solid Materials by a Cavitating
Liquid Jet). To overcome this disadvantage, the non-dimensional standoff distance ( outdX / ) values were
varied by changing the distance ( X ) and/or the outlet nozzle diameter ( outd ). The value of X was set by
increasing the thickness of the specimens by increments of 3 mm, as can be seen in Fig. 2. Convergent
nozzles were used for the tests (see Fig. 1). The applied exposure time of 1800 s (0.5 h) was long enough
to yield measurable amounts of erosion in the specimens. The average erosion rate was calculated by
dividing the measured weight loss with the exposure time (mass loss /exposure time).

4
Fig. 2. Optical microscopy images illustrating the variation of X/d by increasing the thickness of the
specimens. Convergent nozzle with dout = 0.4 mm.
Photographs of the eroded specimens are shown in Fig. 3 (a). The differences between the specimens can
be clearly seen, especially in the degree of erosion and the roughness of the surface, which are related to
the nozzle geometry (diameter), to the non-dimensional standoff distance ( outdX / ) and to the aspect
ratio ( outdL / ). Increasing the nozzle diameter increases both the diameter of the erosion ring and the
surface roughness. Based on these images it can be assumed, that as the nozzle diameter increases, the
cloud becomes larger in size and becomes stronger in intensity, since more intensive clouds have an
increased potential for a stronger impact on the specimen surface. The dependence of the erosion rate on
the non-dimensional standoff distance for different nozzle diameters is shown in Fig. 4.
(a)
(b)
Fig. 3. (a) Specimens after attack by cavitating jets; (b) Digital camera images of the cavitating jets
and rings which attack the specimens.
Fig. 4. The influence of the non-dimensional standoff distance (X/d) on the erosion rate in Cu
specimens exposed to the cavitating jets, for different nozzle diameters (d=dout).
Fig. 4 reveals that the erosion rate increases by increasing the standoff distance, then after reaching a
maximal value it starts to decrease. We can say that in this maximum point the non-dimensional standoff
5
distance has an optimal value, where the development of the cavity is assumed to be the best (see the
optical microscopy images of Fig. 3 (b) regarding the cavitating jets and clouds which attack the sample
surface during the experiments). Based on this, the optimum outdX / can be defined as the standoff
distance ( optimumx ) where the erosion rate has maximum value. In addition, the pressure distribution
“value” around the cavity can also be related to this parameter ( outdX / ).
This behaviour was most pronounced in the tests with a nozzle of diameter of 0.55 mm. The erosion rate
increased gradually until reaching a maximum at outdX / = 46.67, then it decreased sharply. For the
specimens treated with nozzles of outd = 0.4 and 0.45 mm, the changes in the erosion rate were more
gradual before and after the maximum point, which were at outdX / = 41.675 and 43.7, respectively.
In Fig. 4 it can be seen that the erosion rate increases with larger nozzle diameters, besides, the position
of the erosion rate peak was shifted to the right as the nozzle diameter increased, which indicates an
increase in the optimum distance value ( optimumx ). The values of optimumx in this investigation were found
to be 16.67 mm, 19.67 mm and 25.67 mm for nozzle diameters 0.4, 0.45, and 0.55 mm, respectively.
These results indicate that for each nozzle there is an optimum distance, if the hydrodynamic conditions
are kept fixed. In the same way, for a given nozzle and fixed geometrical working conditions the optimal
standoff distance will be depending on the hydrodynamic conditions (e.g. on the inlet pressure as was
demonstrated recently by Deng Li et al. (2016)).
These findings are also in good agreement with results in the literature (Soyama, (2011), Soyama, et al,
(2012), and Hutli (2008)).
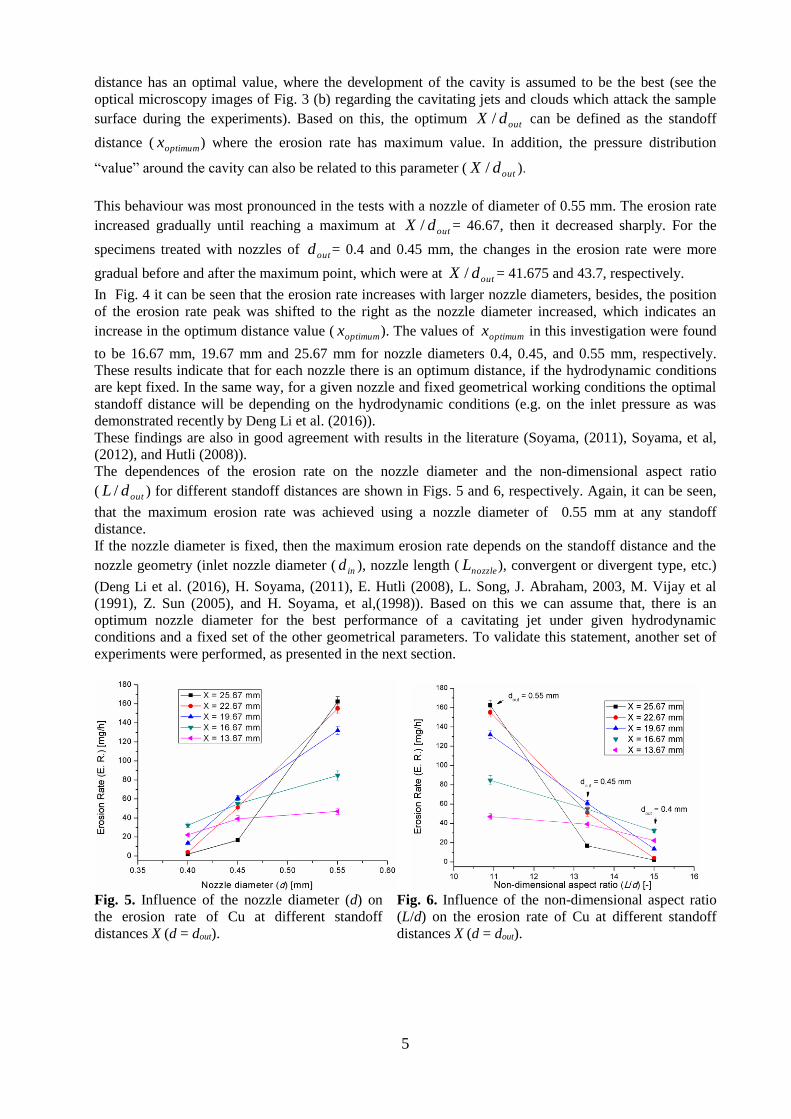
The dependences of the erosion rate on the nozzle diameter and the non-dimensional aspect ratio
( outdL / ) for different standoff distances are shown in Figs. 5 and 6, respectively. Again, it can be seen,
that the maximum erosion rate was achieved using a nozzle diameter of 0.55 mm at any standoff
distance.
If the nozzle diameter is fixed, then the maximum erosion rate depends on the standoff distance and the
nozzle geometry (inlet nozzle diameter ( ind ), nozzle length ( nozzleL ), convergent or divergent type, etc.)
(Deng Li et al. (2016), H. Soyama, (2011), E. Hutli (2008), L. Song, J. Abraham, 2003, M. Vijay et al
(1991), Z. Sun (2005), and H. Soyama, et al,(1998)). Based on this we can assume that, there is an
optimum nozzle diameter for the best performance of a cavitating jet under given hydrodynamic
conditions and a fixed set of the other geometrical parameters. To validate this statement, another set of
experiments were performed, as presented in the next section.
Fig. 5. Influence of the nozzle diameter (d) on
the erosion rate of Cu at different standoff
distances X (d = dout).
Fig. 6. Influence of the non-dimensional aspect ratio
(L/d) on the erosion rate of Cu at different standoff
distances X (d = dout).

6
3.2. Cavitation Erosion and the Nozzle Diameter
In order to investigate the influence of the nozzle diameter on the erosion rate, four different nozzle
diameters ( outd 0.4; 0.45; 0.55 and 0.6 mm) were used with 1800 s exposure time for each Cu specimen.
To assess the reproducibility, two sets of experiments were done. The standoff distance (X = 25.67 mm),
upstream pressure ( 1P ) and fluid temperature (T ) were maintained constant, while the downstream
pressure ( 2P ) and exit-jet velocity ( JV ) changed as a result of the variation in the flow rate (Q ),
originating from the changes in the nozzle diameter (Hutli, Nedeljkovic, (2008), Soyama, (2011), and
Yamaguchi, Kazama, (2000)). As a result, the cavitation number ( ) is also changed and could be
calculated, as can be seen along with the other experimental parameters in Table 2. In this set of
experiments, only the nozzle diameter has been changed, which is in fact indirectly changes X/d as well.
The optical microscopy images of the damaged specimens presented in Fig.7 show, that the damage done
to the surface varies with the applied nozzle diameter. At outd = 0.4 mm both the damaged area and
roughness is the smallest, while the damage seems to be the most pronounced at outd = 0.55 mm. The
surface profiles of the specimens, which are presented in Fig. 8 also confirm these observations. The
damaged areas on the surface of the attacked specimens (see Fig. 3 and Fig. 7) have disc shapes and they
contain various ring shaped damage zones which reflect the damaging mechanism (from plastic
deformation to erosion). The diameter of these rings are depending on the nozzle diameter and the non-
dimensional standoff distance ( out/ dx ). These rings can also be related to the bubble distribution in the
jet cross-sections, to the bubble contents, and to the pressure distribution in the whole test chamber. At
the center of the rings an erosion-free area can be observed. In this stagnation zone the fluid and bubble
velocities are reduced to almost zero and due to the low impact energy of the bubbles no erosion takes
place here. It is interesting to note that a similar ring shaped erosion pattern could be observed for
submerged solid particle erosion as well (Mansouri et al. 2015).
Table 2. Test conditions for the investigation of varying nozzle diameters with 1800 s exposure time.
Nozzle outlet
diameter (d)
[mm]
Upstream
pressure (P1)
[MPa]±0.1
Downstream
pressure (P2)
[MPa]±0.01
Flow rate (Q)
[m3/s]
±0.1
Exit-Jet
Velocity (Vj)
[m/s]
±0.5
Cavitation
number (σ) [-]
±0.001
0.60 16.534
0.420 3.25E-05 115.0 0.048
16.700 3.27E-05 115.6 0.047
0.55 16.534
0.368 2.57E-05 108.0 0.045
16.700 2.58E-05 108.5 0.045
0.45 16.534
0.320 1.92E-05 121.0 0.029
16.700 1.93E-05 121.6 0.029
0.40 16.534
0.308 1.47E-05 117.3 0.030
16.700 1.48E-05 117.9 0.029
Fig. 7. Optical microscopy images from the damaged specimens to illustrate the influence of nozzle
diameter on the erosion rate, erosion area and surface roughness (d = dout).

7
Sampling length, mm
Pro
file
gra
ph
, µ
m
-120.0
-80.0
-40.0
0.0
40.0
80.0
120.0
0 1 2 3 4 5 6 7 8 9 10 11
dout = 0.4mm
Sampling length, mm
Pro
file
gra
ph
, µ
m
-120.0
-80.0
-40.0
0.0
40.0
80.0
120.0
0 1 2 3 4 5 6 7 8 9 10 11 12
dout = 0.45mm
Sampling length, mm
Pro
file
gra
ph
, µ
m
-120.0
-80.0
-40.0
0.0
40.0
80.0
120.0
0 1 2 3 4 5 6 7 8 9 10 11 12 13 14 15
dout = 0.55mm
Sampling length, mm
Pro
file
gra
ph
, µ
m
-120.0
-80.0
-40.0
0.0
40.0
80.0
120.0
160.0
0 1 2 3 4 5 6 7 8 9 10 11 12
dout = 0.6mm
Fig. 8. Surface profiles of the damages specimens tested with four different nozzle diameters.
(a) (b)
Fig. 9. The dependence of the weight loss and erosion rate (a) on the nozzle exit diameter (d = dout) and
(b) on the non-dimensional aspect ratio (Ln/dout). The weight loss and erosion rate curves are shown in Fig.9 (a, b) as a function of the nozzle diameter and
the aspect ratio, respectively. Both the weight loss and erosion rate increase with the nozzle diameter,
until reaching their maximum value at d = 0.55 mm (Fig. 9 (a)). Further increase to d = 0.6 mm leads to a
large decrease in both values.
By comparing the results with the parameters of Table 2 interesting observations can be made, namely,
that the measured erosion rate does not correlate clearly with either the exit jet velocities ( JV ) or the
cavitation numbers ( ). For example in the cases of outd = 0.55 , 0.45, and 0.4 mm, the velocities were
not equal, and the erosion rate was higher for outd = 0.55 mm, which had higher cavitation number and
smaller velocity. However, the comparioson of outd = 0.55 mm and outd = 0.6 mm, shows that the
erosion rate was much larger for outd = 0.55, which had smaller jet velocity and lower cavitation number.
Based on these results it can be concluded that 1) the highest erosion rate was observed at the
combination of highest cavitation number and lowest jet velocity; 2) the nozzle geometry dominates over
these two parameters and 3) there is an optimum diameter for the performance of the jets for the
employed the test rig, which in this experiment is estimated to be around outd = 0.55 mm. These
statements are in good accordance with previous works (Hutli, Nedeljkovic, (2008), Soyama, (2011),
Yamaguchi, Kazama, (2000)).
8
In addition, the exit nozzle diameter, which is responsible for the production of a certain jet velocity
(which is also depending on the upstream/injection pressure) determines the energy imparted to the
collision zone on a target surface. By adjusting one or more other parameters, the performance of the
water jet can be controlled, since the power in the jet at the exit of the nozzle is also a function of flow
and nozzle size, as presented in our previous work (Hutli, (2010)). Besides, the jet power is more
sensitive to the changes in the nozzle diameter than to the variation of the injection pressure (Hutt (2004),
and Hutli (2010)). The ratio between the inlet and outlet nozzle diameter is also important in addition the
length of the nozzle, these two parameters are not discussed here. Further investigation is needed to cover
all geometrical parameters. It should also be noted that the obtained results indicate that the used small-
diameter water cutting nozzles (which were originally designed for a water jet cutter) could be used for
metal cutting process by cavitation (cavitating jet cutter) with low power consumption and high cutting
efficiency.
3.3. SEM Investigations
In order to compare the influence of the standoff distance and nozzle diameter on the erosion process, the
treated specimens were investigated with Scanning Electron Microscopy (SEM). The results are presented
in Figs. 10 and 11. After the cumulative exposure time of 1800 s the damage consists of craters and
hollows, which have an irregular shape, different diameter and dept. The craters have multiple rims which
show material ductile displacement and material losses. These complex features of crater morphology
outline the complexity of the hydrodynamic mechanisms involved in cavity collapse. One of the main
reason for this complexity is the collective collapse, which is typically characterized by cascades of
implosions, when multiple cavity bubbles collapse almost in the same place. By studying the SEM
images we can say that the apparent impingement direction of the bubbles seems to be independent from
the main flow direction of the cavitating jet. The visualization of the impinging cavitation jet (cavitation
clouds) shows that these cavities collapse as a ring on the target surface (Fig. 2 and Fig. 3 (b)). The
travelling cavities (which consist of many rings) have an irregular shape defined by the forces around
these cavities and the pressure distribution in that area. Cavities are collapsing on the target surface
frequently, therefore the bubble distribution in the cavity clouds, their shape and their intensity of collapse
are varying and consequently there is no preferential micro jet impingement direction.
For our experiments the exposure time of 1800 s was chosen to be enough to produce a measurable
erosion rate to be able investigate the effect of the geometrical parameters on the erosion rate. In such a
long term test the investigated Cu sample is far beyond the so called incubation time – where only plastic
deformation is done to the surface – and the erosion in this state is steady, which is confirmed by the
SEM images. However, we can also see in the images that plastic deformation is continuously taking
place, even during the erosion phase. In Fig. 11 c) and d) smaller pits can be observed inside the erosion
craters, which resemble the pits which can be observed during the plastic deformation phase during the
initial stages of cavitation damage. These initial pits which are formed during the incubation time period
are produced by individual cavity collapses. The adjoining pits combine together and grow into the depth,
eventually resulting in a large erosion crater, the depth of these craters implies the ability of a material in
absorbing the impact energy. Such initial pits caused by plastic deformation in the initial stages of
cavitation damage can be seen in the AFM images of Fig. 12, after only 15 s exposure time. (The
behavior of the material during the incubation time period and the resulting surface features are
investigated in more detail in our previous publication, Hutli et al 2016). Another characteristic features
of plastic deformation are the slip lines and serpentine lines (Fig. 12), with feature sizes in the micron
range. Such features can also be observed in the SEM images of Figs. 10 and 11. The collapse of cavities
induces shear stresses in adjacent grains, leading to plastic deformation which appears as wavy lines. The
SEM images conclude that the erosion is produced by ductile failure (plastic deformations followed by
crack propagation) and cleavage. The observed damage patters indicate progressive surface
changes/damaging. When the damage is extended to the whole surface in an advanced erosion stage the
cavitation starts to penetrate the material and the damage depth increases (Figs. 10, 11). Inside the craters
and hollows the upper surface layers of the specimen are hardened homogeneously. If the cavitation
attack continues, the same scenario starts over again.
The extent of the observed erosion damage and its relative occurrence (diameter and depth of the craters)
is depending on the nozzle diameter (d) and on non-dimensional standoff distance (X/d). The differences
between the erosion rate obtained for different nozzle diameters or for different non-dimensional standoff
distances are attributed to the differences in the spatial distributions of the cavity bubbles; to the

9
differences in the intensities of collapses and to the rate of shedding and discharging of cavitation clouds
(Hutli E. and Nedejlkovic M. 2007, and Hutli E. et. al. 2013).
Fig. 10. SEM images of the Cu sample measured after 1800 s exposure time at the optimum standoff
distance with different outlet nozzle diameters: (a) 0.4 mm (b) 0.45 mm (c) 0.55 mm.
Fig. 11. SEM images of the Cu sample measured after 1800 s exposure time with different outlet nozzle
diameters: (a) 0.4 mm (b) 0.45 mm (c) 0.55 mm, (d) 0.6 mm.

10
Fig. 12. 3D AFM topography images (right) the Cu specimen before the cavitation test (reference
sample), (middle) and (left) the specimen surface after 15 s cavitation test (only plastic deformation)
(Hutli et al. 2013).
3.4. Cavitation Erosion and the Angle of Attack (o )
Various tests were performed in order to investigate the influence of the angle of attack on the behaviour
of the cavitating jet and on the erosion process. The jet impact angle is defined as the angle between the
axis of the nozzle and the target surface. Since it is not possible to rotate the nozzle in our test rig, in order
to provide different incoming angles, specimens with inclined surfaces were machined as it is shown in
Fig. 13 (a). Fig. 13 (b) shows the representation of a setup where the nozzle can be rotated with respect to
the sample surface. In all tests, the experments were performed under the same hydrodynamical
conditions, with a nozzle diameter of 0.45 mm (convergent nozzle). Specimens were machined from
commercial copper with different surface inclination, ranging from o = 90° to
o = 120° in 5°
increments. The exposure time was 1800 s for each specimen, which was long enough to obtain a
measurable weight loss.
Images of the cavitation jet striking the specimens are presented in Fig. 14. The angle of inclination of the
specimen surface had a significant influence on the erosion rate and the erosion pattern, implying that the
angle of attack is an essential parameter, which needs to be considered when improving the erosion
performance of a system. The quantitative analysis showed that the optimum jet impact angle – where the
erosion rate is maximal – is at o = 105°, as it is shown in Fig. 15. Fig. 16 presents optical microscopy
images of the specimen surfaces, and it can clearly be seen, that the variation in the attack angle affects
the cavitation damage pattern both in shape and in extent.
(a) (b)
Fig. 13. (a) Illustration of our measurement configuration with samples with different surface inclination.
(b) Illustration of a test setup with a rotatable nozzle. In this configuration the non-dimensional stand-off
distance would remain constant, in this sense this would be the ideal solution for the tests.
It can be seen in Fig. 16 that the damage pattern has an assymetric feature and that there is a clear
difference in the degree of erosion between the upper and lower parts of the specimen. Due to the
inclination of the surface, the distance between the nozzle and the surface varies along the sample surface.
In the lower part of the sample, where the X/d parameter is less than optimal, the damage is less
pronounced, compared to the upper parts of the sample. The smaller damage in the lower parts can also
be explained by the higher stagnation pressures in the zone of attack, which forces the bubbles to collapse
Nozzle
+ º
- º
Specimen
Nozzle Flow
dx
= 90º
> 90º

11
before hitting the surface. A similar explanation was presented by Soyama et al. (2012). On the other
hand, in the upper part of the sample, the longer distance allowed more bubbles to be produced and
consequently, the splash drops and shock waves had a pronounced influence on that area. The cavitating
jet acting in this part does not have the possibility to flow backwards, and at the moment of impact a
relative low pressure zone – compared to the lower part of the jet – is produced (i.e. when the lower part
of the jet hits the specimen the resulting radial jet will flow to the upper part and will push away the fluid
from here). This leads to the presence of higher stresses on the surface of the target and thus to a higher
erosion rate. Different modes of erosion may also be noted in Fig. 16, probably as a consequence of the
changes in the shape and distribution of the cavitation. The camera recordings (see Fig. 14), which were
made during these invistigations confirm these statements and show, that a large part of the cavitating jet
was shifted to the upper part of the specimen. This also explains why the degree of erosion and surface
roughness was higher in the upper part.
Fig. 14. Optical camera images of the cavitating jet striking the specimens with different angles of
inclination. The test conditions were the following: convergent nozzle, P1 = 14.6 ± 0.1 MPa, P2 = 0.321 ±
0.001 Mpa, VJ = 113.6 ± 0.5. σ = 0.00342 ± 0.001, T = 25 °C.
Fig. 15. The measured relation between the angle of attack and the erosion rate/weight loss. The test
conditions were the following: convergent nozzle, P1 = 14.6 ± 0.1 MPa, P2 = 0.321 ± 0.001 MPa, VJ =
113.6 ± 0.5. σ = 0.00342 ± 0.001, T = 25 °C.
This observed phenomenon is also in good agreement with the explanation of Chen (2008), based on
numerical analysis and experimental work. The model is built on the analysis of bubble velocities and the
distances between the center of the bubbles and the target surface. When a bubble is moving towards the

12
specimen surface its velocity can be divided into two parts: the one perpendicular to the solid surface is
called the normal velocity, while the other which is parallel to the solid surface is called the tangential
velocity (see the illustration in Fig. 17). The fluid film thickness between the target surface and the bubble
is h. Due to the differences in the velocities of the bubbles and the solid surface, hydrodynamic pressures
are generated in the fluid film between the bubble and the target. The normal velocity produces squeeze
pressure, while the tangential velocity produces dynamic pressure. Both effects increase the pressure in
the fluid film between the bubble and the specimen surface. Because the ratio of normal velocity to
tangential velocity decreases as the inclination angle increases, the squeeze effect produces lower
pressure on the bubble compared to the dynamic effect. Chen et al. (2008) found that, under the condition o = 90o, the hydrodynamic pressure is fully composed of squeeze pressure and it is 125 times larger than
the dynamic pressure, while under the condition o =180o only dynamic pressure exists (Please note, that
the given angles here are rotated 90 o to match our setup as in the illustration of Fig. 17, the setup of Chen
et al. was different). For comparison, in this work the starting angle was 90o and the biggest angle was
120o with increments of 5o.
The hydrodynamic pressures accelerate the collapse process of a bubble and strengthen the micro-jets
generated at the moment of collapse. Numerically they found that, as the inclination angle of the
specimen surface increases the squeeze pressure caused by the normal velocity decreases, whereas the
dynamic pressure caused by the tangential velocity increases. However, the loss of the squeeze pressure
cannot be compensated fully by the increase in the dynamic pressure, which results in a decrease in the
total hydrodynamic pressure. As a result, the number and the size of the erosion pits decrease, i.e. erosion
rate decreases. Our observations are also supported by the results of Blake, Gibson, (1981), and Philipp,
Lauterborn, (1998), since as the position of bubble collapse changes, the force acting on the surface will
be also varying (Fig. 17).
Fig. 16. Optical microscopy images of the eroded samples, which illustrate the dependence of the erosion
pattern on the angle of attack. The test conditions were the following: convergent nozzle, P1 = 14.6 ± 0.1
MPa, P2 = 0.321 ± 0.001 MPa, VJ = 113.6 ± 0.5. σ = 0.00342 ± 0.001, T = 25 °C.
13
u
v
Bubbles
TA
RG
ET
h1
h2
h3
H1
H2
H3
1
2
3
U
z
y
x
ϴ o
Fig. 17. Illustration of the hydrodynamic pressures of the bubbles generated in the fluid film near the
solid surface.
The main influences of the attack angle on the erosion process can be summarized as the following:
1. The stagnation pressure could be uniform only at an angle of 90o. This uniformity changes if the
surface has inclination.
2. The fluid film layer has almost the same thickness along the target surface area, while, when the
surface has inclination, this film thickness will not be equal along the surface.
3. The non-dimensional standoff distance is constant at the angle of 90o, while this value will not be
constant as the inclination angle changes.
4. As a result of the variations in X/d with the angle, the jet will strike the nearest part first (smallest X/d),
splash, and as a result, most of the jet will be pushed up to the upper part of target surface. Thus many
bubbles will collapse on this upper part of the target (see Fig. 16), leading to more pronounced damage
here, and a generally increased erosion rate. Also the splash will cause a change in the erosion area
pattern.
5. In parallel, the shape of the cavitating ring is losing it symmetry (from a nearly circular regular ring to
a deformed ring) as the inclination of the surface is increased. As a result, the erosion pattern also changes
its shape to a deformed ring.
6. The ratio between the normal/tangential jet velocities and corresponding squeeze/dynamic pressures
change with the surface inclination. As the inclination increases the loss of the squeeze pressure results in
the decrease in the total hydrodynamic pressure which causes smaller erosion rates.
The existence of an optimum angle ( Optimumo ), where the erosion rate is maximal, could be related to a
combination of these listed factors, since they have and influence on the two most important parameters
regarding cavitation erosion: the shape of the bubbles and the pressure distribution around them. Based on
the results, as the surface inclination increases, first the variation in X/d and the effect of the smaller
stagnation zones and cavitation ring distortion dominate (points 4-5), which cause an increase in the
erosion rate. By increasing the inclination above the optimum, the effect of smaller hydrodynamic
pressures (point 6) will dominate which causes a drop in the erosion rate.

14
4. Conclusions
The cavitation erosion process was investigated in relation to the geometrical parameters of the test
instrument. It was found that the non-dimensional standoff ratio, the non-dimensional aspect ratio, the
nozzle geometry and the angle of attack have significant influence on the erosion rate, and that it is
possible to define an optimal standoff distance, nozzle diameter and incidence angle where the erosion
rate is the largest. The experiments with different nozzle diameters showed, that the nozzle geometry
dominates over the other tested parameters. It was also demonstrated that the angle of attack influences
the distribution of the pressure on the target surface which leads to an asymmetric erosion pattern and
distribution of surface roughness. The maximum erosion rate was achieved at 105o at the given
hydrodynamic and geometric conditions.
Acknowledgements
The authors would like to thank the Faculty of Engineering, University of Kragujevac, Serbia, for the
assistance in the measurements of the surface profiles, as well as the Ministry of Science, for support
through the Grant TR35046. The authors express their thanks for Dr. Zoltan Hozer at Centre of Atomic
Energy Research in Hungary for his valuable comments for the first author during writing the paper. The
authors are grateful for the help of Dr. Tamás Hurtony from EFI-Labs (Hungary) for the SEM
investigations. Attila Bonyár is grateful for the János Bolyai Scholarship.
Nomenclature
= Cavitation number – defined as:
2ref
vref
2
1.
.
ρu
ppσ
JVAQu /ref = Reference velocity (m/s)
refp = Reference pressure (Mpa) = P2 1P = Upstream pressure (Mpa)
vp (T) = saturation (vapour) pressure (Mpa) 2P = Downstream pressure (Mpa)
(T) = Density of the liquid (kg/m3) ΔW= Weight loss (mg)
T – temperature [°C] Δt =Exposure time (h, s)
x – Stand-off distance (mm) )( 21 PPkQ (m3/s)
A = Nozzle cross-section area (m2)
nL = Nozzle length (mm)
K = Constant, depends on the nozzle diameter and
geometry; (m3/s Pa0.5)
ind = Inlet nozzle diameter (mm) outd = Outlet nozzle diameter (mm)
out/ dLn = Non-dimensional aspect ratio
3,2,1h = Distance between the bubble center and
target surface
out/ dx = Non-dimensional standoff distance
References
1- Soyama H, Ikohagi T, and Oba R., 1994, “High-Speed Cavitation-Cloud Observations around
High-Speed Submerged Water Jets”, 2nd International Symposium on Cavitation, Tokyo, Japan,
pp. 225–230.
2- Kwok, C.T., Man,H.C., and Leung, L.K., 1997, “Effect of Temperature, pH and Sulphide on the
Cavitation Erosion Behaviour of Super Duplex Stainless Steel”, Wear, 211, pp. 84–93.
3- Soyama, H., 2005, “High–Speed Observation of a Cavitating Jet in Air”, ASME J Fluid Eng.,
127, pp. 1095–1101.
4- Hutli, E., and Nedeljkovic, M., 2008, “Frequency in Shedding/Discharging Cavitation Clouds
Determined by Visualization of a Submerged Cavitating Jet”, ASME J Fluid Eng., 130, pp.
561–568.
5- Soyama, H., 2011, “Enhancing the Aggressive Intensity of a Cavitating Jet by Means of the
Nozzle Outlet Geometry”, ASME J Fluid Eng, 133, pp. 1-11. DOI:10.1115/1.4004905

15
6- Karimi, A., and Martin, J., 1986, “Cavitation Erosion of Materials”, International Metals
Reviews, 31, pp.1–26.
7-
8-
Deng Li, Yong Kang, Xiaochuang Wang, Xiaolong Ding, Zhenglong Fang, 2016,
“Effects of nozzle inner surface roughness on the cavitation erosion characteristics of
high speed submerged jets”, Experimental Thermal and Fluid Science 74, pp. 444-452. Field, J.E., et al, 2012, “Cavitation in Impacted Drops and Jets and the Effect on Erosion
Damage Thresholds”, Wear, 290–291, pp. 154–160.
9- Yamaguchi, A., and Shimizu, S., 1987, “Erosion Due to Impingement of Cavitating Jet”, ASME
J Eng Mater, 109, pp. 442–447
10-
11-
Soyama, H., 2004, “Introduction of Compressive Residual Stress Using a Cavitating jet in Air”,
ASME J Eng Mater, 126, pp. 123–128.
Matevz Dular, Martin Petkovšek, 2015, “On the mechanisms of cavitation erosion –
Coupling high speed videos to damage patterns”, Experimental Thermal and Fluid
Science 68, pp. 359–370.
12- Soyama, H., and Asahara,M.,1999, “Improvement of the Corrosion Resistance of a Carbon
Steel Surface by a Cavitating Jet”, Journal of Material Science Letters, 18, pp. 1953– 1955
13-
14-
Minguan, Y., et al, 2013, “Effect of Geometrical Parameters on Submerged Cavitation
JetDischarged from Profiled Centralbody Nozzle”,Chinese Journal of Mechanical Engineering,
Vol. 26, pp. 1-7, DOI: 10.3901/CJME.2013.
SangKi Chi, JinHwan Park, MinYoung Shon, 2015, “Study on cavitation erosion
resistance and surface topologies of various coating materials used in shipbuilding
industry”, Journal of Industrial and Engineering Chemistry 26, pp. 384–389.
15- Yamaguchi, A., and Kazama, T., 2000, “Effects of Configuration of Nozzles, Outlets of
Nozzles and Specimens on Erosion Due to Impingement of Cavitating Jet”, Proc. 48th National
Conference on Fluid Power, USA, pp. 263-272.
16- Soyama, H. et al, 2012, “Optimum Injection Pressure of a Cavitating Jet for Introducing
Compressive Residual Stress into Stainless Steel”, Journal of Power and Energy Systems, Vol.
6, pp63-75, DOI: 10.1299/jpes.6.63
17- Hutli, E., and Nedeljkovic, M., and Radovic, N., 2008, “Mechanics of Submerged Jet Cavitating
Action: Material Properties, Exposure Time and Temperature Effects on Erosion”, Archive of
Applied Mechanics, 78, pp. 329-341.
18- Song, L., and Abraham, J., 2003, “Entrainment Characteristics of Transient Turbulent Round,
Radial and Wall-Impinging Jets: Theoretical Deductions”, ASME J Fluid Eng, 125, pp. 605–
612.
19- Vijay, M., Zou, C., and Tavoularis, S., 1991, “A Study of the Characteristics of Cavitating
Water Jets by Photography and Erosion”, Jet Cutting Technology-Proceeding of the 10th
International Conference, Elsever Science Publishers Ltd., pp. 37–67.
20- Sun, Z., Kang, X.Q., and Wang, X.H., 2005, “Experimental System of Cavitation Erosion with
Water-Jet”, Materials and Design, 26, pp. 59–63.
21- Soyama, H., et al, 1998, A New Calibration Method for Dynamically Loaded Transducers and
Its Application to Cavitation Impact Measurement. ASME J Fluid Eng, 120, pp.712–8.
22- Hutli, E., Nedeljkovic, M., and Ilic, V., 2010, “An Experimental Investigation of Cavitating Jet
Dynamic Power and Cavitation Intensity”, ASME International Mechanical Engineering
Congress and Exposition, vol 7: Fluid Flow, Heat Transfer and Thermal Systems, Vancouver,
British Columbia, Canada, ISBN: 978-0-7918-4444-1
23- Hutt, R., Mioa, B., and Hutt, D., 2004, “Literature review: Noise from High Pressure Water
Jetting”, Harpur Hill, Buxton, Derbyshire, SK17 9JN, UK,HSL(2004/15)
http://www.hse.gov.uk/research/hsl_pdf/2004/hsl0415.pdf
24- Knapp, R.T., Daily, J.W., and Hammitt, F.G.,1970, “Cavitation”, McGraw-Hill, New York, pp.
349–351
25- Chen, H.S., et al, 2008, “Effect of Hydrodynamic Pressures near Solid Surfaces in the
Incubation Stage of Cavitation Erosion”, Proceedings of the Institution of Mechanical
Engineers, Part J: Journal of Engineering Tribology, 222, pp. 523-531.
26- Plasset, M.S., and Devine, R.E., 1996, “Effect of Exposure Time on Cavitation Damage”,
ASME J Basic Eng, 88, pp. 691-705.
27- Blake, J.R., and Gibson, D.C., 1981, “Growth and Collapse of a Vapor Cavity Near a Free

16
Surface”, Journal of Fluid Mechanics, 111, pp. 123-140.
28-
Philipp,A., and Lauterborn,W., 1998, Cavitation Erosion by Single Laser Produced Bubbles,
Journal of Fluid Mechanics, 361, pp. 75-116
29- Hart D., and Whale D.,(2007), A Review of Cavitation-Erosion Resistant Weld Surfacing
Alloys for Hydroturbines, Eutectic Australia Pty. Ltd., Sydney, 2007
https://www.castolin.com/sites/default/files/publications/files/CaviTec_0.pdf
30- Montalváo e Silva, J. M., Pina da Silva, F. A. , (1990), Vibration and Wear in High Speed
Rotating Machinery, NATO ASI Series, Series E: Applied Sciences· Vol. 174, PART 11-
Erosion, Fretting Wear and Vibrations Fundamentals, pp 135-152, Kluwer Academic
Publishers
31- Hutli,E.,etal.,(2013) Nano-and micro scale surface modification of FCC metal using high
submerged cavitating water jet. Plasmonics 8(8),pp. 843–849.doi:10.1007/s11468-013-9481-6.
32- Hutli E. et al. (2013), Influences of Hydrodynamic Conditions, Nozzle Geometry on
Apprearance of High Submerged Cavitating Jets, Thermal Science – International Scientific
Journal, Vol. (17)(4), pp.1139 – 1149
33-
34-
Hutli, E. et al.,(2016), The ability of using the cavitation phenomenon as a tool to modify the
surface characteristics in micro- and in nano-level, Tribology International Vol.(101), pp.88–97
A. Mansouri, H. Arabnejad, S.A. Shirazi, B.S. McLaury (2015), A combined CFD/experimental
methodology for erosion prediction, Wear, 332-333. pp. 1090-1097