Experimental Study on Creep Behavior and Crack Evolution ...
29
Research Article Experimental Study on Creep Behavior and Crack Evolution of Stratified Structural Sandstone under Segmental Constant Load Yiran Yang , 1 Yanzhong Li , 2 Jiaojiao Pan , 1 Tao Luo , 1 and Zidong Lu 3 1 Shaanxi Key Laboratory of Safety and Durability of Concrete Structures, School of Civil Engineering, Xijing University, Xi’an, Shaanxi Province 710123, China 2 State Key Laboratory of Mining Response and Disaster Prevention and Control in Deep Coal Mines, College of Mechanical Engineering, Anhui University of Science and Technology, Huainan, Anhui Province 232001, China 3 Yunnan Branch of Jianyin Engineering Consulting Co., Ltd., Kunming, Yunnan Province 650011, China Correspondence should be addressed to Yanzhong Li; [email protected] Received 21 April 2021; Accepted 20 July 2021; Published 12 August 2021 Academic Editor: Yonghui Wu Copyright © 2021 Yiran Yang et al. This is an open access article distributed under the Creative Commons Attribution License, which permits unrestricted use, distribution, and reproduction in any medium, provided the original work is properly cited. The hazards induced by stratified rock mass creep are still one of the major problems that threaten the safety of underground engineering. This paper takes safe construction of underground roadway in Urumqi mining area as the research background. In this study, we mainly adopted rock mechanics experiments to accomplish the research on creep behavior and crack evolution of stratified structural sandstone. Creep deformation characteristics of stratified structural sandstone under different load were revealed; also, we analyzed the reason why a part of rock samples failed but others were not under the same load. Creep behavior and crack evolution of rock samples without stratified structure have significant randomness. The crack evolution and failure characteristics of stratified structural rock samples were mainly manifested as failure along and cutting through structural plane and their combined forms. Creep strain, creep duration, and creep rate of rock samples with stratified structure had a nonlinear relationship with applied load, such as exponential function or logarithmic function. Understanding the evolutionary relationship between the above parameters and load provides a basis for obtaining the creep behavior of stratified rock mass under different load conditions. 1. Introduction Creep of rock is common in the underground engineering, which leads to time-sensitive characteristics of crack evolu- tion in rock deformation [1–3]. In terms of deep rock engineering construction, the service time of large under- ground tunnel increases obviously, and the general expected life is from several decades to more than a hundred years. Therefore, it is necessary to consider time-dependent proper- ties of rock mass in the design, construction, and routine maintenance [4–6]. Particularly when in situ stress is less than short-term strength of rock mass and original layered structure exists in the rock mass, it is easy to generate creep and crack propagation [7, 8]. Therefore, it is important for disaster control to study the development of creep deforma- tion and crack evolution of deep rock mass. An experimental study is an effective method to obtain the creep behavior and typical parameters of rock mass, which is widely favored by researchers due to its advantages of rapidity and intuitive. Especially in recent years, with improvement and upgrading of experimental equipment, application scope of experimental research has been pro- moted and expanded to a large extent. Researchers optimized and improved experimental equipment according to their requirements, which accelerated the process of rock mass creep research. Liu et al. [9] studied creep behavior and char- acteristic of saturated rock under high stress in uniaxial single-stage load and graded incremental cyclic load mode, providing a basis for deformation control and disaster relief of deep saturated rock mass. Dubey and Gairola [10] used experimental means to study the influence of internal anisot- ropy of rock salt on its creep behavior and control effect. Hindawi Geofluids Volume 2021, Article ID 5762201, 29 pages https://doi.org/10.1155/2021/5762201
Transcript of Experimental Study on Creep Behavior and Crack Evolution ...

Research ArticleExperimental Study on Creep Behavior and Crack Evolution ofStratified Structural Sandstone under Segmental Constant Load
Yiran Yang ,1 Yanzhong Li ,2 Jiaojiao Pan ,1 Tao Luo ,1 and Zidong Lu 3
1Shaanxi Key Laboratory of Safety and Durability of Concrete Structures, School of Civil Engineering, Xijing University, Xi’an,Shaanxi Province 710123, China2State Key Laboratory of Mining Response and Disaster Prevention and Control in Deep Coal Mines, College ofMechanical Engineering, Anhui University of Science and Technology, Huainan, Anhui Province 232001, China3Yunnan Branch of Jianyin Engineering Consulting Co., Ltd., Kunming, Yunnan Province 650011, China
Correspondence should be addressed to Yanzhong Li; [email protected]
Received 21 April 2021; Accepted 20 July 2021; Published 12 August 2021
Academic Editor: Yonghui Wu
Copyright © 2021 Yiran Yang et al. This is an open access article distributed under the Creative Commons Attribution License,which permits unrestricted use, distribution, and reproduction in any medium, provided the original work is properly cited.
The hazards induced by stratified rock mass creep are still one of the major problems that threaten the safety of undergroundengineering. This paper takes safe construction of underground roadway in Urumqi mining area as the research background. Inthis study, we mainly adopted rock mechanics experiments to accomplish the research on creep behavior and crack evolution ofstratified structural sandstone. Creep deformation characteristics of stratified structural sandstone under different load wererevealed; also, we analyzed the reason why a part of rock samples failed but others were not under the same load. Creepbehavior and crack evolution of rock samples without stratified structure have significant randomness. The crack evolution andfailure characteristics of stratified structural rock samples were mainly manifested as failure along and cutting through structuralplane and their combined forms. Creep strain, creep duration, and creep rate of rock samples with stratified structure had anonlinear relationship with applied load, such as exponential function or logarithmic function. Understanding the evolutionaryrelationship between the above parameters and load provides a basis for obtaining the creep behavior of stratified rock massunder different load conditions.
1. Introduction
Creep of rock is common in the underground engineering,which leads to time-sensitive characteristics of crack evolu-tion in rock deformation [1–3]. In terms of deep rockengineering construction, the service time of large under-ground tunnel increases obviously, and the general expectedlife is from several decades to more than a hundred years.Therefore, it is necessary to consider time-dependent proper-ties of rock mass in the design, construction, and routinemaintenance [4–6]. Particularly when in situ stress is lessthan short-term strength of rock mass and original layeredstructure exists in the rock mass, it is easy to generate creepand crack propagation [7, 8]. Therefore, it is important fordisaster control to study the development of creep deforma-tion and crack evolution of deep rock mass.
An experimental study is an effective method to obtainthe creep behavior and typical parameters of rock mass,which is widely favored by researchers due to its advantagesof rapidity and intuitive. Especially in recent years, withimprovement and upgrading of experimental equipment,application scope of experimental research has been pro-moted and expanded to a large extent. Researchers optimizedand improved experimental equipment according to theirrequirements, which accelerated the process of rock masscreep research. Liu et al. [9] studied creep behavior and char-acteristic of saturated rock under high stress in uniaxialsingle-stage load and graded incremental cyclic load mode,providing a basis for deformation control and disaster reliefof deep saturated rock mass. Dubey and Gairola [10] usedexperimental means to study the influence of internal anisot-ropy of rock salt on its creep behavior and control effect.
HindawiGeofluidsVolume 2021, Article ID 5762201, 29 pageshttps://doi.org/10.1155/2021/5762201
They believed that structural anisotropy had a strong con-trol effect on the development of instantaneous strain,transient strain, steady strain, and accelerated strain, andthe influence of structural anisotropy on rock salt deforma-tion had a negative correlation with the stress level. Zivaljevicand Tomanovic [11] adopted a uniaxial creep experimentalmethod to analyze the creep characteristics and behavior ofmarl, focusing on the influence of compressive stress precon-solidation level and load time on the creep parameters ofmarl. Pellet and Fabre [12] carried out static, quasistatic,and cyclic creep experiments on sedimentary rock, and theresults showed that the content of clay particles had a signif-icant impact on the creep behavior, and the creep of particleshad an adverse effect on the creep behavior. Rahimi andHosseini [13] carried out triaxial creep experiments onthick-walled hollow columnar rock salt samples to studythe effects of confining pressure, eccentricity stress, andstrain rate on the creep behavior of rock salt. The resultsshowed that the strain rate increased with the increase ofeccentricity stress and confining pressure, and the lateralpressure was more important than the eccentricity stress inthe change of tangential strain rate. Grgic and Amitrano[14] studied the influence of water saturation on rock creepby multistep uniaxial creep experiments of polycrystallineporous rocks under partially saturated conditions andexplained the important role of microcrack in the creepprocess by analyzing strain and acoustic emission monitor-ing data.
Nadimi et al. [15] carried out triaxial creep experimentson the rock and obtained the creep characteristics of the rockmass around the cave. They estimated the parameters of adynamic constitutive creep model by using the creepexperiment and field measured data, which made it possi-ble to simulate the primary and secondary creep zones ofrock mass. The calculated results are in good agreementwith the measured data, providing a theoretical basis forthe support design of underground engineering. Herrmannet al. [16] explored the creep behavior and mechanism ofdifferent types of shale through the creep experimentalmethod under high confining pressure and variable temper-ature control. The results showed that under high tempera-ture, axial differential pressure stress, and low confiningpressure, the creep strain of shale increased. The initial creepstrain was related to the mechanical properties determinedby short-term constant strain rate experiments, such as staticYoung’s modulus and triaxial compressive strength. Rybackiet al. [17] simulated the occurrence environment of shaleunder high stress, high temperature, and low constraintconditions caused by the increase of field depth. The resultsshowed that the sample exhibited semibrittle creep withhigh deformation rate, and the strain was mainly regulatedby the deformation of weak organic matter, layered silicate,and the reduction of pore space. Bhat and Bhandary [18]improved the torsional ring shearing instrument, measuredthe displacement variation with time under constant creepstress, studied the creep behavior of typical clay in theresidual state, and proposed the creep failure predictioncurve in the residual state, which provided a basis for theprediction of creep landslide failure time and displacement.
Bagheri et al. [19] conducted triaxial creep experiments onclay samples under different shear stress levels and strainrates, measured their volumetric strain rates, and deter-mined the relationship between the nonlinear variation ofstress and initial volumetric strain rates.
Fabre and Pellet [20] carried out creep experiments onargillaceous rocks under a variety of stress environmentsand found that the overall mechanical properties of argilla-ceous rocks deteriorated rapidly when the cracks propagatedunsteadily, and the creep of clay particles caused viscoplasticstrain. Brantut et al. [21] proposed a micromechanicalmodel that could describe the brittle creep of saturated rockunder triaxial stress with time and studied the micromecha-nics of brittle creep. Davis et al. [22] carried out triaxial com-pression experiments on dolomites with different particlesizes under variable temperature conditions and revealedthe differences of creep mechanism between coarse-graineddolomites and fine-grained dolomites with different grainsizes. Smit et al. [23] studied the structure and microstruc-ture of garnet polycrystals in eclogites and analyzed thecreep mechanism of garnet in eclogites by using opticalmicroscopy, element mapping, and electron backscatterdiffraction. Rybacki and Dresen [24] carried out creep exper-iments on plagioclase samples under dry and wet conditionsand determined two different creep mechanisms of dry andwet plagioclase. Heap et al. [25] studied the creep mecha-nism of pore water in sandstone by using microstructureanalysis, acoustic emission source location, and macroscopiccreep law. Brückl and Parotidis [26] analyzed the deep creepmechanism of slope rock mass with simulation study andpointed out that the main factor controlling the deep creepmechanism was the expansion of subcritical cracks. Bresser[27] obtained the pressure sensitivity and strain rate sensitiv-ity of flow stress through experiments and revealed the creepmechanism of calcite dislocation at high temperature basedon the experimental data of microphysical model. Gratieret al. [28] carried out indentation experiments on quartzcrystals, which provided characteristic time scales for thetransient creep and sealing processes of quartz-rich rocksafter earthquakes.
Researches have carried out experiments on rock with-out primary structures and obtained instructive results[29–31]. However, stratified structural rock mass widelyexists in deep engineering, and it is characterized by struc-tural anisotropy. Related studies have found that structuralanisotropy has a controlling effect on the creep behaviorand crack evolution of rock mass. Therefore, the study oncreep behavior and law of stratified structural rock is ofguiding significance to discover the failure mechanism ofsuch rock mass. Also, it is an important supplement tothe study of rock mechanics. The rock samples used in thisstudy were taken from the surrounding rock of under-ground roadway in Urumqi mining area. Through system-atic creep experiments under different loads, the controleffect of structural anisotropy on creep of stratified struc-tural rock samples was studied. And the degree of differ-ence in deformation rate caused by structural anisotropyin rock samples was analyzed to obtain the creep behaviorand crack evolution of stratified structural rock mass.
2 Geofluids

2. Materials and Methods
2.1. Uniaxial Creep Experiment Procedure and PreliminaryPreparation. The uniaxial creep experiment proposed in thisstudy adopted the measurement method recommended byISRM (2014) and the ASTM (2008). During the experiment,the relative humidity was controlled by saturated sodiumnitrate solution, and the relative humidity should be main-tained at 40% at 20°C. The variation range of relative humid-ity and laboratory temperature was generally maintained at±5.0% and ±1.0°C, respectively.
The THMC rheological test system was mainly used inthe experiment. And, its calibration curve showed that therelationship between the effective stress σe and the appliedstress σ is σe = 0:244σ-0.511 (Figure 1). Other equipmentincluded strain gauges, SWAES digital multichannel acousticemission devices, and digital cameras. Axial strain and radialstrain were measured by strain gauge and DD1 cantileverstrain sensor produced by HBM Company. We used theRMT-150C rock and concrete mechanics test system toconduct the experiment. The size of samples was the sameas the ones used in the creep experiments. The number ofrock samples was 12.
The samples were divided into four groups according tothe differences of their internal structure (Table 1). The com-pressive loads equivalent to 50%, 60%, 70%, and 80% of uni-axial compressive strength (σc) are applied to sampleswithout a stratified structure to simulate the in situ stressstate generated by overburden geological body and tectonicstress in the natural environment. Compressive loads equiv-alent to 30%, 40%, 50%, 60%, 70%, 75%, 80%, and 85% ofuniaxial compressive strength were applied to the samples,respectively. The loads were carried out by stress controlmethod, and the load rate was controlled as 0.01 kN/s. Inthe initial stage of creep experiment, the experimentalparameters were read and recorded at intervals of 1.0min,
5.0min, and 10.0min, and then, the interval was extendedto 0.5-1.0 h in the middle stage of experiment. Finally, atthe end of the experiment, when the rock sample was closeto failure, the reading interval was changed to be 10.0min,5.0min, and 1.0min.
3. Results and Discussion
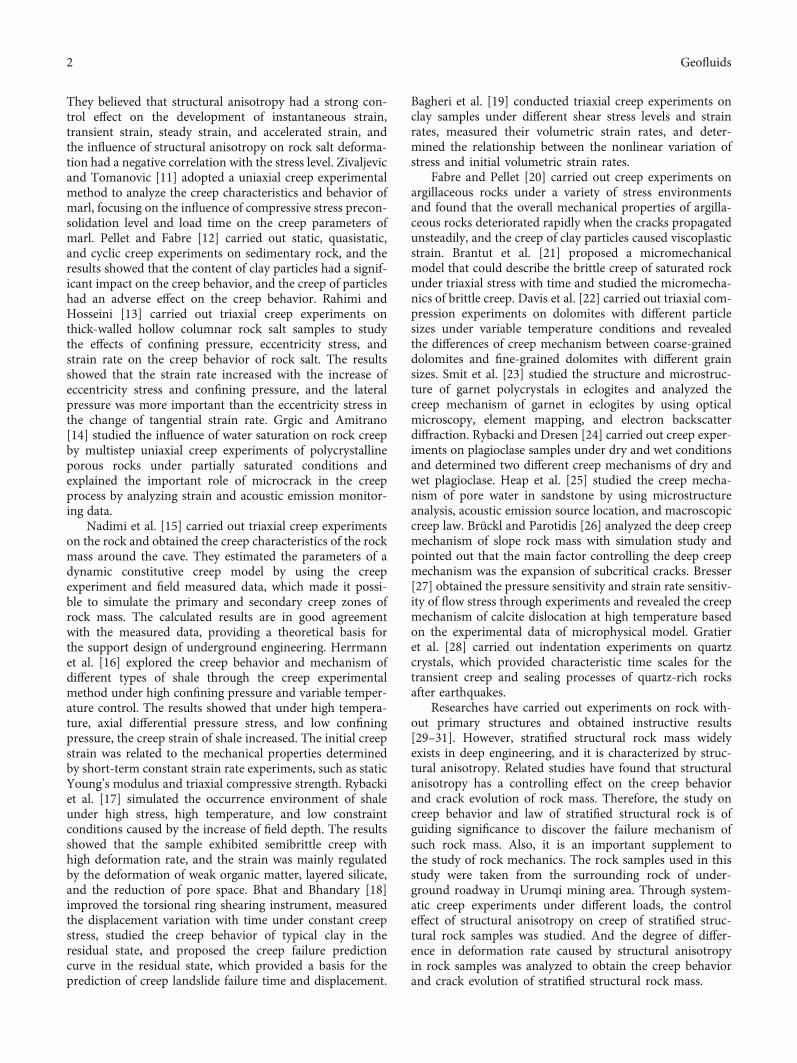
3.1. Creep Characteristics of the USN Rock Samples. Creepexperiments of rock samples without stratified structureswere carried out at stress levels close to the average value ofCi threshold and Cd threshold. In these experiments, the tar-get constant load was applied and maintained by controllingthe axial load, and the strain variation and increment weremonitored and recorded at the same time.
Figure 2(a) shows the state of USN-1 rock sample underload of 50% σc. The sample had the first and second creepstages, in which the sample exhibited such changes as endslag shedding, axial shrinkage, and radial expansion. How-ever, during the experiment lasting for 240.0 h, the creepprocess did not enter the third creep stage but graduallyhad a stable state. Statistical results of AE monitoring datashowed that there was basically no AE signal between15.0 h and 240.0 h, indicating that the evolution of crackinside the sample was gradually weakening. The failure char-acteristics of USN-2 rock sample were obviously random,
40030020010000
25
50
75
100
𝜎 (kN)
𝜎 e(k
N)
Testing platform
Pressurevessel
AE system
Data processingsystem
𝜎e = 0.244𝜎 – 0.511R2 = 0.997
Figure 1: THMC rheological test system for rock.
Table 1: Statistics of rock sample parameters.
Serial number Feature Average angle Amount
USN None None 4
USH Horizontal 2.5° 8
USO Oblique 45.0° 8
USV Vertical 87.0° 8
3Geofluids
The first stage The second stage
USN-1
𝜎 = 20.1 MPa
0.4
0.2
0.0
–0.2
–0.40.1 0.2 80 120 160 200 240
0
6
12
Load
(MPa
)
18
24
Time (h)
Time (h)0
28Ri
ng co
unt
237
Fitted line
Stra
in (%
)
LoadRadial strainAxial strain
(a)
Damaged
USN-2
The first stage The second stage The third stage
Damaged
The first stage The second stage The third stage
0.6
0.2
0.0
–0.2
–0.60.1 0.2 10 30 50 70 90
0
5
Load
(MPa
)
30
Time (h)
Stra
in (%
)
LoadRadial strainAxial strain
10
15
20
250.4
–0.4
Fitted line
𝜎 = 24.1 MPaTime (h)0
30
Ring
coun
t
118
(b)
Figure 2: Continued.
4 Geofluids

and the crack evolution was irregular (Figure 2(b)). Failureof this sample was dominated by oblique crack, and theangle between the oblique crack and the horizontal planewas different in size, which was not statistical. At theintersection of anisotropic cracks, the shallow part of thesample collapsed in layers or small blocks, which acceleratedthe overall failure of the sample. Due to the energy absorp-tion effect, there was no large crack throughout the whole
sample, so the damaged sample still had a certain residualstrength.
Due to the sudden instability of the USN-3 rock sample,the transition characteristics of creep from the second stageto the third stage were not clear (Figure 2(c)). To someextent, this might lead to the overlap of creep stages, whichmade it hard to clearly distinguish the characteristic of eachcreep stage. Failure of the sample was dominated by the
Damaged
The first stage The second stage
The thirdstage
USN-3
0.9
0.3
0.0
–0.3
–0.90.1 0.2 40 50 60 70 80
0
5
Load
(MPa
)
30
Time (h)
Stra
in (%
)
LoadRadial strainAxial strain
10
15
20
250.6
–0.6
Fitted line
Time (h)0
45Ri
ng co
unt
108.9 𝜎 = 24.1 MPa
(c)
USN-4
Damaged
The first stage
The second stage
0.9
0.3
0.0
–0.3
–0.90.1 1 2 3 4 5 6
0
5
Load
(MPa
)
30
Time (h)
Stra
in (%
)
LoadRadial strainAxial strain
10
15
20
250.6
–0.6
Time (h)0
60
Ring
coun
t
94.6
𝜎 = 32.0 MPa
Fitted line
Th thirdstage
(d)
Figure 2: Creep test curve of USN rock samples.
5Geofluids

horizontal and vertical cracks, and the horizontal and verticalpenetrating cracks were generated simultaneously. The over-all failure was relatively complete, and the residual strengthwas almost equal to zero. When USN-4 rock sample beganto break, multidirection cracks were generated on the surfaceof the sample and continued to extend, accompanied bysmall and irregular rock fragments spalling, until the crackswere fully developed to penetrate the sample and resultedin complete failure. Failure of the sample was dominated bythe transverse crack, and the failure part fell off from thesample along the transverse crack in a block shape. The dam-aged part of the sample was pulverized and had minimalresidual strength.
To sum up, there was almost no anisotropic structure inUSN rock samples, and the cracks did not generate ordevelop along a specific direction. The evolution path ofcrack generation, development, and final failure wererandom.
3.2. Discussion of the USN Rock Sample Parameters. Inorder to further study the response of nonstratified structuralsamples under constant load, we studied the viscoelasticparameters, analyzed the experimental data of the USN rocksamples, and revealed the reasons why some rock samplesdid not fail.
Table 2: Viscoelastic parameter estimation results.
Number GK (MPa) GM (MPa) ηK (GPa∗s) ηM (GPa∗s) Stress (MPa) Condition
USN-1 807.2 67.3 9:67E + 11 1:07E + 3 20.3 Undamaged
USN-2 408.1 39.8 6:70E + 11 2:03E + 4 22.9 Damaged
USN-3 604.7 34.6 1:73E + 12 2:64E + 4 25.4 Damaged
USN-4 755.3 11.8 3:11E + 11 8:19E + 4 27.9 Damaged
0.4
0.3
0.2
3𝜂2
𝜎
𝜎 = 20.3 MPa
Stra
in (%
)
0.1
USN-1
Time (min)6040200 80 100 120
q𝜀B𝜀00.0
0.5
0.3
0.2Stra
in (%
)0.1
Time (min)6040200 80 100
0.0
0.4
0.6
0.3
0.2
3𝜂2
𝜎
𝜎 = 25.4 MPa
Stra
in (%
)
0.1
USN-3
USN-2
Time (min)6040200 80 100
q𝜀B𝜀00.0
0.4
0.5
𝜎 = 22.9 MPa
3𝜂2
𝜎
q
𝜀B
𝜀0
1.0
0.6
0.4Stra
in (%
)
0.2
Time (min)6040200 80 100
0.0
0.8
USN-4
3𝜂2
𝜎
𝜎 = 27.9 MPa
q𝜀B
𝜀0
Figure 3: The axial strain-time curve of the USN rock samples.
6 Geofluids
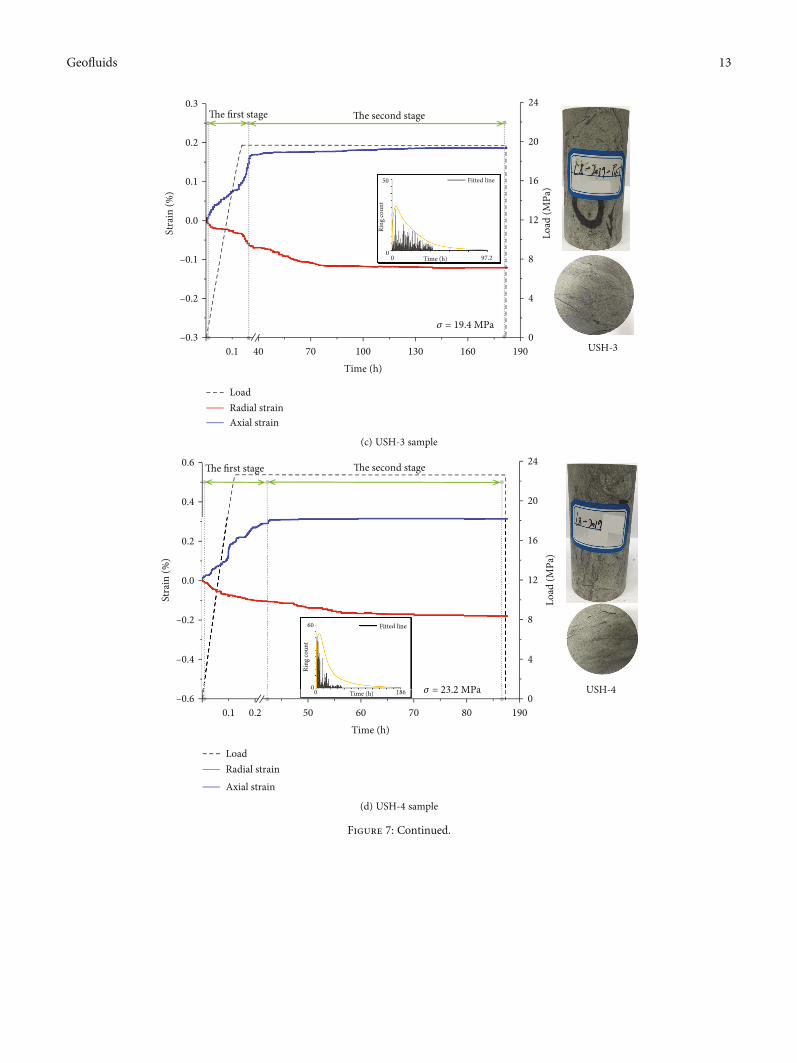
3.2.1. Discussion I: Viscoelastic Parameters of the USN RockSamples. Viscoelastic parameters were estimated for all sam-ples in the experiment. Kelvin shear modulus GK , Maxwellshear modulus GM , Kelvin viscosity ηK , and Maxwell viscos-ity ηM were obtained through parameter estimation(Table 2). In this study, the Goodman method was adoptedto derive the parameters. Figure 3 shows the axial strain-time relationship curve obtained in the constant load exper-iment of the sample without stratified structure. The creep
parameter estimation was based on the fitting of the Burgsmodel with experimental data, which could be achieved byplotting the asymptote of the constant strain rate stage orthe secondary creep stage, then projecting it back to the timezero. And, because of the creep strain, based on the asymp-tote and the intercept of the strain axis, the axial strain atinfinity (εB) can be estimated by parameters. Through theobtained parameters and constant load, Equation (1) toEquation (6) can be solved to obtain the viscoelastic
Undamaged samples
0
0.4
0.8
1.2
1.6
2.0
Frac
ture
inita
tion
stres
s rat
io 𝜎
/Ci
𝜎/Ci = –0.022ln(t) + 2.2R2 = 0.31
0 2.0 10.0 100.0Time (h)
240.0
Ci threshold
Cd threshold
USN groupUSN⁎ group
(a) Evolution law of crack initiation stress ratio
Undamaged samples
𝜎/Cc = –0.013 ln(t) + 0.93R2 = 0.56
Ci threshold
Cd threshold
0
0.2
0.4
0.6
0.8
1.0
Frac
ture
dam
age s
tress
ratio
𝜎/𝜎
c
0 2.0 10.0 100.0Time (h)
240.0
USN group
USN⁎ group
(b) Evolution law of crack damage stress ratio
Figure 4: Evolution law of constant load experiment parameters.
7Geofluids

parameters. The viscoelastic parameters obtained in thisexperiment are shown in Table 2.
ε1 tð Þ = 2σ9K + σ
3GM+ σ
3GK−
σ
3GKe− GK /ηKð Þtð Þ, ð1Þ
εB = σ29K + 1
3G1+ 13G2
� �, ð2Þ
ε0 = σ19K + 1
3G2
� �, ð3Þ
log q = −b ±ffiffiffiffiffiffiffiffiffiffiffiffiffiffiffiffib2 − 4ac
p
2a log σ
3G1+ G13η1
� �, ð4Þ
σ
3G2= εB − σ
29K + 1
3G1
� �, ð5Þ
K = σ
3 ε1 + 2ε3ð Þ , ð6Þ
where ε1 is the axial strain; ε3 is the radial strain; σ is the con-stant axial load; K represents the volume modulus; η1 = ηK ,where ηK is Kelvin viscosity coefficient; η2 = ηM , where ηMis Maxwell viscosity coefficient; G1 =GK , where GK is Kelvinshear modulus; G2 =GM , where GM is Maxwell shear modu-lus; ε0 is the instantaneous axial strain when a constant loadis applied to the sample; and εB is the axial strain at an infinitedistance along the time axis.
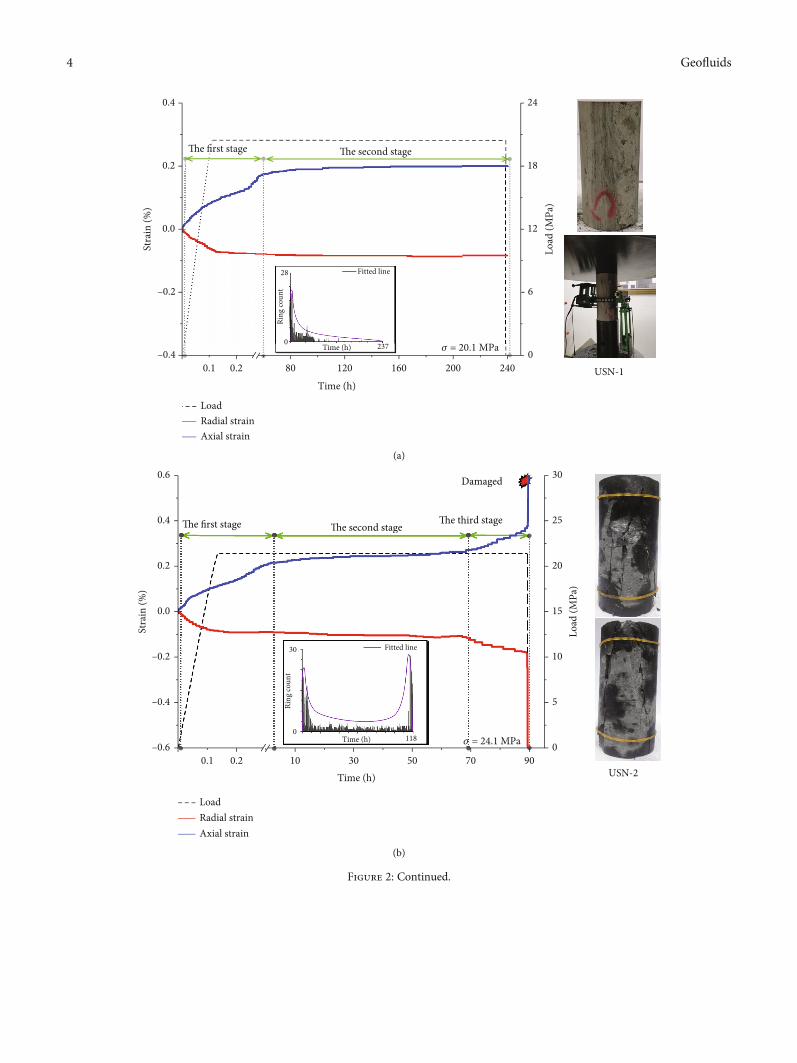
3.2.2. Discussion II: Comparative Analysis of the USN RockSample Experimental Data. In order to obtain the failurelaw of the USN rock samples and the difference of failurelaw with other types of rock, supplementary experimentswere carried out. The sample number of the supplementarygroup was USN∗-1 to USN∗-6. Sampling sources, samplingstandards, and physical and mechanical parameters of rocksamples in this group were the same as those in the USNgroup. During the experiment, the load of 0:4σc to 0:9σcwas applied to the six rock samples of the USN∗ groupwith a gradient of 0:1σc. Crack initiation stress ratio anddriving stress ratio were used to analyze the test results.
The experiment results are shown in Figure 4. The dataare from samples that were damaged during the experi-ment. We summarized the test results in Table 3; experi-ment data of the undamaged samples were included.
As can be seen from Table 3, when the constant load isgreater than 0:8σc, samples will be damaged within 2 hours.When the constant load is less than or close to the Cd thresh-old, the time required for samples to be damaged is longer,generally ranging from several days to one month.
3.2.3. Discussion III: Study on the Failure Cause of the USNRock Samples. In order to study the causes of different failurestates of samples under the same load conditions, the visco-elastic parameters obtained from each constant load experi-ment were correlated with the time t. Figure 5 shows thatwhen GK , ηK , and GM are correlated with time, the failureof only a part of samples under the same load cannot beexplained. However, from the perspective of parametric sig-nificance, since the Kelvin model describes delayed elasticityand Maxwell shear modulus refers to elastic shear modulus,both of which are almost independent of stress, so this resultis predictable.
However, when the experimental data is correlated withMaxwell viscosity (ηM), a clear regularity appears betweenthe two parameters, as shown in Figure 5(d). Maxwell viscos-ity describes the resistance of material to flow. The smallerthe Maxwell viscosity is, the stronger its flow ability is, whichis consistent with the results of this study. The results alsoshow that samples with higher Maxwell viscosity are moreprone to failure, while samples with lower viscosity tend toproduce larger creep and failure in longer time domain dueto its stronger flow ability.
It can be seen from Figure 5(d) that there exists a thresh-old value for Maxwell viscosity, below which rock samplesproduce creep that do not result in cumulative damage. Tofurther explore the above finding, all the current experimentresults were further examined, since the experiment studydoes not include the failure behavior and mechanism of rocksamples under compressive stress less than the Ci threshold.Therefore, in the following study, a group of rock sampleswas added. The additional sample group was named as
Table 3: Statistical results of constant load experimental parameters.
Sample numberDurationt (h)
Stressσ (MPa)
Crack initiationstress ratio (σ/Ci)
Crack damage stressratio (σ/Cd)
Driving stressratio (σ/σc)
Condition
USN-1 240.0 20.3 1.11 0.63 0.51 Undamaged
USN-2 120.3 22.8 1.24 0.70 0.57 Damaged
USN-3 108.7 25.4 1.38 0.78 0.63 Damaged
USN-4 94.2 27.9 1.52 0.86 0.70 Damaged
USN∗-1 240.0 16.1 0.87 0.50 0.40 Undamaged
USN∗-2 186.3 20.0 1.10 0.62 0.50 Damaged
USN∗-3 117.8 24.1 1.31 0.74 0.60 Damaged
USN∗-4 86.2 28.1 1.42 0.87 0.70 Damaged
USN∗-5 4.8 32.4 1.76 1.00 0.80 Damaged
USN∗-6 1.7 36.1 1.96 1.11 0.90 Damaged
8 Geofluids

USN⁎-1
USN-1
0.00
150
300
450
Kelv
in sh
ear m
odul
us G
K (M
Pa)
600
750
900
2.0 10.0Time (h)
100.0 240.0
USN-2 USN-3 USN-4
USN⁎-4 USN⁎-3
USN⁎-2
USN⁎-6 USN⁎-5
(a) Evolution of Kelvin shear modulus
USN⁎-4 USN⁎-3 USN⁎-2
USN⁎-1
USN-1
1E+11
1E+12
1E+13
1E+14
Kelv
in v
iscos
ity 𝜂
K (G
Pa⁎s)
1E+15
USN-2 USN-3 USN-4
USN⁎-6 USN⁎-5
0.00
2.0 10.0 100.0 240.0
(b) Evolution of Kelvin viscosity
Figure 5: Continued.
9Geofluids

USN#, and the amount of samples is 5. Sampling sources,sampling standards, and physical and mechanical parametersof rock samples in this group were the same as those in theUSN∗ group. The samples were subjected to a constant load
of 0:5Ci, 0:6Ci, 0:7Ci, 0:8Ci, and 0:9Ci, respectively. Theexperiments ended with the failure or dead load time reach-ing 720.0 h (30 d). The results showed that when the constantload was greater than the Cd threshold, most of samples
USN⁎-1
USN-1
USN-2 USN-3 USN-4
USN⁎-4 USN⁎-3
USN⁎-2
USN⁎-6 USN⁎-5
20
30
40
60
Max
wel
l she
ar m
odul
us G
M (M
Pa)
70
0.00
2.0 10.0Time (h)
100.0 240.0
50
10
(c) Evolution of Maxwell shear modulus
USN⁎-1
USN-1
USN-2 USN-3 USN-4
USN⁎-4 USN⁎-3
USN⁎-2
USN⁎-6 USN⁎-5
1E+3
1E+4
1E+5
Max
wel
l visc
osity
𝜂K
(GPa
⁎s)
1E+6
0.00
2.0 10.0Time (h)
100.0 240.0
(d) Evolution of Maxwell viscosity
Figure 5: Evolution characteristics of viscoelastic parameters.
10 Geofluids

failed within 24.0 hours due to the crack propagation andinteraction. When the load was below the Ci threshold value,the native cracks inside the sample closed and were con-trolled by elastic strain, and the stress equilibrium state wasestablished inside samples.
When the constant load is between the Ci threshold andthe Cd threshold, as shown in Figure 6, this region is anuncertain region where damage occurs. This is because crackpropagation and damage accumulation usually occur in ashort period of time when the load is between the Ci thresh-old and the Cd threshold. But in the long run, as time goes on,the strength of the rock weakens, leading to its failure. How-ever, there are some samples have not been damaged, and webelieve that these cases can be explained with two reasons:The first one, there exists difference between internal struc-tures of the selected samples and the normal sample, whichleads to a sudden change of the strength and physical andmechanical parameters. The first one, the load on the sam-ples is not maintained for enough time. Due to the historicaland random nature of geological body, it is difficult to elimi-nate the internal structural differences of samples. Therefore,the abnormal samples should be adjusted from the aspect ofoptimizing the experiment time. Data from relevant scholars’literature indicate that failure is expected to occur when thetime axis is extended long enough under a load close to0.7σc. Therefore, a test period of 3 months to 1 year shouldbe planned in the later stage to check the mechanical behav-ior of samples under longer term load.
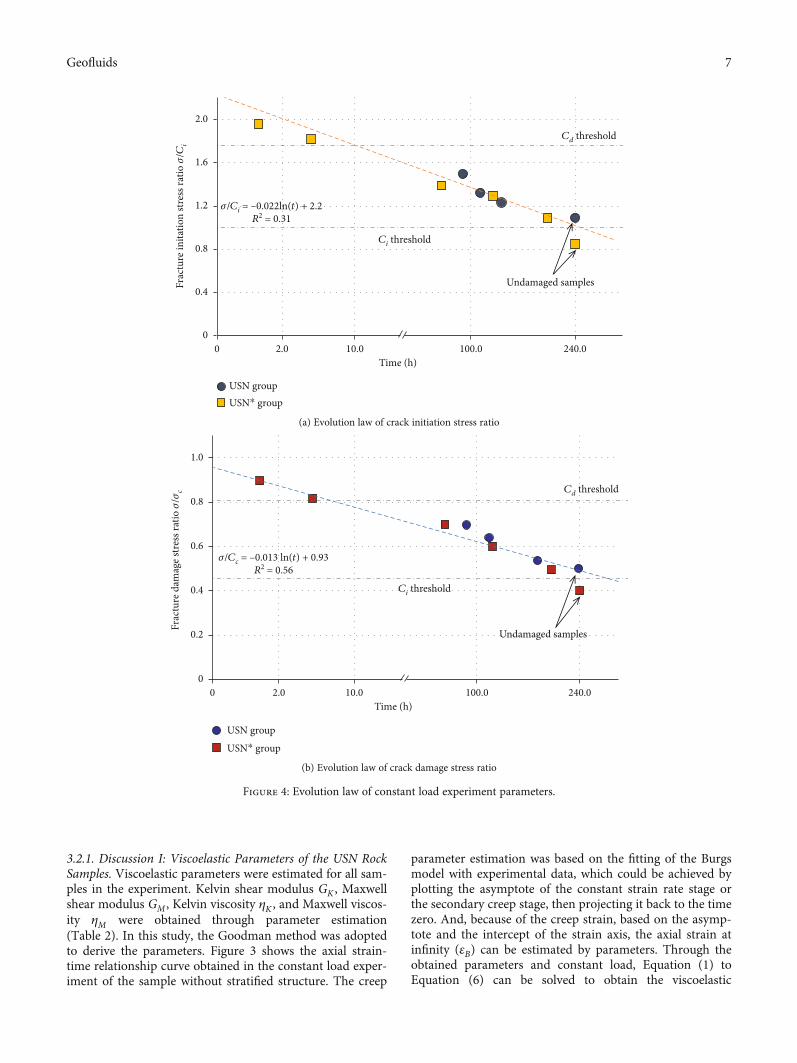
3.3. Experimental Result Analysis of Rock Samples from theUSH Group. Constant load experiments were carried out onrock samples from the stratified structural rock samplegroups. To simulate in situ stress caused by overburden geo-logical body and tectonic stress in the natural environment,compressive load equivalent to 30%, 40%, 50%, 60%, 70%,75%, 80%, and 85% of their uniaxial compressive strengthwas applied to rock samples.
Since the stress applied to the USH-1, USH-2, USH-3,and USH-4 rock sample was close to Ci threshold, the sam-ples had certain elastic deformation at the initial stage. Bothaxial and radial strains increased, and the strain ratedecreased at the end of the elastic deformation stage(Figure 7). When the elastic deformation stopped, the AEsignal began to increase, which indicated that the nativestructures of the samples were damaged and new structuresbegan to be generated. However, due to the fact that the con-stant load was close to Ci threshold, only a small part of weakstructures inside the samples was damaged, and its contribu-tion to the overall deformation of the samples was negligible.After elastic deformation and a small amount of plasticdeformation, the samples began to enter the second creepstage. Due to the relatively low load, the samples only pro-duced negligible deformation at the beginning of this stageand then entered the stress equilibrium state. Constant loadswere maintained on the samples for about 150.0 h; the strainand AE parameters were kept a stable state, which indicatedthat the samples were completely in equilibrium and wouldnot enter the third creep stage.
Since the load exerted on USH-5 to USH-8 sample wasgreater than the Ci threshold, and the load borne by somesamples was even greater than the Cd threshold. The rocksamples had undergone three typical creep stages. With theincrease of load, the slope of time-strain curve increased; thatis, with the increase of load, creep of the samples increased inper unit time. At the same time, with the increase of load, thefailure time decreased and the final deformation increased.Failure modes of the samples were mainly vertical and obli-que cracks which cut through the stratified structural plane,and the angle between the failure structural plane and thehorizontal plane was generally greater than 45°. Amongthem, the USH-7 rock sample showed a lateral bulging failurepattern parallel to the horizontal structural plane. It wasconsidered that the failure was caused by transverse extru-sion of weak material between the horizontal structural
Cd threshold
Undamaged samples
1.0 h0
0.2
0.4
0.6
0.8
Driv
ing
stres
s rat
io, 𝜎
/𝜎c
1.0
24.0 h 720.0 hTime (h)
6.0 months
Damagezone
Uncertainzone
Undamagedzone
Ci threshold
USN#
Figure 6: Comparison of experimental results.
11Geofluids

0.3
0.2
0.0
–0.2
–0.30.1 0.2 70 100 160 190
0
4
8
Load
(MPa
)
10
12
Time (h)
Stra
in (%
)
LoadRadial strainAxial strain
6
2
0.1
–0.1
130
𝜎 = 11.6 MPa
The first stage The second stage
USH-1
11 6 MPTime (h)00
30Ri
ng co
unt
186
Fitted line
(a) USH-1 sample
USH-2
The first stage The second stage 0.3
0.2
0.0
–0.2
–0.30.1 0.2 70 100 160 190
0
6
12Lo
ad (M
Pa)
15
18
Time (h)
Time (h)00
30
Ring
coun
t
186
Fitted line
Stra
in (%
)
LoadRadial strainAxial strain
9
3
0.1
–0.1
130
Time (h)( )000000000
30000
Ring
coun
t
186
Fitted line
𝜎 = 15.5 MPa
(b) USH-2 sample
Figure 7: Continued.
12 Geofluids
USH-3
The first stage The second stage 0.3
0.2
0.0
–0.2
–0.30.1 40 70 100 160 190
0
8
16
Load
(MPa
)
20
24
Time (h)
Stra
in (%
)
LoadRadial strainAxial strain
12
4
0.1
–0.1
130
𝜎 = 19.4 MPa
Time (h)00
50
Ring
coun
t
97.2
Fitted line
(c) USH-3 sample
USH-4
The first stage The second stage 0.6
0.4
0.0
–0.4
–0.60.1 0.2 50 60 80 190
0
8
16Lo
ad (M
Pa)
20
24
Time (h)
Stra
in (%
)
LoadRadial strainAxial strain
12
4
0.2
–0.2
70
𝜎 = 23.2 MPaTime (h)00
60
Ring
coun
t
186
Fitted line
𝜎 = 23 2 MPa0
60
Ring
coun
t
Fitted line
(d) USH-4 sample
Figure 7: Continued.
13Geofluids

Damaged
USH-5
The first stage The second stage
The thirdstage
0.6
0.4
0.0
–0.4
–0.60.1 0.2 40 50 70 80
0
10
20
Load
(MPa
)
25
30
Time (h)
Stra
in (%
)
LoadRadial strainAxial strain
15
5
0.2
–0.2
60
𝜎 = 27.1 MPaTime (h)0
80
Ring
coun
t
76.7
Fitted line
(e) USH-5 sample
Damaged
USH-6
The first stage The second stage
The third stage
DamagedThe first stage The second stage
The third rrrstageee
0.6
0.4
0.0
–0.4
–0.60.1 0.2 20 25 35 40
0
10
20Lo
ad (M
Pa)
25
30
Time (h)
Stra
in (%
)
LoadRadial strainAxial strain
15
5
0.2
–0.2
30
𝜎 = 29.0 MPa
Time (h)0
80
Ring
coun
t
40
Fitted line
(f) USH-6 sample
Figure 7: Continued.
14 Geofluids
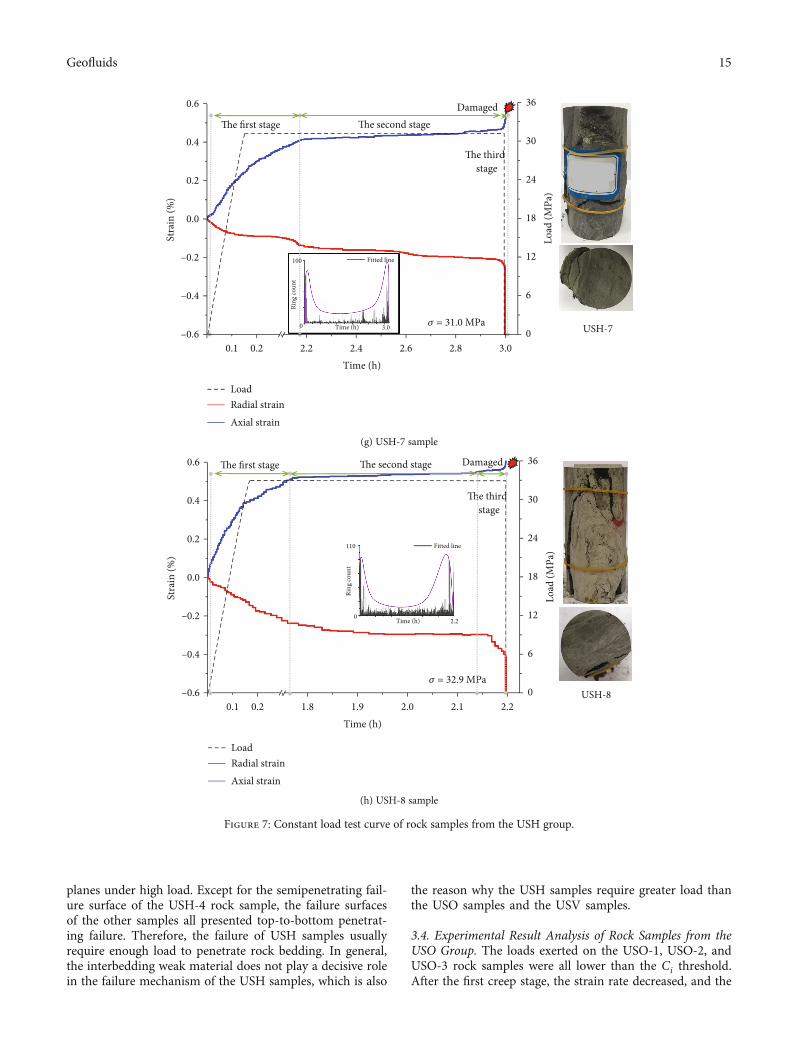
planes under high load. Except for the semipenetrating fail-ure surface of the USH-4 rock sample, the failure surfacesof the other samples all presented top-to-bottom penetrat-ing failure. Therefore, the failure of USH samples usuallyrequire enough load to penetrate rock bedding. In general,the interbedding weak material does not play a decisive rolein the failure mechanism of the USH samples, which is also
the reason why the USH samples require greater load thanthe USO samples and the USV samples.
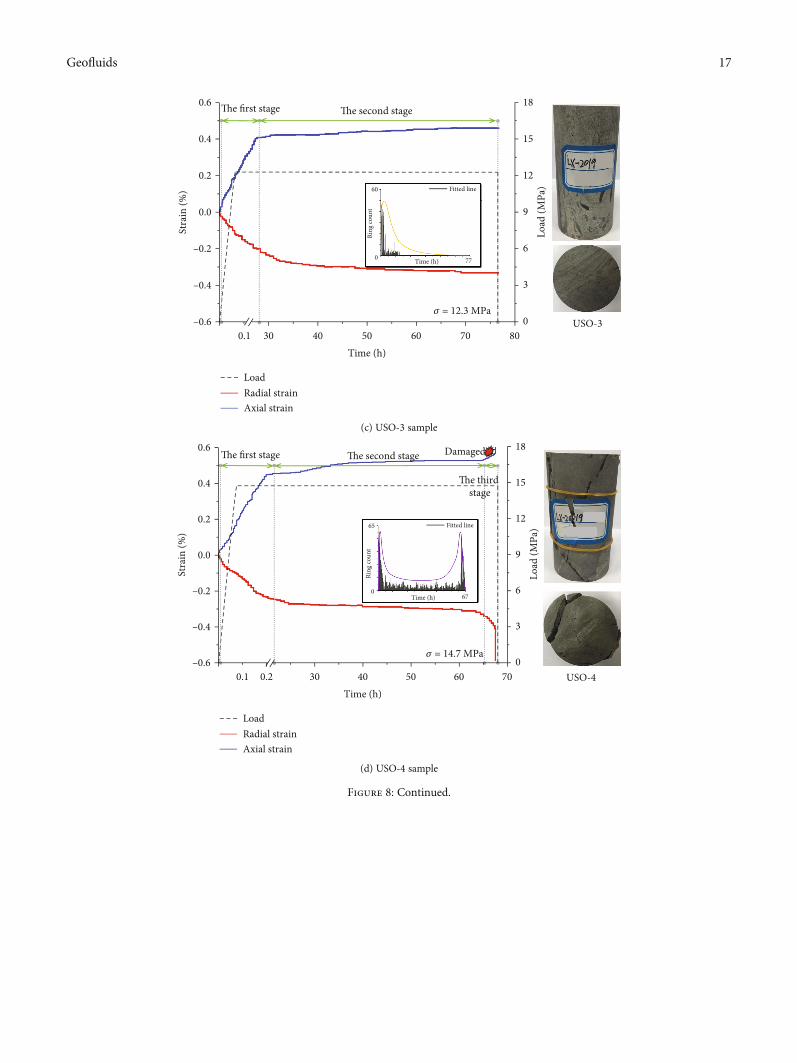
3.4. Experimental Result Analysis of Rock Samples from theUSO Group. The loads exerted on the USO-1, USO-2, andUSO-3 rock samples were all lower than the Ci threshold.After the first creep stage, the strain rate decreased, and the
0.6
0.4
0.0
–0.4
–0.60.1 0.2 2.2 2.4 2.8 3.0
12
24
Load
(MPa
)
30
36
Time (h)
Stra
in (%
)
LoadRadial strainAxial strain
18
6
0
0.2
–0.2
2.6
𝜎 = 31.0 MPaTime (h)0
100
Ring
coun
t
3.0
Fitted line
Damaged
USH-7
The first stage The second stage
The third stage
(g) USH-7 sample
Damaged
USH-8
The first stage The second stage
The third stage
0.6
0.4
0.0
–0.4
–0.60.1 0.2 1.8 1.9 2.1 2.2
12
24Lo
ad (M
Pa)
30
36
Time (h)
Stra
in (%
)
LoadRadial strainAxial strain
18
6
0
0.2
–0.2
2.0
𝜎 = 32.9 MPa
Time (h)0
110
Ring
coun
t
2.2
Fitted line
(h) USH-8 sample
Figure 7: Constant load test curve of rock samples from the USH group.
15Geofluids

USO-1
The second stageThe first stage0.3
0.2
0.0
–0.2
–0.30.1 0.2 75 100 150 175
4
8
Load
(MPa
)
10
12
Time (h)
Stra
in (%
)
6
2
0
0.1
–0.1
125
Time (h)0
35
Ring
coun
t
171
Fitted line
LoadRadial strainAxial strain
𝜎 = 7.4 MPa
(a) USO-1 sample
USO-2
The first stage The second stage 0.3
0.2
0.0
–0.2
–0.30.1 0.2 75 100 150 175
4
8
Load
(MPa
)
10
12
Time (h)
Stra
in (%
)
6
2
0
0.1
–0.1
125
Time (h)0
40
Ring
coun
t
169
Fitted line
LoadRadial strainAxial strain
𝜎 = 9.8 MPa
(b) USO-2 sample
Figure 8: Continued.
16 Geofluids
Fitted line
USO-3
The first stage The second stage 0.6
0.4
0.0
–0.4
–0.60.1 30 40 50 70 80
6
12
Load
(MPa
)
15
18
Time (h)
Stra
in (%
)
9
3
0
0.2
–0.2
60
Time (h)0
60
Ring
coun
t
77
LoadRadial strainAxial strain
𝜎 = 12.3 MPa
(c) USO-3 sample
USO-4
The first stage The second stage
The third stage
Damaged 0.6
0.4
0.0
–0.4
–0.60.1 0.2 30 40 60 70
6
12Lo
ad (M
Pa)
15
18
Time (h)
Stra
in (%
)
9
3
0
0.2
–0.2
50
Time (h)0
65
Ring
coun
t
67
Fitted line
LoadRadial strainAxial strain
𝜎 = 14.7 MPa
(d) USO-4 sample
Figure 8: Continued.
17Geofluids

Damaged
USO-5
The first stage The second stage
The thirdstage
Damaged d The first stage The second stage
The thirdstage
0.6
0.4
0.0
–0.4
–0.60.1 0.2 30 35 45 50
8
16
Load
(MPa
)
20
24
Time (h)
Stra
in (%
)
12
4
0
0.2
–0.2
40
Time (h)00
80
Ring
coun
t
48.6
Fitted line
LoadRadial strainAxial strain
𝜎 = 17.2 MPa
(e) USO-5 sample
Damaged
USO-6
The first stage The second stage
The third stage
0.9
0.6
0.0
–0.6
–0.90.1 10 15 20 30 35
8
16Lo
ad (M
Pa)
20
24
Time (h)
Stra
in (%
)
12
4
0
0.3
–0.3
25
Time (h)0
90
Ring
coun
t
33.5
Fitted line
LoadRadial strainAxial strain
𝜎 = 18.4 MPa
(f) USO-6 sample
Figure 8: Continued.
18 Geofluids

rock samples entered the second creep stage (Figure 8).Deformation rates of the rock samples tended to be zeroand finally reached the stress equilibrium state. At this point,the change rate and the AE signals were both zero, indicatingthat the external deformation and the development of inter-nal cracks of the samples were in a static state, which wouldnot lead to the destruction of the samples.
The samples fromUSO-4 to USO-8 underwent three typ-ical creep stages under the loads greater than the Ci thresholdand the Cd threshold and finally failed. The duration of creep
process was inversely proportional to the load; the final creepstrain and the strain rate in the first creep stage were propor-tional to the load. The failure modes were mainly dividedinto two types, which were sliding along the structural planeand shear failure through the structural plane. Among them,the failure mode of USO-4 sample was a combination of thetwo types. When the load was large enough or there was adefect within the stratified structural plane, the failure pathwould develop along the weak material between beddingplanes. It was also possible to break down the structural plane
Damaged
USO-7
The first stage The second stage
The thirdstage
Damaged The first stage The second stage
The thirdstage
0.9
0.6
0.0
–0.6
–0.90.1 1.5 2.0 2.5 3.5 4.0
8
16
Load
(MPa
)
20
24
Time (h)
Stra
in (%
)
12
4
0
0.3
–0.3
3.0
Time (h)0
110
Ring
coun
t
3.8
Fitted line
LoadRadial strainAxial strain
𝜎 = 19.6 MPa
(g) USO-7 sample
Damaged
USO-8
The first stage The second stage
The thirdstage
0.9
0.6
0.0
–0.6
–0.90.1 1.3 1.4 1.5 1.7 1.8
8
16Lo
ad (M
Pa)
20
24
Time (h)
Stra
in (%
)
LoadRadial strainAxial strain
12
4
0
0.3
–0.3
1.6
Time (h)00
130
Ring
coun
t
1.76
Fitted line
𝜎 = 20.8 MPa
(h) USO-8 sample
Figure 8: Constant load test curve of rock samples from the USO group.
19Geofluids

The first stage The second stage 0.3
0.2
0.0
–0.2
–0.30.1 0.2 55 90 160 195
USV-1
4
8
Load
(MPa
)
10
22
Time (h)
Stra
in (%
)
6
2
0
0.1
–0.1
125
Time (h)0
45
Ring
coun
t
183
Fitted line
LoadRadial strainAxial strain
𝜎 = 10.8 MPa
(a) USV-1 sample
USV-2
The first stage The second stage 0.3
0.2
0.0
–0.2
–0.30.1 0.2 40 70 120 160
6
12Lo
ad (M
Pa)
15
18
Time (h)
Stra
in (%
)
9
3
0
0.1
–0.1
100
Time (h)0
50
Ring
coun
t
153
Fitted line
LoadRadial strainAxial strain
𝜎 = 14.3 MPa
(b) USV-2 sample
Figure 9: Continued.
20 Geofluids

USV-3
The first stage The second stage 0.3
0.2
0.0
–0.2
–0.30.1 30 40 50 70 80
6
12
Load
(MPa
)
15
18
Time (h)
Stra
in (%
)
9
3
0
0.1
–0.1
60
LoadRadial strainAxial strain
Time (h)0
70
Ring
coun
t
76.8
Fitted line
𝜎 = 17.9 MPa
(c) USV-3 sample
Damaged
USV-4
The first stage The second stage
The third stage
0.3
0.2
0.0
–0.2
–0.30.1 0.2 20 25 35 40
8
16Lo
ad (M
Pa)
20
24
Time (h)
Stra
in (%
)
12
4
0
0.1
–0.1
30
LoadRadial strainAxial strain
Time (h)0
75
Ring
coun
t
37.5
Fitted line
𝜎 = 21.5 MPa
(d) USV-4 sample
Figure 9: Continued.
21Geofluids

Damaged
USV-5
The first stage The second stage
The thirdstage
0.6
0.4
0.0
–0.4
–0.60.1 10 15 20 30 35
10
20
Load
(MPa
)
25
30
Time (h)
Stra
in (%
)
15
5
0
0.2
–0.2
25
Time (h)0
90
Ring
coun
t
33
Fitted line
LoadRadial strainAxial strain
𝜎 = 25.1 MPa
(e) USV-5 sample
Damaged
USV-6
The first stage The second stage
The thirdstage
0.6
0.4
0.0
–0.4
–0.60.1 0.2 7.0 9.0 13 15
10
20Lo
ad (M
Pa)
25
30
Time (h)
Stra
in (%
)
15
5
0
0.2
–0.2
11
Time (h)0
100
Ring
coun
t
14.5
Fitted line
LoadRadial strainAxial strain
𝜎 = 26.9 MPa
(f) USV-6 sample
Figure 9: Continued.
22 Geofluids

containing defects and then produce the combined failuremode. The failure mode of USO-7 sample was typical slidingfailure along the structural plane, which was the main failuremode of USO samples. This was mainly due to the fact thatfailure path of the sample was preferred to develop alongweak plane of the structure, while the material sandwichedbetween the stratified structural planes was usually argilla-ceous or argillaceous weak material, in which case the samplegenerally occurred sliding failure along the structural plane.The failure mode of USO-8 sample was the sliding failure
along the structural plane, and the sliding failure part wasin the form of transverse swelling and crack with the failureposition at the center of this section. The main reason wasthat the rock mass was a plate-like structure; the structurewas easy to produce transverse bulging and breaking failurein the direction of the free surface. This is very similar tothe failure mechanism of deep tunnel.
3.5. Experimental Result Analysis of Rock Samples from theUSV Group. USV-1 and USV-2 samples underwent the first
Damaged
USV-7
The first stage The second stage The third
stage
0.9
0.6
0.0
–0.6
–0.90.1 1.2 1.6 1.8 2.2 2.4
12
24
Load
(MPa
)
30
36
Time (h)
Stra
in (%
)
18
6
0
0.3
–0.3
2.0
Time (h)0
115
Ring
coun
t
2.3
Fitted line
LoadRadial strainAxial strain
𝜎 = 28.6 MPa
(g) USV-7 sample
Damaged
USV-8
The first stage The second stage
The third stage
0.9
0.6
0.0
–0.6
–0.90.1 0.2 0.8 0.9 1.1 1.2
12
24Lo
ad (M
Pa)
30
36
Time (h)
Stra
in (%
)
18
6
0
0.3
–0.3
1.0
Time (h)0
140
Ring
coun
t
1.15
Fitted line
LoadRadial strainAxial strain
𝜎 = 20.8 MPa
(h) USV-8 sample
Figure 9: Constant load test curve of rock samples from the USV group.
23Geofluids

and second creep stages under the constant load and finallyreached the stress equilibrium state in the second creep stage(Figure 9).
The failures of USV-3 to USV-8 sample all went throughthree typical creep stages. The creep time was inverselyproportional to the load; the final creep strain and the strainrate in the first creep stage were proportional to the load.
Failure modes of the samples were mainly cross-layer shearfailure along the structural plane and transverse shear failurealong the normal direction of the structural plane. Thespecific failure process was as follows: under constant load,the stress state of the structural plane which was approxi-mately perpendicular to the horizontal direction could besimplified to be the plate structure with fixed supports at both
USH sample: y = 0.0096e0.0439x R2 = 0.9586 USO sample: y = 0.0132e0.045x R2 = 0.9739
USV sample: y = 0.0081e0.0504x R2 = 0.9658
Load (𝜎c %)0
0.0
0.1
0.2
0.3
0.4
0.5
0.6
0.7
Stra
in g
ener
ated
dur
ing
load
incr
ease
stag
e (%
)
10 20 30 40 50 60 70 80 90
USV sample
USO sample
USH sample
Figure 10: Relationship between strain and constant load in the stress increasing stage
USH sample: y = –254.8ln(x) + 1132.1 R2 = 0.9136 USO sample: y = –202.5ln(x) + 900.5 R2= 0.9351 USV sample: y = –117.1ln(x) + 520.7 R2 = 0.8728
Load (𝜎c %)50
0
15
30
45
60
75
90
Dur
atio
n of
stea
dy-s
tate
cree
p sta
ge (h
)
60 70 80 90
USV sample
USO sample
USH sample
Figure 11: Relationship between duration of steady-state creep stage and constant load
24 Geofluids

ends. Under the disturbance of the horizontal componentforce, the transverse tension-shear failure occurred in themiddle of the plate structure. In general, the stratified struc-ture near the free surface without support broke first, andthen the tension-shear failure occurred layer by layer fromthe outside to the inside until the sample was damagedcompletely.
It is worth noting that the failure modes of USV-6,USV-7, and USV-8 rock samples showed typical tension-shear failure from inside to outside layer by layer. Themain difference was the position of the tension-shear failure.The tension-shear failure of bedding plane in the USV-6 rocksample was located at the lower position of the beddingplane, while the tensile shear failure of USV-7 and USV-8rock samples was located in the middle and upper parts ofthe bedding plane. After the tensile shear failure occurredalong the bedding plane layer by layer, the broken beddingplane fell off. The length of broken and exfoliated beddingsurface decreased gradually from outside to inside, forminga horizontal conical cavity. At the upper and lower parts ofthe conical cavity, step-like rock steps were generated. Thesuspended inverted rock step located at the upper positioncould be simplified as a suspended plate structure with noconstraint at the front end and fixed support at the backend. This kind of suspended plate structure was very likelyto produce shear failure along internal structural plane andvertical shedding under gravity, which would cause signifi-cant hidden danger to safe construction.
3.6. Relationship among Creep Parameters. Strain-timecurves of stratified rock samples have a nonlinear trendduring stress increasing stage (Figure 10). The samples beginto deform when load is applied, and as the load graduallyincreases, the evolution of new cracks and the development
of native cracks begin inside the samples. The effect of thisprocess on the rheological parameters is significant. In thisstage, deformation rates of the samples are an importantindex to measure the change state of their internal structure.The strain generated by the USH samples is the smallestwhile that of the USV samples is the largest in the processof load increase. This is caused by the induced tensile stressof horizontal bedding plane compression and the minimumstrength in the tensile stress environment. Because thebedding planes in the USH samples are arranged along thedirection of the minimum tensile stress and shear stress, theinstantaneous strain is the smallest. The maximum instanta-neous strain of the USO samples is caused by the beddingplane orientation close to the natural shear plane. The USVsamples show intermediate instantaneous strain, which iscaused by the decrease of the contact area between thesamples and the press plate due to the crack sliding alongthe bedding plane. On the whole, strain is positively corre-lated with load in the process of load increase, and its evolu-tion can be expressed as an exponential function relationshipwith base e, which is εin = aebσ.
εHin = 0:0096e0:0439σ, ð7Þ
εOin = 0:0132e0:045σ, ð8Þ
εVin = 0:0081e0:0504σ, ð9Þwhere εin is the strain generated during the load increasestage, σ is the load, and a and b are the coefficients. H, O,and V refer to three kinds of structurally anisotropic sand-stones with horizontal, oblique, and vertical layered struc-tures, respectively. The coefficient a ranges from 0.0081 to0.0132, and the coefficient b ranges from 0.0439 to 0.0504.
USH sample: y = 0.0009e0.1286x
USO sample: y = 0.001e0.1294x
USV sample: y = 0.0009e0.1378x
Load (𝜎c %)30
0
40
80
120
160
200
Cree
p ra
te (h
–1 %
)
40 50 60 70 80 90
USV sample
USO sample
USH sample
R2 = 0.861 R2 = 0.7766 R2 = 0.7583
Figure 12: Relationship between creep rate and constant load of rock samples
25Geofluids

The coefficient a of the USV samples is the minimum valueof 0.0081, the coefficient a of the USH samples is the middlevalue of 0.0096, and the coefficient a of the USO samples isthe maximum value of 0.0132. The coefficient b of the USVsamples is the largest (0.0504), the coefficient b of the USOsamples is in the middle (0.045), and the coefficient b of theUSH samples is the lowest (0.0439).
The strain and duration of steady-state creep stage areimportant indexes to evaluate the mechanical properties ofsamples, so it is necessary to analyze and evaluate these twoparameters for each sample. Under the influence of the nativecracks parallel to the bedding, the USH samples have a smallresponse to tensile stress. So the creep strain in the steady-state creep stage is the minimum. Under tensile stressperpendicular to the bedding plane, cracks, pore spaces,and openings exist along the bedding plane, which are thereasons for the large creep strain of the USV samples in thesteady creep stage. The main reason for the medium creepstrain of the USO samples in the steady creep stage is thatthe contact area between the samples and the machine toolpressure plate decreases due to the sliding and spalling ofthe samples layer by layer. There is a nonlinear negative cor-relation between the duration of steady-state creep stage andthe load. It can be seen from the curve that, compared withthe USV samples and the USO samples, the USH sampleshave the longest duration in the steady-state creep stage,followed by the USO samples, and the USV samples have
the shortest duration. On the whole, the duration of steady-state creep stage decreases with the increase of load; it canbe expressed as a logarithmic relationship, which is ts = a lnσ + b (Figure 11).
tHs = −254:8 ln σ + 1132:1, ð10Þ
tOs = −202:5 ln σ + 900:5, ð11Þ
tPs = −117:1 ln σ + 520:7, ð12Þwhere ts is the duration of the steady-state creep stage and σis the load. The duration of the steady-state creep stagedecreases with the increase of the load, indicating that theinfluence of structural anisotropy on the duration of thesteady-state creep stage decreases with the increase of theload. When the load reaches 0.8σc of the rock sample, thesteady-state creep stage lasts for a short time, and the acceler-ated creep stage has a great influence on the deformation ofthe sample.
Due to the large creep caused by the stratified struc-ture and the new anisotropic effect near the shear plane,it is found that before the failure of samples, the creep rateof the USV samples is the highest, and that of the USOsamples is the second. This is due to the larger creepcaused by the induced tensile stress perpendicular to thebedding in the USV rock samples. Due to the limited
𝜎L
(a)
𝜎M
(b)
𝜎H
(c)
(d) (e) (f)
(g) (h) (i)
Figure 13: Characteristics of crack evolution in stratified rock mass.
26 Geofluids

effect of the induced tensile stress parallel to the bedding,the USH samples have the minimum creep rate. The rela-tionship between the creep rate vs and the load σ can beexpressed as an exponential relationship base e, which isvs = aebσ (Figure 12).
vHs = 0:0009e0:1286σ, ð13Þ
vOs = 0:001e0:1294σ, ð14Þ
vVs = 0:0009e0:1378σ, ð15Þ
where vs is the creep rate and σ is the load. The USVsamples have the highest creep rate, followed by theUSO samples, and the USH samples have the lowestcreep rate. On the whole, when the constant load is lessthan 0.75σc, creep rates of the three groups are almostthe same. When the stress is greater than 0:80σc, thecreep rates are different due to the inherent anisotropy.This phenomenon indicates that the stratified structurein the sample has a great influence on the creep rateunder high load.
For the USH samples, the shear crack array producesthe minimum tensile stress and shear stress along the bed-ding plane perpendicular to the stress axis. With theincrease of load, slanted wing cracks are generated onthe basis of the original crack array. An array of shearcracks is formed in the USH group samples; tensile crackarrays are formed in the USO group samples and in theUSH group samples. But the length is shorter in theUSH samples. Under lower load, due to the difference ofthe steady-state creep rate, the tensile crack array lengthof the USV samples is the longest, and that of the USHsamples is shorter, while that of the USO samples is theshortest. With the increase of load, the tensile crack arraybecomes shorter and the shear crack array becomes longer.Finally, the shear crack independent of the anisotropy ofthe structure is generated. The difference of instantaneousstrain of various rock samples is due to the fact that nocrack comes into being, and the deformation type is lim-ited to elastic deformation. It can be inferred that thestratified structure has obvious influence on the instanta-neous strain of the samples. Similarly, the gradual reduc-tion of the deceleration creep stage also can be explainedby the concept of the cascade crack arrangement theory.
The opening stage of natural cracks and pore space inthe stratified sandstone dominate the structural anisotropyunder low load. However, under high load, the openingstage of inherent cracks and pores is not strictly controlledby structural anisotropy. Therefore, the structural anisot-ropy loses its control over deformation and the rock sam-ples behave mechanically as an isotropic material. Themicrostructure makes the rock break through the elasticlimit through the change of load from low to high. Andthe creep stage of the auxiliary activated rock is directlytransferred to the steady creep stage and the acceleratedcreep stage, without the deceleration creep stage. Due to
the influence of the above processes, the creep behaviorof rock is eventually transformed into a short-term mono-tone deformation (Figure 13). This deformation makesrock intrinsically more fragile. Therefore, because the threegroups of structural anisotropic rock samples all generateshear crack arrays directly, structural anisotropy has aweak or even negligible control over deformation. Withthe influence of the new anisotropy (cracks and fissures),the sample exhibits the steady creep strain after the elasticdeformation. From the concept of step crack array, rockcreep under low load is the result of nucleation and prop-agation of step crack array. However, under high load, theshear crack array is not controlled by structural anisot-ropy. All the three groups of rock samples show shear fail-ure has little correlation with the anisotropy of rock.
4. Conclusions
(1) The evolution path of crack generation, development,and final failure of the USN samples is random. Thisis because there is no obvious anisotropic structure inthe USN samples, so the failure does not occur alonga specific structural path. The failure mode of theUSH samples is mainly splitting failure, and the crackplane penetrates the stratified structure plane verti-cally and obliquely. The failure modes of the USOsamples mainly behave as slip failure along the struc-tural plane and shear failure through the structuralplane. The failure modes of the USV samples mainlybehave as bedding shear failure along a structuralplane and transverse bulging shear failure along thenormal direction of a structural plane
(2) The creep curves of these three types of stratifiedstructural samples are nonlinear. The evolutionaryrelationship between instantaneous strain generatedin the stress increasing stage and the load can beexpressed as an exponential function base e, εin =aebσ. The relationship steady-state creep stageduration and the load can be expressed as logarithmicfunction, ts = a ln σ + b. The relationship between thecreep rate and the load can be expressed as an expo-nential function base e, vs = aebσ
Data Availability
The data used to support the findings of this study are cur-rently under embargo while the research findings are com-mercialized. Requests for data, 18 months after publicationof this article, will be considered by the correspondingauthor.
Conflicts of Interest
The authors declare that there is no conflict of interestregarding the publication of this paper.
27Geofluids

Acknowledgments
This work was supported in part by the Scientific ResearchProject of Shaanxi Provincial Department of Educationunder grant No. 21JK0952, in part by the High-Level TalentsSpecial Fund of Xijing University under grant No. XJ21B12,and in part by the Key National Natural Science Foundationof China under grant No. U1361206. The authors are gratefulto China Scholarship Council (CSC). Special thanks are dueto Professor Pinnaduwa. H.S.W. Kulatilake, Department ofMining and Geological Engineering, the University of Ari-zona, Tucson, AZ, USA.
References
[1] J. Barlow, “Rock creep and the development of the NiagaraCuesta,” Earth Surface Processes and Landforms, vol. 27,no. 10, pp. 1125–1135, 2002.
[2] V. Karev, D. Kilmov, Y. Kovalenko, and K. Ustinov, “Experi-mental study of rock creep under true triaxial loading,”Mechanics of Solids, vol. 54, no. 8, pp. 1151–1156, 2019.
[3] Y. Yang, X. Lai, T. Luo, K. Yuan, and F. Cui, “Study on the vis-coelastic–viscoplastic model of layered siltstone using creeptest and RBF neural network,” Open Geosciences, vol. 13,no. 1, pp. 72–84, 2021.
[4] E. Zha, Z. Zhang, R. Zhang et al., “Long-term mechanical andacoustic emission characteristics of creep in deeply buriedjinping marble considering excavation disturbance,” Interna-tional Journal of Rock Mechanics and Mining Sciences,vol. 139, p. 104603, 2021.
[5] H.Wu, D. Ma, S. Spearing, and G. Zhao, “Fracture phenomenaand mechanisms of brittle rock with different numbers ofopenings under uniaxial loading,” Geomechanics and Engi-neering, vol. 25, no. 6, pp. 481–493, 2021.
[6] H. Wu, B. Dai, L. Cheng, R. Lu, G. Zhao, and W. Liang,“Experimental study of dynamic mechanical response andenergy dissipation of rock having a circular opening underimpact loading,” Mining, Metallurgy & Exploration, vol. 38,no. 2, pp. 1111–1124, 2021.
[7] X. Shi, C. Zhao, C. Li, and D. Wen, “Experimental study onrock creep fracture and its load/unload response ratio,” ActaSeismologica Sinica, vol. 32, pp. 332–339, 2010.
[8] D. Park and R. Michalowski, “Roof stability in deep rocktunnels,” International Journal of Rock Mechanics and Min-ing Sciences, vol. 124, p. 104139, 2019.
[9] L. Liu, G.-m. Wang, J.-h. Chen, and S. Yang, “Creep experi-ment and rheological model of deep saturated rock,” Transac-tions of Nonferrous Metals Society of China, vol. 23, no. 2,pp. 478–483, 2013.
[10] R. K. Dubey and V. K. Gairola, “Influence of structural anisot-ropy on creep of rocksalt from Simla Himalaya, India: anexperimental approach,” Journal of Structural Geology,vol. 30, no. 6, pp. 710–718, 2008.
[11] S. Zivaljevic and Z. Tomanovic, “Experimental research of theeffects of preconsolidation on the time-dependent deforma-tions—creep of marl,” Mechanics of Time-Dependent Mate-rials, vol. 19, no. 1, pp. 43–59, 2015.
[12] F. Pellet and G. Fabre, “Damage evaluation with P-wave veloc-ity measurements during uniaxial compression tests on argilla-ceous rocks,” International Journal of Geomechanics, vol. 7,no. 6, pp. 431–436, 2007.
[13] S. Rahimi and M. Hosseini, “Laboratory studies of creepbehavior on thick-walled hollow cylindrical salt rock speci-mens,” Arabian Journal of Geosciences, vol. 8, pp. 1–9, 2015.
[14] D. Grgic and D. Amitrano, “Creep of a porous rock and asso-ciated acoustic emission under different hydrous conditions,”Journal of Geophysical Research: Solid Earth, vol. 114,no. B10, 2009.
[15] S. Nadimi, K. Shahriar, M. Sharifzadeh, and P. Moarefvand,“Triaxial creep tests and back analysis of time-dependentbehavior of Siah Bisheh cavern by 3-dimensional distinct ele-ment method,” Tunnelling and Underground Space Technol-ogy, vol. 26, no. 1, pp. 155–162, 2011.
[16] J. Herrmann, E. Rybacki, H. Sone, and G. Dresen, “Defor-mation experiments on Bowland and Posidonia Shale—partII: creep behavior at in situ pc–T conditions,” RockMechanics and Rock Engineering, vol. 53, no. 2, pp. 755–779, 2020,.
[17] E. Rybacki, J. Herrmann, R. Wirth, and G. Dresen, “Creep ofPosidonia Shale at elevated pressure and temperature,” RockMechanics and Rock Engineering, vol. 50, no. 12, pp. 3121–3140, 2017.
[18] D. R. Bhat and N. Bhandary, “Residual-state creep behavior oftypical clayey soils,” Natural Hazards, vol. 69, no. 3, pp. 2161–2178, 2013.
[19] M. Bagheri, M. Rezania, and M. Mousavi Nezhad, “An exper-imental study of the initial volumetric strain rate effect on thecreep behaviour of reconstituted clays,” IOP Conference Series:Earth and Environmental Science, vol. 26, 2015.
[20] G. Fabre and F. Pellet, “Creep and time-dependent damage inargillaceous rocks,” International Journal of Rock Mechanicsand Mining Sciences, vol. 43, no. 6, pp. 950–960, 2006.
[21] N. Brantut, P. Baud, M. J. Heap, and P. Meredith, “Microme-chanics of brittle creep in rocks,” Journal of GeophysicalResearch (Solid Earth), vol. 117, no. B8, 2012.
[22] N. E. Davis, A. K. Kronenberg, and J. Newman, “Plasticity anddiffusion creep of dolomite,” Tectonophysics, vol. 456, no. 3-4,pp. 127–146, 2008.
[23] M. Smit, E. Scherer, T. John, and A. Janssen, “Creep of gar-net in eclogite: mechanisms and implications,” Earth andPlanetary Science Letters, vol. 311, no. 3-4, pp. 411–419,2011.
[24] E. Rybacki and G. Dresen, “Dislocation and diffusion creep ofsynthetic anorthite aggregates,” Journal of GeophysicalResearch, vol. 105, no. B11, pp. 26017–26036, 2000.
[25] M. J. Heap, P. Baud, P. Meredith, A. Bell, and I. Main, “Time-dependent brittle creep in Darley Dale sandstone,” Journal ofGeophysical Research, vol. 114, no. B7, 2009.
[26] E. Brückl and M. Parotidis, “Prediction of slope instabilitiesdue to deep-seated gravitational creep,” Natural hazards andearth system sciences, vol. 5, no. 2, pp. 155–172, 2005.
[27] J. H. P. Bresser, “On the mechanism of dislocation creep ofcalcite at high temperature: inferences from experimentallymeasured pressure sensitivity and strain rate sensitivity offlow stress,” Journal of Geophysical Research: Solid Earth,vol. 107, no. B12, pp. ECV 4-1–ECV 4-16, 2002.
[28] J.-P. Gratier, R. Guiguet, F. Renard, L. Jenatton, andD. Bernard, “A pressure solution creep law for quartz fromindentation experiments,” Journal of Geophysical Research:Solid Earth, vol. 114, no. B3, 2009.
[29] Y. Wu, L. Cheng, J. Killough et al., “Integrated characterizationof the fracture network in fractured shale gas reservoirs–
28 Geofluids

stochastic fracture modeling, simulation and assisted historymatching,” Journal of Petroleum Science and Engineering,vol. 205, p. 108886, 2021.
[30] J. Lou, F. Gao, J. Yang, Y. Ren, and L. Yang, “Characteristics ofevolution of mining-induced stress field in the longwall panel:insights from physical modeling,” International Journal ofCoal Science & Technology, vol. 8, 2021.
[31] H. Wu, G. Zhao, and W. Liang, “Mechanical properties andfracture characteristics of pre-holed rocks subjected to uniaxialloading: a comparative analysis of five hole shapes,” Theoreti-cal and Applied Fracture Mechanics, vol. 105, p. 102433, 2020.
29Geofluids