Experimental Research Methods in Language Learning Chapter 15 Non-parametric Versions of T-tests and...
24
Experimental Research Methods in Language Learning Chapter 15 Non-parametric Versions of T-tests and ANOVAs
-
Upload
oscar-eaton -
Category
Documents
-
view
220 -
download
0
Transcript of Experimental Research Methods in Language Learning Chapter 15 Non-parametric Versions of T-tests and...
Experimental Research Methods in Language
Learning
Chapter 15
Non-parametric Versions of T-tests and ANOVAs
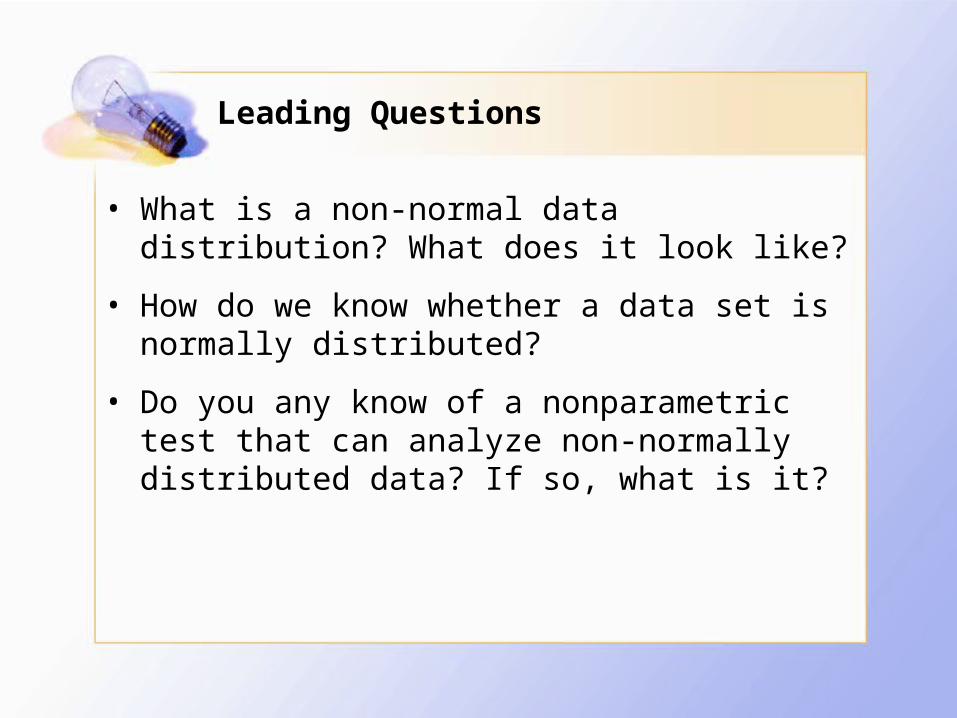
Leading Questions
• What is a non-normal data distribution? What does it look like?
• How do we know whether a data set is normally distributed?
• Do you any know of a nonparametric test that can analyze non-normally distributed data? If so, what is it?
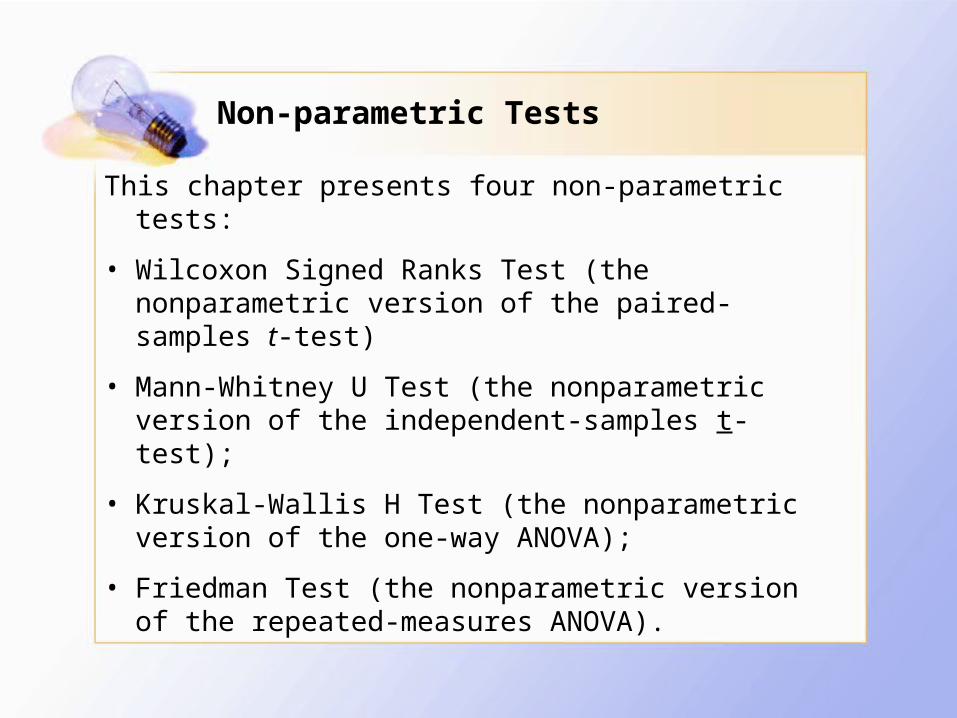
Non-parametric Tests
This chapter presents four non-parametric tests:
• Wilcoxon Signed Ranks Test (the nonparametric version of the paired-samples t-test)
• Mann-Whitney U Test (the nonparametric version of the independent-samples t-test);
• Kruskal-Wallis H Test (the nonparametric version of the one-way ANOVA);
• Friedman Test (the nonparametric version of the repeated-measures ANOVA).

Wilcoxon Signed Ranks Test
• This test is the non-parametric version of the paired-samples t-test.
• The Z score is used for statistical testing.
• Table 15.1.1 reports the descriptive statistics of a pretest and a posttest to be compared.
Wilcoxon Signed Ranks Test
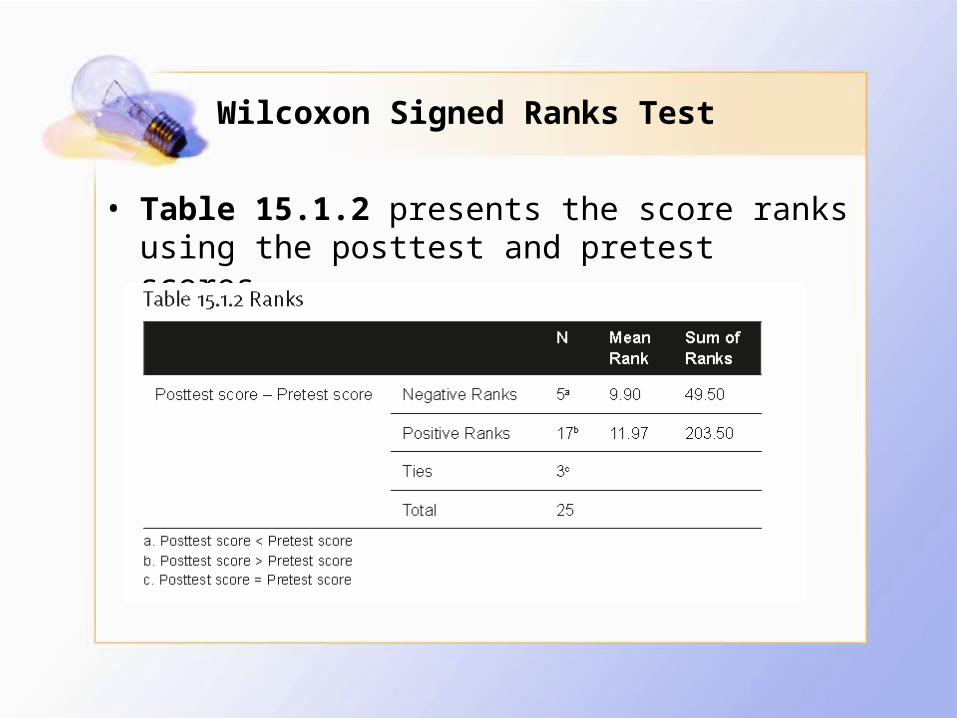
• Table 15.1.2 presents the score ranks using the posttest and pretest scores.
Wilcoxon Signed Ranks Test
• Negative ranks refer to the observation that an individual scored lower in the posttest than in the pretest.
• Positive ranks refer to the observation that an individual scored higher in the posttest than the pretes.
Wilcoxon Signed Ranks Test
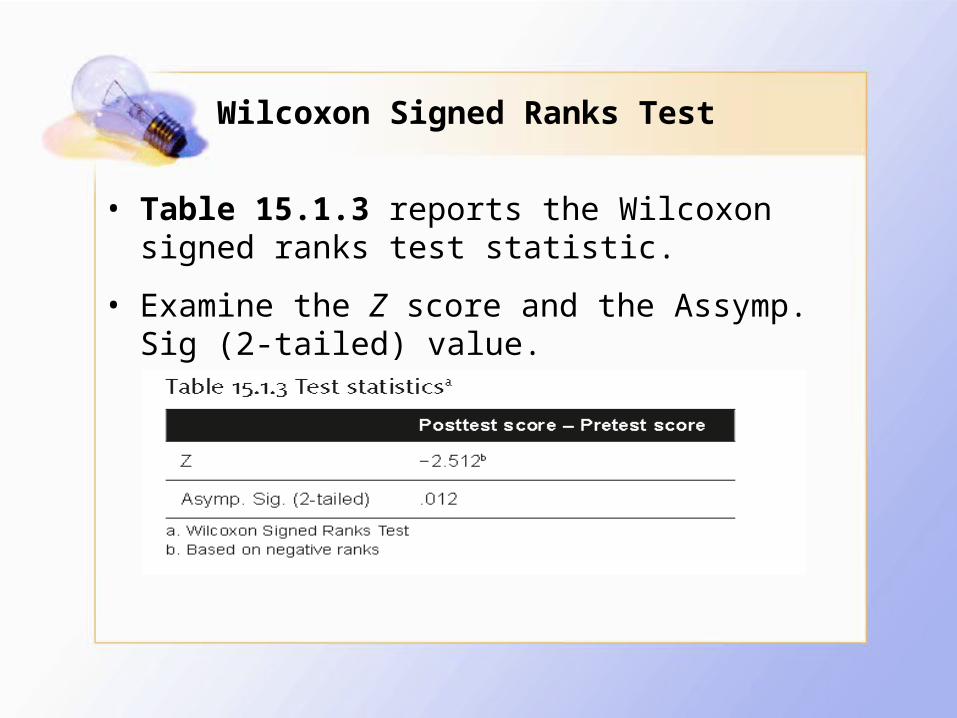
• Table 15.1.3 reports the Wilcoxon signed ranks test statistic.
• Examine the Z score and the Assymp. Sig (2-tailed) value.

Wilcoxon Signed Ranks Test
Effect size: r = Z ÷ √N (Larson-Hall (2010, p. 378) presents a formula to compute the r effect size for both the Mann-Whitney and Wilcoxon signed ranks tests. The formula is simple to calculate: It is important.
We can use the following statistical website practical to compute effect sizes: <http://www.ai-therapy.com/psychology-statistics/effect-size-calculator>
Examples of Studies
• Gass, Svetics, & Lemelin 2003;
• Kim & McDonough 2008;
• Marsden & Chen 2011;
• Yilmaz 2011;
• Yilmaz & Yuksel 2011
Mann-Whitney U Test
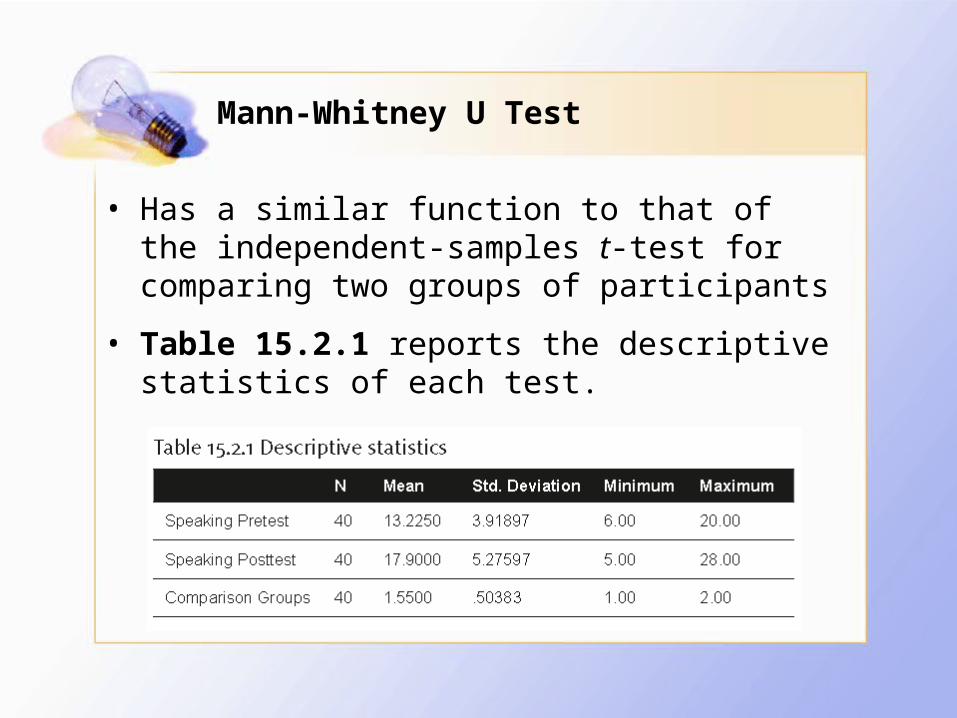
• Has a similar function to that of the independent-samples t-test for comparing two groups of participants
• Table 15.2.1 reports the descriptive statistics of each test.
Mann-Whitney U Test
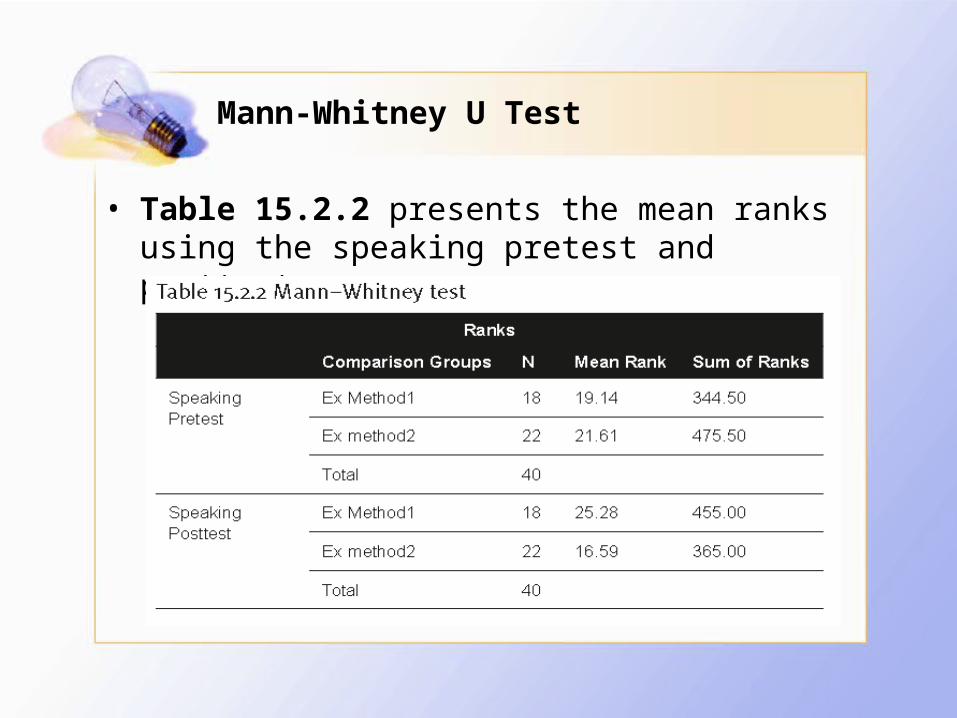
• Table 15.2.2 presents the mean ranks using the speaking pretest and posttest scores.
Mann-Whitney U Test
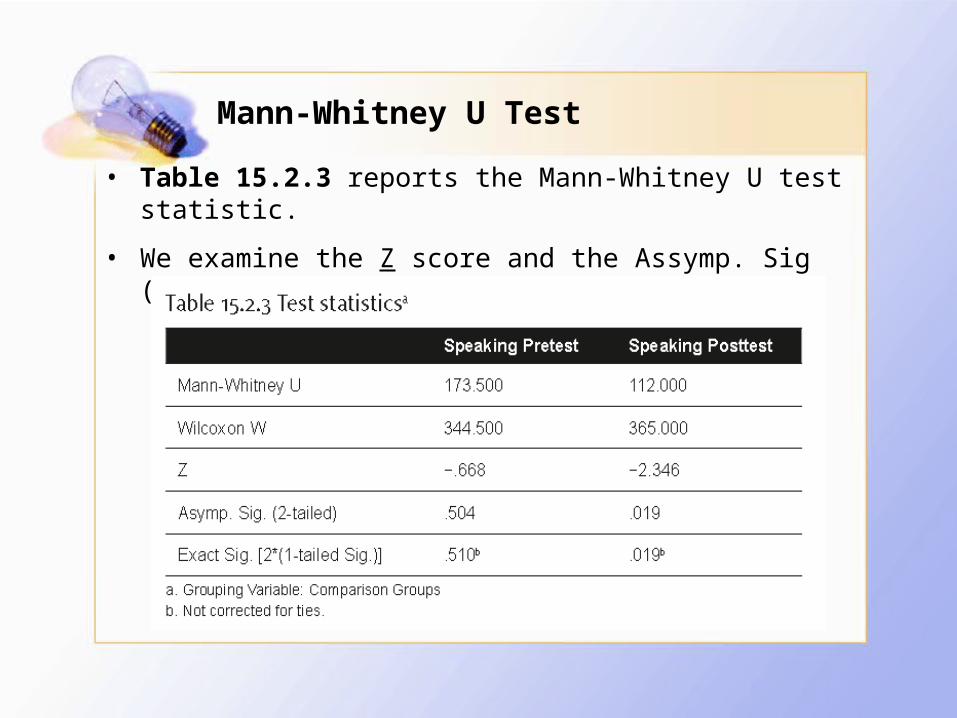
• Table 15.2.3 reports the Mann-Whitney U test statistic.
• We examine the Z score and the Assymp. Sig (2-tailed) value.
Examples of Studies
• Henry et al. (2009);
• Macaro & Masterman (2006);
• Marsden & Chen (2011);
• Yilmaz and Yuksel (2011)
Kruskal-Wallis H Test
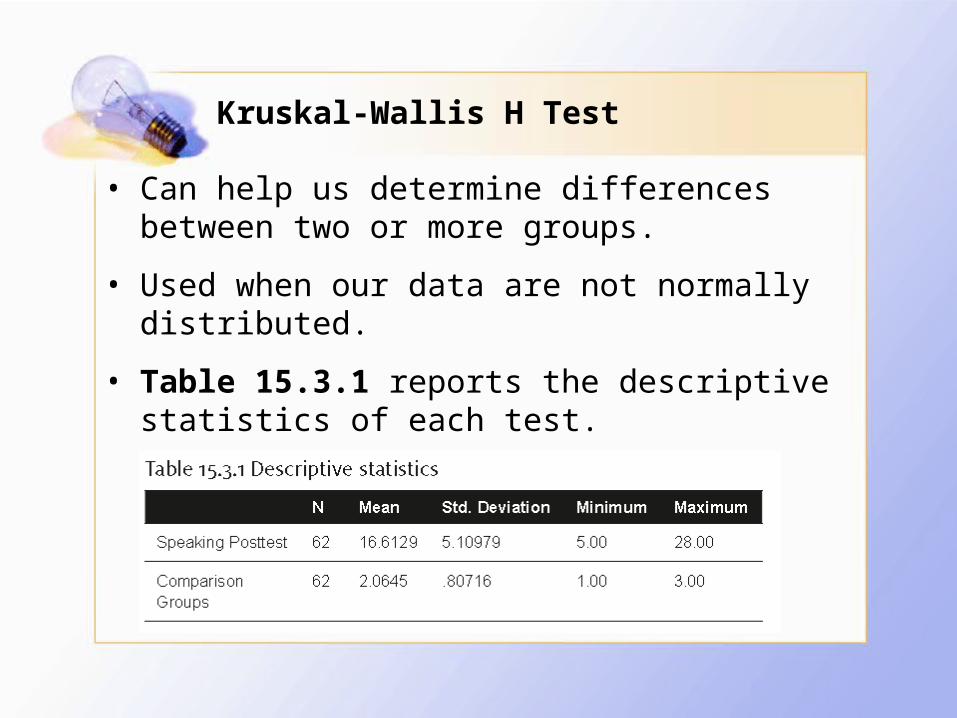
• Can help us determine differences between two or more groups.
• Used when our data are not normally distributed.
• Table 15.3.1 reports the descriptive statistics of each test.
Kruskal-Wallis H Test
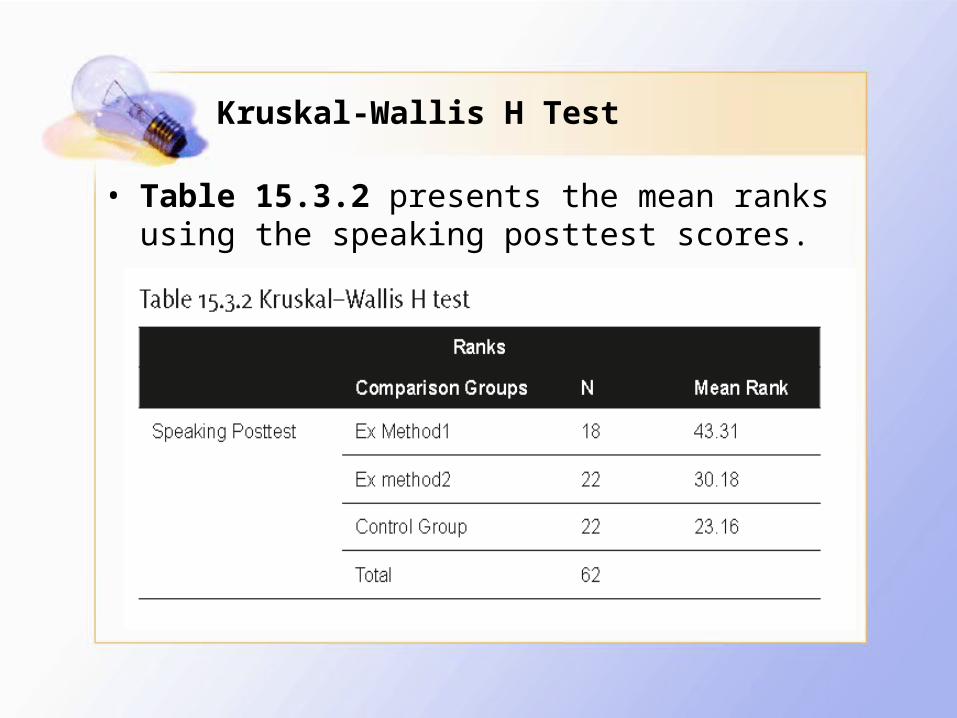
• Table 15.3.2 presents the mean ranks using the speaking posttest scores.
Kruskal-Wallis H Test
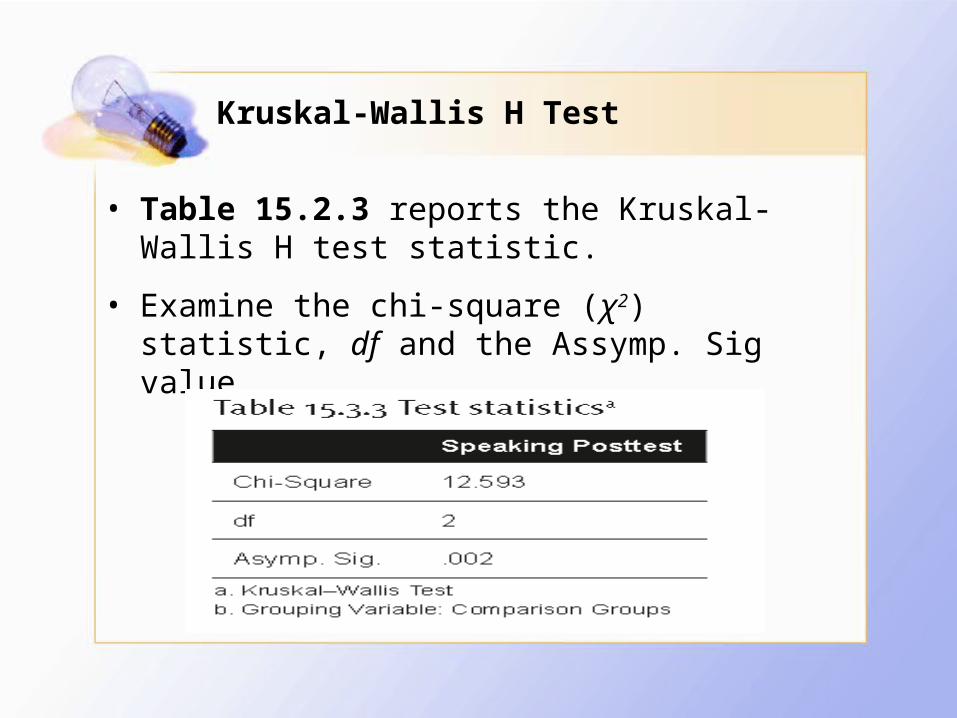
• Table 15.2.3 reports the Kruskal-Wallis H test statistic.
• Examine the chi-square (χ2) statistic, df and the Assymp. Sig value.
Kruskal-Wallis H Test
• post hoc test for Kruskal-Wallis H test is typically a Mann-Whitney U test in SPSS
• Alternatively use the following website to compute a post hoc test: <http://www.ai-therapy.com/psychology-statistics/hypothesis-testing/two-samples?groups=0¶metric=1>; accessed 01/03/2014.
http://www.ai-therapy.com/psychology-statistics/hypothesis-testing/two-samples?groups=0¶metric=1
Examples of Studies
• Chen & Truscott 2010;
• Li 2011;
• Marsden & Chen 2011
Friedman Test
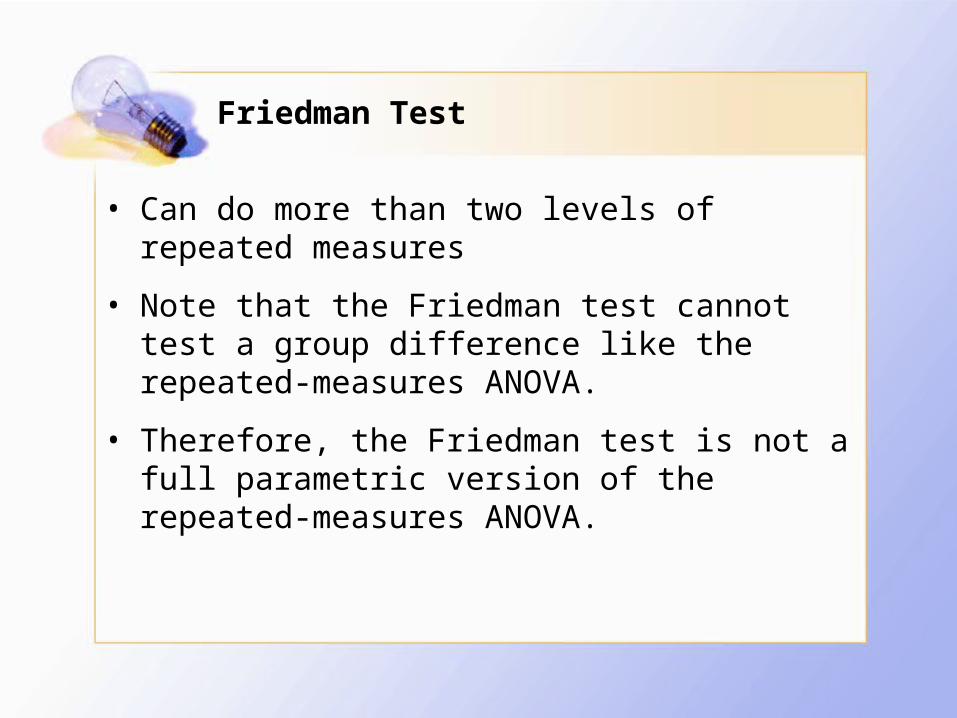
• Can do more than two levels of repeated measures
• Note that the Friedman test cannot test a group difference like the repeated-measures ANOVA.
• Therefore, the Friedman test is not a full parametric version of the repeated-measures ANOVA.
Friedman Test
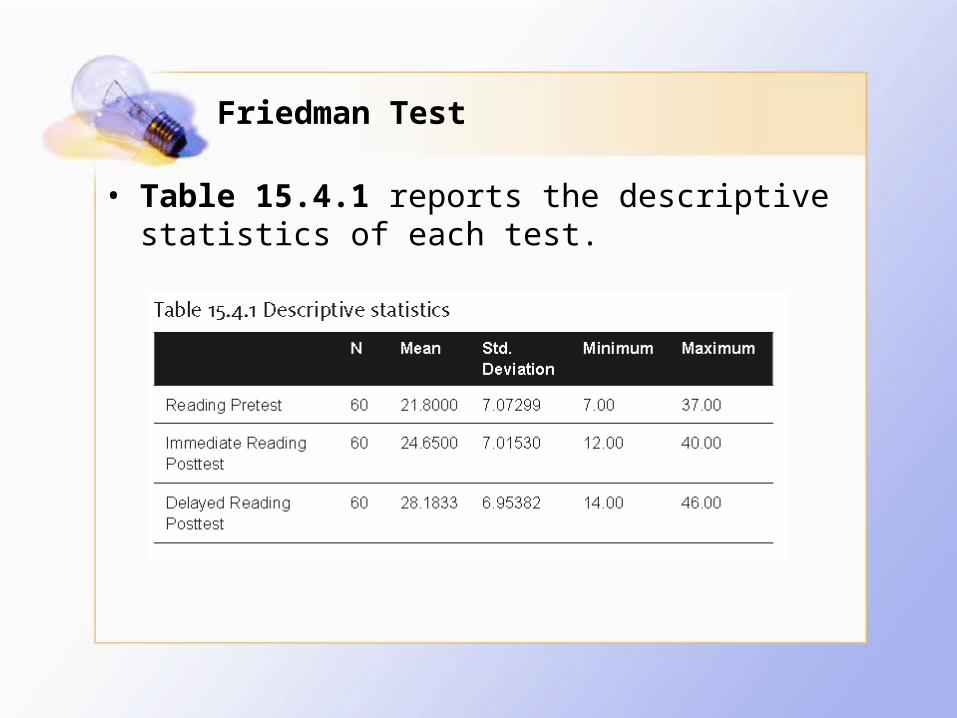
• Table 15.4.1 reports the descriptive statistics of each test.
Friedman Test
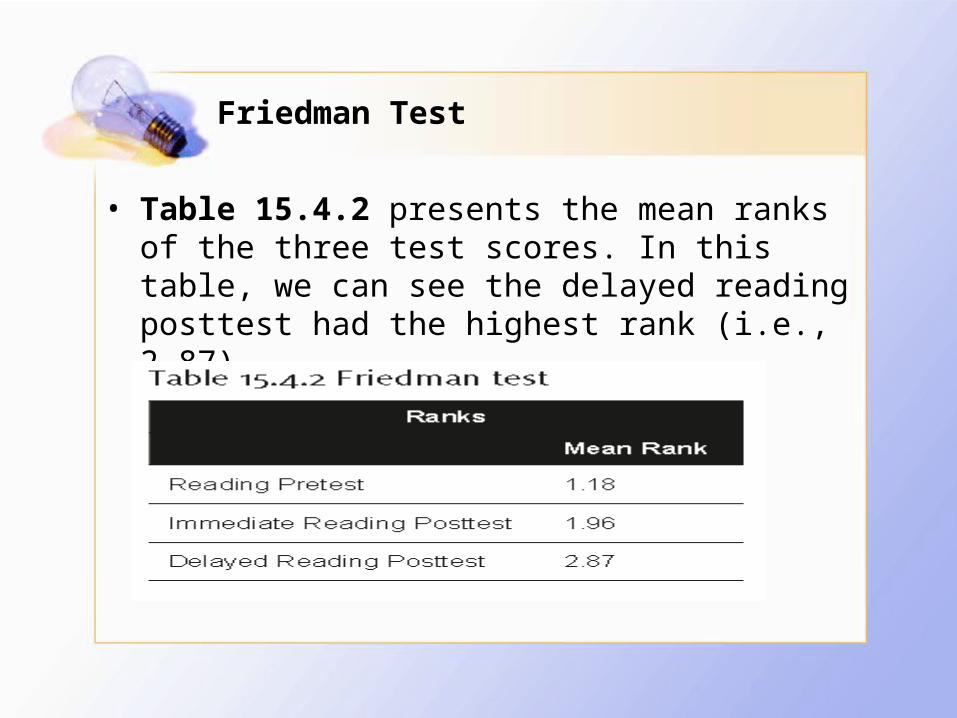
• Table 15.4.2 presents the mean ranks of the three test scores. In this table, we can see the delayed reading posttest had the highest rank (i.e., 2.87).
Friedman Test
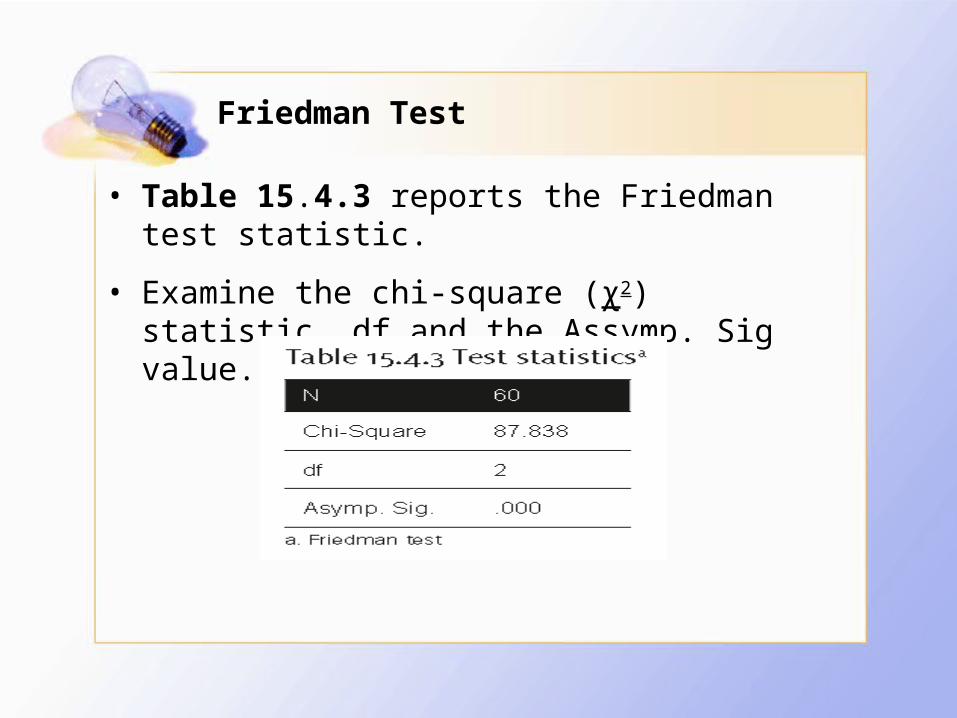
• Table 15.4.3 reports the Friedman test statistic.
• Examine the chi-square (χ2) statistic, df and the Assymp. Sig value.
Examples of Studies
• Li (2011)
• Marsden and Chen (2011)
Discussion
• What do you think are analytical limitations when raw scores are ranked before being analyzed?
• Do you find it useful to know the logic of these nonparametric tests? Does it help you understand experimental studies using these statistical tests?
• What are benefits of knowing an alternative statistics when our data are not normally distributed?