Low salinity water flooding Experimental experience and challenges Force workshop Ingebret Fjelde.

HAL Id: hal-02381264https://hal.archives-ouvertes.fr/hal-02381264
Submitted on 29 Nov 2019
HAL is a multi-disciplinary open accessarchive for the deposit and dissemination of sci-entific research documents, whether they are pub-lished or not. The documents may come fromteaching and research institutions in France orabroad, or from public or private research centers.
L’archive ouverte pluridisciplinaire HAL, estdestinée au dépôt et à la diffusion de documentsscientifiques de niveau recherche, publiés ou non,émanant des établissements d’enseignement et derecherche français ou étrangers, des laboratoirespublics ou privés.
Experimental modelling of urban flooding: A reviewEmmanuel Mignot, Xuefang Li, Benjamin Dewals
To cite this version:Emmanuel Mignot, Xuefang Li, Benjamin Dewals. Experimental modelling of urban flooding: Areview. Journal of Hydrology, Elsevier, 2019, 568, pp.334-342. �10.1016/j.jhydrol.2018.11.001�. �hal-02381264�

1
Experimental modelling of urban flooding: a review 1
Emmanuel Mignota*
, Xuefang Lib, Benjamin Dewals
b 2
a University of Lyon, INSA Lyon, CNRS, LMFA UMR5509, F-69621 Villeurbanne, France 3
b Hydraulics in Environmental and Civil Engineering (HECE), University of Liège (Uliège), Belgium 4
* Corresponding author: [email protected]
5
Abstract 6
We review the 45 available studies of urban flooding based on laboratory experiments. We distinguish 7
between the studies focusing on the flow in (i) a single street intersection, (ii) surface-sewer 8
exchanges, (iii) an array of obstacles and (iv) quasi-realistic urban districts. We discuss the main flow 9
processes which are covered in the various studies and detail which flow variables were recorded. This 10
enables identifying flow processes for which comprehensive experimental datasets are available from 11
those which require additional experimental research. We also highlight the typical ranges of scale 12
factors used, which depend mainly on the extent of the studied area (from very local up to the district 13
level). This review aims at helping computational modellers to pinpoint the most suitable dataset for 14
validating their numerical approaches and laboratory modellers to identify gaps in current 15
experimental knowledge of urban flooding. 16
Keywords: urban flood; experimental models; databases; flow processes; model set-ups. 17
18
1. Introduction 19
Among all natural disasters, floods are the most frequent and they affect the highest number of people 20
globally (UNISDR, 2015). Flood risk is particularly severe in urban areas (Chen et al., 2015). 21
Improving urban flood risk management has become a high priority at virtually all levels of 22
governance (Fang, 2016). The proper design and evaluation of measures to enhance urban flood-23
resilience should be based on the analysis of a range of scenarios, in which various hydro-24
meteorological conditions and management options are tested. This requires the accurate modelling of 25
inundation extents, water depths, discharge partition and flow velocity in urbanized flood prone areas, 26
since these parameters are critical inputs for flood impact modelling (Kreibich et al., 2014). 27
*Revised Manuscript with no changes marked
Click here to view linked References

2
For relatively rural areas, flood modelling and inundation mapping have become common practice 28
(Falconer et al., 2017; Teng et al., 2017). Based on the 1D or 2D shallow-water equations (SWE), the 29
accuracy of these computations depends mainly on the quality of hydrological and topographic input 30
data (Dottori et al., 2013). In contrast, floods in urban areas exhibit more diverse and complex flow 31
processes, as the water follows multiple flow paths such as crossroads, sewers, courtyards, parks, flow 32
around or within buildings and pieces of urban furniture (Paquier et al., 2015; Falconer et al., 2017). 33
Numerical models used for urban flood simulations need to account for these specific features of the 34
urban environment. For about two decades, the quality and complexity of urban flood simulations 35
have steadily increased. Starting from standard 1D or 2D models (Mark et al., 2004; Mignot et al., 36
2006a), more sophisticated numerical approaches have become gradually available: 37
· additional processes were included in the models, such as the rain falling directly on the street 38
network (Pons et al., 2005; Paquier and Bazin, 2014), short waves or tsunami long waves 39
invading a city (Park et al., 2013), human evacuation during a flood (Bernardini et al., 2017), 40
among others; 41
· high resolution digital elevation models (DEM), such as laser altimetry with a resolution as 42
fine as 0.5 m in some urban areas (Van Ootegem et al., 2016), have enabled super precise 43
descriptions of the urban domains (Ozdemir et al., 2013); 44
· isotropic and anisotropic porosity-based models (e.g., Bruwier et al. (2017)), coupled 1D (in 45
streets) and 2D (in crossroads) models (Ghostine et al., 2015), as well as improved 46
computational techniques such as cloud computing (Glenis et al., 2013) or model 47
implementation on graphical processing unit (Apel et al., 2016; Smith et al., 2015), have been 48
developed to enable efficient coverage of large spatial areas; 49
· although still in its infancy, modelling the interactions between surface flow and the sewer 50
system has been tested, based on a 1D description of the underground system and 0D, 1D or 51
2D approaches for surface flow, each with scientific challenges (Leandro et al., 2009; Seyoum 52
et al., 2012; Bazin et al., 2014). 53

3
Nonetheless, further numerical developments are needed to incorporate more details (urban furniture, 54
street profiles, façade misalignments, parked cars) as well as additional processes generally 55
overlooked so far (water entering the buildings, more realistic interactions river/surface/sewers, 56
transport of cars, pollutants, computing rescue operations …). Since 3D computations (Ghostine et al., 57
2009; Gems et al., 2016; Rodi, 2017) will not be a viable option for operational flood analysis and 58
mapping in the coming years, many processes will not be captured explicitly by operational flood 59
models. They will have to be reproduced through appropriate analytical-empirical parametrizations. 60
The development and validation of these parametrization requires high quality and reliable reference 61
data. 62
Field data, such as watermarks and aerial imagery, remain generally scarce, uncertain and insufficient 63
to reflect the whole complexity of inundation flows in urbanized flood-prone areas, particularly under 64
more extreme future conditions (Neal et al., 2009). Additional information on the velocity fields and 65
discharge partitions are necessary to understand the multi-directional flow pathways induced by the 66
built-up network of streets, buildings and underground systems (e.g., drainage network). There is also 67
a lack of observations of pluvial urban floods, mainly due to the short duration and local nature of 68
intense rainfall events. To address this lack of validation data from the field, laboratory models are an 69
appealing alternative, since they provide accurate measurements of flow characteristics under 70
controlled conditions. 71
Therefore, this paper aims at reviewing the existing datasets of urban flood laboratory experiments. 72
This review may benefit to both numerical modellers willing to test and validate innovative 73
computational approaches, and experimentalists looking for comparison datasets or willing to close 74
knowledge gaps. The paper presents also an inventory of the flow processes for which experimental 75
research was undertaken or still to be handled. Field data are excluded on purpose, as they are 76
generally sparser and more uncertain. 77
The paper is organized in three parts. The existing experimental datasets dedicated to the analysis of 78
urban flood processes are reviewed in Sect. 2. In Sect. 3, the coverage of the main urban flood process 79
by dedicated laboratory experiments is evaluated; enabling us to point out the flow processes for 80

4
which no or limited experimental data are currently available. Finally, Sect. 4 links the main findings 81
to the corresponding numerical approaches, highlighting those which lack validation data. Hints for 82
future experimental research are proposed. 83
84
2. State of the art of available urban flood datasets 85
Table 1 lists the available experimental datasets related to urban flooding. Most experiments were 86
performed in the last 15 years, suggesting a growing worldwide interest for urban flood laboratory 87
data, as the corresponding numerical models also improved considerably. The experimental studies 88
focused on four main flow types: (i) flow in street intersections, (ii) vertical exchanges between the 89
sewer system and the streets, (iii) flow within regular grids of emerging rectangular obstacles 90
representing idealized buildings or building blocks and (iv) flow within more realistic urban districts. 91
Table 1 is organized in four blocks (I to IV), each of them corresponding to one flow type. 92
As shown in the first column of Table 1, the experiments considered five different origins of the 93
water, i.e. the cause of flooding. First, upstream runoff (UR) corresponds to experiments in which the 94
water is supplied from an upstream boundary, mainly via a reservoir with a controlled discharge. It 95
usually refers to flood events for which the overflow or rain takes place upstream of the urban area and 96
water enters the urban domain as surface flow. Second, river overflow (RO) corresponds to 97
configurations where the overflow takes place within the urban area and thus the river and the 98
overtopping of the banks are explicitly included in the experiments. In such a case, the upstream 99
boundary condition is a controlled discharge within the river. Sewer overflow (SO) is similar to river 100
overflow except that in this case the water invading the surface comes from an exceeded capacity of 101
the sewer within the urban domain; the upstream boundary condition is then a controlled discharge in 102
the sewer inlet. The fourth origin of water is the rainfall over the studied domain (RA), which is the 103
case of fully urban watersheds (Pons et al., 2005; Paquier and Bazin, 2014). Then the upstream 104
boundary condition is a complex spatial (and temporal) distribution of water jets from a well-105
controlled rainfall simulator. Finally, the tsunami (TS) type is a long wave imposed off-shore that 106
propagates over the sea domain and invades an urban area when reaching the coast and overtopping 107
5
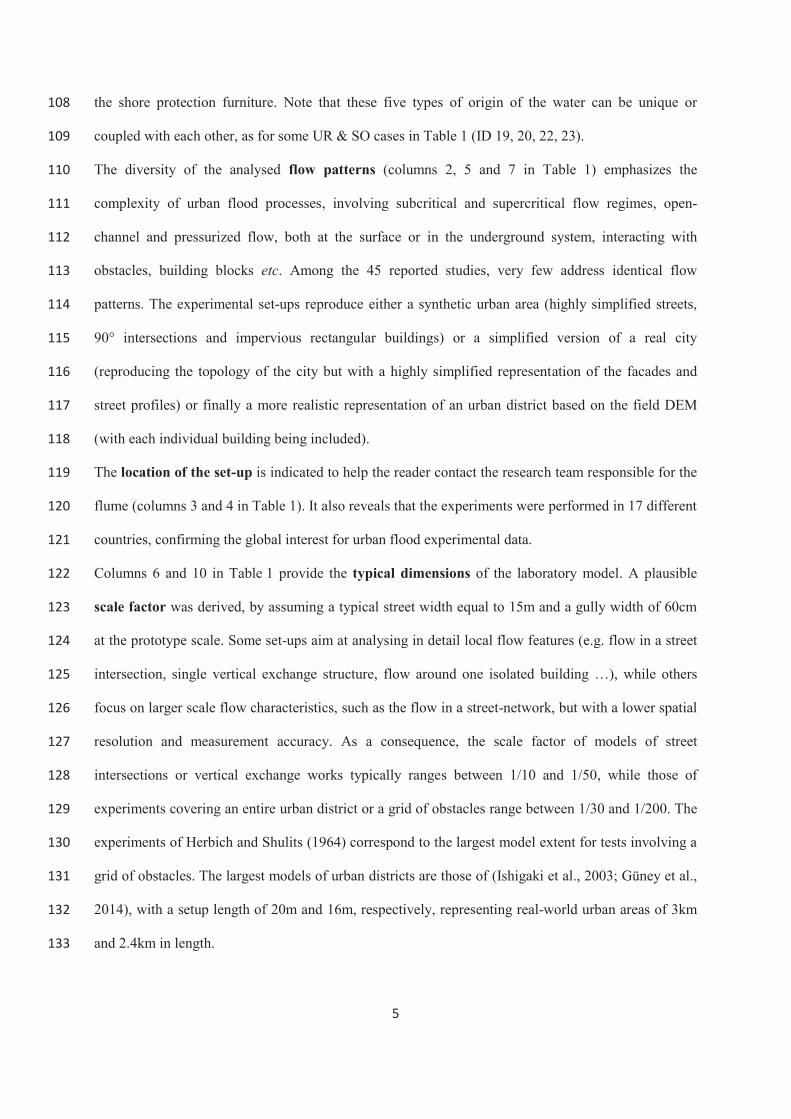
the shore protection furniture. Note that these five types of origin of the water can be unique or 108
coupled with each other, as for some UR & SO cases in Table 1 (ID 19, 20, 22, 23). 109
The diversity of the analysed flow patterns (columns 2, 5 and 7 in Table 1) emphasizes the 110
complexity of urban flood processes, involving subcritical and supercritical flow regimes, open-111
channel and pressurized flow, both at the surface or in the underground system, interacting with 112
obstacles, building blocks etc. Among the 45 reported studies, very few address identical flow 113
patterns. The experimental set-ups reproduce either a synthetic urban area (highly simplified streets, 114
90° intersections and impervious rectangular buildings) or a simplified version of a real city 115
(reproducing the topology of the city but with a highly simplified representation of the facades and 116
street profiles) or finally a more realistic representation of an urban district based on the field DEM 117
(with each individual building being included). 118
The location of the set-up is indicated to help the reader contact the research team responsible for the 119
flume (columns 3 and 4 in Table 1). It also reveals that the experiments were performed in 17 different 120
countries, confirming the global interest for urban flood experimental data. 121
Columns 6 and 10 in Table 1 provide the typical dimensions of the laboratory model. A plausible 122
scale factor was derived, by assuming a typical street width equal to 15m and a gully width of 60cm 123
at the prototype scale. Some set-ups aim at analysing in detail local flow features (e.g. flow in a street 124
intersection, single vertical exchange structure, flow around one isolated building …), while others 125
focus on larger scale flow characteristics, such as the flow in a street-network, but with a lower spatial 126
resolution and measurement accuracy. As a consequence, the scale factor of models of street 127
intersections or vertical exchange works typically ranges between 1/10 and 1/50, while those of 128
experiments covering an entire urban district or a grid of obstacles range between 1/30 and 1/200. The 129
experiments of Herbich and Shulits (1964) correspond to the largest model extent for tests involving a 130
grid of obstacles. The largest models of urban districts are those of (Ishigaki et al., 2003; Güney et al., 131
2014), with a setup length of 20m and 16m, respectively, representing real-world urban areas of 3km 132
and 2.4km in length. 133

6
Finally, columns 8 and 9 in Table 1 report the number of tested configurations and type of recorded 134
data. The measured data strongly depend on the scale of the experiment. For very local flow patterns, 135
such as flows in street intersections and vertical exchange structures (blocks I and II in Table 1), 136
spatially distributed flow characteristics are generally available, including 3D velocity fields and 2D 137
water depth fields, together with more global flow variables such as discharges in the different 138
branches. Moreover, for these local flow pattern experiments, the number of tested configurations 139
remains low (below 10) when spatially distributed data were recorded; whereas it reaches up to 200 140
configurations when only the discharges were recorded. For the experiments investigating larger scale 141
flow patterns such as obstacle grids and urban districts, spatially distributed data are rare and mostly 142
local velocities and water depths were recorded with pointwise measurement tools, except for surface 143
velocity fields derived in some cases from large scale particle image velocimetry (using a camera 144
located above the experimental setup). 145
Overall, Table 1 demonstrates the availability of rich laboratory datasets covering a broad spectrum of 146
typical urban flood conditions. In the following, we distinguish between the flow processes 147
comprehensively studied and those calling for more laboratory investigations. 148
149
3. Advances of urban flood processes analysis 150
By listing the existing experimental datasets, Sect. 2 reveals that a wide range of flow processes were 151
reproduced experimentally. Here, we attempt to present an inventory of the main flow processes of 152
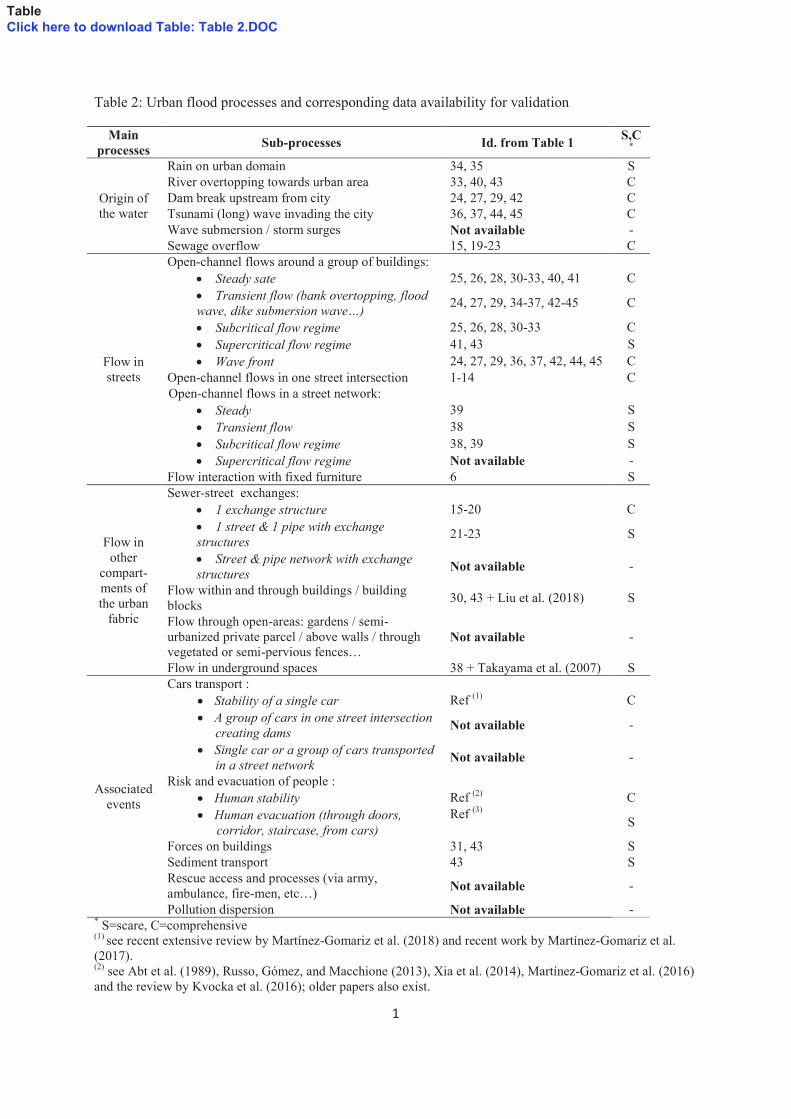
engineering relevance in urban flood studies (Table 2), and to relate them to the works listed in 153
Table 1. This enables assessing whether the existing experimental datasets are comprehensive enough 154
for the validation of the representation of each flow process in numerical models. Table 2 suggests that 155
experimental datasets do exist for most urban flow processes of interest; but not for all of them. 156
Regarding the origin of water, most common flood origins were reproduced experimentally. The 157
main deficiency is the intrusion of water waves from a storm surge, with the water from the sea, 158
overtopping the protection dikes and invading coastal cities with very unsteady flows, as described by 159
Maspataud et al. (2013). One main question is the evolution of the unsteadiness as the flow propagates 160

7
within the urban areas, merges or splits at crossroads and in open spaces: will the typical hydrograph 161
time-scale increase or decrease compared to the surge hydrograph? The validation of numerical 162
simulations certainly requires dedicated experimental data. Moreover, the knowledge on intrusion of 163
water through direct rain on the city domain should be further improved. In particular, as the rain falls 164
on the buildings roofs, part of the water reaches the sewer network (through the gutters) and the rest 165
reaches the surrounding streets or gardens (with possible infiltration) with some surface runoff on the 166
private slots. These processes, computed by Pons et al. (2005) and Paquier and Bazin (2014), still 167
require high quality data to enable deriving empirical parametrizations specific to urban catchments. 168
Future research should also consider the complex coupling between several flood origins. 169
Numerous datasets of flows in street networks (or within arrays of buildings) were published in the 170
recent years. These consider steady or unsteady flows, including steep hydrographs, at single or 171
multiple street intersections. One main deficiency regarding surface flow corresponds to the 172
consideration of obstacles present in the streets (Mignot et al., 2013) and steep urban areas where 173
mostly supercritical flow conditions take place. In such cases, hydraulic jumps occur at the street 174
intersections (Mignot et al., 2008) and in the vicinity of obstacles (Bazin et al., 2017). 175
Although the flow in street networks has been deeply studied experimentally, it is not the case of the 176
flow invading other compartments of the urban fabric: 177
· vertical flow interaction between the underground sewer and the street surface was 178
investigated locally, at the level of one exchange structure or a single street, but it remains 179
undocumented at the level of an entire urban district; 180
· similarly, data on flow exchanges between the streets and the blocks / slots (building blocks, 181
gardens, hospitals, etc…) through openings (gates, doors, windows…) remain scarce, both at 182
the local level (one facade, one building) and at the district level, while such calculations have 183
been performed for already some time (Hingray et al., 2000; Inoue et al., 2000). 184
Existing experimental works focused not only on the flow dynamics; but so-called “associated 185
events” have also been considered due to their importance for operational flood risk management. For 186
instance, much attention has been paid to the stability and safety of human beings and cars within 187

8
flooded streets. These valuable experiments enable estimating, from the hydrodynamics, the level of 188
risk for citizens and goods in flooded urban areas. Nevertheless, the behaviour of transported cars or 189
other mobile furniture (either floating or within the water column) in a street network, and the 190
possibility of creating dams at crossroads or street contractions (Mignot et al., 2006b) was not yet 191
investigated in laboratory experiments. Also, experiments on people evacuation were conducted at a 192
single institution (DRPI, Kyoto, Japan) and reproducing similar measurements is desirable. 193
Measurements of hydrodynamic forces on buildings or facades, and the transport of sediments in 194
flooded urban areas have received relatively little attention up to now. Finally, neither the access of 195
rescue vehicles through flooded streets, nor the dispersion of pollutants (e.g. from flooded industry or 196
damaged trucks) within a street network have been tested. Improved numerical modelling of these 197
“associated events” would be of substantial added-value for the management of urban flood risk, but 198
this still requires additional experimental data for model development and validation. 199
200
201
4. Conclusion 202
Based on the analysis of 45 laboratory studies and the identification of the main flow processes of 203
significance in urban flooding, the previous sections have highlighted the need for additional 204
(ambitious) experimental efforts to support the development and validation of more realistic 205
computational models of urban floods. This is particularly the case as next-generation urban flood 206
simulations should not only accurately replicate the water flows but also include the so-called 207
associated events (Sect. 3). 208
Indeed, as shown in Table 1 and Table 2, validation data are available for assessing most types of 209
numerical models commonly used in engineering and research to simulate urban floods, namely 210
(upper part of Table 3): 211
· 2D-SWE, or the 2D-SWE coupled with a porosity model, or the coupled 1D (in the streets) 212
and 2D (in the crossroads) SWE, to compute surface flow in the urban area; 213

9
· coupled 2D-SWE (in the streets) and 1D-SWE (in the sewer network), along with exchange 214
models, to compute the coupled flows in both the underground and surface layers of the urban 215
area; 216
· 2D-SWE or Boussinesq-type equations to compute long and/or short waves approaching the 217
shore and invading coastal urban areas; 218
· 3D Reynolds-averaged Navier-Stokes equations at the level of an isolated building (Gems et 219
al., 2016) or a single street intersection (Ghostine et al., 2009). 220
In contrast, more advanced numerical models (lower part of Table 3) are required to represent the 221
“associated events” occurring during urban floods, for which dedicated experimental data are virtually 222
unavailable. For instance, empirical or semi-analytical parametrizations are required to estimate the 223
amount of water entering the buildings or blocks, for computing sediment and pollutant transport in 224
urban environments, or entrainment of pieces of urban furniture within a flooded network of streets. 225
Similarly, specific numerical developments are needed for computing the behaviour of rescue 226
vehicles, citizen evacuation, etc. using agent based approaches. 227
The authors recommend that future experimental research aims at getting more quantitative insights 228
into these associated processes closely intertwined with flow behaviour during urban flooding. High 229
quality experimental observations of these processes will contribute to unlock key bottlenecks in the 230
current modelling practice and, consequently, pave the way for more integrative analyses of the urban 231
water and anthropic systems under (extreme) flooding conditions. 232
233
5. References 234
Abt, S.R., Wittier, R.J., Taylor, A., Love, D.J., 1989. Human stability in a high flood hazard zone. Journal of the 235
American Water Resources Association 25(4), 881–890. 236
Apel, H., Martinez Trepat, O., Nghia Hung, N., Thi Chinh, D., Merz, B., Viet Dung, N., 2016. Combined fluvial 237
and pluvial urban flood hazard analysis: Concept development and application to Can Tho city, Mekong 238
Delta, Vietnam. Natural Hazards and Earth System Sciences 16(4), 941–961. 239
Arrault, A., Finaud-Guyot, P., Archambeau, P., Bruwier, M., Erpicum, S., Pirotton, M., Dewals, B., 2016. 240
Hydrodynamics of long-duration urban floods: hacknewline experiments and numerical modelling. 241
Natural Hazards and Earth System Sciences 16(6), 1413–1429. 242
Baba, Y., Ishigaki, T., Toda, K., 2017. Experimental studies on safety evacuation from underground spaces 243
under inundation situations. Journal of JSCE 5(1), 269–278. 244
10
Barkdoll, B.D., Hagen, B.L., Odgaard, A.J., 1998. Experimental comparison of dividing open-channel with duct 245
flow in T-junction. Journal of Hydraulic Engineering 124(1), 92-95. 246
Bazin, P.-H., Mignot, E., Paquier, A., 2017. Computing flooding of crossroads with obstacles using a 2D 247
numerical model. Journal of Hydraulic Research 55(1), 72–84. 248
Bazin, P.-H., Nakagawa, H., Kawaike, K., Paquier, A., Mignot, E., 2014. Modeling flow exchanges between a 249
street and an underground drainage pipe during urban floods. Journal of Hydraulic Engineering 140(10), 250
04014051. 251
Beg, M.N.A., Carvalho, R.F., Leandro, J., 2017. Effect of surcharge on gully-manhole flow. Journal of Hydro-252
environment Research. In press. 253
Beretta, R., Ravazzani, G., Maiorano, C., Mancini, M., 2018. Simulating the Influence of Buildings on Flood 254
Inundation in Urban Areas. Geosciences 8(2), 77. 255
Bernardini, G., Postacchini, M., Quagliarini, E., Brocchini, M., Cianca, C., D’Orazio, M., 2017. A preliminary 256
combined simulation tool for the risk assessment of pedestrians’ flood-induced evacuation. 257
Environmental Modelling & Software 96, 14–29. 258
Bruwier, M., Archambeau, P., Erpicum, S., Pirotton, M., Dewals, B., 2017. Shallow-water models with 259
anisotropic porosity and merging for flood modelling on Cartesian grids. Journal of Hydrology 554, 260
693–709. 261
Cea, L., Garrido, M., Puertas, J., 2010. Experimental validation of two-dimensional depth-averaged models for 262
forecasting rainfall-runoff from precipitation data in urban areas. Journal of Hydrology 382(1), 88–102. 263
Creëlle, S., Engelen, L., Schindfessel, L., Cunha Ramos, P., De Mulder, T., 2017. Experimental investigation of 264
free surface gradients in a 90° angled asymmetrical open channel confluence, Advances 265
Hydroinformatics. Sophia Antipolis, pp. 803–819. 266
Chen, Y., Zhou, H., Zhang, H., Du, G., Zhou, J., 2015. Urban flood risk warning under rapid urbanization, 267
Environmental Research, 139, 3–10. 268
Despotovic, J., Plavsic, J., Stefanovic, N., Pavlovic, D., 2005. Inefficiency of storm water inlets as a source of 269
urban floods. Water Science and Technology 51(2), 139–145. 270
Dottori F et al. (2013) Detailed data is welcome, but with a pinch of salt: Accuracy, precision, and uncertainty in 271
flood inundation modeling. Water Resources Research 49(9), 6079–6085. 272
ElKadi, K., Lewicki, L., Paquier, A., Rivière, N., Travin, G., 2011. Division of critical flow at three-branch 273
open-channel intersection. Journal of Hydraulic Research 49(2), 231–238. 274
Falconer, R., Xia, J., Liang, D., Kvocka, D., 2017. Flood Modelling and harzard assessment for extreme events 275
in riverine basins, in: Proceedings 37th IAHR World Congress. 276
Fang, Q., 2016. Adapting Chinese cities to climate change. Science 354(6311), 425-426. 277
Finaud-Guyot, P., Garambois, P.-A., Araud, Q., Lawniczak, F., François, P., Vazquez, J., Mosé, R., 2018. 278
Experimental insight for flood flow repartition in urban areas. Urban Water Journal 15(3), 1–9. 279
Fraga, I., Cea, L., Puertas, J., 2017. Validation of a 1D-2D dual drainage model under unsteady part-full and 280
surcharged sewer conditions. Urban Water Journal 14(1), 74–84. 281
Gems, B., Mazzorana, B., Hofer, T., Sturm, M., Gabl, R., Aufleger, M., 2016. 3-D hydrodynamic modelling of 282
flood impacts on a building and indoor flooding processes. Natural Hazards and Earth System Sciences 283
16(6), 1351–1368. 284
Ghostine, R., Hoteit, I., Vazquez, J., Terfous, A., Ghenaim, A., Mose, R., 2015. Comparison between a coupled 285
1D-2D model and a fully 2D model for supercritical flow simulation in crossroads. Journal of Hydraulic 286
Research 53(2), 274–281. 287
Ghostine, R., Kesserwani, G., Vazquez, J., Rivière, N., Ghenaim, A., Mose, R., 2009. Simulation of supercritical 288
flow in crossroads: Confrontation of a 2D and 3D numerical approaches to experimental results. 289
Computers & Fluids 38(2), 425–432. 290
Glenis, V., McGough, A.-S., Kutija, V., Kilsby, C., Woodman, S., 2013. Flood modelling for cities using Cloud 291
computing. Journal of Cloud Computing: Advances, Systems and Applications 2(1), 7. 292
Goseberg, N., 2013. Reduction of maximum tsunami run-up due to the interaction with beachfront development 293
- application of single sinusoidal waves. Natural Hazards and Earth System Sciences 13(11), 2991–294
3010. 295
Guillen-Ludena, S., D. Lopez, N. Riviere, Mignot, E., 2017. Extreme flood flow in an increasingly urbanized 296
floodplain: an experimental approach. 37th IAHR world congress, in: Theme(2) Flood Management, 297
KualaLumpur, Malaysia. 298
Güney, M.S., Tayfur, G., Bombar, G., Elci, S., 2014. Distorted Physical Model to Study Sudden Partial Dam 299
Break Flows in an Urban Area. Journal of Hydraulic Engineering 140(11), 05014006. 300
Hager, W.H., 1989a. Supercritical flow in channel junctions. Journal of Hydraulic Engineering 115(5), 595-616. 301
Hager, W.H., 1989b. Transitional flow in channel junctions. Journal of Hydraulic Engineering 115(2), 243-259. 302
11
Herbich, J.B., Shulits, S., 1964. Large-scale roughness in open-channel flow, in: Proceedings Amercian Society 303
Civil Engineers 90(HY6). 304
Hingray, B., Cappelaere, B., Bouvier, C., Desbordes, M., 2000. Hydraulic vulnerability of elementary urban cell. 305
Journal of Hydrologic Engineering 5(4), 402–410. 306
Huang, C.-J., Hsu, M.-H., Teng, W.-H., Wang, Y.-H., 2014. The Impact of Building Coverage in the 307
Metropolitan Area on the Flow Calculation. Water 6(8), 2449–2466. 308
Ishigaki, T., Keiichi, T., Kazuya, I., 2003. Hydraulic model tests of inundation in urban area with underground 309
space. Theme B, Proc. of XXX IAHR Cogress, Greece. 310
Ishigaki, T., Y. Asai, Y.O. ans, Toda, K., Shimada, H., 2008. Evacuation criteria during urban flooding in 311
underground space. Proc. of 11th Conference on Urban Drainage, Edinburgh, Scotland, UK. 312
Inoue, K. Kawaike, K., Hayashi, H., 2000. Numerical simulation models of inundation flow in urban area. J. 313
Hydrosci. Hyd. Engng 18(1), 119-126. 314
Isidoro, J.M.G.P., Lima, J.L.M.P. de, Leandro, J., 2013. The study of rooftop connectivity on the rainfall-runoff 315
process by means of a rainfall simulator and a physical model. Zeitschrift für Geomorphologie, 316
Supplementary Issues 57(1), 177–191. 317
JinNoh, S., Lee, S., An, H., Kawaike, K., Nakagawa, H., 2016. Ensemble urban flood simulation in comparison 318
with laboratory-scale experiments: Impact of interaction models for manhole, sewer pipe, and surface 319
flow. Advances in Water Resources 97, 25–37. 320
Kim, B., Sanders, B.F., Famiglietti, J.S., Guinot, V., 2015. Urban flood modeling with porous shallow-water 321
equations: A case study of model errors in the presence of anisotropic porosity. Journal of Hydrology 322
523, 680–692. 323
Kreibich H., van den Bergh, J.C.J.M., Bouwer, L.M., Bubeck, P., Ciavola, P., Green, C., Hallegatte, S., Logar, I., 324
Meyer, V., Schwarze, R., Thieken, A.H., 2014. Costing natural hazards. Nat Clim Change 4(5), 303–325
306. 326
Kvocka, D., Falconer, R.A., Bray, M., 2016. Flood hazard assessment for extreme flood events. Natural Hazards 327
84(3), 1569-1599. 328
LaRocque, L.A., Elkholy, M., Chaudhry, M.H., Imran, J., 2013. Experiments on urban flooding caused by a 329
levee breach. Journal of Hydraulic Engineering 139(9), 960-973. 330
Leandro, J., Carvalho, R., Martins, R., 2010. Experimental scaled-model as a benchmark for validation of urban 331
flood models. Novatech, GRAIE, Lyon, France. 332
Leandro, J., Chen, A.S., Djordjevic, S., Savic, D.A., 2009. Comparison of 1D/1D and 1D/2D coupled 333
(sewer/surface) hydraulic models for urban flood simulation. Journal of Hydraulic Engineering 135(6), 334
495–504. 335
Lee, S., Nakagama, H., Kawaike, K., Zhang, H., 2012. Study on inlet discharge coefficient through the different 336
shapes of storm drains for urban inundation analysis. Journal of Japan Society of Civil Engineers, Ser. 337
B1 (Hydraulic Engineering) 68(4), I_31–I_36. 338
Lhomme. J., Soares-Frazão. S., Guinot. V., Zech. y., 2007. Modélisation à grande échelle des inondations 339
urbaines et modèle 2D à porosité. La Houille Blanche 4, 104-110. 340
Liu, L., Sun, J., Lin, B., Lu, L., 2018. Building performance in dam-break flow - an experimental study. Urban 341
Water Journal 15(3), 251–258. 342
Lopes, P., Carvalho, R.F., Leandro, J., 2017. Numerical and experimental study of the fundamental flow 343
characteristics of a 3D gully box under drainage. Water Science and Technology 75(9), 2204–2215. 344
Mark, O., Weesakul, S., Apirumanekul, C., Aroonnet, S.B., Djordjevic, S., 2004. Potential and limitations of 1D 345
modelling of urban flooding. Journal of Hydrology 299(3), 284–299. 346
Martínez-Gomariz, E., Gómez, M., Russo, B., 2016. Experimental study of the stability of pedestrians exposed 347
to urban pluvial flooding, Natural Hazards 82(2), 1259-1278. 348
Martínez-Gomariz, E., Gómez, M., Russo, B., Djordjevic, S., 2017. A new experiments-based methodology to 349
define the stability threshold for any vehicle exposed to flooding, Urban Water Journal 14 (9), 930-939 350
Martínez-Gomariz, E., Gómez, M., Russo, B., Djordjevic, S., 2018. Stability criteria for flooded vehicles: a 351
state-of-the-art review. Journal of Flood Risk Management 11(S2), S817–S826. 352
Martins, R., Kesserwani, G., Rubinato, M., Lee, S., Leandro, J., Djordjević, S., Shucksmith, J. D., 2017. 353
Validation of 2D shock capturing flood models around a surcharging manhole. Urban Water Journal, 354
14(9), 892-899. 355
Maspataud, A., Ruz, M.-H., Vanhée, S., 2013. Potential impacts of extreme storm surges on a low-lying densely 356
populated coastline: the case of Dunkirk area, Northern France. Natural Hazards 66(3), 1327–1343. 357
Mignot, E., Bonakdari, H., Knothe, P., Kouyi, G.L., Bessette, A., Rivière, N., Bertrand-Krajewski, J.-L., 2012. 358
Experiments and 3D simulations of flow structures in junctions and their influence on location of 359
flowmeters. Water Science and Technology 66(6), 1325–1332. 360

12
Mignot, E., Paquier, A., Ishigaki, T., 2006a. Comparison of numerical and experimental simulations of a flood in 361
a dense urban area. Water Science and Technology 54(6-7), 65–73. 362
Mignot E., Paquier A., Haider S., 2006b. Modeling floods in a dense urban area using 2D shallow water 363
equations. Journal of Hydrology 327 (1-2), 186-199. 364
Mignot, E., Rivière, N., Perkins, R.J., Paquier, A., 2008. Flow patterns in a four-branch junction with 365
supercritical flow. Journal of Hydraulic Engineering 134(6), 701–713. 366
Mignot, E., Rivière, N., Perkins, R.J., Paquier, A., Travin, G., 2009. Closure of flow patterns in a four branch 367
junction with supercritical flow. Journal of Hydraulic Engineering 135(11), 1023-1024. 368
Mignot, E., Zeng, C., Dominguez, G., Li, C.-W., Rivière, N., Bazin, P.-H., 2013. Impact of topographic 369
obstacles on the discharge distribution in open-channel bifurcations. Journal of Hydrology 494, 10–19. 370
Nanía, L.S., Gómez, M., Dolz, J., 2004. Experimental study of the dividing flow in steep street crossings. Journal 371
of Hydraulic Research 42(4), 406–412. 372
Nanía, L.S., Gómez, M., Dolz, J., Comas, P., Pomares, J., 2011. Experimental Study of Subcritical Dividing 373
Flow in an Equal-Width, Four-Branch Junction. Journal of Hydraulic Engineering 137(10), 1298-1305. 374
Nanía, L.S., Gonzalo, R., Gómez, M., 2014. Influence of Channel Width on Flow Distribution in Four-Branch 375
Junctions with Supercritical Flow: Experimental Approach. Journal of Hydraulic Engineering 140(1), 376
77-88. 377
Neal, J.C., Bates, P.D., Fewtrell, T.J., Hunter, N.M., Wilson, M., Horritt, M.S., 2009. Distributed whole city 378
water level measurements from the Carlisle 2005 urban flood event and comparison with hydraulic 379
model simulations. Journal of Hydrology 368(1), 42–55. 380
Ozdemir, H., Sampson, C.C., Almeida, G.A.M. de, Bates, P.D., 2013. Evaluating scale and roughness effects in 381
urban flood modelling using terrestrial LIDAR data. Hydrology and Earth System Sciences 17(10), 382
4015–4030. 383
Paquier, A., Bazin, P.H., 2014. Estimating uncertainties for urban floods modelling. La Houille Blanche 6, 13-384
18. 385
Paquier, A., Mignot, E., Bazin, P.-H., 2015. From Hydraulic Modelling to Urban Flood Risk. Procedia 386
Engineering 115, 37–44. 387
Park, H., Cox, D.T., Lynett, P.J., Wiebe, D.M., Shin, S., 2013. Tsunami inundation modeling in constructed 388
environments: A physical and numerical comparison of free-surface elevation, velocity, and momentum 389
flux. Coastal Engineering 79, 9–21. 390
Pons, F., Zhang, B., Sergent, P., Feltz, D., 2005. Simulation of flash floods in Marseille and Bordeaux with a 391
two-dimensional runoff model, in 10th
International Conference of Urban Drainage. Copenhagen, 392
Denmark. 393
Rivière, N., Travin, G., Perkins, R.J., 2011. Subcritical open channel flows in four branch intersections. Water 394
Resources Research 47(10), 2011WR010504. 395
Rivière, N., Travin, G., Perkins, R.J., 2014. Transcritical flows in three and four branch open-channel 396
intersections. Journal of Hydraulic Engineering 140(4), 04014003. 397
Rivière, N., Xiao, M., Perkins, R.J., Travin, G., 2018. Supercritical flow expansion in an open channel 398
bifurcation. In review at Journal of Hydraulic Research. 399
Rodi, W., 2017. Turbulence modeling and simulation in hydraulics: a historical review. Journal of Hydraulic 400
Engineering 143(5), 03117001. 401
Romagnoli, M., Carvalho, R., Leandro, J., 2013. Turbulence characterization in a gully with reverse flow. 402
Journal of Hydraulic Engineering 139(7), 736-744. 403
Rubinato, M., Martins, R., Kesserwani, G., Leandro, J., Djordjevic, S., Shucksmith, J., 2017. Experimental 404
calibration and validation of sewer/surface flow exchange equations in steady and unsteady flow 405
conditions. Journal of Hydrology 552, 421–432. 406
Russo, B., Gómez, M., Macchione, F., 2013. Pedestrian hazard criteria for flooded urban areas. Natural Hazards 407
69(1), 251–265. 408
Russo, B., Gómez, M., Tellez, J., 2013. Methodology to estimate the hydraulic efficiency of nontested 409
continuous transverse grates. Journal of Irrigation and Drainage Engineering 139(10), 864-871. 410
Schindfessel, L., Creëlle, S., De Mulder, T., 2015. Flow patterns in an open channel confluence with 411
increasingly dominant tributary inflow. Water 7(9), 4724–4751. 412
Seyoum, S., Vojinovic, Z., Price, R.K., Weesakul, S., 2012. Coupled 1D and Noninertia 2D Flood Inundation 413
Model for Simulation of Urban Flooding. Journal of Hydraulic Engineering 138(1), 23–34. 414
Smith L.S., Liang, Q., Quinn, P.F., 2015. Towards a hydrodynamic modelling framework appropriate for 415
applications in urban flood assessment and mitigation using heterogeneous computing. Urban Water 416
Journal 12(1), 67–78. 417
Smith, G.P., Rahman, P.F., Wasko, C., 2016. A comprehensive urban floodplain dataset for model 418
benchmarking. International Journal of River Basin Management 14(3), 345–356. 419

13
Soares-Frazão, S., Zech, Y., 2008. Dam-break flow through an idealised city. Journal of Hydraulic Research 420
46(5), 648–658. 421
Sturm, M., Gems B., Keller F. Mazzorana B. Fuchs S. Papathoma-Köhle M., M., A., 2018. Experimental 422
measurements of flood-induced impact forces on exposed elements, in: Proceedings RiverFlow 2018 423
conference. 424
Takayama, T., Takara, K., Toda, K., Fujita, M., Mase, H., Tachikawa, Y., Yoneyama, N., Tsutsumi, D., T. 425
Yasuda, Sayama, T., 2007. Research works for risk assessment technology related to flood in urban 426
area. Annuals of Disas. Prev. Res. Inst., Kyoto Univ., No. 50 C. 427
Teng, J., Jakeman, A.J., Vaze, J., Croke, B.F.W., Dutta, D., Kim, S., 2017. Flood inundation modelling: A 428
review of methods, recent advances and uncertainty analysis. Environmental Modelling & Software 90, 429
201–216. 430
Testa, G., Zuccala, D., Alcrudo, F., Mulet, J., Soares-Frazão, S., 2007. Flash flood flow experiment in a 431
simplified urban district. Journal of Hydraulic Research 45(sup1), 37–44. 432
Tomiczek, T., Prasetyo, A., Mori, N., Yasuda, T., Kennedy, A., 2016. Physical modelling of tsunami onshore 433
propagation, peak pressures, and shielding effects in an urban building array. Coastal Engineering 117, 434
97–112. 435
UNISDR, 2015. The human cost of weather related disasters, CRED 1995-2015, Unites Nations, Geneva. 436
Van Ootegem, L., Van Herck, K., Creten, T., Verhofstadt, E., Foresti, L., Goudenhoofdt, E., Reyniers, M., 437
Delobbe, L., Murla Tuyls, D., Willems, P., 2016. Exploring the potential of multivariate depth-damage 438
and rainfall-damage models. Journal of Flood Risk Management 11(S2), S916-S929. 439
Velickovic, M., Zech, Y., Soares-Frazão, S., 2017. Steady-flow experiments in urban areas and anisotropic 440
porosity model. Journal of Hydraulic Research 55(1), 85–100. 441
Wang, H., Mostafizi, A., Cramer, L.A., Cox, D., Park, H., 2016. An agent-based model of a multimodal near-442
field tsunami evacuation: Decision-making and life safety. Transportation Research Part C: Emerging 443
Technologies 64, 86–100. 444
Weber, L.J., Schumate, E.D., Mawer, N., 2001. Experiments on flow at a 90° open-channel junction. Journal of 445
Hydraulic Engineering 127(5), 340–350. 446
Xia, J., Falconer, R.A., Wang, Y., Xiao, X., 2014. New criterion for the stability of a human body in 447
floodwaters. Journal of Hydraulic Research 52(1), 93–104. 448
Yasuda, T., Hiraishi, T., 2004. Experimental Study of Tsunami Inundation in Coastal Urban Area, in: 449
Proceedings of the Fourteenth International Offshore Polar Engineering Conference. 450
Zhou, Q., Yu, W., Chen, A.S., Jiang, C., Fu, G., 2016. Experimental Assessment of Building Blockage Effects in 451
a Simplified Urban District. Procedia Engineering 154, 844-852. 452
453
454

14
List of Table captions: 455
Table 1: Databases available in literature for validation of urban flood numerical models 456
457
Table 2: Urban flood processes and corresponding data availability for validation 458
459
Table 3: Typology of numerical models applied to compute urban flood events 460
461

1
Table 1: Databases available in literature for validation of urban flood numerical models 1
Water
origin (1)
Flow pattern Location of set-up Reference Additional
remarks
Length of
set-up (m)
Steady (S)/
Unsteady (U)
Number of
configurations
[Availability](2)
Types of data
Scale factors(3) ID
I Flow at street intersections
UR 3-branch subcritical
junction
INSA/LMFA
(Lyon, France)
Mignot et al.
(2012) 5 S 1 [B] 3D velocity field
SW=0.3m
SF~1/50 (1)
IIHR (Iowa, USA) Weber et al.
(2001) 22 S 6 [A] 3D velocity field
SW=0.91m
SF~1/16 (2)
Gent University
(Gent, Belgium)
Schindfessel et al.
(2015)
Rectangular
sections with chamfers
33 S 2 [D] 3D velocity field SW=0.98m
SF~1/15 (3)
Gent University
(Gent, Belgium)
Creëlle et al.
(2017) 12 S 6 [D] Water depth field
SW=0.4m
SF~1/38 (4)
UR 3 branch transcritical and
supercritical junction
EPFL (Lausanne,
Switzerland)
Hager (1989a &
1989b) 2 S 8 [A] & [C] 2D velocity field
SW=0.099m
SF~1/152 (5)
UR 3-branch subcritical
bifurcation
INSA/LMFA (Lyon, France)
Mignot et al. (2013)
Without/with 10
obstacles (urban
furniture)
5 S
14 flows
x 10 obstacles
[D]
* Flow discharge
+ 2D velocity field (for 1 flow with 10 obstacle
configs.)
SW=0.3m SF~1/50
(6)
IIHR (Iowa, USA) Barkdoll et al.
(1998) 2.7 S 1 [C]
2D velocity field & water depth field
SW=0.152m SF~1/100
(7)
UR 3-branch critical &
supercritical bifurcation
INSA/LMFA (Lyon, France)
ElKadi et al. (2011)
5 S ~100 [B]
Discharge distribution to the
downstream branches
+ water depth field for 1 flow
SW=0.3m SF~1/50
(8)
INSA/LMFA
(Lyon, France)
Rivière et al.
(2018) 5 S 62 [B]
Discharge distribution and
water depth fields
SW=0.3m
SF~1/50 (9)
UR 4-branch subcritical
intersection
INSA/LMFA
(Lyon, France)
Rivière et al.
(2011) 5 S 220 [B]
Discharge distribution to the
downstream branches
SW=0.3m
SF~1/50 (10)
UPC (Barcelona,
Spain)
Nanía et al.
(2011) 8.5 S 159 [A]
Discharge distribution to the
downstream branches
SW=1.5m
SF~1/10 (11)
UR 4-branch transcritical &
supercritical flows
INSA/LMFA
(Lyon, France)
Rivière et al.
(2014) 5 S 113 [B]
Discharge distribution to the
downstream branches
SW=0.3m
SF~1/50 (12)
INSA/LMFA (Lyon, France)
Mignot et al.
(2009) & Mignot
et al. (2008)
4.5 S ~200
[B] & [B]
Discharge distributions to the
downstream branches
+ 8 water depth fields
SW=0.3m SF~1/50
(13)
UPC (Barcelona,
Spain)
Nanía et al. (2004) & Nanía et
al. (2014)
8.5 S ~200
[B] & [B]
Discharge distribution to the
downstream branches
SW=1.5m
SF~1/10 (14)
II Vertical exchanges (street/sewage)
SO 1 overflow exchange
structure (1 way: from
University of
Coimbra (Coimbra,
Lopes et al. (2017)
& Romagnoli et al. 0.6 S 4 [B] & [B] 3D velocity field
GW=0.6m
SF~1 (15)
Table
Click here to download Table: Table 1_final.DOC

2
Water
origin (1)
Flow pattern Location of set-up Reference Additional
remarks
Length of
set-up (m)
Steady (S)/
Unsteady (U)
Number of
configurations
[Availability](2)
Types of data
Scale factors(3) ID
sewer to surface) Portugal) (2013)
UR 1 inlet exchange structure (1 way: from surface to
sewer)
UPC (Barcelona,
Spain)
Russo, Gómez, and
Tellez (2013) 5.5 S 280 [B]
Exchanged discharge to
sewer SF=1 (16)
Faculty of Civil Engineering
(Belgrade, Serbia)
Despotovic et al.
(2005)
(without and with
clogging effects) 5 S ~100 [C]
Exchanged discharge to sewer + flow spreading on
the street
SF~1 (17)
DPRI (Kyoto, Japan) Lee et al. (2012) 6 S 12 [B] Exchanged discharge + water
depths SF=1/10 (18)
UR &
SO
1 exchange structure (2 ways between surface
and sewer)
University of Sheffield (UK)
Rubinato et al.
(2017) & Martins
et al. (2017)
8 S + U 46
[A] & [A]
Exchanged discharges
(steady + time evolution) +
water depths
SF=1/6 (19)
U. of Coimbra
(Portugal) Beg et al. (2017) 9.5 S 19 [B]
Exchanged discharges + velocity fields + pressure
heads
GW=0.6
SF~1 (20)
UR 1 street with several inlets U. of Coimbra
(Portugal) Leandro et al.
(2010) 36 S 36 [B] Exchanged discharge
SW=0.5m SF~1/30
(21)
UR &
SO
1 street with several exchange structures (2
ways)
DPRI (Kyoto, Japan)
Bazin et al. (2014)
10 S + U
2 steady
2 unsteady
[C] Water depth and pressure
head along the street (+ total
exchanged discharge for Bazin2014)
Sw=0.8m
SF~1/20
(22)
JinNoh et al.
(2016)
6 steady
2 unsteady [B] SF=1/20
UR &
SO
1 half-street + 3 exchange structures (2 ways: collect
and overflow)
University of A Coruna (A Coruna,
Spain)
Fraga et al. (2017) 6 S + U 5 [B] Water depth in street and in
pipes + discharge in pipes SF=1 (23)
III Flow through a regular grid of emerging obstacles
UR Non-uniform flow
in a patch of obstacles
UCL (Louvain la
Neuve, Belgium)
Soares-Frazão
and Zech (2008) aligned obstacle
grid (aligned with
flow axis and
rotated) 15
U (dam break) 2 [B] Water depth
Surface velocity fields
Sw=0.1m
SF~1/150
(24)
Velickovic et al.
(2017)
S
20 [B] Water depth profiles (25)
Lhomme et al. (2007)
Staggered obstacle
grid (aligned with flow axis)
1 [D] Water depths
Surface velocity fields (26)
CESI (Milan, Italy) Testa et al. (2007) aligned &
staggered obstacles 5 U (dam break) 12 [A] Water depths SF=1/100 (27)
National Taiwan
University (Taiwan)
Huang et al.
(2014)
aligned obstacles (aligned with flow
axis)
8 S 7 [D] Water depth profiles Various Sw (28)
KICT (South Korea) Kim et al. (2015) Aligned obstacles 30 U (dam break) 2 [D] Water depths SW=0.1m
SF~1/150 (29)

3
Water
origin (1)
Flow pattern Location of set-up Reference Additional
remarks
Length of
set-up (m)
Steady (S)/
Unsteady (U)
Number of
configurations
[Availability](2)
Types of data
Scale factors(3) ID
Tsinghua Université (Beijing, China)
Zhou and W. Yu (2016)
Aligned obstacles: pervious &
impervious
10 S 30 [D] Water depths + 2D velocity
fields Sw=0.05m SF~1/300
(30)
UR Uniform flow in
a large grid of obstacles
INSA/LMFA (Lyon,
France)
Guillen-Ludena et
al. (2017)
Aligned obstacles
on rough bed with
forces on buildings
8 S 50 [B]
Normal water depth + Forces
on buildings (50 exp) & 2D
velocity field (1 exp)
Various Sw (31)
Pennsylvania State
U. (USA)
Herbich and
Shulits (1964)
Staggered
obstacles 16 S 80 [C]
Normal water depth (uniform
flow) Various Sw (32)
RO River overflow around
obstacles
Polytechnico di
Milano (Italy)
Beretta et al.
(2018) 2.23 S 1 [B]
Local velocities and water
depths SF=1/25 (33)
RA Rain over a group of
buildings
University of
Coimbra (Portugal)
Isidoro et al.
(2013)
Rain with/without
wind effect and static/dynamic
storm effects. 4
tested building distributions
2 U 30 [B] Outflow hydrographs Various Sw (34)
Cea et al. (2010)
Rain over
buildings with roofs
2.5 U 72 [B] Outflow hydrographs Various Sw (35)
TS Long wave over an
obstacle grid at the shore
DPRI (Kyoto, Japan) Tomiczek et al.
(2016) Aligned obstacles 45
U
63 (2
repetitions) [B]
Water depth + pressure on
obstacles SF=1/20 (36)
Leibniz University (Hanover, Germany)
Goseberg (2013) Aligned and
staggered obstacles 18
24 (290 with repetitions) [A]
Maximum run-up extension, water depths, velocities
Various Sw (37)
IV Urban district
UR Flow in a street network
DPRI (Kyoto, Japan) Ishigaki et al.
(2003)
With & without connections (48) to
underground
20 U 2 [C] Water depths, surface velocities & outflow
discharges
SF=1/100 (38)
IMFS (Strasbourg,
France)
Arrault et al.
(2016) and
Finaud-Guyot et
al. (2018)
Synthetic district 5 S 16 [B] Water depth profiles &
Outflow discharges SF=1/200 (39)
RO
Flow around buildings
Univ. of South Carolina (Columbia,
USA)
LaRocque et al.
(2013)
River overtopping towards urbanized
area
12 S 2 [A] Surface velocity field + water
depth field SF=1/50 (40)
UR UNSW (Sydney,
Australia) Smith et al.
(2016) Mostly
supercritical flows 12.5 S 1 [A]
Surface velocity field + water depth field
SF=1/30 (41)
UR Dokuz Eylül
University (Izmir,
Güney et al.
(2014)
Dam break on a
group of buildings 16 U
1 (5 repetitions)
[D]
Water depths (10 locations)
and velocities (4 locations) SF=1/150 (42)
4
Water
origin (1)
Flow pattern Location of set-up Reference Additional
remarks
Length of
set-up (m)
Steady (S)/
Unsteady (U)
Number of
configurations
[Availability](2)
Types of data
Scale factors(3) ID
Turquey)
RO University of
Innsbruck (Austria) Sturm et al.
(2018)
Supercritical &
flow within
buildings
9
U (Fixed discharge
in the river
upstream)
140 [D]
Forces on buildings, water depths, flow velocities
SF=1/30 (43)
TS Long wave over a realistic
planning at the shore
PARI (Yokosuda,
Japan) Yasuda (2004)
with openings
towards
underground
34
U
4 [C] Water depths + flood
extension SF=1/50 (44)
Oregon State University
(Corvallis, USA)
Park et al. (2013) 40 1 (99
repetitions) [B] Water depths and velocities SF=1/50 (45)
2
(1) UR=Upstream runoff, RO = River overflow, SO = Sewer overflow, TS=Tsunami, RA = Rain over the domain 3
(2) A = Available on the Internet or in the article, B = Available upon demand, C = Likely not available, D = No information about availability 4
(3) Sw= street width in model, GW = gully width in model, SF= horizontal scale factor reported by authors or computed using typical field values Sw=15m and GW=0.6m in 5
prototype 6
7
Note: In terms of discharge distribution in 3-branch subcritical and transcritical bifurcation flow configurations without obstacle (very simple cases), the recent works by 8
Rivière et al. (2011, 2014) propose a review of available discharge distribution data. The reader can refer to these papers for a list of available data and corresponding 9
references. 10
1
Table 2: Urban flood processes and corresponding data availability for validation
Main
processes Sub-processes Id. from Table 1
S,C*
Origin of
the water
Rain on urban domain 34, 35 S
River overtopping towards urban area 33, 40, 43 C
Dam break upstream from city 24, 27, 29, 42 C
Tsunami (long) wave invading the city 36, 37, 44, 45 C
Wave submersion / storm surges Not available -
Sewage overflow 15, 19-23 C
Flow in
streets
Open-channel flows around a group of buildings:
· Steady sate 25, 26, 28, 30-33, 40, 41 C
· Transient flow (bank overtopping, flood
wave, dike submersion wave…) 24, 27, 29, 34-37, 42-45 C
· Subcritical flow regime 25, 26, 28, 30-33 C
· Supercritical flow regime 41, 43 S
· Wave front 24, 27, 29, 36, 37, 42, 44, 45 C
Open-channel flows in one street intersection 1-14 C
Open-channel flows in a street network:
· Steady 39 S
· Transient flow 38 S
· Subcritical flow regime 38, 39 S
· Supercritical flow regime Not available -
Flow interaction with fixed furniture 6 S
Flow in
other
compart-
ments of
the urban
fabric
Sewer-street exchanges:
· 1 exchange structure 15-20 C
· 1 street & 1 pipe with exchange
structures 21-23 S
· Street & pipe network with exchange
structures Not available -
Flow within and through buildings / building
blocks 30, 43 + Liu et al. (2018) S
Flow through open-areas: gardens / semi-
urbanized private parcel / above walls / through
vegetated or semi-pervious fences… Not available -
Flow in underground spaces 38 + Takayama et al. (2007) S
Associated
events
Cars transport :
· Stability of a single car Ref (1)
C
· A group of cars in one street intersection
creating dams Not available -
· Single car or a group of cars transported
in a street network Not available -
Risk and evacuation of people :
· Human stability Ref (2)
C
· Human evacuation (through doors,
corridor, staircase, from cars)
Ref (3)
S
Forces on buildings 31, 43 S
Sediment transport 43 S
Rescue access and processes (via army,
ambulance, fire-men, etc…) Not available -
Pollution dispersion Not available - * S=scare, C=comprehensive
(1) see recent extensive review by Martínez-Gomariz et al. (2018) and recent work by Martínez-Gomariz et al.
(2017). (2)
see Abt et al. (1989), Russo, Gómez, and Macchione (2013), Xia et al. (2014), Martínez-Gomariz et al. (2016)
and the review by Kvocka et al. (2016); older papers also exist.
Table
Click here to download Table: Table 2.DOC

2
(3) see Ishigaki et al. (2008) and Baba et al. (2017)

1
Table 3: Typology of numerical models applied to compute urban flood events
Type of model Typical processes Level of development(4)
Available
exp. data
(Yes, No)
3D RANS(1)
or LES(2)
1 street intersection
Flow around 1 building C Y
2D SWE(3)
Street surface (local to large scale) C Y
2D SWE + porosity models Urban district C / R Y
1D-2D SWE
(1D=streets / 2D=crossroads) Urban district R Y
1D-2D SWE
(1D=sewer / 2D=streets) Coupled flow in streets and sewers R Y
2D SWE or Boussinesq-type
equations Overland Tsunami C Y
Hydrodynamics
+ morphodynamic model
Building foundation scour, sediment
deposits around buildings… U N
Hydrodynamics
+ empirical /analytical
exchange formulae
Flow exchange between streets and
built-up or open areas through
openings (gates, doors, windows…)
U N
Hydrodynamics
+ advection-diffusion model Pollutant transport U N
Hydrodynamics
+ Lagrangian model
Transport of urban furniture and
debris (cars, trees, etc…) U N
Hydrodynamics
+ agent based model Citizen evacuation, rescue access R
(5) N
(1) Reynolds-averaged Navier-Stokes equations;
(2) Large-Eddy simulations;
(3) Shallow-water equations (see Rodi (2017) for details of the models and applications);
(4) C = common practice, R = research models, U = unavailable in the context of urban flood modelling;
(5) Mostly for tsunami cases, see for instance Wang et al. (2016).
Table
Click here to download Table: Table 3.DOC


![Experimental and molecular modelling study of the three ...epubs.surrey.ac.uk/795203/1/FORTE_ETAL_JPCB_2011[smallpdf.com] … · Experimental and molecular modelling study of the](https://static.fdocuments.in/doc/165x107/5ae79aba7f8b9a3d3b8ec3ba/experimental-and-molecular-modelling-study-of-the-three-epubs-smallpdfcom.jpg)