EXPERIMENTAL INVESTIGATION OF THE PRESSURE LOSS...
13
EXPERIMENTAL INVESTIGATION OF THE PRESSURE LOSS THROUGH PERFORATED STRUCTURES IN UNSTEADY FLOW L.J. Pedroso R.J. Gibert Rakenteiden Mekani ikka, Vol. 21 No 1 1988, 42 ••. 54 SUMMARY: The pressure drop associated with singularities in pipe- works in unsteady flow is considered. A parametric experimental approach, using a scale model, is adopted. The singularities consisted of perforated plates and diaphragms. A mathematical model was developed and experimental results were compared against it. The main conclusion was that for values of the parameter UmT/d (the inverse ofa Strouhal number) exceeding unity, the steady flow value for the singularity pressure drop coefficient can be taken, without risk of significant errors. INTRODUCTION Nuclear reactor circuits consists of pipework comprising certain singularities, such as pumps, valves, diaphragms, sharp changes in cross-section, elbows, permanent obstructions, etc ... The occurence of accidental transients (water hammer, depressuri- zation, effects of a sodium-water reaction, ... ) raises the follo- wing question: How do the pressure waves propagate through the singularities? In this connection, it must be borne in mind that a damping effect will be induced by the pressure drop associated with the singular- ity. The method used to answer this question consisted simply in extrapolating conventional results obtained for steady-state flows. But this lacks precision and can lead to errors. Ll" , {_ With a view to solving this problem in a more satisfactory
Transcript of EXPERIMENTAL INVESTIGATION OF THE PRESSURE LOSS...

EXPERIMENTAL INVESTIGATION OF THE PRESSURE LOSS THROUGH PERFORATED
STRUCTURES IN UNSTEADY FLOW
L.J. Pedroso R.J. Gibert
Rakenteiden Mekani ikka, Vol. 21 No 1 1988, 42 ••. 54
SUMMARY: The pressure drop associated with singularities in pipeworks in unsteady flow is considered. A parametric experimental approach, using a scale model, is adopted. The singularities consisted of perforated plates and diaphragms. A mathematical model was developed and experimental results were compared against it. The main conclusion was that for values of the parameter UmT/d (the inverse ofa Strouhal number) exceeding unity, the steady flow value for the singularity pressure drop coefficient can be taken, without risk of significant errors.
INTRODUCTION
Nuclear reactor circuits consists of pipework comprising certain
singularities, such as pumps, valves, diaphragms, sharp changes in
cross-section, elbows, permanent obstructions, etc ...
The occurence of accidental transients (water hammer, depressuri
zation, effects of a sodium-water reaction, ... ) raises the follo
wing question:
How do the pressure waves propagate through the singularities?
In this connection, it must be borne in mind that a damping effect
will be induced by the pressure drop associated with the singular
ity.
The method used to answer this question consisted simply in
extrapolating conventional results obtained for steady-state flows.
But this lacks precision and can lead to errors.
Ll" , {_
With a view to solving this problem in a more satisfactory

manner, we adopted a parametric experiment al approach, using a
scale model .
The singularities analyz e d in the prese nt survey are "flat
singularities" (perforated plates a nd diaphrams) .
TEST SETUP (RIO test rig)
The RIO test rig consists of a water-filled straight tube, 6.0 m
in length, 8 . 5 em in inside diameter, with a wall thickness of
8.0 mm. At the left - hand end of the tube, a piston connected to
an electrohydraulic jack induces motion in the fluid inside the
tube . At the other end, a pressurized tank with a free surface has
been installed, to eliminate cavitation problems and minimize
degassing effects.
Pressure transducers (piezoelectric) are mounted on the side of
the tube, arranged at regular intervals, in a straight line,
troughout its length. The "RIO" test rig is shown in diagram form
in Figure 1.
Pres.sur lzed _tank
Hydraulic jack r Test cross - section
'11 11/li!ll///il / / / tlllll/ 11 11 1 //1 1 /ll/l/1 1/1 I •
Figure 1 . RIO test rig.
The test section is located approx imately in the middle of the
tube and is installed by means of two screw- on metal flanges,
enabling the singularities under investigation to be inserted.
TEST PROCEDURE
As regards the singularities, we analyzed three different sec
tion porosities (0.05, 0.17 and 0.5), either with one hole (dia-

phragm) or with several holes, 8 mm in diameter.
The wall thickness is constant (e = 8.0 mm) (Fig. 2).
"·'/s=O,OS
n=6
0,17
0,50
n=56
Figure 2. Singularities.
Each test consists in repeated sinusoidal sweeping, increasing
in compass (frequency f = 2 to 20Hz), for different piston dis
placement amplitudes (Xm = 2 to 30 mm). The two variables Xm and
f are quantities limited by the maximum piston speed (Vp wXm = 0. 6 m/s).
It should be noted that the Reynolds number varies between 5xl0 2
and 1.2x10 5 .
The air in the pressurized tank is kept at a pressure of 3 bars
and the water used has been degassed and demineralized, with an -2 initial oxygen content of 10 ppm.
Measurement results are presented as time - dependency signals,
power spectral densities, phase and modulus transfer functions,
pressure profiles modulus along the tube.

GENERAL FORMULATION OF THE PROBLEM
Let us consider incompressible fluid motion in a straight
horizontal tube of constant cross-section postulating a viscosity
term represented by a pressure drop ~P, characterized by a Reynolds
dependent coefficient K (K= \ (Re)/Dh' where Dh is the hydraulic
diameter of the tube, and \ the dimensionless friction coefficient).
The governing one - dimensional equations are
Q = Q(t) 1
'-----v-------
Inertia
( 1)
( 2)
'---------v----~
~P1 2 Pressure drop I
where s is the cross - section, Q the mass flow rate and p the fluid
density.
It is seen that the total pressure drop ~P1 2 between two cross-' section s1 and s 2 is equal to the pressure drop induced by viscos-
ity increased by the inertia effect associated with the accelera
tion of the fluid.
Integration of Singularities
By analogy with the tube having a constant cross-section (equa-
v I
D'
I IIIII
! ! !
Figure 3. Zone with singularities.
D'
IV I
----x
45
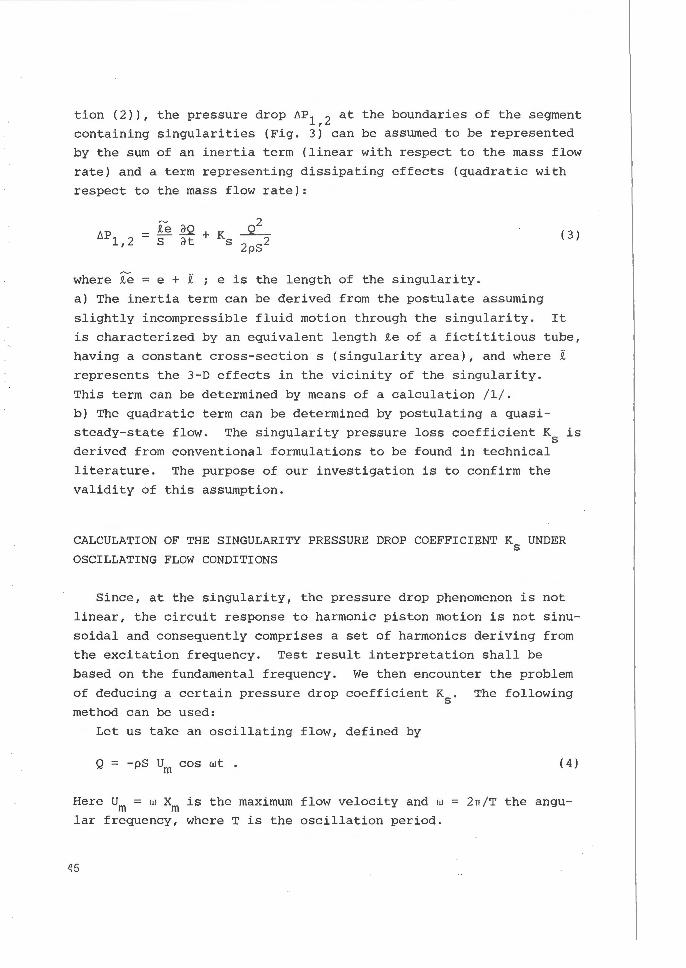
tion (2)), the pressure drop ~P1 2 at the boundaries of the segment ' containing singularities (Fig . 3) can be assumed to be represented
by the sum of an inertia term (linear with respect to the mass flow
rate) and a term representing dissipating effects (quadratic with
respect to the mass flow rate) :
2 £. e .£2 + K ___sr:_ S Clt s 2 pS2
where £. e = e + £ ; e is the length of the singularity.
( 3)
a) The inertia term can be derived from the postulate assuming
slightly incompressible fluid motion through the singularity . It
is characterized by an equivalent length £. e of a fictititious tube,
having a constant cross - sections (singularity area), and where £
represents the 3 - D effects in the vicinity of the s ingularity.
This term can be determined by means of a calculation / 1 /.
b) The quadratic term can be determined by postulating a quasi
steady-state flow . The s ingularity pressure los s coefficient Ks is
derived from conve ntional formulations to be found in technical
literature. The purpose of our investigation is to confirm the
validity of this assumption.
CALCULATION OF THE SINGULARITY PRESSURE DROP COEFFICIENT Ks UNDER
OSCILLATING FLOW CONDITIONS
Since, at the singularity, the pressure drop phenomenon is not
linear, the circuit response to harmonic piston motion is not sinu
soidal and consequently comprises a set of harmonics deriving from
the excitation frequency. Test result interpretation shall be
based on the fundamental freque ncy . We then encounter the problem
of deducing a certain pressure drop coefficient K . The following s method can be used :
Let us take an oscillating flow, defined by
Q = -pS urn cos wt .
Here Urn = w Xm is the maximum flow veloc ity and w
lar frequency, where T is the oscillation period.
( 4)
2n / T the angu -

On the basis of a dimensional analysis, the singularity pressure
drop ter m c an be prese nte d as follows
( 5)
where e = wt, UmT / d is a period parameter = the inverse of a
Strouhal number, Umd/v is the Reynolds number = R~, d is the hole
diameter and s is the hole cross - section.
The ratio K is a periodic function of 8 , the fundamental fre
quency amplitude of which is K1 .
If we assume that K has a form of the type
K5
/cos8/Cos e (with Ks constant)
we obtain
( 6)
(7)
where Ks represents a mean pressure drop coefficient per cycle. It
is this quantity that we shall derive from the test results.
APPLICATION OF THE MODEL TO THE RIO TEST RIG
In order to derive Ks from the pressure measurement results, we
represent the test rig by the following model (Fig. 4).
lD
x'
1
\ / - r:,-- \ .. /
Eau 9, t
L
A
Figure 4. Physical model - RIO/pressurized.
117
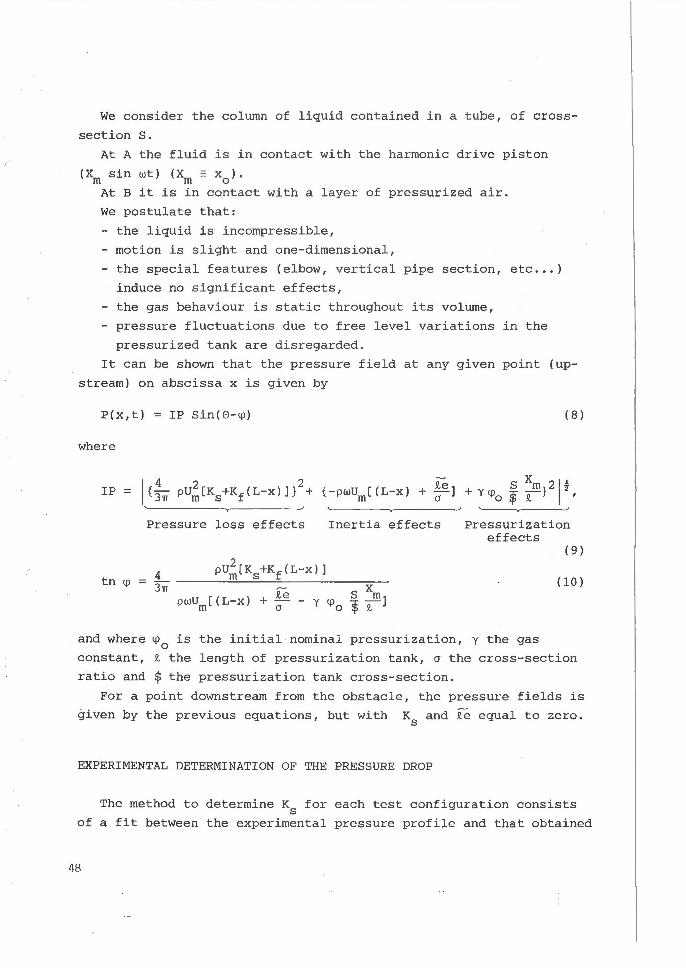
We consider the column of liquid c ontained in a tube, of cross
section s. At A the fluid is in contact with the harmonic drive piston
(Xm sin wt) (Xm = x0
) .
At B it is in contact with a layer of pressurized air.
We postulate that:
- the liquid is incompressible,
- motion is slight and one- dimensional,
the special features (elbow, vertical pipe section, etc ... )
induce no significant effects,
- the gas behaviour is static throughout its volume,
pressure fluctuations due to free level variations in the
pressurized tank are disregarded.
It can be shown that the pressure field at any given point (up
stream) on abscissa x is given by
P(x,t) = IP Sin( G -~) ( 8)
where
IP
tn ~
1{4 U2[K K (L )]}2 { U [(L ) 2e] §. Xm}21! 3TI P m s + f - x + -pw m -x + a + Y ~o !p 2 '
Pressure loss effects Inertia effects '-------v------
Pressurization effects
( 9)
(10)
and where ~ 0 is the initial nominal pressurization, y the gas
constant, 2 the length of pressurization tank, a the cross-section
ratio and $ the pressurization tank cross-section.
For a point downstream from the obstacle, the pressure fields is
given by the previous equations, but with Ks and ie equal to zero.
EXPERIMENTAL DETERMINATION OF THE PRESSURE DROP
The method to determine K for each test configuration consists s of a fit between the experimental pressure profile and that obtained
48

using equations (9) and (10) (Figs. Sa and Sb). In practice,
errors of up to 100 % are observed for the small values of the
parameter UmT/d.
This is because in s uch cases the effects of inertia have a pre
vailing influence on the trend of the pressure field.
In the most favourble cases, the errors are below 10 %.
EXPERIMENTAL RESULTS
Figures 6a to 6d show the main results for singularity pressure
drop coefficients, for two cross section ratios (a = 0.05 and a = 0.17), with one and with several holes.
The ratio between pressure drop coefficients under oscillating
flow conditions Ks and under steady state conditions KP /2/, is
plotted versus UmT/d.
It will be noted that the Ks-behaviour differs considerably from
the Kp-behaviour.
Ks diminishes, at the outset, relatively fast and then gradually
with UmT/d.
Its final value is almost identical with that of KP.
Generally speaking, within the limits of the values investigated,
Ks exceeds KP Major differences are observed for the largest
cross-section ratios. Also noteworthy are the scattered results
obtained for low UmT/d.
This is due to the measurement error previously mentioned, but,
certainly, also to the fact that UmT/d is not the only parameter
affecting the problem (see equation (5)). The Reynolds number
varies considerably from one experimental point to another.
CONCLUSIONS
The main conclusion of this survey is that for values of the
parameter UmT/d exceeding unity, the steady flow value for the
singularity pressure drop coefficient can be taken, without risk of
significant errors. This limit value of UmT/d tends to increase in
cases where the cross-section ratios are large.
In the case of small UmT/d values, the dispersion effect with
49

0,4
0,3
0,2
0,1
0
)(,::2,0mm
a=1,0
0 fo : 3,0 bars
---------o----o--o~o~~----~-----a-----r~.o-----~ I .
2,74Hz I I 5,6Hz l 11,26Hzj
I , I I I .
: ! Expe ri ment a l results : ! (a lcul : !
0 • tJ.
: I : i I . I I I .
: I o~~~~~~-L----~r--d--~~~6-~--r-A---~~-~/~~~~--~~~J~--
P!xl bars IP!xl mbars i
)(,:2,0mm 0 Je : 3,0 bars a=1,0
30
Figure Sa. Phase shift and pressure profile versus frequency (tube without singularities).
50

l41lxll
2000
1QOO
g
Po
Exper imental results o Ca.lcul
tb :20mm a :0,05 f : 2,78Hz !0,13
9 g
p6
___ o __ 0 _.s:..- 4, 9mm
Pa P9 Pro Pn P12
•
I
PrJ P:s p11 P2o p21
IPixll (bars) IPixll J
0,2
0,1
--·--·- · . - ·- ·- ·-.--.-· • • •
Ks experimental results
Calcul
• 603 682 634
0
¢=20mm a =0,05 f :2,7SHz ! 0,13
Figure Sb. Phase shift and pressure profile versus piston motion (tube with singularities) .
- 1,0
51

, .. r (ks/kp) : T....,
----:\ ..,. . i ~
.1. 50 i ' , I ~ .
i
I : h
1. 00
£
0. 50-
T
I C1
'r 6. i ~ · •
'· t_ X
t:_· .. .._ X
- !1 . . .... ...... .
= 0.05
"
- ~ - l'fi Oy enn Q
• f :r28, hz
• f =ta. hz
• f=t4 . h z
.. f~ 12. hz
6 f =t a. hz
~ f ~ a. 8hz
£ r ~ 7. 8hz
- ~ f~b . 8hz ~~--------1
.. f ~ 5. ahz
o f~ 4. 6hz
• f~J . 15hz
't' f:o] , 5hz
o f~J . 25hz
o f' J. 6h z
0.00~-----,----~-----.-----,------,-----,-,----,,------,-,----lr-.~~f'l2.~7;5h~zl 0 b 7 8 x f=2. 5hz
( u.l/a )
Figure 6a . Variation of the ratio (ks/kp) ve rsus period par ameter for several frequencies(l x 20 mm) .
.2. 50
(ka/kp)
2.00-
1. 50-
1. 00
0. 50
'7' I .. i I
! ~
i
... ~
a ~
$ .. _
"
"
X
l ·-· ---· ·------ ~
- o - moyenne
+ I~ 16. h z
.. f = lb. hz
Y t'= 14,1H
+ f '1 2. hz
t. f = 1'3. hz
'( 1•9 . 8hz
<t r~a . Bhz
£ r ~ 7. ahz
$ f~b . 8hz
-·----- --- .. ------ -------- --- --~ t-:-:-:-:-: :-:-:_, • f'l . 15hz
~ I•J . \ hz
o I• J. 25 hz
0.00~---,---,----,---,1----.-1 --.----.---.----.-1 --.-1 --,1r-·~-~f~•2~. ~~ 5~h z 0 2 b 8 10 12 14 1b 18 20 2 2
( u.l/a )
Figure 6b . Variation of the ratio (ks/kpl versus period par ame t e r for several frequencies (6 x8 mm).
'i2

(kl/kp) b
5
3-
2-
1-
i-1 ;. -! i
<) -X'
* X
£
a = 0.17
-t ____ .j- ·; --- .. -- -~
... 'r
l------- -. ------ · --., -- .....
-o - moyQ nn t
• f•2&. hz
.. f•18. hz
+ f:lb. hz
+ f•14. hz
+ (•12 . hz
• f•18. hz
,; ·f·9 . 8hz
¢ f•B. 8hz
£ f•J. 8hz
t f•b. 8hz
• f• 5. 8hz
• f•4 . 8hz
* f•J. 75hz
x f•J. 5hz
o f•J. 25hz
o f•J. 8hz 0~--~.-~-~-T----.-~---,-I---,1----,I-----r----r----,----,----,r-.~f,f.~2~. 7~5h,hz~ .00 .50 1.00 1.50 2.00 2.50 3.00 3.50 4.00 4.50 5.00 5. x f•2 .5hz
( u.f/b )c__ ___
Figure 6c. Variation of the ratio (k5
/kp) versus period parameter for several frequencies (l x35 mm).
(ka/kp)
8- -
•
-o- moyenna
• f=29. hz
.. f•18. hz
• fotb. hz
b-
......... I
.. • f•14 . hz
+ f•12. hz
• f•18 . hz • 5 .. 't f•9. 8hz
3
2
....... --<> -
<)
' ' '
¢ f•a. 8hz
£ f•J, 8hz
f•b. 8hz $ \ ~ i • f:t5 .9 hz . "~' •J ' ·-
. ~\ / j • f=4 . 9hz
~ '. . ,. " • f•J . 15hz ' ,, ~ ~ 1 T I ... r ~J. 5hz
~ ; i : r- ----t---j--------~---------------- -- ---- -- ----------r. 0 f• J. 25hz
$-t . ! <> o f=l.Bhz
04-~-~·~~~-:_~i~ --~~~---.-1 ---.----~1-----.----.----.----.----,-l -~~.~f.r·~2~.1~5;hz~ 0 2 4 b 8 10 12 14 lb 18 20 22 x f•2.5h z
( u.f/~ , )
Figure 6d. Variation of the ratio (k5/kpl versus period parameter for several frequencies (l9 xB mm) .
53

respect to K would appear to be significant , but, owing to measure s ment errors, it is difficult to determine the relative influence of
U T/d and the Reynolds number. m
However, it must be remembered that, in these cases, pressures
drop effects are slight as compared with inertia effects.
REFERENCES
[1) Durandet, E.; Gibert, R.J. , Effects of Fluid Communications between Fluid Volumes on the Seismic Behaviour of Nuclear Breeder Reactor Intervals to be presented at 9th SMIRT, Lausanne, Aug. 17.21, 1987.
[2] Idel ' cik, J.E., Memento des pertes de charge, Eyrolles, Paris 1986.
[3] Pedroso, L.J., Qualification experimentale des methodes de calculs des interactions fluide-structure dans les circuits tubulaires des reacteurs nucleaires, These de Doctorat, INSTN/ DEMT, CEA, Saclay, 1986.
[4] Matten, R.B., The Influence of Surface Roughness upon the Drag of Circular Cylinders in Waves, In: Off-shore Technologie Conference OTC 2902, pp. 185- 194, May 1977.
[5] Sarpkaya, T., Forces on Cylinder and Spheres in a Sinusoidal Oscillating Fluids, J. of Appl. Mech., Trans. of the ASME, May 1975, pp. 32-37.
[6] Sarpkaya, T., Forces on Cylinder near a Plane Boundary in a Sinusoidal Oscillating Fluid, J. of Fluids Eng., Trans. of the ASME, Sept. 1976, pp. 499-505.
[7) Susbielle, G. et Bratu, c., Vagues et ouvrages petroliers en mer, Publication de l'IFP, Editions Technip, Paris, 1981.
[8] Hogben, N. et al., Estimation of Fluid Loading of Off-shore Structures, Proc. Inst. Civil Engs., part 2, pp. 512-562, 1977.
[9] Bushnell, M.J., Forces on Cylinder Arrays in Oscillating Flow, In: Off-shore Technology Conference; OTC 2903 , May 1977; p. 193.
[10] Paape, A. and Breuseurs , H.N.C., The Influence of Pile Dimensions on Forces Excerted by Waves, DELFT Hydraulics Laboratory, Publication no 41, Oct. 1966.
L.J . Pedroso, R.J. Gibert, Commissariat A l'Energie Atomique, Division d'Etude et de Developpement des Reacteurs Departement des Etudes Mecaniques et Thermiques Laboratoire des Vibrations et Seismes, Centre d'Etudes Nucleaires de Saclay, 91191 Gif s/Yvette Cedex, FRANCE
54