An Experimental Investigation of Torque Loss in a Die Cast ...
Journal of Mechanical Science and Technology 26 (2) (2012) 473~479
www.springerlink.com/content/1738-494x DOI 10.1007/s12206-011-1031-6
Modeling and experimental evaluation of torque loss in turbine test rig
for accurate turbine performance evaluation† Jeong-Seek Kang1,* and Soo-Seok Yang2
1Turboshaft Engine Team, Korea Aerospace Research Institute, Daejeon, 305-333, Korea 2Aeropropulsion Team, Korea Aerospace Research Institute, Daejeon, 305-333, Korea
(Manuscript Received March 22, 2011; Revised August 27, 2011; Accepted October 4, 2011)
----------------------------------------------------------------------------------------------------------------------------------------------------------------------------------------------------------------------------------------------------------------------------------------------
Abstract The performance of a turbine is evaluated through a turbine rig test by measuring the torque or power generated from the test turbine
using a dynamometer or torque sensor installed in the test rig. Highly precise assessment requires accurate measurement of the torque or power. However, an intrinsic difficulty exists such that not all power generated by the turbine is measured by the dynamometer or torque sensor. A small portion of power generated from the test turbine is dissipated between the test turbine and torque sensor as bearing and windage losses. The dissipated energy is called mechanical loss of test rig. Therefore, measuring the mechanical loss of the test rig is necessary for the accurate evaluation of the turbine performance. The present paper classifies mechanical loss into bearing, disk windage, and extra windage losses. Spin-down tests are performed in a 1-stage axial turbine test rig to evaluate each loss. The total mechanical loss amounts to 0.78% to 1.4% of energy generated at the turbine. Bearing loss is dominant. Mechanical loss is dependent on and increases with decreasing bearing temperature.
Keywords: Bearing loss; Mechanical loss; Spin-down test; Torque loss; Turbine test rig. ---------------------------------------------------------------------------------------------------------------------------------------------------------------------------------------------------------------------------------------------------------------------------------------------- 1. Introduction
The performance test of a test rig is used to measure and as-sess experimentally the performance of a turbine. The effi-ciency of a turbine is defined in Eqs. (1) and (2).
1
21
1
100
1
TT
Op O
O
Torque
PmC TP
γγ
ωη−
•
×= ×
⎡ ⎤⎛ ⎞⎢ ⎥
− ⎜ ⎟⎢ ⎥⎝ ⎠⎢ ⎥
⎣ ⎦
(1)
1
21
1
100
1
TS
p OO
Torque
PmC TP
γγ
ωη−
•
×= ×
⎡ ⎤⎛ ⎞⎢ ⎥
− ⎜ ⎟⎢ ⎥⎝ ⎠⎢ ⎥
⎣ ⎦
(2)
These equations use output torque to calculate turbine effi-
ciency. Thus, the accuracy of torque measurement is directly connected with the accuracy of efficiency evaluation. The output torque is measured through a torque sensor or dyna-mometer driven by the test turbine. However, there is intrinsic
difficulty in the accurate measurement of the output torque. A small amount of the output torque generated by the turbine is not measured by the torque sensor but dissipates through the mechanical system between the test turbine and the torque sensor. The primary source of this parasitic loss is the bearing system of the test rig. The frictional loss of the bearing system results in wasted energy and heat generation. Another source of parasitic loss is windage loss, which is aerodynamic loss of rotating parts. The sum of these parasitic losses is called me-chanical loss in the present paper.
The amount of mechanical loss is dependent on the test rig. Traditionally, this value was inferred to be approximately 1% of the total energy generated by the turbine. The amount reaches over 5% in some small turbines [1]. These values are very large considering the recent research trend and test re-quirement. Hudson et al. [2] studied the uncertainty of rocket turbine efficiency to determine Uη/η within 1%. And the pur-pose of most recent experimental studies on turbine perform-ance enhancement is to increase turbine efficiency about 1% or less. For example, the enhancement of efficiency through the vane or blade clocking is less than 0.7% [3-5]. The effi-ciency uncertainties in recent experimental studies are less than 0.2% [6, 7]. Considering these research trends and test requirement, the uncertainty of efficiency in a test rig should be minimal, and the accuracy is required to be very high. This
† This paper was recommended for publication in revised form by Associate EditorTong Seop Kim
*Corresponding author. Tel.: +82 42 860 2237, Fax.: +82 42 860 2626 E-mail address: [email protected]
© KSME & Springer 2012

474 J.-S. Kang and S.-S. Yang. / Journal of Mechanical Science and Technology 26 (2) (2012) 473~479
condition is the same with the mechanical loss directly affect-ing the efficiency of a turbine. The accuracy of performance test result is dependent on the accuracy of mechanical loss measurement. In many cases, the mechanical loss is measured before the turbine performance test. A standard step in the calculation of turbine efficiency is the addition of loss torque to the measured torque [2]. However, measuring the loss torque in a turbine rig is difficult, and some studies [2, 8] openly explain that the loss in torque was unmeasured in these studies.
Spin-down test is widely used [9-13] to evaluate loss torque in a turbine test rig. This method measures the speed of tur-bine and other parameters as the turbine decelerates because of the loss torque. These tests are performed in the present study to evaluate loss torque. A classification of losses and the experimental results of mechanical loss in a turbine test rig are presented in the current research.
2. Turbine test rig and facility
The experimental test was performed at the ATTF in KARI [14]. The conceptual layout and specification of the facility are shown in Fig. 1 and Table 1, respectively. The air com-pressor supplies pressurized air to the test turbine, whereas the speed and the torque are controlled by the dynamometer. A picture of the test facility is shown in Fig. 2. The facility ac-commodates 1-stage axial turbine. Specifications are shown in Table 2.
The concept of rotor system from turbine to dynamometer is shown in Fig. 3. This system is composed of turbine blades,
disk, main shaft, couplings, connecting shaft, shaft and disk of dynamometer, and bearings. The dynamometer is eddy current type. A pair of ball bearings lubricated by oil mist is installed in the turbine rig, and another pair of ball bearings lubricated
Table 2. Specification of 1-stage axial turbine.
Tip diameter of rotor (mm) 1096
Hub diameter of rotor (mm) 968
Number of blade 122
Number of nozzle vane 48
Design flow rate (kg/s) 10.8
Design pressure ratio 1.23
Turbine inlet temperature (K) 312
Fig. 2. Picture of ATTF in KARI.
BearingCouplingDynamometer
Turbine blades
BearingCouplingDynamometer
Turbine blades
(a)
Ventilation loss
bρ
dρ
Disk windage loss
Bearing loss
Extra windage loss
bρ
Ventilation loss
bρ
dρ
Disk windage loss
Bearing loss
Extra windage loss
bρ
(b) Fig. 3. (a) Conceptual drawing of rotor system; (b) loss classification in spin-down test.
Table 1. Specifications of ATTF.
Max. air flow rate (kg/s) 12
Max. power of dynamometer (kW) 250
Max. torque of dynamometer (Nm) 1200
Max. rotational speed (rpm) 8000
Max. turbine inlet pressure (kPaA) 230
Max. turbine inlet temperature (°C) 110
① ② ③
④
⑤⑥⑦⑧⑨
① Air supply compressor ② Heat exchanger③ Dryer ④ Inlet valves ⑤ Flow straightener ⑥ Test turbine ⑦ Dynamometer ⑧ Throttle valve ⑨ Silencer
① ② ③
④
⑤⑥⑦⑧⑨
① Air supply compressor ② Heat exchanger③ Dryer ④ Inlet valves ⑤ Flow straightener ⑥ Test turbine ⑦ Dynamometer ⑧ Throttle valve ⑨ Silencer
Fig. 1. Conceptual drawing of axial turbine test facility (ATTF) in Korea Aerospace Research Institute (KARI).

J.-S. Kang and S.-S. Yang / Journal of Mechanical Science and Technology 26 (2) (2012) 473~479 475
by grease is installed in the dynamometer. The test turbine is a 1-stage axial turbine. The rotor tip di-
ameter is 1096 mm, pressure ratio is 1.3, design speed is 2042 rpm, turbine inlet pressure is 161 kPa, turbine inlet tem-perature is 312 K, and the design flow rate is 10.8 kg/s. The measurement uncertainty of torque and speed is shown in Table 3.
3. Modeling and classification of loss
The power generated by the turbine is equal to the sum of the power absorbed by the dynamometer and the mechanical loss (Eq. (3)).
Turbine Dynamometer Mechanical lossPower Power Loss= + (3)
Atkins et al. [9-11] and Denos et al. [12] decomposed the
mechanical loss to bearing and windage losses (Eq. (4)).
loss bearing windageT T T= + (4)
The windage loss in various studies [9-12] indicates disk
windage loss. However, strictly speaking, there are minor windage losses in the shaft and couplings, among others. This condition is named as extra windage loss. In the current paper, the windage loss is decomposed to disk windage and extra windage losses (Eq. (5)).
_ _windage windage disk windage extraT T T= + (5)
Thus, the total loss can be expressed as:
_ _ .loss bearing windage disk windage extraT T T T= + + (6)
Mechanical loss must be defined more clearly. Bearing loss
is loss caused by mechanical friction and disk windage losses, whereas extra windage loss is from aerodynamic characteris-tics. All these phenomena are parasitic losses that need cali-bration in the actual turbine test. Bearing loss is assumed to be the main source of loss. Thus, the sum of the three losses, Tloss, in Eq. (6), is called mechanical loss in the present paper.
Spin-down tests are performed to measure the loss torque. The driving air through the turbine is shut off when the turbine is running in a test condition. The dynamometer load is set to zero torque. The turbine then shifts to a free rotating condition without constraining power except the loss. At this condition, the speed of the turbine decreases because of the mechanical
loss and additional drag loss on the blades caused by the flow drag of the still air on the rotor blades. Denos et al. [12] named this condition as ventilation loss, expressed in Eq. (7).
2
2 22 1
1
1 ( )2
t
t t Spin Downt
E I T dtω ω ω−Δ = − = ∫ (7)
spin down loss ventilationT T T− = +
_ _bearing windage disk windage extra ventilationT T T T= + + + (8)
The ventilation torque can be expressed as Eqs. (9)-(11).
ventilation ventilationT F r= × (9)
2 212ventilation b D bF V ACρ ρ ω= ∝ (10)
2 212ventilation b D bT r V ACρ ρ ω= ∝ (11)
Denos et al. [12] and Traupel [15] formulated ventilation
loss in Eq. (12), and its concept is same as that of Eq. (11).
32 2
2ventilation b ventilation bDT Cρ ω ρ ω⎛ ⎞= ∝⎜ ⎟
⎝ ⎠ (12)
Disk windage loss can be expressed in Eq. (13) according to
Eq. (16).
2 5_
12windage disk m d dT C rρ ω= (13)
From Eqs. (11) and (13), the disk windage and ventilation
torques are clearly proportional to the air density. Hence, if the air density around the blade becomes zero, that is, if the abso-lute pressure becomes zero inside the turbine rig, then the ventilation loss vanishes. The remaining loss torque in spin-down test will become equal to the mechanical loss at turbine test as shown in Eq. (14).
_ _spin down bearing windage disk windage extra lossT T T T T− = + + =
if 0bρ = (14) If the air pressure around the blade is zero in the spin-down
test, then the ventilation loss vanishes, and the mechanical loss in the spin-down test is the same as that in turbine rig test.
4. Experimental method
To shut off the driving air when the turbine is running, the inlet and outlet valves of the air flow to the turbine are gradu-ally closed. The inlet valve and the outlet throttle valve are shown in Fig. 1. When the valves are fully closed, the torque at the dynamometer is set to zero. Thus, the turbine speed decreases because of the mechanical and the ventilation losses
Table 3. Uncertainty of torque and speed.
Precision uncertainty (%)
Bias uncertainty (%)
Total uncertainty (%)
Torque 0.27 0.25 0.37
Speed (ω ) 0.02 0.08 0.08
476 J.-S. Kang and S.-S. Yang. / Journal of Mechanical Science and Technology 26 (2) (2012) 473~479
as explained in Section 3. A vacuum needs to be created in-side the rig to make the torque equal to zero by the ventilation (Eq. (14)). However, transforming that large volume into a vacuum state in a short time is difficult. Thus, the ventilation loss was considered in another way. Given that the ventilation loss is proportional to the air density around the blade (ρb) as expressed in Eqs. (11) and (12), the data can be extrapolated if there are two or more density conditions. The ventilation loss can be evaluated in this manner, and the mechanical loss can then be evaluated using Eq. (14). Ventilation loss is isolated from other losses and measured in the rotating turbine rig. The result is shown in the following discussions.
5. Results and discussion
The trace of rpm in a spin-down test is shown in Fig. 4. The driving air is shut off, and the torque at the dynamometer is set to zero. The speed of the turbine decreases with time because of mechanical and ventilation losses. In this case, the turbine inlet pressure is almost equal to the atmospheric pressure, and approximately 30 min had elapsed for the turbine to com-
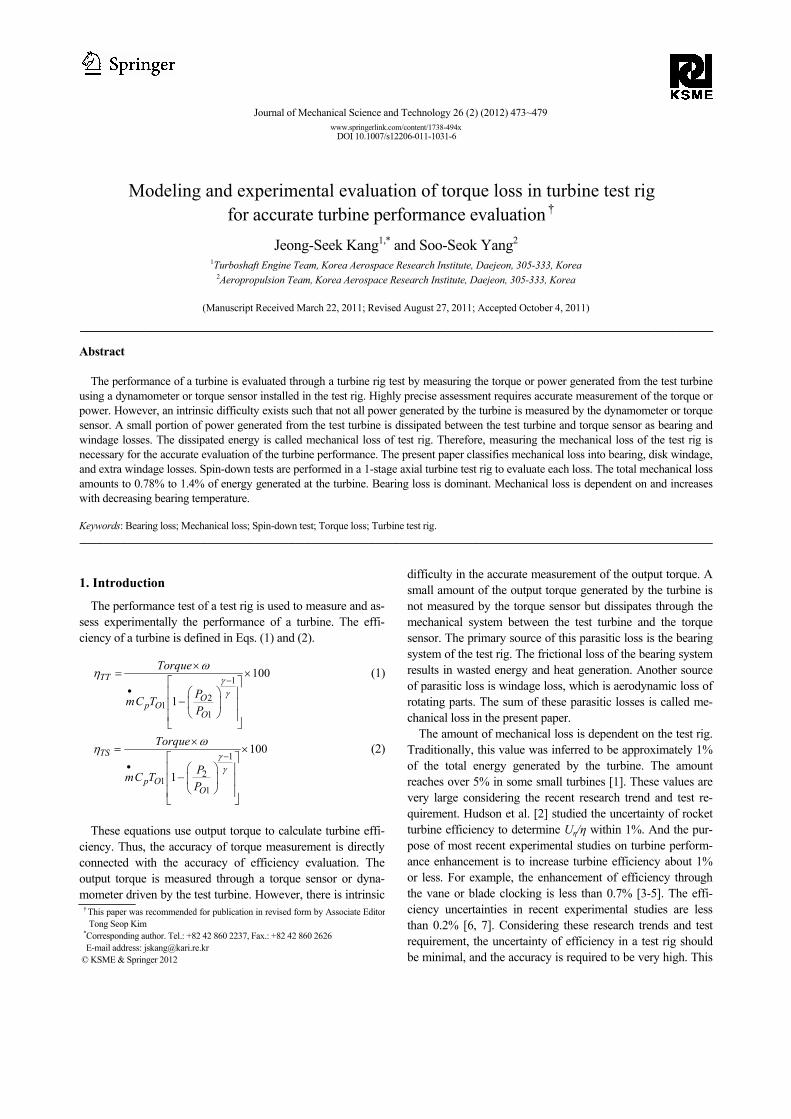
pletely stop. The total loss torque in the spin-down test (Tspin-
down) calculated from the data in Fig. 4 is shown in Fig. 5. The total loss torque tends to increase with rpm and finally be-comes zero when rpm becomes zero. The slope of the total loss torque is not constant but tends to increase with rpm. When the speed is less than 50 rpm, the trend of rpm and loss torque becomes interesting. The total loss torque is very high and unstable and becomes zero, similar to that when there is an abrupt decrease in speed in Fig. 4. The repeated tests in Fig. 6(a) show similar results making the test reliable. The repeated tests are curve fitted as shown in Fig. 6(b) to obtain the aver-aged data.
The frictional loss in the bearing is dependent on the viscos-ity of the lubricating oil, which is a function of its temperature. Thus, the relation between loss torque and bearing tempera-ture is investigated to consider the bearing temperature. As the viscosity of oil decreases with temperature, the mechanical loss is expected to decrease with temperature. Additional spin-down tests are performed to verify this. The results are shown in Fig. 7. The data when the bearings are warmed up are ob-tained from tests 1 to 4 (warm case), whereas the data when the bearings are not warmed up are obtained from tests 5 and 6 (cold case). The temperature difference between the two
0 500 1000 15000
200
400
600
800
1000
1200
1400
1600
1800
2000
time (sec.)
rpm
Fig. 4. The speed of rotor versus time plot in spin-down test. When thedriving air is shut off and the torque at the dynamometer is set to zero, then the speed of rotor decays with time.
Fig. 5. The total loss torque in spin-down test calculated from the data of Fig. 4.
(a)
0 500 1000 1500 20000
10
20
30
rpm
Test 1Test 2Test 3Test 4Curve Fitting
(Tspin-down = 0.0000065 rpm2 + 0.0027 rpm + 0.90)
(b) Fig. 6. (a) The total loss torque in repeated spin-down tests; (b) its curve fit result.

J.-S. Kang and S.-S. Yang / Journal of Mechanical Science and Technology 26 (2) (2012) 473~479 477
cases is 25°C. Results show that the total loss torque of cold case is higher than that of warm case, indicating that total loss torque increases with decreasing bearing temperature. Hence, the test should be performed at the same bearing temperature with the actual test condition to measure accurately the me-chanical loss.
The pressure (a) and density (b) inside the turbine test rig in two different tests are demonstrated in Fig. 8. These tests are
performed to eliminate the ventilation loss from the total loss. Given that the ventilation loss is proportional to the air density around the blades (Eqs. (11) and (12)), this loss can be evalu-ated from the two data sets measured at two different densities. The total loss torque (Tspin-down) of the two cases is shown in Fig. 9. To eliminate the ventilation loss in the spin-down test while considering the disk windage loss, the air density around the disk should remain as ρd and independent from ρb. However, the pressure around the disk becomes the same as the pressure around the blade during the spin-down test when the net flow through the turbine is zero. In this case, distin-guishing the ventilation loss from disk windage loss is impos-sible. The differences in the loss torque in Fig. 9 are the sum of ventilation and disk windage losses. These differences are extrapolated to zero density, and the remaining loss in zero density is shown in Fig. 10. This loss is the sum of bearing and extra windage losses. The average torque by mechanical loss is 6.9 Nm in the speed range shown in Fig. 10 and equal to 0.95% of total torque measured by the dynamometer at the test condition. The maximum and minimum values are 1.3% and 0.74% of the total torque, respectively, measured by the
Fig. 9. Total loss torque at two different rig pressures. The difference of these two data is due to ventilation loss and disk windage loss at an operating pressure.
Fig. 10. Torque by bearing and extra windage loss.
Fig. 7. The effects of bearing temperature on the total loss torque inspin-down tests.
1000 1100 1200 1300 14000
20000
40000
60000
80000
100000
120000
140000
rpm
P o(P
a)
Test at atmospheric pressureTest at higher pressure
(a)
1000 1100 1200 1300 14000
0.5
1
1.5
2
rpm
ρ(k
g/m
3 )
Test at atmospheric pressureTest at higher pressure
(b) Fig. 8. (a) Pressure; (b) density of air inside the turbine rig under two different pressures.
478 J.-S. Kang and S.-S. Yang. / Journal of Mechanical Science and Technology 26 (2) (2012) 473~479
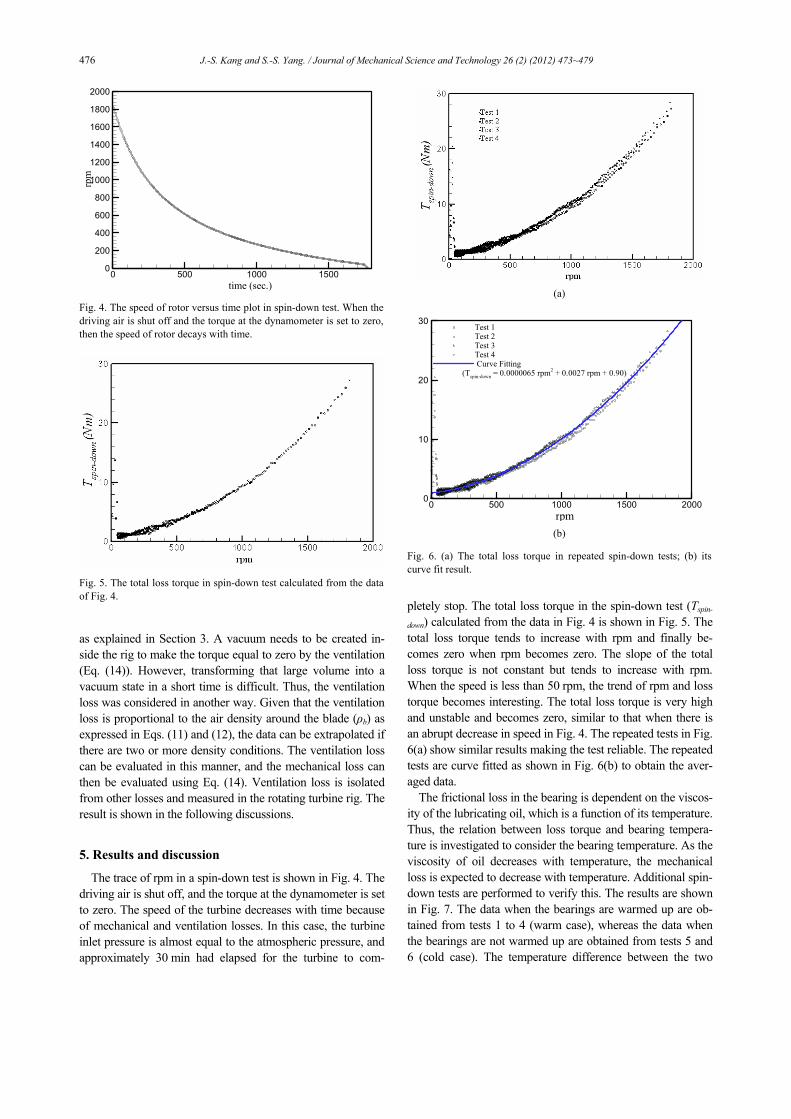
dynamometer at the test condition. Given that the disk windage loss is unmeasured experimen-
tally, this loss is calculated from the modeling of Daily et el. [16]. The results are shown in Fig. 11. The average value of the disk windage loss amounts to 6.2% of bearing and extra windage losses. The disk windage loss is added to the data in Fig. 10 to determine the final result of mechanical loss in ac-tual turbine test (Fig. 11). The mechanical loss is found to be 0.78% to 1.4% of the torque measured by the dynamometer. The average percentage values of each loss are summarized in Table 4. Assuming that the extra windage loss is comparable with or less than the disk windage loss, the dominant factor in mechanical loss is bearing loss. Although the ventilation loss is less than bearing loss, the ventilation loss is remarkably larger than the two windage losses and is not negligible.
For more accurate evaluation on the mechanical loss, axial load must be considered. The axial load between actual tur-bine and spin-down tests is different because of the flow through the blade, and this load affects the thrust bearing loss. Axial load is dependent on the operating conditions of the turbine, and the direct measurement of this value in the turbine test is difficult to achieve. Denos et al. [12] considered axial load from the bearing manufacturer data, and it amounted to 6.9% of other loss torque at an operating speed.
6. Conclusion
The methodology to evaluate the mechanical loss of a tur-bine test rig is introduced, and the spin-down test is performed in a 1-stage axial turbine test rig. The mechanical loss is clas-sified into bearing, disk windage, and extra windage losses.
The unnecessary ventilation loss is generated at the blade in the spin-down test, and a method to quantify this loss is pre-sented. To quantify the ventilation loss, the spin-down tests are repeated under different rig pressures. Although the venti-lation loss is less than the bearing loss, ventilation loss is far larger than the two windage losses and is not negligible. Without this type of loss, the bearing loss is the dominant loss compared with the other windage losses. The mechanical loss in turbine rig test amounts to 0.78% to 1.4% of the energy generated by the turbine.
Nomenclature------------------------------------------------------------------------
A : Projected area C : Constant CD : Drag coefficient Cm : Torque coefficient Cp : Specific heat at constant pressure Cventilation : Ventilation coefficient D : Diameter Fventilation : Drag force by ventilation loss I : Moment of inertia m•
: Mass flow rate P : Pressure Po : Total pressure r : Radius rd : Radius of disk rpm : Revolution per minute t : Time Tbearing : Torque by bearing loss Tloss : Torque by mechanical loss Tspin-down : Torque in spin down test Tventilation : Torque by ventilation loss Twindage : Torque by windage loss Twindage-disk : Torque by disk windage loss Twindage-extra : Torque by extra windage loss To : Total temperature Uη : Uncertainty estimate of efficiency V : Velocity
Greek
γ : Specific heat ratio ΔE : Loss energy ηTS : Total-to-static efficiency ηTT : Total -to-total efficiency ρ : Air density ρb : Air density around blade ρd : Air density around disk ω : Angular speed
References
[1] S. Tanaka, K. Isomura, S. Togo and M. Esashi, Turbo test rig with hydroinertia air bearings for a palmtop gas turbine,
Table 4. Classification of loss torque in spin-down test.
Bearing + extra windage loss (%) 54.0 Mechanical loss
Disk windage loss (%) 3.2
Ventilation loss (%) 42.8
Sum (%) 100
1000 1100 1200 1300 14000
5
10
15
20
25
rpm
Bearing loss + Extra windage lossDisk windage loss (Daily et al., 1960)Mechanical loss in actual turbine test
Fig. 11. Mechanical loss torque in actual turbine test. Disk windage loss is calculated from the modeling of Daily et al. (16).

J.-S. Kang and S.-S. Yang / Journal of Mechanical Science and Technology 26 (2) (2012) 473~479 479
Journal of Micromechanics and Microengineering, 14 (2004) 1449-1454.
[2] S. T. Hudson and H. W. Coleman, Analytical and experi-mental assessment of two methods of determining turbine ef-ficiency, AIAA Journal of Propulsion and Power, 16 (5) (2000) 760-767.
[3] T. Behr, L. Porreca, T. Mokulys, A. I. Kalfas and R. S. Ab-hari, Multistage aspects and unsteady effects of stator and ro-tor clocking in an axial turbine with low aspect ratio blading, (2004) ASME Paper No. GT2004-53612.
[4] L. He, T. Chen, R. G. Wells, Y. S. Li and W. Ning, Analysis of rotor-rotor and stator interferences in multi-stage turbo-machines, ASME Journal of Turbomachinery, 124 (2002) 564-571.
[5] J. E. Krysinski, J. R. Blaszczak and A. Smolny, Stator clock-ing effects on 3D flow in a two-stage low-pressure turbine, (2005) ASME Paper No. GT2005-68811.
[6] G. Pullan, J. Denton and E. Curtis, Improving the perform-ance of a turbine with low aspect ratio stators by AFT-loading, (2005) ASME Paper No. GT2005-68548.
[7] K. Reid, J. Denton, G. Pullan, E. Curtis and J. Longley, The interaction of turbine inter-platform leakage flow with the mainstream flow, ASME Journal of Turbomachinery, 129 (2007) 303-310.
[8] W. B. Roberts, P. S. Prahst, S. Thorp and A. J. Strazisar, The effect of ultrapolish on a transonic axial rotor (2005) ASME Paper No. GT2005-69132.
[9] N. R. Atkins, R. J. Miller and R. W. Ainsworth, The devel-opment of aerodynamic measurements in a transient test fa-cility, (2004) ASME Paper No. GT2004-53813.
[10] N. R. Atkins and R. W. Ainsworth, The measurement of shaft power in a fully scaled transient turbine test facility, (2005) ASME Paper No. GT2005-68998.
[11] N. R. Atkin, R. W. Ainsworth and N. W. Harvey, Aerody-namic performance measurement in a fully scaled transient turbine test facility, (2007) ASME Paper No. GT2007-27142.
[12] R. Denos, G. Paniagua, T. Yasa and E. Fortugno, Determi-nation of the efficiency of a cooled HP turbine in a compres-
sion tube facility, (2006) ASME Paper No. GT2006-90460. [13] R. C. Keogh, G. R. Guenette and P. T. Sommer, Aerody-
namic performance measurements of a fully-scaled turbine in a short duration facility, (2000) ASME Paper No. 2000-GT-486.
[14] J. S. Kang, B. J. Cha and S. S. Yang, Development of the fast-response total pressure probe for turbomachinery appli-cation, (2006) 11th ISROMAC.
[15] W. Traupel, 1958, Thermische turmomaschinen, Bd. 1. Springer, Gottingen, Heidelberg, Germany (1958).
[16] J. W. Daily and R. E. Nece, Chamber dimension effects on induced flow and frictional resistance of enclosed rotating disks, ASME Journal of Basic Engineering, 82 (1960) 217-232.
Jeong-Seek Kang is a senior researcher at the Korea Aerospace Research Institute, Daejeon. His research topics include turbo compressor, turbine, gas turbine, and turbomachinery for aero propulsion and power generation. He received his Ph.D. in Mechanical and Aerospace Engineering from Seoul
National University in 2002.
Soo-Seok Yang has been working in the Korea Aerospace Research Institute since 1985. His research area is the de-sign, analysis, and test of the air-breathing engines, such as gas turbine, ramjet, and scramjet engines. He is also interested in the area of the large size gas turbines used in the power plant. He
received his B.S. and M.S. degrees in Aeronautical Engineer-ing from the Seoul National University in 1983 and 1985. He also received his Ph.D. in Mechanical Engineering from the Korea Advanced Institute of Science and Technology in 1999.