EXPERIMENTAL INVESTIGATION OF … EXPERIMENTAL INVESTIGATION OF WIDESPREAD DELAMINATION DAMAGE TO...
20
AFCEC-CX-TY-TP-2013-0006 EXPERIMENTAL INVESTIGATION OF WIDESPREAD DELAMINATION DAMAGE TO COMPOSITE MATERIALS CAUSED BY RADIANT HEATING R. Bocchieri, Douglas S. Dierdorf, Kristofor S. Cozart, Steven P. Wells, Steven W. Kirkpatrick, Robert A. MacNeill Applied Research Associates, Inc. 421 Oak Drive Panama City, FL 32401 John R. Hawk Air Force Civil Engineer Center Readiness Directorate Requirements and Acquisition Division 139 Barnes Drive, Suite 1 Tyndall Air Force Base, FL 32403 Contract No. FA4819-09-C-0030 June 2013 DISTRIBUTION A. Approved for public release; distribution unlimited. AFCEC-1332, 9 July 2013. AIR FORCE CIVIL ENGINEER CENTER READINESS DIRECTORATE Requirements & Acquisition Division United States Air Force Tyndall Air Force Base, FL 32403-5323
Transcript of EXPERIMENTAL INVESTIGATION OF … EXPERIMENTAL INVESTIGATION OF WIDESPREAD DELAMINATION DAMAGE TO...

AFCEC-CX-TY-TP-2013-0006
EXPERIMENTAL INVESTIGATION OF WIDESPREAD DELAMINATION DAMAGE TO COMPOSITE MATERIALS CAUSED BY RADIANT HEATING
R. Bocchieri, Douglas S. Dierdorf, Kristofor S. Cozart, Steven P. Wells, Steven W. Kirkpatrick, Robert A. MacNeill Applied Research Associates, Inc. 421 Oak Drive Panama City, FL 32401
John R. Hawk Air Force Civil Engineer Center Readiness Directorate Requirements and Acquisition Division 139 Barnes Drive, Suite 1 Tyndall Air Force Base, FL 32403
Contract No. FA4819-09-C-0030 June 2013
DISTRIBUTION A. Approved for public release; distribution unlimited. AFCEC-1332, 9 July 2013.
AIR FORCE CIVIL ENGINEER CENTER READINESS DIRECTORATE
Requirements & Acquisition Division United States Air Force Tyndall Air Force Base, FL 32403-5323

DISCLAIMER
Reference herein to any specific commercial product, process, or service by trade name,
trademark, manufacturer, or otherwise does not constitute or imply its endorsement,
recommendation, or approval by the United States Air Force. The views and opinions of
authors expressed herein do not necessarily state or reflect those of the United States Air
Force.
This report was prepared as an account of work sponsored by the United States Air Force.
Neither the United States Air Force, nor any of its employees, makes any warranty,
expressed or implied, or assumes any legal liability or responsibility for the accuracy,
completeness, or usefulness of any information, apparatus, product, or process disclosed, or
represents that its use would not infringe privately owned rights.
NOTICE AND SIGNATURE PAGE Using Government drawings, specifications, or other data included in this document for any purpose other than Government procurement does not in any way obligate the U.S. Government. The fact that the Government formulated or supplied the drawings, specifications, or other data does not license the holder or any other person or corporation; or convey any rights or permission to manufacture, use, or sell any patented invention that may relate to them. This report was cleared for public release by the nationals. Copies may be obtained from the Defense Technical Information Center (DTIC) (http://www.dtic.mil). HAS BEEN REVIEWED AND IS APPROVED FOR PUBLICATION IN ACCORDANCE WITH ASSIGNED DISTRIBUTION STATEMENT. ______________________________________ _______________________________________
This report is published in the interest of scientific and technical information exchange, and its publication does not constitute the Government’s approval or disapproval of its ideas or findings.
Antonio-Lackland Air Force Base, Texas available to the general public, including foreignAFCEC Public Affairs Office at Joint Base San
AFCEC-CX-TY-TP-2013-0006
Thomas Stemphoski
Contracting Officer Representative
//SIGNED//
Technical Advisor
John R. Hawk
//SIGNED//
Standard Form 298 (Rev. 8/98)
REPORT DOCUMENTATION PAGE
Prescribed by ANSI Std. Z39.18
Form Approved OMB No. 0704-0188
The public reporting burden for this collection of information is estimated to average 1 hour per response, including the time for reviewing instructions, searching existing data sources, gathering and maintaining the data needed, and completing and reviewing the collection of information. Send comments regarding this burden estimate or any other aspect of this collection of information, including suggestions for reducing the burden, to Department of Defense, Washington Headquarters Services, Directorate for Information Operations and Reports (0704-0188), 1215 Jefferson Davis Highway, Suite 1204, Arlington, VA 22202-4302. Respondents should be aware that notwithstanding any other provision of law, no person shall be subject to any penalty for failing to comply with a collection of information if it does not display a currently valid OMB control number. PLEASE DO NOT RETURN YOUR FORM TO THE ABOVE ADDRESS. 1. REPORT DATE (DD-MM-YYYY) 2. REPORT TYPE 3. DATES COVERED (From - To)
4. TITLE AND SUBTITLE 5a. CONTRACT NUMBER
5b. GRANT NUMBER
5c. PROGRAM ELEMENT NUMBER
5d. PROJECT NUMBER
5e. TASK NUMBER
5f. WORK UNIT NUMBER
6. AUTHOR(S)
7. PERFORMING ORGANIZATION NAME(S) AND ADDRESS(ES) 8. PERFORMING ORGANIZATION REPORT NUMBER
9. SPONSORING/MONITORING AGENCY NAME(S) AND ADDRESS(ES) 10. SPONSOR/MONITOR'S ACRONYM(S)
11. SPONSOR/MONITOR'S REPORT NUMBER(S)
12. DISTRIBUTION/AVAILABILITY STATEMENT
13. SUPPLEMENTARY NOTES
14. ABSTRACT
15. SUBJECT TERMS
16. SECURITY CLASSIFICATION OF: a. REPORT b. ABSTRACT c. THIS PAGE
17. LIMITATION OF ABSTRACT
18. NUMBER OF PAGES
19a. NAME OF RESPONSIBLE PERSON
19b. TELEPHONE NUMBER (Include area code)
30-JUN-2013 Technical Paper 02-OCT-2009 -- 24-SEP-2012
Experimental Investigation of Widespread Delamination Damage to Composite Materials Caused by Radiant Heating
FA4819-09-C-0030
0909999F
GOVT
D0
X13SY001 (QD103001)
*Bocchieri, R.; *Dierdorf, Douglas S.; *Cozart, Kristofor S.; *Wells, Steven P.; *Steven W. Kirkpatrick,; *Robert A. MacNeill; ̂ Hawk, John R.
*Applied Research Associates 421 Oak Drive Panama City, FL 32401
^Air Force Civil Engineer Center Readiness Directorate Requirements and Acquisition Division 139 Barnes Drive, Suite 1 Tyndall Air Force Base, FL 32403-5323
AFCEC/CXA
AFCEC-CX-TY-TP-2013-0006
Distribution A: Approved for public release; distribution unlimited.
Ref Public Affairs Case # AFCEC-1332, 9 July 2013. Document contains color images.
Three aerospace composite materials with quasi-isotropic layup were exposed to varied uniform radiant heating to evaluate the delamination damage caused by the thermal environment. Three classes of matrix resins were evaluated with IM7 carbon fibers; epoxy 977-3, modified bismaleimide RM3002 and condensation polyimide AFR-PE-4. Thermal exposure was mild and indicative of a hydrocarbon pool fire at a standoff from the material. After exposure, the plates were machined into four-point bend and tensile samples and mechanically tested. Mechanical degradation in terms of tensile and flexural modulus and strength were documented as a function of exposure level. Microscopy of the machined sections was performed to document the observed damage.
Thermal damage, radiant heating, delamination, polymer composite, mechanical degradation, microscopy, epoxy, modified bismaleimide, condensation polyimide
U U U UU 16
Stemphoski, Thomas
Reset

1 DISTRIBUTION STATEMENT A: Approved for public release; distribution unlimited.
AFCEC-1332; 9 July 2013
EXPERIMENTAL INVESTIGATION OF WIDESPREAD DELAMINATION DAMAGE TO COMPOSITE MATERIALS
CAUSED BY RADIANT HEATING
Robert T. Bocchieri, Douglas S. Dierdorf, Kristofor S. Cozart, Steven P. Wells, Steven W. Kirkpatrick, Robert A. MacNeill
Applied Research Associates, Inc.
4300 San Mateo Blvd. NE, Suite A-220
Albuquerque, NM 87110
John R. Hawk
Air Force Research Laboratory, AFRL/RXQ
Tyndall AFB, FL 32403
ABSTRACT
Three aerospace composite materials with quasi-isotropic layup were exposed to varied uniform radiant heating to evaluate the delamination damage caused by the thermal environment. Three classes of matrix resins were evaluated with IM7 carbon fibers; epoxy 977-3, modified bismaleimide RM3002 and condensation polyimide AFR-PE-4. Thermal exposure was mild and indicative of a hydrocarbon pool fire at a standoff from the material. After exposure, the plates were machined into four-point bend and tensile samples and mechanically tested. Mechanical degradation in terms of tensile and flexural modulus and strength were documented as a function of exposure level. Microscopy of the machined sections was performed to document the observed damage.
In all materials and heat flux magnitudes tested, it was found that the composite plates experienced sudden and catastrophic damage, prior to any significant charring or mass loss, in the form of delaminations, sometimes throughout the entire thickness. Delaminated samples displayed little residual mechanical strength. Samples exposed to similar heat flux and durations, but removed from heat prior to delamination, showed little reduction in mechanical strength. The time at which delamination occurred was affected by the water moisture content, with delamination occurring at shorter exposure times for plates with higher moisture content.
1. INTRODUCTION
The increasing use of composite materials and other specialized U.S. Air Force and DoD materials in aircraft and weapons systems intensifies the challenges to firefighters. Relatively small fires on composite aircraft, from for example a nacelle fire or wheel brake fire, can still lead to millions of dollars of heat-induced damage to surrounding structures.
In order to minimize the cost of these fires, the Air Force Civil Engineering Fire Panel needs to estimate firefighting response requirements and establish concepts of operations which will permit these types of fires to be routinely extinguished while the level of damage is still small.

2 DISTRIBUTION STATEMENT A: Approved for public release; distribution unlimited.
AFCEC-1332; 9 July 2013
The objective of this investigation was to quantify the damage to a series of aerospace composite materials exposed to controlled radiant fluxes over periods ranging from seconds to minutes. These data are necessary for determining response requirements.
Results from this investigation are relevant to designers, operators and fire safety personnel for composite aircraft where potential fire exposure or high operating temperatures are a concern. This paper provides the experimental arrangements for exposing and monitoring the response of composite plates exposed to radiant heat flux as well as microscopy and mechanical testing of the thermally-damaged materials. Physical damage to the composite plates during heat exposure, as well as the plate response itself, was documented with regular video, infrared video, and post-test imaging, sectioning and microscopy. Temperature in the plates was monitored with embedded thermocouples (TC). Both four-point bend and tensile testing was conducted.
Common experimental observations of composites exposed to heat from fires results in two fairly distinct layers: (1) a charred layer where the organic constituents have been decomposed and (2) an undamaged laminate [e.g., 1-4]. There is a ‘resin decomposition region’, between these two layers, that is relatively small compared to the two distinct layers. There is sometimes evidence of some matrix cracks and delaminations close to the decomposition region. It is important to note that in these tests the composite panels were exposed to heating and ignition occurred on the heat-exposed surface of the composite. There was therefore additional, not-quantified heat flux from this combustion.
In the experiments conducted in this investigation composite plates were exposed to uniform radiant heat fluxes on one face and thermally insulated on the back side and around the edges. Thermal exposure was mild and indicative of radiant heat flux from an adjacent pool or engine nacelle fire with no flame impingement [5]. There was no combustion at the composite surface.
2. EXPERIMENTATION
Heat-exposure testing was conducted with composite plates that were first conditioned in an oven at a temperature of 55 °C for four days, to remove moisture from the plates. They were then stored on desiccant. Some plates were then conditioned in a humidity chamber so that the effect of water content in the plates could be determined. Heat exposure tests were conducted at three different intensities of radiant heat fluxes with radiant heating from an infrared heater. Heat flux was monitored with heat flux sensors throughout the test. The large variation in matrix thermal performance necessitated different test conditions for each of the three different carbon fiber composite materials, so exposure times varied considerably between materials.
Temperature throughout the plate thickness was monitored with embedded TCs, and visual and infrared video was taken of the exposed surface of the plate. After heat exposure, plates were cut into flexural, tensile and microscopy samples. Some microscopy samples were polished on their edges. Microscopy of sample edges was conducted to document the through-thickness damage in the plates. Mechanical test samples were then tested in four-point bending and in tension per ASTM standards. Testing was conducted on samples with and without heat exposure.
2.1 Test Facilities
All radiant heating tests were conducted at Tyndall AFB, FL in facilities controlled by the Air Force Research Laboratory (AFRL). Tensile and bending tests were performed using an MTS Model 244.31 test machine. Thermogravimetric analysis (TGA) was performed on a Netzsch

3 DISTRIBUTION STATEMENT A: Approved for public release; distribution unlimited.
AFCEC-1332; 9 July 2013
STA 409 PC analyzer at the AFRL Fire Laboratory at Tyndall AFB and on a STA 449 F1 analyzer at Netzsch Instruments North America.
2.2 Composite Test Plates
Three composite materials were selected as representative of a wide array of composites used in military aircraft. All had intermediate modulus carbon fiber (IM7) and various matrices; epoxy 977-3, modified (BMI) RM3002, and condensation polyimide AFR-PE-4. The three materials represent, theoretically, three levels of service temperature: Cycom 977-3 [6] < 120 °C, Renegade RM3002 [7] < 200 °C and AFR-PE-4 [8]< 260 °C. In addition, they have, respectively, higher costs as the performance level increases and have evolved as high demands have been placed on aircraft weight and performance. Cure and dry glass transition temperatures (Tg) for these materials are shown in Table 1 along with the as-manufactured test plate characteristics. The thickness of each composite plate varied due to differences in the ply thickness.
Table 1. Composite materials evaluated.
Resin (or equivalent)
Type Cure Temp (°C)
Dry Tg (°C)
Avg. Plate Thickness
(mm)
Plate Desig-nation
977-3 [6] Epoxy 177 221 6.4 C RM3002 [7] Modified BMI 177 296 3.2 R
AFR-PE-4 [8] Condensation polyimide 338 340 3.8 A Nominal Fiber Volume Fraction: 60 percent
Fiber type: Intermediate Modulus Carbon Fiber – IM7 Layup: 24-ply quasi-isotropic [0,90,45,-45]3s
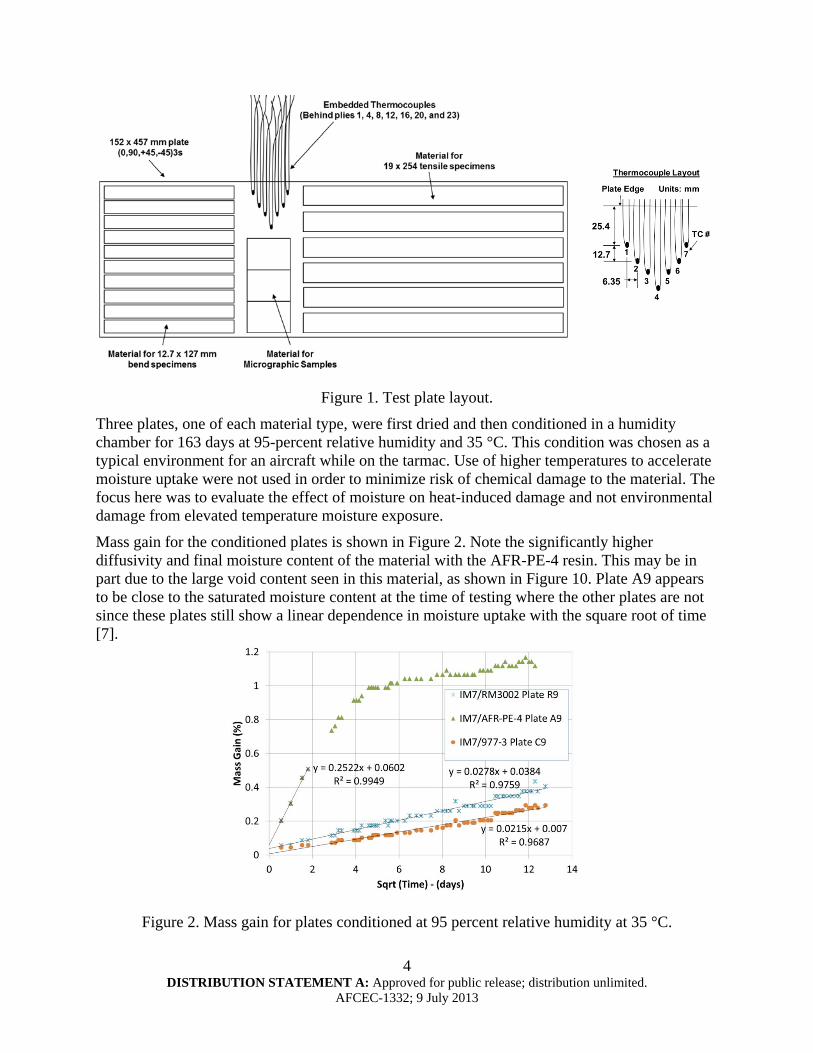
Composite plates were fabricated by AFRL/RXS at Hill AFB, UT. The test plates were 152 by 457 mm and trimmed to 140 by 445 mm for testing. Large plates were used to better approximate in-situ response on an aircraft. Plates were fabricated with seven embedded 30-gauge, Type K TCs placed behind plies 1, 4, 8, 12, 16, 20 and 23 in order to measure the through-thickness temperature profile during thermal exposure tests, as shown in Figure 1. The TC #1 was behind ply 1 and TC # 7 behind ply 23. The TCs were staggered in order to not interfere with the readings of others.
After thermal exposure, each plate was cut into nine bend specimens, three microscopy specimens, and six tensile specimens using a water jet. Specimens were cut approximately 12 mm from the plate edges to avoid possible effects of heat-induced edge damage in the mechanical test results. Tensile specimens were tabbed before mechanical testing using 3.2 mm FR-4 glass epoxy laminate fiberglass stock material bonded with epoxy resin (Armstrong A-12).
After manufacture, plates were stored at room temperature and relative humidity (approximately 50 percent). Before testing, plates were dried in a laboratory oven (Memmert UFE 500, with air circulation set to 50 percent) at 54.5 C for 96 hours. The plates were weighed periodically to measure moisture loss and it was determined that moisture loss was negligible after 96 hours in the oven. The plates were then stored in a humidity controlled (25-percent relative humidity) chamber with silica gel desiccant at room temperature until testing commenced.
4 DISTRIBUTION STATEMENT A: Approved for public release; distribution unlimited.
AFCEC-1332; 9 July 2013
Figure 1. Test plate layout.
Three plates, one of each material type, were first dried and then conditioned in a humidity chamber for 163 days at 95-percent relative humidity and 35 °C. This condition was chosen as a typical environment for an aircraft while on the tarmac. Use of higher temperatures to accelerate moisture uptake were not used in order to minimize risk of chemical damage to the material. The focus here was to evaluate the effect of moisture on heat-induced damage and not environmental damage from elevated temperature moisture exposure.
Mass gain for the conditioned plates is shown in Figure 2. Note the significantly higher diffusivity and final moisture content of the material with the AFR-PE-4 resin. This may be in part due to the large void content seen in this material, as shown in Figure 10. Plate A9 appears to be close to the saturated moisture content at the time of testing where the other plates are not since these plates still show a linear dependence in moisture uptake with the square root of time [7].
Figure 2. Mass gain for plates conditioned at 95 percent relative humidity at 35 °C.
5 DISTRIBUTION STATEMENT A: Approved for public release; distribution unlimited.
AFCEC-1332; 9 July 2013
2.3 Plate Heat Exposure
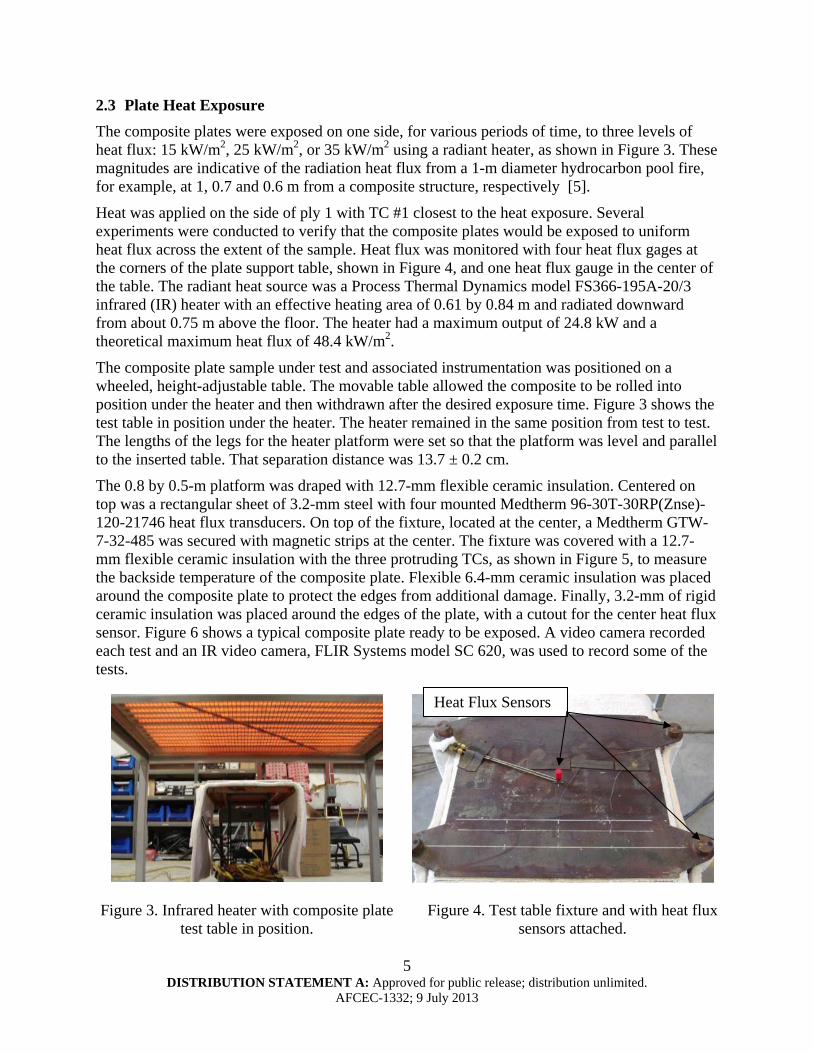
The composite plates were exposed on one side, for various periods of time, to three levels of heat flux: 15 kW/m2, 25 kW/m2, or 35 kW/m2 using a radiant heater, as shown in Figure 3. These magnitudes are indicative of the radiation heat flux from a 1-m diameter hydrocarbon pool fire, for example, at 1, 0.7 and 0.6 m from a composite structure, respectively [5].
Heat was applied on the side of ply 1 with TC #1 closest to the heat exposure. Several experiments were conducted to verify that the composite plates would be exposed to uniform heat flux across the extent of the sample. Heat flux was monitored with four heat flux gages at the corners of the plate support table, shown in Figure 4, and one heat flux gauge in the center of the table. The radiant heat source was a Process Thermal Dynamics model FS366-195A-20/3 infrared (IR) heater with an effective heating area of 0.61 by 0.84 m and radiated downward from about 0.75 m above the floor. The heater had a maximum output of 24.8 kW and a theoretical maximum heat flux of 48.4 kW/m2.
The composite plate sample under test and associated instrumentation was positioned on a wheeled, height-adjustable table. The movable table allowed the composite to be rolled into position under the heater and then withdrawn after the desired exposure time. Figure 3 shows the test table in position under the heater. The heater remained in the same position from test to test. The lengths of the legs for the heater platform were set so that the platform was level and parallel to the inserted table. That separation distance was 13.7 ± 0.2 cm.
The 0.8 by 0.5-m platform was draped with 12.7-mm flexible ceramic insulation. Centered on top was a rectangular sheet of 3.2-mm steel with four mounted Medtherm 96-30T-30RP(Znse)-120-21746 heat flux transducers. On top of the fixture, located at the center, a Medtherm GTW-7-32-485 was secured with magnetic strips at the center. The fixture was covered with a 12.7-mm flexible ceramic insulation with the three protruding TCs, as shown in Figure 5, to measure the backside temperature of the composite plate. Flexible 6.4-mm ceramic insulation was placed around the composite plate to protect the edges from additional damage. Finally, 3.2-mm of rigid ceramic insulation was placed around the edges of the plate, with a cutout for the center heat flux sensor. Figure 6 shows a typical composite plate ready to be exposed. A video camera recorded each test and an IR video camera, FLIR Systems model SC 620, was used to record some of the tests.
Figure 3. Infrared heater with composite plate
test table in position.
Figure 4. Test table fixture and with heat flux
sensors attached.
Heat Flux Sensors

6 DISTRIBUTION STATEMENT A: Approved for public release; distribution unlimited.
AFCEC-1332; 9 July 2013
Figure 5. Test table insulation with back face TC protruding.
Figure 6. Composite plate with edge insulation
ready for thermal exposure.
2.4 Tensile Testing
Specimens were mounted in an MTS servo-hydraulic test machine and loaded to failure. Tests were performed using a constant displacement rate of 1.3 mm /min per ASTM standard D3039 [10]. Strain was recorded on each side of the specimen using an electrical resistance strain gage on the unexposed side of the specimen and an extensometer on the exposed side.
Tensile modulus of elasticity and ultimate tensile strength were determined according to ASTM standard D3039. Ultimate tensile strength was defined as the maximum tension force divided by the original nominal cross-sectional area before heat exposure. The tensile chord modulus of elasticity values were calculated using the same calculation for stress from the initial slope of the linear portion of the stress-strain curve as defined in ASTM standard D3039. In most cases the average of the strain gage and extensometer was used to calculate chord modulus, except when the extensometer jumped or otherwise behaved erratically on the heat damaged surface.
2.5 Four-Point Bending Tests
Flexural properties were determined from four-point bend tests performed according to ASTM D 6272 [11]. In this configuration, the distance between the loading noses (the load span) is one-third of the support span. The specimen was loaded until rupture occurred in two configurations, with the heat-exposed side in tension and compression, to document difference in mechanical response. Primary dimensions for the loading noses and supports, as well as other relevant data, can be found in Table 2.
Table 2. Bend Test Information
Material Resin
Nominal Thickness
(mm)
Support Span (mm)
Load Span (mm)
Nose Radii (mm)
Support Span to Depth Ratio
Minimum Specimen
Length (mm)
Crosshead Rate
(mm/min)
Maximum Deflection
(mm)
977-3 6.4 95.3 31.8 9.0 15.0:1 114.3 2.6 15.0 RM3002 3.2 76.2 25.4 5.0 23.6:1 91.4 3.3 18.9
AFR-PE-4 3.8 76.2 25.4 5.0 20.0:1 91.4 2.8 16.0
Edge Insulation
Thermocouples

7 DISTRIBUTION STATEMENT A: Approved for public release; distribution unlimited.
AFCEC-1332; 9 July 2013
3. RESULTS
The average heat flux applied to each composite plate is shown in Table 3 for the exposure durations listed. Also provided are the moisture content, maximum temperatures recorded from the embedded TCs, the percentage mass loss of the entire plate and a summary of the physical changes to the plate.
Table 3. Composite Plate Heat Exposure Summary
3.1 Physical Damage Evaluation
Physical damage to the composite plates during heat exposure, as well as the plate response itself, was documented with regular video, infrared video, and post-test imaging, sectioning and microscopy. Plates that showed little to no mechanical degradation after heat exposure showed no visual evidence of damage, aside from small discoloration on the exposed surface in a few cases. Microscopy of sectioned samples showed no delamination or charring of the materials.
In all materials and heat flux magnitudes tested where there was mechanical degradation measured, it was found that the composite plate experienced sudden damage, prior to any significant charring or mass loss, in the form of delaminations, sometimes throughout the entire thickness. The general sequence observed during testing is shown for plate A9 in Figure 7. In general, there was that no physical response, including little or no smoking, up to the time where surface bubbling formed (localized raised regions of the material), indicating delamination initiation. The plate would then bend upward, many times exhibiting audible cracking. The plate would then dynamically rebound to some degree, indicating further delamination, many times
Sample
Avg. Heat
Flux
Exposure
Time
Max Int.
Temp
Mass
Loss Physical Observations
(kW/m2) (sec) (°C) (%)
C4 15.2 844 Dry 367 2.10%
smoked heavily; popped and crackled; about 50% of top surface bubbled; slits
formed on top and back face; stuck to edge insulation
C9 15.4 601 0.3% 356 1.04%
smoked slightly, popped and crackled; about 10% of top surface bubbled; slits
formed on top, no damage on back face; stuck to edge insulation
R2 26.2 214 Dry 401 1.15%
smoked moderately; popped and crackled; about 50% of top surface bubbled; back
face not inspected; stuck to edge insulation
R3 24.9 91 Dry 271 0.06% no visible damage
R4 14.9 151 Dry 240 0.03% no visible damage
R6 34.2 101 Dry 367 0.42%
smoked moderately; popped and crackled; about 40% of top surface bubbled; back
face not inspected
R7 15.2 201 Dry 274 0.03% no visible damage
R8 15.3 1040 Dry 382 1.63%
smoked slightly; popped and crackled; about 5% of top surface bubbled; back face
not inspected; stuck to edge insulation
R9 25.9 201 0.4% 392 1.38%
smoked moderately; popped and crackled; about 50% of top surface bubbled; no
damage on back face; plate warped; stuck to edge insulation
A2 34.0 20 Dry 155 0.00% no visible damage
A3 34.1 127 Dry 411 0.18%
smoked slightly; popped and crackled; about 30% of top surface bubbled; no
damage on back face; plate warped
A8 35.1 151 Dry 468 0.23%
smoked slightly; popped and crackled; about 60% of top surface bubbled; no
damage on back face; plate warped
A9 35.2 152 1.15% 417 1.13%
smoked slightly; popped forcefully; about 20% of top surface bubbled; slits formed
on top, no damage on back face; plate warped
IM7/AFR‐PE‐4
IM7/R3002
IM7/977‐3
Moisture
Content
(%)

8 DISTRIBUTION STATEMENT A: Approved for public release; distribution unlimited.
AFCEC-1332; 9 July 2013
showing permanent curvature after the test. This sequence would occur quickly, in typically less than 10 s. In no case did ignition of the plate occur.
Damage varied from some by material type and heat flux. Visible damage to delaminated plates included discoloration, raised (bubbled) regions, burst cracks (front and back), and no visible pyrolysis in cross-section microscopy. Mass loss was less than 2 percent. Some delaminations were seen with very little surface damage. Examples of some damage modes are shown in Figure 8.
Infrared imaging of the plates immediately following removal from the heat source show uneven cooling of the plate surface, as would occur with delaminated regions. Images typically showed a few large and many small regions with greater cooling than surrounding material, as shown for plate A9 in Figure 9. Most regions of greater cooling were away from the edges of the plate, indicating that edge delamination was not the likely cause of initiation. There was also no evidence that delaminations originated in the region of embedded thermocouples. The larger regions sometimes showed swelling after cooling. These observations indicate that some delaminations grew to cover large regions of the plate, as later observed in plate sectioning.
70 s 76 s
77 s 78 s
79 s 140 s
Figure 7. Plate A9 (1.15 % moisture content) during delamination at 35.2 kW/m2.

9 DISTRIBUTION STATEMENT A: Approved for public release; distribution unlimited.
AFCEC-1332; 9 July 2013
(a) Front - Prior to testing (b) Front – after heat exposure
(c) Front – after heat exposure showing burst crack
Figure 8. Plate A9 (1.15 % moisture content) before and after exposure at 35.2 kW/m2 for 152 s.
Figure 9. IR image of A9 (1.15 % moisture content) approximately 20 s after heat removal.
Optical microscopy was performed on all samples cut from the exposed plates. Widespread delaminations were evident throughout the thickness of the plates showing mechanical degradation. Exemplar cracks in each material are shown in Figure 10. There was no apparent pattern to where the delaminations occurred. Large widespread delaminations were seen throughout the thickness in the IM7/RM3002 and IM7/977-3 composites, but only on the plies on the heat exposed side of IM7/AFR-PE-4. Only small delaminations were seen on the unexposed side of this material. It is obvious that delaminations seen by the visual surface bubbling of the plates during testing were caused by the application of heat. However, it is possible that some of the delaminations throughout the thickness were also caused by the mechanical stresses caused by plate bending.
Heat Flux Sensor

10 DISTRIBUTION STATEMENT A: Approved for public release; distribution unlimited.
AFCEC-1332; 9 July 2013
Figure 10. Microscopic images of plate cross-sections before and after radiant heat exposure.
3.2 Delamination Time and Temperatures
The approximate delamination time was estimated from the embedded TC and backface TC readings, as shown in Figure 11. These times corresponded well with the time of global plate buckling observed during testing. Deviations in the measured embedded TC temperatures are seen during delamination as plies separate from one another. If the TC remains bonded to the ply on the heat-exposed side of the plate, for example, a short-term increase in the rate of temperature increase is seen. A short-term reduction in the rate of temperature increase, and sometimes a temperature drop, is seen if the TC remains bonded to the ply away from the heating. Deviations in the backface TC temperatures, which are originally in contact with the insulated side of the plate, are seen when the surface of the plate is moved away from the TC, such as when global buckling occurs.
Two criteria were used to determine the time of global plate delamination. The first criterion was the time when three of the embedded TCs showed deviations in the temperature loading rate. Indication from a single TC was not considered definitive because it could indicate when a small crack occurred around an individual TC and not be a good indicator of plate-wide delamination. The second criterion used was when all three backface TC readings (left, center and right) showed a deviation, as discussed above. The time and temperatures reported here are the averages of these two methods.
Delamination times for plates tested dry are shown in Figure 12 as a function of heat flux for IM7/RM3002 in Figure 12(a) and comparing IM7/RM3002 to IM7/AFR-PE-4 in Figure 12(b). Results from these two materials can be compared because the plates had nominally the same thickness. As would be expected, the time to delamination decreases rapidly with increasing heat flux as shown in Figure 12(a). Limited testing was performed on IM7/977-3 and IM7/AFR-PE-4 composites at a single heat flux intensity, so the variation with heat flux is unknown. Comparison between materials in in Figure 12(b) shows that material having the higher dry Tg, IM7/AFR-PE-4, took longer to delaminate.

11 DISTRIBUTION STATEMENT A: Approved for public release; distribution unlimited.
AFCEC-1332; 9 July 2013
Figure 11. Temperature history data from embedded and backface TCs.
Figure 12. Delamination times in (a) dry IM7/RM3002 plates at three heat flux magnitudes and (b) in dry plates tested at 35 kW/m2.
Figure 13. Effect of moisture content on the time to delamination at fixed heat flux magnitudes.
(a) (b)
12 DISTRIBUTION STATEMENT A: Approved for public release; distribution unlimited.
AFCEC-1332; 9 July 2013
When moisture was added to the plates IM7/AFR-PE-4 had the greatest reduction in the time to delamination, as shown in Figure 13. Note that it also had the highest moisture content. The time to delamination at 35 kW/m2 was actually reduced to the same time (77 s) as the lower Tg material, IM7/RM3002, tested dry at this heat flux. No conclusion can be made about the relative sensitivity to moisture for all materials tested since each was at a different moisture content at the time of testing. The lowest Tg material, IM7/977-3, showed the least reduction in time to delamination tested wet and dry. It is not clear from the limited data what effect the greater specimen thickness, lower heat flux, and smaller temperature gradient had on these samples with regard to the elevated moisture content. Additional testing is needed to examine all of these effects.
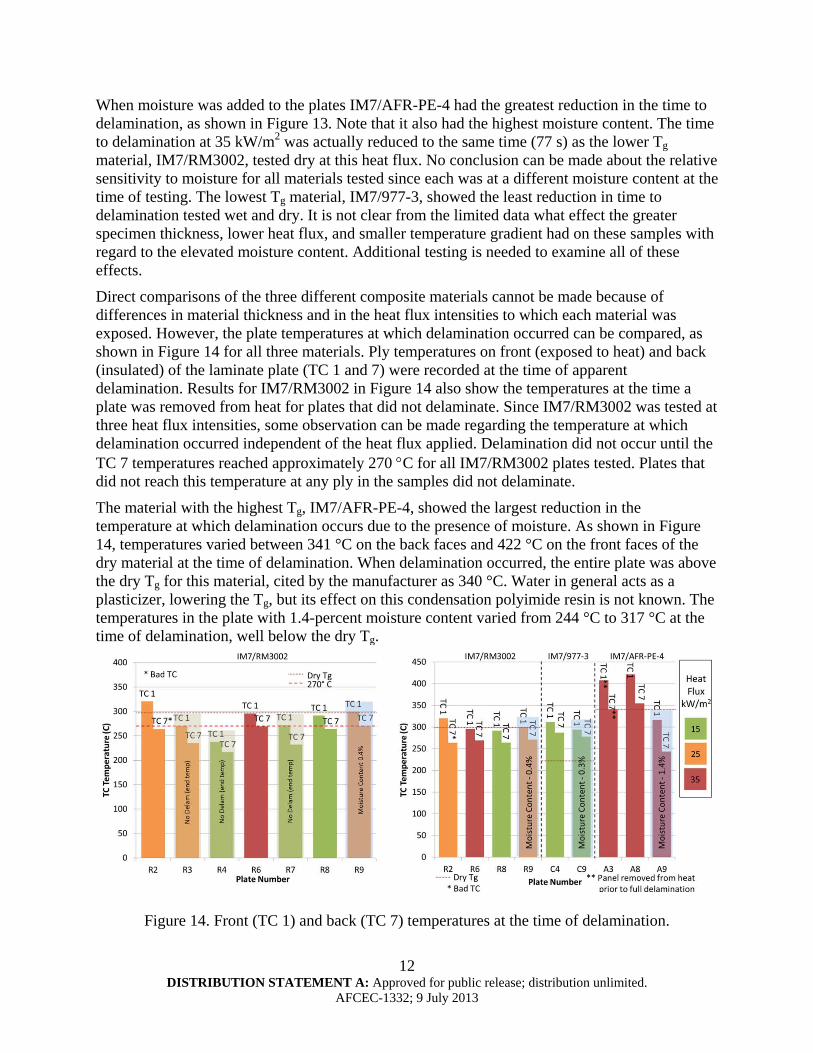
Direct comparisons of the three different composite materials cannot be made because of differences in material thickness and in the heat flux intensities to which each material was exposed. However, the plate temperatures at which delamination occurred can be compared, as shown in Figure 14 for all three materials. Ply temperatures on front (exposed to heat) and back (insulated) of the laminate plate (TC 1 and 7) were recorded at the time of apparent delamination. Results for IM7/RM3002 in Figure 14 also show the temperatures at the time a plate was removed from heat for plates that did not delaminate. Since IM7/RM3002 was tested at three heat flux intensities, some observation can be made regarding the temperature at which delamination occurred independent of the heat flux applied. Delamination did not occur until the TC 7 temperatures reached approximately 270 C for all IM7/RM3002 plates tested. Plates that did not reach this temperature at any ply in the samples did not delaminate.
The material with the highest Tg, IM7/AFR-PE-4, showed the largest reduction in the temperature at which delamination occurs due to the presence of moisture. As shown in Figure 14, temperatures varied between 341 °C on the back faces and 422 °C on the front faces of the dry material at the time of delamination. When delamination occurred, the entire plate was above the dry Tg for this material, cited by the manufacturer as 340 °C. Water in general acts as a plasticizer, lowering the Tg, but its effect on this condensation polyimide resin is not known. The temperatures in the plate with 1.4-percent moisture content varied from 244 °C to 317 °C at the time of delamination, well below the dry Tg.
Figure 14. Front (TC 1) and back (TC 7) temperatures at the time of delamination.

13 DISTRIBUTION STATEMENT A: Approved for public release; distribution unlimited.
AFCEC-1332; 9 July 2013
3.3 Mechanical Test Results
3.3.1 Four-Point Bending
Four-point bend testing was performed on unexposed and heat-exposed samples with the heat-exposed side in both compression and tension. The flexural strength and chord modulus are shown in Figure 15. The standard deviation of typically four tests with the heat exposed side in tension (T) and five in compression (C) are shown with the error bars in the figures. Note that plates that did not delaminate from heat exposure are marked with ‘ND’ and those that did with ‘D’.
Little to no change of flexural strength is seen in IM7/RM3002 plates that did not delaminate (cf. plates R, R4, R3, R7). There was very little mass loss in these plates (<0.1 percent). A loss in flexural strength of over 75 percent is seen when the plates delaminate (plates R2, R6, R8). There is also a trend in flexural strength of the delaminated IM7/RM3002 plates with heat flux intensity; the lowest heat flux showed the largest strength and the highest heat flux showed the lowest strength. It is possible that the larger heat fluxes drove the delaminations to grow larger in these plates, but this was not quantified. Other non-destructive evaluation techniques, such as ultrasonic C-scan, are recommended to quantify the degree of delamination.
The IM7/977-3 and IM7/AFR-PE-4 materials also had a large drop in flexural strength once delamination occurred. The highest Tg material, IM7/AFR-PE-4, demonstrated the smallest drop in strength with delamination in the one plate tested (approximately 30 percent). It is important to note, however, that plate A3 was removed from heat just as delamination started. So it is not clear if reduction in flexural strength is less severe in this material or if similar reductions would be seen if allowed to complete delamination.
The overall effect on material chord modulus is similar to that for the strength. Here, the effect on modulus was a decrease of 23 percent at the lowest heat flux and a decrease of 60 percent at the highest heat flux. The apparent increase in modulus of the IM7/RM3002 plates without delamination (cf. plates R, R3, R4, and R7 in Figure 15) is likely due to plate-to-plate variation or post-curing.
Figure 15. Average flexural strength and chord modulus at varied degrees of heat exposure.

14 DISTRIBUTION STATEMENT A: Approved for public release; distribution unlimited.
AFCEC-1332; 9 July 2013
3.3.2 Tensile Tests
Tensile testing was performed on unexposed and heat-exposed samples. The tensile strength and tensile chord modulus of elasticity are shown in Figure 16. The standard deviation of six samples are shown with the error bars in the figures. Only three samples were tested for plates A, C, C4, R and R6. Data for A3 is from a single sample so no standard deviation is shown. In general, the heat-exposed plates that delaminated showed less degradation in the tensile properties than the flexural properties, as would be expected by the dominant damage mode of delamination.
All materials showed a reduction in tensile strength for samples with delaminations from heat exposure. This reduction was only large for IM7/977-3, which had a 40-percent drop in tensile strength between the two plates tested. Tensile modulus was also reduced for this material. IM7/AFR-PE-4 showed a similar trend, but the magnitude of the reduction in properties was much smaller. The material IM7/RM3002, with the largest number of exposures, showed some mixed results.
The tensile strength of IM7/RM3002 samples with delaminations from heat exposure was lower than samples with no delaminations, even with heat exposure. This is consistent with the other materials. The chord modulus is also lower for samples with delaminations than material with no heat exposure (plate R). However, plates R3 and R7 with no delaminations also have a lower chord modulus similar to the delaminated plates. Plate variation may be responsible for the differences in chord modulus rather than the effect of delamination. Future testing should ensure tight control on consistency between plates to avoid this uncertainty.
Figure 16. Average tensile strength and modulus at varied degrees of heat exposure.
4. CONCLUSIONS
For all materials and heat flux intensities tested, it was found that the composite materials experienced sudden and catastrophic damage in the form of delaminations, sometimes throughout the entire thickness, prior to any significant charring or mass loss. Delaminated composite material samples displayed little residual mechanical strength in flexure (up to 85-percent strength loss) and greatly reduced tensile strength (up to 40-percent strength loss). In contrast, samples exposed to similar heat flux and durations, but removed from heat prior to

15 DISTRIBUTION STATEMENT A: Approved for public release; distribution unlimited.
AFCEC-1332; 9 July 2013
delamination, showed little reduction in mechanical strength. The time at which delamination occurred was indicated by thermocouple data and global buckling of the plate. Time to delamination was affected by the moisture content of the plate, with delamination occurring at shorter exposure times for plates with higher moisture content.
It is postulated that high pressure gases in the plate from water vapor and resin outgassing, coupled with the reduction of the inter-laminar strength at elevated temperatures are the cause for the sudden delamination observed in experiments. Once a small crack initiates, strong thermal gradients are produced, and the corresponding thermal stresses drive the delamination further. This mode may not occur when the materials are exposed to a much higher heat flux, such as from ignition and burning of volatiles next to the composite surface. At much higher heat flux intensities pyrolysis at the surface may create an avenue for internal gases to escape through the remaining fibers rather than building up pressure.
Further heat exposure tests should be conducted at varied heat flux and water moisture levels. Heat exposure tests should also be expanded to include the following: (1) testing at additional water moisture levels, laminate thickness and layups; (2) testing in a mechanically-constrained condition to inhibit global buckling in order to examine the effect on damage in the plates; (3) testing under load. Mechanical stresses due to loading may cause the heat-induced delaminations seen during testing to occur at even lower temperatures. Finally, a model needs to be developed to predict the thermally-induced delaminations seen in the experiments..
5. ACKNOWLEDGEMENTS
Support for this research by the Air Force Civil Engineer Center, AFCEC and the Air Force Research Laboratory, AFRL/RXQ is gratefully acknowledged.
6. REFERENCES
1. A.G. Gibson, P.N.H. Wright, Y.-S. Wu, A.P. Mouritz, Z. Mathys and C.P. Gardiner, “The Integrity of Polymer Composites During and After a Fire”, Journal of Composite Materials, Vol. 38, No. 15, (2004), pp. 1283-1307.
2. A.P. Mouritz and Z. Mathys, “Mechanical properties of fire-damaged glass reinforced phenolic composites”, Fire Mat (2000), Volume 34, pp. 67–75.
3. A.P. Mouritz and Z. Mathys, “Post-fire mechanical properties of marine polymer composites”, Composite Structures (1999), Volume 47, pp. 643–653.
4. A.P. Mouritz and Z. Mathys, “Post-fire mechanical properties of glass reinforced polyester composites” Composites Science and Technology (2001), Volume 61, pp. 475–90.
5. Beyler, Craig L. “Fire Hazard Calculations for Large, Open Hydrocarbon Fires”. The SFPE Handbook of Fire Protection Engineering Third Edition. 2002
6. Cycom 977-3, Technical Data Sheet, Cytec Engineered Materials, Technical Service, Greenville, TX, 11/15/95 (Rev. E) 2002.
7. RM-3002 Bismaleimide (BMI) Prepreg, Product Information, Renegade Materials Corporation, Revision Date: 16-May-2012 KOA

16 DISTRIBUTION STATEMENT A: Approved for public release; distribution unlimited.
AFCEC-1332; 9 July 2013
8. http://www.renegadematerials.com/products/prepregs/polyimide-prepregs. Renegade Materials Corporation Website, Accessed June 20, 2013.
9. Shen, C. and G.S. Springer, “Moisture Absorption and Desorption of Composite Materials”, J. of Composite Materials, Vol. 10, January, 1976, pp. 2-20.
10. ASTM D 3039-08. Standard Test Method for Tensile Properties of Polymer Matrix Composite Materials.
11. ASTM D 6272-10 Standard Test Method for Flexural Properties of Unreinforced and Reinforced Plastics and Electrical Insulating Materials by Four-Point Bending.