EXPERIMENTAL INVESTIGATION FOR … · 2.5 Test Specimen Designations ... RESULTS AND DISCUSSIONS...
149
EXPERIMENTAL INVESTIGATION FOR MECHANICAL PROPERTIES OF FILAMENT WOUND COMPOSITE TUBES A THESIS SUBMITTED TO THE GRADUATE SCHOOL OF NATURAL AND APPLIED SCIENCES OF MIDDLE EAST TECHNICAL UNIVERSITY BY EMRAH SALIM ERDILLER IN PARTIAL FULFILLMENT OF THE REQUIREMENTS FOR THE DEGREE OF MASTER OF SCIENCE IN MECHANICAL ENGINEERING JULY 2004
-
Upload
trinhkhanh -
Category
Documents
-
view
217 -
download
0
Transcript of EXPERIMENTAL INVESTIGATION FOR … · 2.5 Test Specimen Designations ... RESULTS AND DISCUSSIONS...

EXPERIMENTAL INVESTIGATION FOR MECHANICAL PROPERTIES OF FILAMENT WOUND COMPOSITE TUBES
A THESIS SUBMITTED TO THE GRADUATE SCHOOL OF NATURAL AND APPLIED SCIENCES
OF MIDDLE EAST TECHNICAL UNIVERSITY
BY
EMRAH SALIM ERDILLER
IN PARTIAL FULFILLMENT OF THE REQUIREMENTS FOR
THE DEGREE OF MASTER OF SCIENCE IN
MECHANICAL ENGINEERING
JULY 2004
Approval of the Graduate School of Natural and Applied Sciences
Prof. Dr. Canan ÖZGEN
Director
I certify that this thesis satisfies all the requirements as a thesis for the degree of Master of Science.
Prof. Dr. S. Kemal IDER
Head of Department
This is to certify that we have read this thesis and that in our opinion it is fully adequate, in scope and quality, as a thesis for the degree of Master of Science.
Assoc. Prof. Dr. Cevdet KAYNAK Prof. Dr. Levend PARNAS
Co-Supervisor Supervisor
Examining Committee Members
Asst. Prof. Dr. Ergin TÖNÜK (METU,ME)
Prof. Dr. Levend PARNAS (METU,ME)
Assoc. Prof. Dr. Cevdet KAYNAK (METU,METE)
Prof. Dr. Mehmet A. AKGÜN (METU,AE)
Asst. Prof. Dr. Serkan DAG (METU,ME)

iii
I hereby declare that all information in this document has been obtained
and presented in accordance with academic rules and ethical conduct. I
also declare that, as required by these rules and conduct, I have fully cited
and referenced all material and results that are not original to this work.
Name, Last name : Emrah Salim Erdiller
Signature :

iv
ABSTRACT
EXPERIMENTAL INVESTIGATION FOR MECHANICAL
PROPERTIES OF FILAMENT-WOUND COMPOSITE TUBES
Erdiller, Emrah Salim
M.S., Department of Mechanical Engineering
Supervisor: Prof. Dr. Levend Parnas
Co-Supervisor: Assoc. Prof. Dr. Cevdet Kaynak
July 2004, 129 pages
The aim of this study is to investigate the mechanical properties of continuous
fiber reinforced composite tubes, produced by filament winding technique. For
this purpose, tensile and split-disk tests were performed with specimens
produced with five different fiber materials and two different resin systems.
Longitudinal tensile and hoop tensile properties of the selected specimens
were determined and the effect of reinforcement direction on the mechanical
performance of these composites was investigated. In addition, the effect of a
filament-winding processing variable (fiber tension) on longitudinal and hoop
tensile properties of the selected composites was obtained. A slight increase in
hoop/longitudinal tensile properties of specimens was observed for specimens
wounded with tension and with winding angles greater than 60o. The tests
were performed according to American Society for Testing and Materials
(ASTM) standards.
The split-disk tests of selected composite specimens were simulated by the
finite element method. For this purpose, a commercial finite element package

v
program was used. Experimental results were used both as input in terms of
material data for the finite element study and for comparison purposes. A good
agreement was obtained between the simulation results and the experimental
data.
Keywords : Filament winding, composite tube, longitudinal tensile properties,
hoop tensile properties, finite element method, split-disk test, tensile test.

vi
ÖZ
FILAMAN SARIM YÖNTEMI ILE ÜRETILMIS KOMPOZIT
BORULARIN MEKANIK ÖZELLIKLERININ DENEYSEL OLARAK
BELIRLENMESI
Erdiller, Emrah Salim
Yüksek Lisans. Makine Mühendisligi Bölümü
Tez Yöneticisi: Prof. Dr. Levend Parnas
Ortak Tez Yöneticisi: Doç. Dr. Cevdet Kaynak
Temmuz 2004, 129 sayfa
Bu çalismanin amaci, filaman sargi yöntemi ile üretilmis, sürekli fiber destekli
kompozit borularin mekanik özelliklerinin deneysel olarak belirlenmesidir. Bu
amaçla, bes farkli elyaf malzemesi ve iki farkli reçine sistemi kullanilarak
üretilmis numunelerle, tüp çekme ve disk-ayirma testleri gerçeklestirilmistir.
Bu testler sonucunda, numunelerin, eksenel çekme ve çevresel çekme
özellikleri deneysel olarak belirlenmis, elyaf yönünün, kompozit malzemenin
mekanik özelliklerine olan etkisi incelenmistir. Buna ek olarak, bir filaman
sargi yöntemi üretim parametresi olan, elyaf gerginlik ayarinin, söz konusu
mekanik özelliklere olan etkisi belirlenilmeye çalisilmistir. Buna göre,
gerginlikli olarak sarilmis ve 60o üzerinde sarim açisina sahip numunelerin
mekanik özelliklerinde kismi bir artis gözlenmistir. Testler, Amerikan Test ve
Malzeme Standartlari Kurumu (ASTM) standartlarina uygun olarak
gerçeklestirilmistir.

vii
Tez kapsaminda, belirlenen kompozit numunelerin mekanik özelliklerinin
disk-ayirma test yöntemi ile karakterizasyonunun, sonlu elemanlar yöntemi ile
simulasyonu gerçeklestirilmistir. Bu amaçla, ticari bir sonlu elemanlar paket
programi kullanilmistir. Deneyler sonucunda elde edilen veriler, hem analiz
sirasinda malzeme verisi olarak, hem de karsilastima amaci ile kullanilmistir.
Analiz sonuçlari ve deneysel sonuçlar arasinda iyi bir uyum gözlenmistir
Anahtar Kelimeler: Filaman sargi metodu, kompozit boru, eksenel çekme
özellikleri, çevresel çekme özellikleri, sonlu elemanlar yöntemi, disk-ayirma
testi, çekme testi.

viii
To my parents

ix
ACKNOWLEDGEMENTS
I must express my sincere thanks to Prof. Dr. Levend Parnas and Assoc. Prof.
Dr. Cevdet Kaynak for their guidance, insight, and patience throughout the
research. I also want to thank to Askin Üstad, Erkan Akay, Fikret Senel and
Bora Balya, for their help and understanding.
Special thanks to Hülya Arslan for her sacrifices and moral support over the
years. Finally, I specially wish to thank my family for their neverending
patience, motivation and moral support.

x
TABLE OF CONTENTS
PLAGIARISM……………………………………………………………….iii
ABSTRACT.....................................................................................................iv
ÖZ .....................................................................................................................vi
DEDICATION...............................................................................................viii
ACKNOWLEDGEMENTS ...........................................................................ix
TABLE OF CONTENTS ................................................................................x
LIST OF TABLES ........................................................................................xiii
LIST OF FIGURES .....................................................................................xvii
1. INTRODUCTION........................................................................................1
1.1 Filament Winding Technique .............................................................2
1.1.1 Material Selection......................................................................4
1.1.2 Winding and Impregnation Methods in Filament Winding .......5
1.2 Analysis of Filament-Wound Composite Tubes ................................7
1.2.1 Theoretical Analysis of Mechanical Performance of Filament-
Wound Composite Structures ....................................................8
1.2.2 Mechanical Testing of Filament-Wound Composite
Structures .................................................................................12
1.3 Scope of the Thesis ..........................................................................15
2. SAMPLE PREPERATION AND EXPERIMENTAL TECHNIQUE ..16
2.1 Introduction......................................................................................16
2.2 Material Selection............................................................................16
2.2.1 Resin Systems ..........................................................................16
2.2.2 Reinforcements ........................................................................17

xi
2.3 Micromechanics...............................................................................20
2.4 Test Specimen Fabrication...............................................................21
2.5 Test Specimen Designations ............................................................23
2.6 Experimental Technique ..................................................................24
2.6.1 Split-disk Test ..........................................................................24
2.6.1.1 Introduction.........................................................................24
2.6.1.2 Test Specimen Geometry....................................................25
2.6.1.3 Test Equipments...................................................................27
2.6.1.4 Test Procedure........................................................................29
2.6.1.5 Calculations .........................................................................30
2.6.2 Tube Tensile Test.....................................................................33
2.6.2.1 Introduction........................................................................33
2.6.2.2 Test Specimen Geometry...................................................33
2.6.2.3 Test Equipments.................................................................34
2.6.2.4 Test Procedure....................................................................36
2.6.2.5 Calculations .........................................................................36
3. MODELING OF SPLIT-DISK TESTS BY FINITE ELEMENT
METHOD .................................................................................................39
3.1 Introduction......................................................................................39
3.2 Theoretical Aspects..........................................................................39
3.2.1 Finite Element Method.............................................................39
3.2.2 Finite Element Modeling of Laminated Composites ...............40
3.2.3 Finite Element Analysis of Curved, Thin Walled Structures ..41
3.3 Problem Specifications ....................................................................42
3.3.1 Geometry..................................................................................42
3.3.2 Element Selection ....................................................................43
3.3.2.1 SOLID185 3-D 8-Node Structural Solid Element ................44
3.3.2.2 SHELL99 Linear Layered Structural Shell Element ............45
3.3.2.3 TARGE170, 3-D Target Segment - CONTA 174, 3-D,
Surface-to-Surface Contact Elements ...................................46

xii
3.3.3 Mesh Attributes........................................................................47
3.3.4 Constants and Material Properties ...........................................48
3.3.5 Boundary Conditions ...............................................................49
4. RESULTS AND DISCUSSIONS..............................................................51
4.1 Introduction......................................................................................51
4.2 Experimental Results .......................................................................51
4.2.1 Split-disk Test Results .............................................................51
4.2.2 Tube Tensile Test Results........................................................73
4.3 Discussion of Experimental Work ...................................................81
4.3.1 Split Disk Tests ........................................................................81
4.3.2 Tube Tensile Tests ...................................................................95
4.4 Results and Discussions of Simulation of Split-disk Tests............101
5. CONCLUSION ........................................................................................112
REFERENCES.............................................................................................117
APPENDIX A...............................................................................................121
APPENDIX B ...............................................................................................123

xiii
LIST OF TABLES
Table 1.1 A comparison of mechanical properties of commercially
available continuous fibers.........................................................5
Table 2.1 Properties of HUNTSMAN product, LY556/ HY917/ DY070
resin + hardener system ...........................................................18
Table 2.2 Properties of HUNTSMAN product, MY740 /HY918/ DY062
resin + hardener system ...........................................................18
Table 2.3 Properties of Tenax product, HTA 5331 800 TEX carbon fiber
and FORTAFIL produc t, 503, 2190 TEX carbon fiber ...........19
Table 2.4 Properties of CAMELYAF Product, WR3 2400 TEX glass
fiber, and PPG product, Roving 1084, 2400 and 600 TEX glass
fibers.........................................................................................19
Table 2.5 Longitudinal/transverse modulus data, calculated by rule of
mixtures....................................................................................21
Table 2.6 The variables, used in determination of testing groups ...........22
Table 2.7 Properties of the strain gages, used in experiments. ................29
Table 3.1 Layer configurations, layer thicknesses and in-plane stiffness
(E1, E2) of the specimens, used in the analysis .......................48
Table 3.2 Layer configurations, layer thicknesses and in-plane stiffness
(E1, E2) of the specimens, used in the analysis .......................48
Table 4.1 Hoop tensile strength results of split-disk tests and the related
statistical results for specimens 1111-1 through 1132-5..........53
Table 4.2 Hoop tensile strength results of split-disk tests and the related
statistical results for specimens 1142-1 through 1222-5..........54
Table 4.3 Hoop tensile strength results of split-disk tests and the related
statistical results for specimens 1232-1 through 2112-5..........55
Table 4.4 Hoop tensile strength results of split-disk tests and the related
statistical results for specimens 2122-1 through 2251-5..........56

xiv
Table 4.5 Hoop tensile strength results of split-disk tests and the related
statistical results for specimens 2212-1 through 3141-5..........57
Table 4.6 Hoop tensile strength results of split-disk tests and the related
statistical results for specimens 3151-1 through 3221-5..........58
Table 4.7 Hoop tensile strength results of split-disk tests and the related
statistical results for specimens 3231-1 through 3252-5..........59
Table 4.8 Hoop tensile strength results of split-disk tests and the related
statistical results for specimens 4111-1 through 4132-5..........60
Table 4.9 Hoop tensile strength results of split-disk tests and the related
statistical results for specimens 4142-1 through 4212-5..........61
Table 4.10 Hoop tensile strength results of split-disk tests and the related
statistical results for specimens 4222-1 through 5141-5..........62
Table 4.11 Hoop tensile strength results of split-disk tests and the related
statistical results for specimens 5151-1 through 5221-5..........63
Table 4.12 Hoop tensile strength results of split-disk tests and the related
statistical results for specimens 5231-1 through 5252-5..........64
Table 4.13 Hoop tensile modulus of elasticity results of split-disk tests and
related statistical results for specimens 1111-1
through 1252-2.........................................................................68
Table 4.14 Hoop tensile modulus of elasticity results of split-disk tests and
related statistical results for specimens 2111-1
through 2252-2.........................................................................69
Table 4.15 Hoop tensile modulus of elasticity results of split-disk tests and
related statistical results for specimens 3111-1
through 3252-2.........................................................................70
Table 4.16 Hoop tensile modulus of elasticity results of split-disk tests and
related statistical results for specimens 4111-1
through 4252-2.........................................................................71
Table 4.17 Hoop tensile modulus of elasticity results of split-disk tests and
related statistical results for specimens 5111-1
through 5252-2.........................................................................72

xv
Table 4.18 Load and elongation results of tube tensile tests for specimens
1131 through 3152 ...................................................................74
Table 4.19 Load and elongation results of tube tensile tests for specimens
3231 through 5252 ...................................................................75
Table 4.20 Longitudinal tensile strength/tensile modulus of elasticity
results of tube tensile tests for specimens 1131 through 3152.79
Table 4.21 Longitudinal tensile strength/tensile modulus of elasticity
results of tube tensile tests for specimens 3231 through 525280
Table 4.22 Failure loads and maximum elongations of specimens, obtained
experimentally........................................................................103
Table 4.23 The displacement data of the inner split-disk sections,
computed in the analysis and the related percent errors ........103
Table 4.24 Tabulated hoop tensile modulus of elasticity results computed
by FEM and obtained from experiments ...............................111
Table 5.1 Experimental results of glass fiber reinforced specimens ......112
Table 5.2 Experimental results of carbon fiber reinforced specimens...113
Table A.1 Winding configuration and tension setting for specimens 1111
through 3152 ..........................................................................121
Table A.2 Winding configuration and tension setting for specimens 3211
through 5252 ..........................................................................122
Table B.1 Split-disk test specimen dimensions for 1111-1
through 1212-5.......................................................................123
Table B.2 Split-disk test specimen dimensions for 1222-1
through 2241-5.......................................................................124
Table B.3 Split-disk test specimen dimensions for 2251-1
through 3221-5.......................................................................125
Table B.4 Split-disk test specimen dimensions for 3231-1
through 4152-5.......................................................................126
Table B.5 Split-disk test specimen dimensions for 4211-1
through 5132-5.......................................................................127

xvi
Table B.6 Split-disk test specimen dimensions for 5142-1
through 5252-5.......................................................................128
Table B.7 Tube tensile test specimen dimensions ..................................129

xvii
LIST OF FIGURES
Figure 1.1 Filament-winding Technique .....................................................3
Figure 1.2 Schematic representation of the possible service loads, for a
filament-wound composite tubular structure .............................7
Figure 1.3 Angle-ply models for an element from the wall of a filament-
wound tube ...............................................................................10
Figure 1.4 Ring specimen geometry and schematic of ring test ...............13
Figure 2.1 Drawing of filament-wound tube and method of cutting. .......23
Figure 2.2 Specimen number designation procedure ................................24
Figure 2.3 Drawing of split-disk test specimen........................................26
Figure 2.4 Test fixture used in split-disk tests...........................................27
Figure 2.5 Photograph of the split-disk test fixture, assembled on the
tensile testing machine. ............................................................28
Figure 2.6 Cross-sectional area on which hoop tensile stress is applied...31
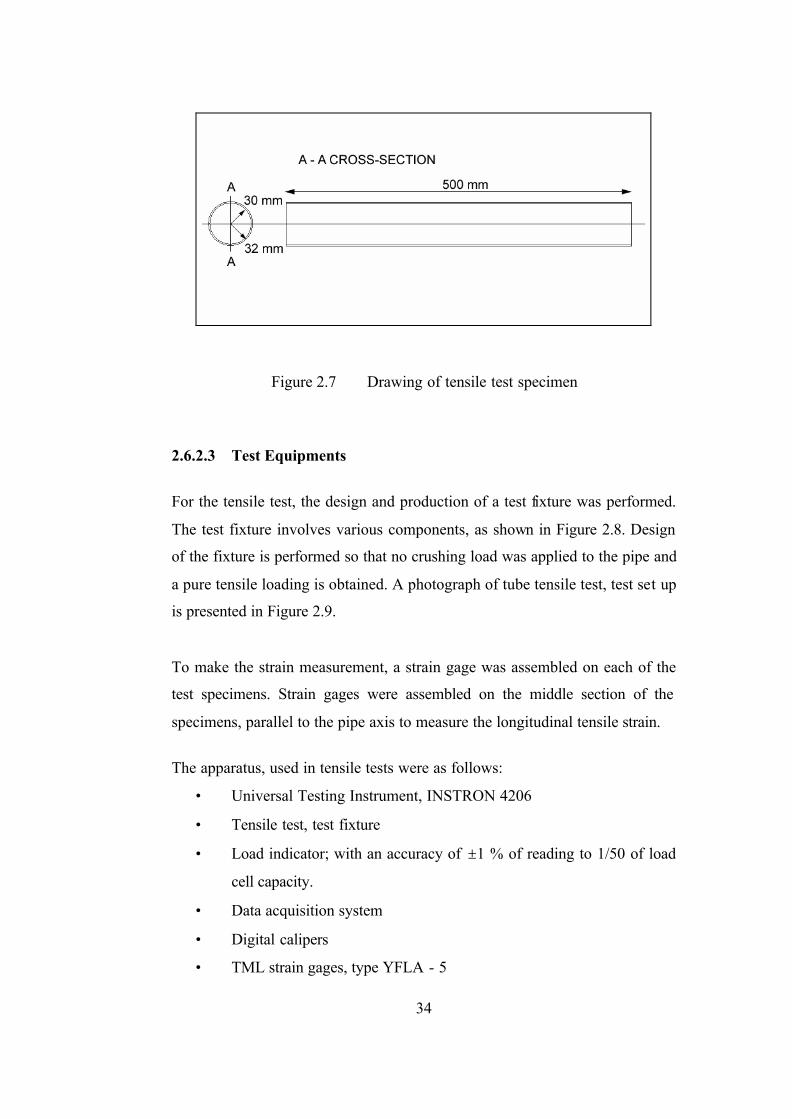
Figure 2.7 Drawing of tensile test specimen.............................................34
Figure 2.8 Schematic of tensile test fixture ...............................................35
Figure 2.9 Tube tensile test and test setup .................................................35
Figure 3.1 The geometry of the model......................................................43
Figure 3.2 Description of SOLID185 structural shell element .................44
Figure 3.3 Description of SHELL99 structural shell element ...................45
Figure 3.4 Description of CONTA174 3-D surface-to-surface contact
element .....................................................................................46
Figure 3.5 Mesh pattern of the split disk section of the model .................47
Figure 3.6 The area/line on which the boundary conditions are defined ..49
Figure 4.1 Stress – strain curve of 1251-1 split-disk test specimen..........65
Figure 4.2 Least-square fitted stress-strain curve of 1251-1 ring test
specimen...................................................................................66

xviii
Figure 4.3 Stress –Strain curve of 1251-2 ring test specimen...................66
Figure 4.4 Least-square fitted stress-strain curve of 1251-2 ring test
specimen...................................................................................67
Figure 4.5 Stress–strain curve of 1131 tube tensile test specimen............76
Figure 4.6 Least-square fitted stress-strain curve of 1131 tube tensile test
specimen...................................................................................76
Figure 4.7 Stress – Strain curve of 1141 tube tensile test specimen .........77
Figure 4.8 Least-square fitted stress-strain curve of 1141 tube tensile test
specimen...................................................................................77
Figure 4.9 Stress – Strain curve of 1151 tube tensile test specimen .........78
Figure 4.10 Least-square fitted stress-strain curve of 1151 tube tensile test
specimen...................................................................................78
Figure 4.11 Dominant failure mechanisms and their locations on split-disk
specimens .................................................................................82
Figure 4.12 Hoop tensile strength vs. winding angle for specimens (fiber 1,
resin 2, tension setting 1). ........................................................83
Figure 4.13 Hoop tensile strength vs. winding angle for specimens (fiber 2,
resin 2, tension setting 1). ........................................................84
Figure 4.14 Hoop tensile strength vs. winding angle for specimens (fiber3,
resin 2, tension setting 1) .........................................................84
Figure 4.15 Hoop tensile strength vs. winding angle for specimens (fiber 4,
resin 2, tension setting 1) .........................................................85
Figure 4.16 Hoop tensile strength vs. winding angle for specimens (fiber 5,
resin 2, tension setting 1) .........................................................85
Figure 4.17 Comparison of hoop tensile strengths of specimens having
different fiber types, as a function of winding angle ...............86
Figure 4.18 Comparison of hoop tensile strengths of specimens having
different resin systems, as a function of fiber type ..................87
Figure 4.19 Hoop tensile strength vs. winding angle for specimens (fiber 1,
resin 1, tension settings 1-2) ....................................................88

xix
Figure 4.20 Hoop tensile strength vs. winding angle for specimens (fiber 2,
resin 1, tension setting 1-2) ......................................................89
Figure 4.21 Hoop tensile strength vs. winding angle for specimens (fiber 3,
resin 1, tension setting 1-2) ......................................................89
Figure 4.22 Hoop tensile strength vs. winding angle for specimens (fiber 4,
resin 1, tension setting 1-2) ......................................................90
Figure 4.23 Hoop tensile strength vs. winding angle for specimens (fiber 5,
resin 1, tension setting 1-2) ......................................................90
Figure 4.24 Hoop tensile modulus of elasticity vs. winding angle for
specimens (fiber 1, resin 1, tension setting 1)..........................91
Figure 4.25 Hoop tensile modulus of elasticity vs. winding angle for
specimens (fiber 2, resin 1, tension setting 1)..........................92
Figure 4.26 Hoop tensile modulus of elasticity vs. winding angle for
specimens (fiber 3, resin 1, tension setting 1)..........................92
Figure 4.27 Hoop tensile modulus of elasticity vs. winding angle for
specimens (fiber 4, resin 1, tension setting 1)..........................93
Figure 4.28 Hoop tensile modulus of elasticity vs. winding angle for
specimens (fiber 5, resin 1, tension setting 1)..........................93
Figure 4.29 Comparison of hoop tensile modulus of elasticity of specimens
having different fibers as a function of winding angle ............94
Figure 4.30 Types of failure and their locations on carbon/glass fiber
reinforced tube tensile test specimens ......................................96
Figure 4.31 Comparison of longitudinal tensile strengths of tube tensile test
specimens having different fibers as a function of winding
angle .........................................................................................98
Figure 4.32 Comparison of longitudinal tensile strengths of tube tensile test
specimens having ±45o winding angle.....................................99
Figure 4.33 Comparison of longitudinal tensile modulus of elasticity of tube
tensile test specimens having different fibers as a function of
winding angle .........................................................................100
Figure 4.34 Schematic view of split-disk test fixture upon loading..........102

xx
Figure 4.35 Hoop tensile stress–strain graph of split-disk test specimen
1221, obtained by FEM..........................................................105
Figure 4.36 Least-square fitted stress-strain graph of 1221 split-disk test
specimen, obtained by FEM ..................................................105
Figure 4.37 Hoop tensile stress–strain graph of split-disk test specimen
1231, obtained by FEM..........................................................106
Figure 4.38 Least-square fitted stress-strain graph of 1231 split-disk test
specimen, obtained by FEM ..................................................106
Figure 4.39 Hoop tensile stress–strain graph of split-disk test specimen
1241, obtained by FEM..........................................................107
Figure 4.40 Least-square fitted stress-strain graph of 1241 split-disk test
specimen, obtained by FEM ..................................................107
Figure 4.41 Hoop tensile stress–strain graph of split-disk test specimen
3221, obtained by FEM..........................................................108
Figure 4.42 Least-square fitted stress-strain graph of 3221 split-disk test
specimen, obtained by FEM ..................................................108
Figure 4.43 Hoop tensile stress–strain graph of split-disk test specimen
3231, obtained by FEM..........................................................109
Figure 4.44 Least-square fitted stress-strain graph of 3231 split-disk test
specimen, obtained by FEM ..................................................109
Figure 4.45 Hoop tensile stress–strain graph of split-disk test specimen
3241, obtained by FEM..........................................................110
Figure 4.46 Least-square fitted stress-strain graph of 3241 split-disk test
specimen, obtained by FEM ..................................................110
Figure 4.47 Comparison of hoop tensile modulus of elasticity results
obtained by FEM and experiments ........................................111

1
CHAPTER 1
INTRODUCTION
Development of new composites and new applications of composites is
accelerating due to the requirement of materials with unusual combination of
properties that cannot be met by the conventional monolithic materials.
Actually, composite materials are capable of covering this requirement in all
means because of their heterogeneous nature. Properties of composites arise as
a function of its constituent materials, their distribution, and the interaction
among them and as a result an unusual combination of material properties can
be obtained.
From the wide family of composites, fiber reinforced composites have taken
much attention due to their better mechanical properties. A fibrous
reinforcement is characterized by its length being much greater than its cross-
sectional dimension. Composites produced by long fibers with high aspect
ratio give what are called continuous fiber reinforced composites. These
composites have found a wide range of application area due to their
anisotropic nature, that is; the direction dependence of their properties results
in much better design flexibility that cannot be obtained by monolithic
materials or particle reinforced composites.
Anisotropic nature of fibrous composites, however, makes their mechanical
characterization much more complicated compared to monolithic materials.
There are several analytical, computational and experimental studies,
concerning the analysis of mechanical performance of filament-wound
composites in literature. However, this concept is still under development, and
requires additional scientific effort.

2
This study was aimed to fulfil a part of this requirement. Carbon, and glass
fiber reinforced filament-wound composite tubes were selected as the target of
this study since these reinforcements are commonly used in most of the
applications of filament-winding technique. Variation of longitudinal tensile
and hoop tensile properties of these composites was investigated as a function
of mainly the direction of fiber reinforcements inside the composite. By
evaluating the experimental data, a general distribution of the prespecified
properties as a function of winding angle was obtained. In addition, split disk
testing of filament-wound composite structures was modelled by using the
finite element method, to supply a comprehensive base to the study.
Several production methods have been developed for the synthesis of fiber
reinforced composites, mainly according to the continuous/matrix phase of the
composite, under consideration. Filament winding technique can be accepted
as one of the most common production techniques, for the synthesis of
polymer matrix composites (PMC). In the following section, filament-winding
technique, its advantages, limitations, applications and potential raw materials
will be explained.
1.1 Filament Winding Technique
Filament winding is a continuous fiber reinforced composite production
technique, in which resin – impregnated band of continuous fibers are wound
over a rotating mandrel. Wounding of continuous fibers are performed either
as adjacent bands or in the form of repeating bands that are stepped the width
of the band to eventually cover the mandrel surface and to produce one
complete layer. The process continues with the wounding of additional layers,
until the design requirements are achieved. The production is completed by
curing of the filament-wound product in an oven and the removal of the
mandrel. A schematic representation of the technique is given in Figure 1.1.

3
(i)
(ii) (iii)
Figure 1.1 Filament-winding Technique. (i) Schematic representation of
the process. (ii) Presentation of coupled helical winding of layers. (iii)
Presentation of hoop winding of layers.
Each layer of reinforcement can vary in winding tension, winding angle, or
resin content. By varying the winding angle with respect to the mandrel axis,
directional strength can be obtained by considering the loads, which will
operate on the finished product. Coupled helical winding of layers (±θ) are
usually preferred (Figure 1.1(ii)), whereas hoop winding (winding angle, very
close to 90°, Figure 1.1(iii)) can also be used in combination with the helical
layers. Other advantages of filament winding technique are high specific
strength, specific modulus and fiber volume percentage of the finished
products and high repeatability of the process. (Production can be repeated
successively, to obtain the same properties of the finished products)
4
The main limitation of filament winding technique is the difficulty in
production of complex shapes due to the requirement of very complex mandrel
designs. In addition, production of reverse curvature parts is not possible by
using this technique. These limitations restrict the application area of this
technique to the production of mainly cylindrical, usually axisymmetric,
hollow parts. Main application areas of this technique are pipelines, shafts,
pressure vessels, rocket motor cases, rocket launch tubes, and gas tanks.
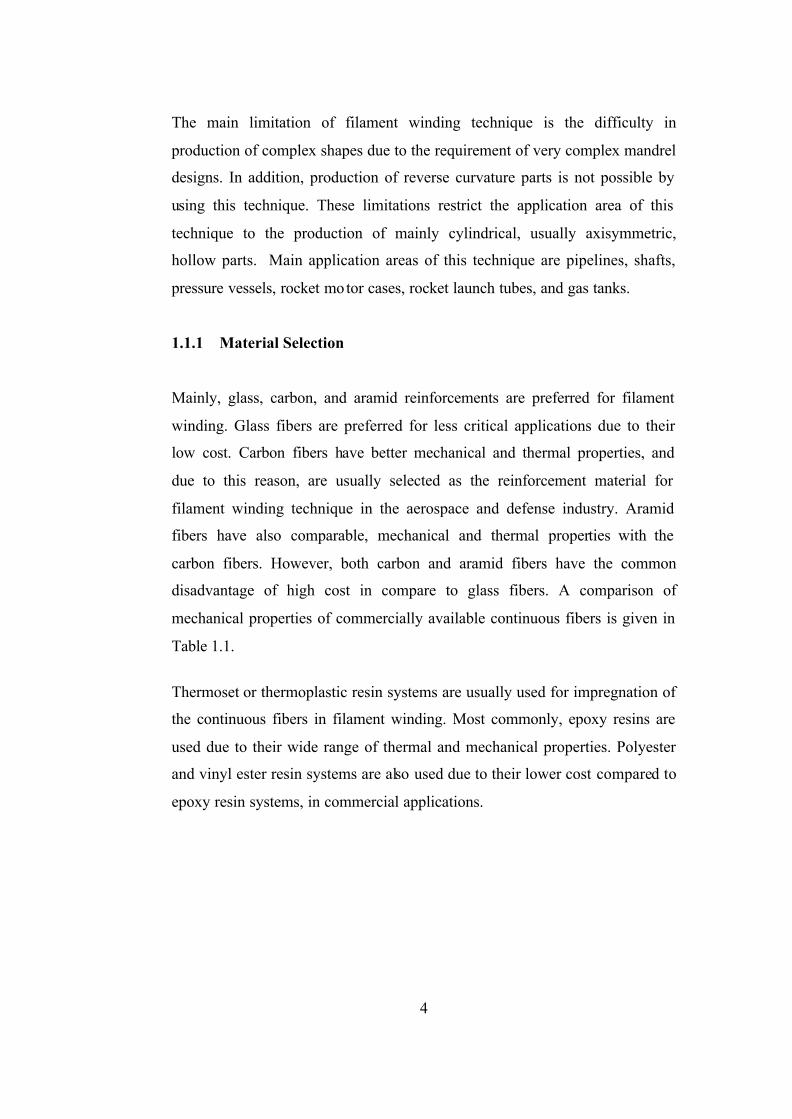
1.1.1 Material Selection
Mainly, glass, carbon, and aramid reinforcements are preferred for filament
winding. Glass fibers are preferred for less critical applications due to their
low cost. Carbon fibers have better mechanical and thermal properties, and
due to this reason, are usually selected as the reinforcement material for
filament winding technique in the aerospace and defense industry. Aramid
fibers have also comparable, mechanical and thermal properties with the
carbon fibers. However, both carbon and aramid fibers have the common
disadvantage of high cost in compare to glass fibers. A comparison of
mechanical properties of commercially available continuous fibers is given in
Table 1.1.
Thermoset or thermoplastic resin systems are usually used for impregnation of
the continuous fibers in filament winding. Most commonly, epoxy resins are
used due to their wide range of thermal and mechanical properties. Polyester
and vinyl ester resin systems are also used due to their lower cost compared to
epoxy resin systems, in commercial applications.

5
Table 1.1 A comparison of mechanical properties of commercially
available continuous fibers, adapted from Ref [1].
Fiber Elastic Modulus
(GPa)
Tensile Strength
(MPa)
Tensile Strain
(%)
S - Glass 72.5 3447 4.80
R - Glass 86.2 2068 2.4
Carbon 248.0 4550 1.64
Aramid 186.0 3445 1.8
The curing temperature of the wound products is determined by the resin
system selected for an application. The main factor controlling the curing
temperature is the glass transition temperature (Tg) of the resin system
selected. As a function of Tg, curing can be performed either in an oven or at
room temperature. However, oven curing is usually preferred due to the much
shorter curing time.
1.1.2 Winding and Impregnation Methods in Filament Winding
Joining of reinforcement and the resin system is termed as impregnation. In
filament winding, mainly two impregnation methods are used, namely; dry
winding and wet winding. In dry winding method, preimpregnated fibers are
directly wounded on the mandrel surface. This technique is also termed as
prepreg winding. The application of this technique causes the manufacturer to
obtain better mechanical properties of the finished products. However, due to

6
the high prepreg material costs, this method is usually only preferred for high
performance applications.
In wet winding method, passing the fibers from a resin bath before the
winding operation performs the impregnation of fibers. This impregnation
method is commercially the most common and involves additional process
variables compared to dry winding technique, such as, resin viscosity and fiber
tension. Resin viscosity has a great importance in filament winding technique.
If the viscosity is too high, unevenly coating of fibers with resin can occur,
whereas in the other extreme, if the resin viscosity is too low, resin may flow
out of the part during winding, which can cause a relatively lower weight
percent of resin in the finished product.
Since the continuous fiber reinforcements are packaged on the form of rolls in
wet winding technique, the tension setting of the fibers should be controlled
before the impregnation process. This can be achieved by introducing tension
at the roll, with the aid of a tensioning device. Tension setting can also have an
effect on mechanical performance of the finished product, and therefore has to
be accepted as a design variable in wet winding technique.
Winding of fibers in filament winding can be performed by using either helical
or polar winding technique. In helical winding technique, the mandrel rotates
continuously while the fiber feed carriage moves unidirectionaly along the
mandrel axis. In polar winding, different from the helical winding, the mandrel
remains stationary, while the fiber feed carriage both rotates along the
longitudinal axis of the mandrel and moves unidirectionally along the mandrel
axis.

7
1.2 Analysis of Filament-Wound Composite Tubes
The application areas, stated in Section 1.1, involve various loading
conditions, mainly, axial loads, torsion, internal and external pressure, and
bending. For an application, the thickness (number of windings), and the
winding angle of the fibers are defined by taking into account the loading
conditions, under which the finished product will operate. In Figure 1.2, a
schematic representation of these loads is presented on a filament-wound
composite tubular structure.
Figure 1.2 Schematic representation of the possible service loads, for a
filament-wound composite tubular structure.

8
In the next section, the methodologies, which are commonly used for the
theoretical analysis of the mechanical performance of the filament-wound
composite structures and some illustrations of the related literature review,
will be presented. The following section involves a review of past
experimental studies, performed to characterize filament wound composite
tubes.
1.2.1 Theoretical Analysis of Mechanical Performance of Filament-
Wound Composite Structures
In most of the studies performed to determine the mechanical properties of
filament-wound composite tubes, these structures are modeled as a
combination of layers, each having a winding direction with respect to the
longitudional axis of the tubular composite part and each having a finite
thickness. This assumption simplifies the model, such that; with the aid of this
assumption, the single layer solution can be successively extended to
laminated tube geometry, and therefore to filament-wound composite
structure. The assumption however can cause a negligible error for helical
layers, that is; the helical layers, having plus and minus winding angles are not
forming two totally distinct layers since the fiber bands criss-cross by creating
a weaving effect.
On the basis of the above assumption, several analytical analyses for
multilayered filament-wound composite structures were performed so as to
determine the stresses and displacements, arising from the loads, presented in
Figure 1.2 [2–8], based on the solution of Lekhnitskii [9] for anisotropic tubes
composed of single layer. Solutions were also obtained for filament-wound
composite structures, under combined loading conditions, such as the study of
P. M. Wild and G. W. Vickers [10]. They developed an analytical procedure to
assess the stress and deformations of a filament-wound cylindrical shell
comprising a number of sublayers, each of which is cylindrically orthotropic.

9
Radial body force due to rotation about the cylinder axis, interna l and external
pressures and axial force was considered during the study.
A similar study was performed by C. S. Chouchaoui and O. O. Ochoa [11] to
determine the stresses and displacements of an assembly of several coaxial
hollow circular cylinders, made of orthotropic materials. Differently, torsion
and bending loads are considered in addition to internal-external pressure and
axial loading.
C. T. Sun and Sijian Li [12] obtained an analytical solution for thick
laminates, consisting of large numbers of repeating sublaminates/layers. The
laminate was modeled as a three-dimensional homogenous anisotropic solid,
based on the assumption, stated above. Reduced expressions for the effective
moduli were derived in each lamina by using constant stress and constant
strain boundary conditions.
In the study of Aleçakir [13], analytical solutions for stresses and
displacements in each orthotropic layer of a multi- layered filament-wound
composite tube, subjected to axisymmetric and bending loads were obtained,
by developing a method based on the governing equations for a homogenous
body having cylindrical anisotropy [9]. The results were verified by
performing experiments, concerning the bending behavior of composite tubes.
K. Chandrashekhara and P. Gopalakrishnan [14] obtained a three-dimensional
elasticity solution for a long multilayered cylindrical shell of transversely
isotropic layers, which are subjected to axisymmetric radial load. Numerical
results were also presented for cylindrical shells, having different thickness –
to – outer radius ratios and for different ratios of the modulus of elasticity in
the radial direction of layers.

10
A partially different approach was also developed so as to obtain an analytical
solution for the stress and deformations of filament-wound structures under
various loading conditions, based on classical laminated plate theory. In this
approach, a rectangular section was taken from the wall of a filament-wound
tube and modeled as an angle – ply laminate, by using the classical lamination
theory. A schematic presentation of this model is presented in Figure 1.3.
This approach can be illustrated by the study of M. F. S. Al-Khalil and P. D.
Soden [15], such that; they developed a solution to calculate the three-
dimensional effective elastic constants for filament-wound fiber-reinforced
composite tubes with the aid of the above assumption. They presented the
winding angle dependence of all of the elastic constants for E-glass, carbon,
and epoxy reinforced filament-wound tubes.
Figure 1.3 Angle-ply models for an element from the wall of a filament-
wound tube. [15]

11
The structures, produced by the filament-winding technique are becoming
more complicated in terms of geometry and loading. This factor necessitates
the usage of computational methods in the analysis of filament-wound
structures. Finite element method is being widely used for the analysis of
continuous fiber reinforced composite structures, especially for the
determination of stresses and displacements under various loading conditions,
failure prediction and damage determination [16-19].
In the study of Ilhan [20], the response of filament-wound composite tubes
and pressure vessels under various loading conditions was investigated by the
finite element method. Internal pressure, axial force, torsion, bending moment,
and combination of these loads were considered during the study and the
development of a computer program was performed for design and analysis
purposes. Both solid and shell elements were used in the study. Maximum
tolerable values for a certain loading condition and geometry of tubes, and the
optimum winding angle, were aimed to be calculated by utilizing the
maximum stress, maximum strain, and Tsai-Wu failure criteria.
In the study of Monika G. Garrell, Albert J. Shis, Edgar Lara-Curzio, and
Ronald O. Scattergood [21], finite element method was used to investigate the
effect of stress concentration in ASTM D 638 Tensile test specimens. Two-
dimensional, plane stress, six-node and twelve degree-of-freedom triangular
linear elastic element was selected to model the tensile test specimens.
Different from the study of Ilhan, the commercially available ANSYS finite
element analysis software and its mesh generator were used for modeling.
Nodal Von-Misses and principle stresses were obtained from the analysis,
which were then used to calculate the stress concentration factor.
S. Arsene, and J. Bai [22], developed a new approach to measure the
transverse properties of structural tubing, by using finite element method.
Three-dimensional finite element modeling with contact was performed to

12
analyze the stress and strain distribution in the ring specimens, to optimize the
ring testing system. By performing a series of analysis, a new design of a
holding device was proposed in order to determine the transverse behavior of
tubular products.
1.2.2 Mechanical Testing of Filament-Wound Composite Structures
Filament-wound composite structures have been tested extensively, mainly to
fulfill two main requirements:
• To provide the necessary material and strength data for the design
purposes
• To verify the accuracy of the completed design studies
For the purposes stated above, a test specimen configuration must be selected,
on the basis that, test results should provide material properties useful in the
design stage. Three types of testing geometry are commonly used in testing of
filament-wound composite structures, namely; flat specimens (coupon
specimens), ring specimens (Figure 1.4), and tubular specimens. Axial
(tension/compression), shear, and bending response of each testing geometry
can be determined by applying a suitable loading to the specimen. In addition
to these tests, internal pressure and torsion tests can be applied to the tubular
specimens. Tests, involving biaxial/combined loading of test specimen can
also be performed.
D. Cohen [23] performed an experimental study to investigate the effect of
winding tension, stacking sequence, winding tension gradient, and winding
time on hoop stress, hoop stiffness, fiber and void volume fraction distribution
through thickness, and interlaminar shear strength of carbon fiber reinforced
filament wound ring specimens. Hoop strength and hoop stiffness of the

13
specimens were obtained by performing pressurized ring tests [24] on the
filament-wound ring specimens. The interlaminar shear strength of composites
were determined by performing short-beam shear (SBS) tests, according to
ASTM D2344-88. It was shown that composite strength increases for
cylinders, wound without winding gradient, wound in short time, with high
winding tension. However, it was also stated that the effect of these variables
on strength were relatively small, with effect of winding tension being the
largest.
Figure 1.4 Ring specimen geometry and schematic of ring test
H. Wang, R. Bouchard, R. Eagleson, P. Martin, and W. R. Tyson, performed
ring hoop tension tests to ring samples [25], having a single reduced section of
area. The paper involves an improved modification of the test, to determine
the hoop stress – strain curve, and it was concluded that ring hoop tension test
is an accurate method to measure transverse tensile properties of tubular
specimens.

14
C. S. Lee, W. Hwang, H.C Park, and K. S. Han [26] performed biaxial tests on
cross-ply carbon/epoxy composite tubes under combined torsion and axial
tension/compression up to failure to investigate the effect of biaxial loading
ratios on failure strength and failure mechanism. In that study, it was
concluded that there is a strong interaction between the axial stress and the
shear stress at failure.
Jinbo Bai, Philippe Seeleuthner, and P. Bompard [27] performed an
experimental study to investigate the mechanical behavior of ±55° filament-
wound glass fiber reinforced epoxy resin tubes. Series of tests were carried out
under various combinations of hoop and axial stress to evaluate the filament-
wound tubes mechanical behavior under pure axial tensile load, pure internal
pressure, and under combined loading. Observations on specimens, loaded to
twenty to fifty percent of the ultimate tensile strength, showed that the main
damage initiation mechanisms are microcracking and delamination.
Depending on the loading conditions, one of the mechanisms dominates over
the other.
Another experimental study, concerning ±55° filament-wound composite
tubes, was performed by M. Caroll, F. Ellyin, D. Kujawski, and A. S. Chiu
[28]. Glass fiber/epoxy tubes, having ±55° winding angle were tested in a
biaxial testing machine with various ratios of axial stress to hoop stress. The
resulting stress/strain curves were analyzed and biaxial failure envelopes in
terms of stress and strain were constructed, demonstrating the complexity of
the behavior of the tubes. It was shown that the rate and ratio of biaxial
loading affect the monotonic failure strength, damage accumulation and the
mode of failure.
In the study of Ayral [29], the influence of fiber directions on the mechanical
properties of carbon fiber reinforced polyether-ether-ketone (PEEK)
thermoplastic matrix composites was investigated by conducting tension,

15
flexural, impact, and in plane shear tests. In addition, physico-chemical tests
were also performed to obtain the fiber and matrix mass percentages, density
and void content of test panels. The test specimens were prepared by using
autoclave and vacuum bag molding process. Tests were performed with 0° and
90° fiber directions.
In Reference [30], filament-wound composite tubes, produced by four
different fiber materials (carbon, aramid, E-glass, S2-glass) and two different
resin systems were tested. Axial (tensile/compressive), internal pressure,
impact, and torsion response of test specimens, having 25°, 45°, and 54°
winding angle were determined separately. In addition thermal analysis
technique was used so as to obtain fiber and matrix mass percentages, and the
glass transition temperatures of the matrix phase. Under the scope of the study,
coupon tests were also performed in order to define the material properties of
the selected composite materials.
1.3 Scope of the Thesis
The thesis includes five chapters. A brief introduction about the subject, thesis
objective, and the related literature is presented in Chapter 1. The second
chapter involves information about the specimen details, its designations, and
experimental technique. General aspects of the modeling study is given in
Chapter 3. The fourth chapter includes the results of the experimental work
and the simulation study, and their comprehensive discussion. The conclusions
obtained from the study, is summarized in the last chapter.

16
CHAPTER 2
SAMPLE PREPERATION AND EXPERIMENTAL TECHNIQUE
2.1 Introduction
This chapter involves material selection of specimens, their fabrication and
designation procedure, and the experimental technique. In the following two
sections, brief information about the selected resin systems and reinforcements
will be presented. This will be followed by test specimen fabrication
procedure in Section 2.4. In Section 2.5, the methodology used in
identification of specimens will be presented. In the last section, experimental
technique (test specimen geometries, test equipments, test procedure, and
calculations) will be presented for split-disk and tube tensile tests separately.
2.2 Material Selection
Test specimens were fabricated from five different fibers and two different
epoxy resin systems. In the following two sections, descriptions of these
materials are given.
2.2.1 Resin Systems
Epoxy resins have been the major matrix material of polymer-matrix
composites, especially for aircraft applications, due to their ease of processing,
good mechanical properties, and moderate cost. They are thermosetting and
inert resin systems that a good combination of high mechanical and electrical
properties can be obtained. They can be used for service temperatures up to

17
180–270 °C. Their tensile strength may be up to 83 MPa, hardness to
Rockwell M 110, with elongations up to 2–5%. They also have high resistance
to common solvents, oils, and chemicals [31].
In this study, two different, epoxy resin systems were used in manufacturing
of test specimens. These are HUNTSMAN product, LY556 (Epoxy Resin)/
HY917 (Hardener)/ DY070 (Accelerator) and MY740 (Epoxy Resin)/ HY918
(Hardener)/ DY062 (accelerator) systems. The former is a hot-curing, low
viscosity resin system that exhibits good wetting properties and is easy to
process. It has good chemical resistance, especially to acids at temperatures up
to about 80 Co. It is a suitable resin system for production of composites with
filament winding, tape winding, pultrusion, and injection moulding processes.
The latter resin system (MY740 / HY918 / DY062) is also a hot-curing, low-
viscosity impregnating resin system, also suitable for filament winding, wet
laminating, and pultrusion processes. It has good mechanical and dielectric
properties at elevated temperatures and it has good aging resistance. It has
relatively higher resin viscosity compared to the former resin system. In
addition, it has relatively shorter minimum curing time, and pot life. The
properties of these resin systems, supplied by the manufacturer are tabulated in
Table 2.1 and Table 2.2, respectively.
2.2.2 Reinforcements
The fibers used in this study are PPG product, Roving 1084 600 TEX and
Roving 1084 2400 TEX glass fibers, CAMELYAF Product, WR3 2400 TEX
glass fiber, FORTAFIL product, 503, 2190 TEX carbon fiber and Tenax
product , HTA 5331 800 TEX carbon fiber. For CAMELYAF Product, WR3
2400 TEX glass fiber, fiber feed is from the inner of the rolls. For the rest of
the fibers, fiber feed is from the outer of the rolls. In Table 2.3 and Table 2.4,
the properties of these reinforcements, supplied by the manufacturer are
tabulated.

18
Table 2.1 Properties of HUNTSMAN product, LY556/ HY917/ DY070
resin + hardener system.
Property Units Value Tensile Strength (MPa) 80 – 90
Tensile Modulus (GPa) 3.2 – 3.6
Elongation at break (%) 3 – 7
Glass Trans. Temp. (°C) 135 - 150 (for
curing at 120 °C) 145 – 155 (for
curing at 140 °C) 150 – 155 (for
curing at 160 °C)
Viscocity (mPa.s) 700 - 900 (at 25 C°)
200 – 300 (at 40 C°)
< 75 (at 60 C°)
Thermal Exp. Coeff. (1/K) 10-6
Poisson's Ratio 0.35
Pot life, isotherm. 15 g (min) 420 – 460 (at 60 C°, and 1500 mPa.s )
Nom. Curing Schedule (h/ °C) 4/80 + 4/140
Table 2.2 Properties of HUNTSMAN product, MY740 /HY918/ DY062
resin + hardener system.
Property Units Value Tensile Strength (MPa)
Tensile Modulus (GPa)
Elongation at break (%)
Glass Trans. Temp. (°C) 123 (with min. curing schedule)
Viscosity (average) (mPa.s) 950
(at 25 °C) 70
(at 60 °C)
Thermal Exp. Coeff. (1/K) 10-6
Poisson's Ratio 0.35
Pot life, isotherm. 15 g (min) 210
Min. Curing Schedule (h/ °C) 2/80 + 2/120

19
Table 2.3 Properties of Tenax product, HTA 5331 800 TEX carbon fiber
and FORTAFIL product, 503, 2190 TEX carbon fiber.
Property Units TENAX, HTA 5331 FORTAFIL, 503
Linear Density (tex) 800 2190
Tensile Strength (MPa) 3796 3800
Tensile Modulus
(GPa) 240.8 231
Elongation at break
(%) 1.51 1.64
Filament Diameter (µm) 7 6
Spec. Density (g/cm3) 1.76 1.80
Table 2.4 Properties of CAMELYAF Product, WR3 2400 TEX glass
fiber, and PPG product, Roving 1084, 2400 and 600 TEX glass fibers.
Property Units CAMELYAF WR3 PPG Roving 1084 - 2400
PPG Roving 1084 – 600
Linear Density (tex) 2400 2400 600
Tensile Strength (MPa) 2250 2070
Tensile Modulus
(GPa) 75 72.45
Elongation at break
(%) 3 3 – 4
Filament Diameter
(µm) 22.5 15 15
Spec. Density (g/cm3) 2.6 2.63

20
2.3 Micromechanics
From the micromechanical point of view, the properties of a multicomponent
composite material can be raughly obtained by the properties of its indivudial
constituents and their relative fractions in composite (weight or volume
fractions). Even though the results obtained with this assumption is deficient
in predicting the mechanical properties of filament-wound tubular composites
(since it is not considering the effect of shape, orientation, distribution, and
size of reinforcement, relative strength of fiber/matrix interface etc.), it can be
a good tool for discussing the reliability of the experimental studies,
performed under the scope of the thesis. Therefore, the results of calculations,
performed by considering this assumption will be presented in here.
Accordingly, the longitudinal and transverse modulus of a composite can be
approximated as follows:
mmffL E.vE.vE += (2.1)
m
m
f
f
T Ev
Ev
E1 += (2.2)
where:
EL : Longitudinal Young’s modulus
ET : Transverse Young’s modulus
Ef : Modulus of fiber reinforcement
Em : Modulus of matrix phase
vf, vm : Volume frasctions of reinforcement and matrix phase respectivelly.

21
By using the data, presented in Tables 2.1-2.4 and given in [30], longitudinal
and transverse modulus of elasticity was obtained and is presented in Table
2.5 for each fiber type. For all calculations, the data for first resin system
(HUNTSMAN product, LY556/ HY917/ DY070) was used.
Table 2.5 Longitudinal/transverse modulus data, calculated by rule of
mixtures.
Reinforcement
Ex
(GPa)
Ey
(GPa)
PPG Glass Fiber, 2400 TEX
44.08 7.43
PPG Glass Fiber, 600 TEX
42.03 7.45
TENAX Carbon Fiber, 800 TEX
143.73 7.72
FORTAFIL Carbon Fiber, 2190 TEX
137.68 8.12
2.4 Test Specimen Fabrication
By using five different reinforcements, two different resin systems, two
different tension settings (during the production of the specimens) and five
different winding angles, 100 different test groups were obtained. These
variables and their identification numbers used in determination of testing
groups are tabulated in Table 2.6.

22
Table 2.6 The variables, used in determination of testing groups.
Id. Number Reinforcements Winding Angles
1 PPG Glass Fiber, 2400 TEX
(Outer fiber feed) 0°
2 CAMELYAF Glass Fiber, 2400 TEX
(Inner fiber feed) ±25°
3 TENAX Carbon Fiber, 800 TEX
(Outer fiber feed) ±45°
4 PPG Glass Fiber, 600 TEX
(Outer fiber feed) ±65°
5 FORTAFIL Carbon Fiber, 2190 TEX
(Outer fiber feed) 90°
Id. Number Resin Systems Tension Settings
1 MY740 / HY918 / DY062 Normal (without using weight)
2 LY556 / HY917 / DY070 With tension (with weight)
Under the scope of the thesis, 100 tubular specimens were produced by using
wet winding technique in filament-winding facilities of Baris Elektrik
Endüstrisi A. S., Ankara. Winding operations were performed on a 60 mm
diameter steel mandrel with a three axial, computer controlled Bolenz &
Schafer filament-winding machine. These wound tubes, together with the
mandrel, were then placed into temperature-controlled furnaces, for curing
operation. By considering the resin system used, two different, two-step curing
program were determined, and these programmes were as follows:
For specimens, fabricated with Resin System 1 (MY740 / HY918 / DY062):
• Curing at 80°C, for two hours.
• Curing at 120°C, for two hours.
For specimens, fabricated with Resin System 2 (LY556 / HY917 / DY070):
• Curing at 80°C, for four hours.
• Curing at 140°C, for four hours.

23
After the curing operation, the removal of the mandrel from the specimens was
performed. Each specimen was then cut so as to obtain five split-disk test
specimens and a tensile test specimen (Figure 2.1). Production details of each
specimen, including their dimensions, number of wounded layers and their
configurations will be given in Appendix A.
Figure 2.1 Drawing of filament-wound tube and method of cutting.
2.5 Test Specimen Designations
To identify the fiber and resin system, winding angle, and tension setting of
each specimen, a specimen number was designated to each specimen. Each
number represents a variable in this designation. In Figure 2.2, a schematic
representation of this designation is presented. Each number in this
designation is determined in correlation with Table 2.6. As an illustration, the
third specimen, produced with fiber 1 (PPG glass fiber, 2400 TEX), resin
system 2 (LY556 / HY917 / DY070), tension setting 1 (with tension), and
winding angle 3 (±45° winding angle), was designated as 1231-3, whereas the
Ring Test Specimens Tensile Test Specimen

24
second specimen, produced with fiber 3 (TENAX Carbon Fiber, 800 TEX),
resin system 1 (LY556 / HY917 / DY070), tension setting 2 (without tension),
and winding angle 1 (0° winding angle), was designated as 3112-2.
Figure 2.2 Specimen number designation procedure
2.6 Experimental Technique
2.6.1 Split-disk Test
2.6.1.1 Introduction
Determination of hoop tensile properties of filament-wound composite tubular
specimens by split disk method is the main objective of this test. The tests
were performed according to ASTM D 2290, “Apparent Hoop Tensile
Strength of Plastic or Reinforced Plastic Pipe by Split Disk Method” [33]. The
standard covers the determination of the comparative apparent tensile strength
of most plastic products utilizing a split disk test fixture, when tested under
Fiber
Type
Number
Winding
Angle
Number
Tension
Setting
Number
Resin
Type
Number
Specimen
Number

25
defined conditions of pre-treatment, temperature, humidity, and test machine
speed. The test is also suitable for resin matrix composites reinforced by
continuous fibers, and utilizing a split disk test fixture.
Tests were performed with specimens having 0° (unidirectional), ± 25°, ± 45°,
± 65° and 90° (unidirectional) winding angles. Five specimens were tested
from each testing group, two of which are tested by the assembling of strain
gages, to obtain strain data. Mainly, the ultimate hoop tensile strength and
hoop tensile modulus of elasticity of the specimens were determined. In
addition, mean average of these results were calculated for each group, and
with the aid of this data, the general behavior of the specimens were aimed to
be discussed comprehensively.
2.6.1.2 Test Specimen Geometry
Test specimens were full-diameter, full-wall thickness rings, with an inner
radius of 60 mm, and an average outer radius of 64 mm. Each specimen
involves two sections of reduced area, which were located 180° apart from
each other. The specimens were produced free of machining marks, and each
were uniform in cross-section. Drawings of specimens are shown in Figure
2.3.

26

27
2.6.1.3 Test Equipments
The test fixture involves two half, disk shape components, which were
combined to the upper and lower connecting arms of the test fixture, with a
mill. Split-disk test specimens were located between the two half disk shape
components and the upper and lower connecting arms, with the reduced
sections aligned perpendicular to the plane of separation of the two half disk
shape components. An apparent tensile strength rather than a true tensile
strength can be obtained in the test because of a bending moment imposed
during the test at the split between the split disk test fixtures [33]. The test
fixture was therefore designed to minimize the effect of this bending moment.
The drawing and a photograph of the split-disk test fixture are presented in
Figure 2.4 and Figure 2.5, respectively.
Figure 2.4 Test fixture used in split-disk tests.

28
Figure 2.5 Photograph of the split-disk test fixture, assembled on the
tensile testing machine.
The apparatus, used in split disk tests were as follows:
• Universal Testing Instrument, INSTRON 4206: for testing metallic
and composite materials in either tension or compression. The
specifications are; testing capacity of 150 kN (33.750 lbs),
crosshead speed range of 0.005 to 500 mm/min with an accuracy of
0.2% over 100 mm, operating temperatures at –150 to 300 °C.
• Split-disk test fixture.
• Load indicator; with an accuracy of ±1 % of reading to 1/50 of load
cell capacity.
• Digital calipers
• Data acquisition system
• TML strain gages, type YFLA - 5

29
The properties of the strain gages, supplied by the manufacturer are given in
Table 2.7.
Table 2.7 Properties of the strain gages, used in experiments.
TML Strain Gage – YFLA – 5
Gage Resistance 120 ± 3 Ω
Gage Factor 2.12
Temperature Compensation Factor _
Transverse Sensitivity 0.2
2.6.1.4 Test Procedure
The procedure followed during the tests were as follows:
• Reduced section dimensions of the specimens were measured with
digital calipers. For each specimen, thickness measurements were
made at four places, two of which is from the gage sections. Width
of both of the reduced sections was also recorded. Specimen
reduced section areas were then calculated by using the minimum
thickness and minimum width measurements.
• The specimens were mounted on the split disk test fixture with the
reduced sections located at the split in the fixture, taking care to
align the test specimen on the split disk specimen holder so that it
was centered along the line joining the points of attachment of the
fixture to the test machine.

30
• Speed of testing (velocity of separation of the two members of the
testing machine) was set to a constant speed and the test was
started.
• Load and strain data were taken until the failure of the specimen.
• For each test group, arithmetic mean of the measured ultimate hoop
tensile strength and hoop tensile modulus were calculated and
reported as the average value.
• Standard deviations for each group of specimens were calculated.
2.6.1.5 Calculations
The apparent hoop tensile strength of the specimens were calculated by using
the following equation:
m
maxhtu A.2
P=σ (2.3)
where:
:htuσ : Ultimate hoop tensile strength, MPa
:Pmax Maximum load prior to failure, N
:Am Minimum cross-sectional area of the two reduced sections, d x b, mm2
Obtained strain and calculated stress data were then used to plot stress – strain
graphs of the specimens. These graphs were used so as to obtain the hoop
tensile modulus of elasticity of the specimens. For this purpose, slope of the
linear portion of the graphs were determined, by fitting a straight line to the
linear portion of the graphs, with the least square method. Therefore:

31
εσ
=dd
Eh (2.4)
where:
Eh : Hoop tensile modulus of elasticity, GPa.
dσ / dε : Slope of the linear portion of the stress – strain curve.
Figure 2.6 Cross-sectional area on which hoop tensile stress is applied.

32
After calculating hoop tensile strength and hoop tensile modulus of elasticity
of each specimen, the arithmetic mean of these results, standard deviations,
and coefficient of variations were calculated with the following equations:
= ∑
=
− n
1iiX.
n1
X (2.5)
1n
X.nXS
2i
n
1ii
−
−=
∑= (2.6)
100.X
sCV
= − (2.7)
where:
S : Estimated standard deviation
CV : Sample Coefficient of variation, in percent −X : Arithmetic mean of the set of observations
X : Value of single observation
n : Number of observations

33
2.6.2 Tube Tensile Test
2.6.2.1 Introduction
The objective of this test is to determine longitudinal tensile properties of
filament-wound composite tubular specimens. The tests were performed
according to ASTM D 2105, “Standard Test Method for Longitudinal Tensile
Properties of “Fiberglass” (Glass-Fiber-Reinforced Thermosetting-Resin) Pipe
and Tube” [34]. The standard covers the determination of the comparative
longitudinal tensile properties of fiberglass pipe when tested under defined
conditions of pretreatment, temperature, and testing machine speed. The test is
also suitable for resin matrix composites reinforced by continuous carbon
fibers and PPG fibers.
Under the scope of these tests, specimens, having 90°, ±65°, and ±45° winding
angles were tested. Strain gages were assembled on each specimen in
longitudinal direction, to obtain strain data. The properties of interest include
mainly, the ultimate tensile strength, ultimate tensile strain, and the tensile
modulus of elasticity of each specimen. The results of these tests were then
evaluated with the results of the coupon tests to investigate the general
behavior of the specimens.
2.6.2.2 Test Specimen Geometry
Test specimens were sections of 500 mm length continuous fiber reinforced
pipe or tubing, having an inner radius of 60 mm, an average outer radius of 64
mm with a gage length of 450 mm between the grips. The specimens were
produced free of machining marks, and each were uniform in cross-section.
Geometry of tensile test specimens is presented in Figure 2.7.
34
Figure 2.7 Drawing of tensile test specimen
2.6.2.3 Test Equipments
For the tensile test, the design and production of a test fixture was performed.
The test fixture involves various components, as shown in Figure 2.8. Design
of the fixture is performed so that no crushing load was applied to the pipe and
a pure tensile loading is obtained. A photograph of tube tensile test, test set up
is presented in Figure 2.9.
To make the strain measurement, a strain gage was assembled on each of the
test specimens. Strain gages were assembled on the middle section of the
specimens, parallel to the pipe axis to measure the longitudinal tensile strain.
The apparatus, used in tensile tests were as follows:
• Universal Testing Instrument, INSTRON 4206
• Tensile test, test fixture
• Load indicator; with an accuracy of ±1 % of reading to 1/50 of load
cell capacity.
• Data acquisition system
• Digital calipers
• TML strain gages, type YFLA - 5

35
Figure 2.8 Schematic of tensile test fixture.
Figure 2.9 Tube tensile test and test setup.

36
2.6.2.4 Test Procedure
The procedure followed during the tests were as follows:
• A strain gage was assembled on the middle section of each of the
specimens, along the pipe axis. Care was taken not to cause a
measurement error due to gage misalignment.
• Inner and outer diameters of the specimens were measured from two
perpendicular sections of the specimens, by using digital calipers.
The cross-sectional area of each tube was then determined by using
the average of these measurements.
• The specimens were mounted on the tube tensile test fixture by
taking care to align the tube axis parallel to the symmetry axis of
upper and lower parts of the fixture.
• Speed of testing (velocity of separation of the two members of the
testing machine) was set to a constant speed and the test was started.
• Load and strain data were taken until the failure of the specimen.
2.6.2.5 Calculations
The cross-sectional area of the specimens were calculated with the following
equation:
)dd(4
A 2in
2outt −
π= (2.8)
where:

37
At : Average cross-sectional area of tube, mm2.
dout : Average outer radius of the specimen, mm.
din : Average inner radius of the specimen, mm.
The axial tensile strength of the specimens were then calculated by using the
following equation:
t
maxltu A
P=σ (2.9)
where:
σltu : Ultimate longitudinal tensile strength, MPa.
Pmax : Maximum load prior to failure, N.
Percent elongation of the specimens can be calculated with the following
equation:
100.ll
0
fult
∆=ε (2.10)
where:
eult : Strain to failure, (%).
∆lf : Extension at the moment of rupture, mm.
l0 : Original gage length, mm.
Obtained strain and calculated stress data were then used to plot stress – strain
graphs of the specimens. These graphs were used so as to obtain the
longitudinal tensile modulus of elasticity of the specimens. For this purpose,
slope of the linear portion of the graphs were determined, by fitting a straight

38
line to the linear portion of the graphs, with the least square method.
Therefore,
El = dσ / dε (2.11)
where:
El : Longitudinal tensile modulus of elasticity, GPa.
dσ / dε : Slope of the linear portion of the stress – train curve.

39
CHAPTER 3
MODELING OF SPLIT-DISK TESTS BY FINITE ELEMENT
METHOD
3.1 Introduction
This chapter involves the basic theory of simulation of split-disk testing of the
selected composite specimens by using the finite element method. “ANSYS
Workbench 7.1” finite element program was used for this purpose. Results
were obtained for both carbon fiber reinforced and glass fiber reinforced
specimens, and having winding angles of 25o, 45o, and 65o. Therefore, a
comprehensive discussion of the experimental results with the analysis was
performed.
In the next section, basic theoretical aspects of this study will be presented.
This will be followed by the specifications of the problem, including the
geometrical aspects, element selection, mesh attributes, material data used in
the analysis and the boundary conditions, in Section 3.3.
3.2 Theoretical Aspects
3.2.1 Finite Element Method
The finite element method (FEM) is a numerical procedure that can be applied
to obtain solutions to a variety of problems in engineering, including steady,
transient, linear, or non- linear problems in stress analys is, heat transfer, fluid
flow etc. The basic steps involved in any FEM consist of the following steps:

40
- Creating and discretizing the solution domain into finite elements.
- Assuming an approximate continuous function to represent the
solution of an element.
- Developing equations for an element.
- Constructing the global stiffness matrix.
- Applying boundary conditions, initial conditions, and loading.
- Solving a set of linear/non- linear algebraic equations
simultaneously to obtain nodal results.
- Postprocessing of the solution, to obtain other necessary data.
3.2.2 Finite Element Modeling of Laminated Composites
As stated in Chapter 1, laminated composites are usually represented by a
series of equivalent laminated homogenous plates or shells. This definition
necessitates the determination of elastic constants of the composite and the
configuration of the lamination. Therefore, different from an isotropic
material, only the material properties change when the element stiffness
matrices are formed, in finite element modeling of composites.
Laminated thin shell elements, both linear and quadratic, are usually used in
modeling of laminated composites. In addition, solid elements can also be
preferred. In this study modeling of composite structure with shell elements
was performed. Once nodal displacements have been calculated, stresses and
strains in individual layers can be recovered and resolved into an appropriate
material axes.

41
3.2.3 Finite Element Analysis of Curved, Thin Walled Structures
A structural shell is a body bounded by two curved surfaces, with the behavior
of the shell, being governed by the behavior of an appropriate reference
surface. In a shell, the membrane and the bending behavior are coupled.
Therefore, the coupled deformations in the form of stretching and curvature
change of the reference surface are required in predicting the strains existing
throughout the shell space.
When an elastic structure is loaded by some external forces or moments, its
potential energy increases. This potential energy is made up of the internal
strain energy due to deformation and the potential of the loads that act within
the structure or on its surface. By using this principle, and with the aid of
Rayleigh – Ritz Method, the element stiffness matrix (KEL) can be given by
[35]:
[ ] [ ][ ]∫=Vol
TEL voldBDBK )(... (3.1)
where, [ ]D is the elasticity or elastic stiffness matrix, defined by the equation:
[ ] εσ .D= (3.2)
and, [B] is the strain – displacement matrix, based on the element shape
functions, and defined by the equation:
[ ] uB .=ε (3.3)
The remaining terms in the above equations are:
vol : Volume of element.
ε : Strain vector

42
σ : Stress vector
u : Nodal displacement vector.
In a two dimensional model, one can write:
dAdtvold .)( = (3.4)
where t is the shell thickness and A is the shell surface area. Therefore,
Equation (3.5) takes the form:
[ ] [ ][ ][ ]dAdtBDBKA t
TEL ....∫ ∫∫= (3.5)
Accordingly, the formulation of two dimensional shell model involves the
following steps:
- Definition of coordinate systems. (Different coordinate systems
have to be used, including global, nodal, and local coordinate
systems).
- Formulation of strain – displacement matrix ([B]).
- Formulation of stress – strain matrix ([D])
- Formulation of element stiffness matrix (KEL), in correlation with
Equation 3.5.
3.3 Problem Specifications
3.3.1 Geometry
In Figure 3.1, the model geometry is presented. As seen in the figure, the
geometry of the model involves two half, disk-shape volumes and an outer
shell, superimposed on the outer surfaces of the inner volumes.

43
Figure 3.1 The geometry of the model. Due to the orthotropic nature of the composite section and the necessity of
simultaneous bidirectional loading of the inner split-disks, modeling of full
geometry was preferred in place of half/quarter symmetrical model. To specify
the material properties and layer configurations, a local cylindrical coordinate
system was defined.
3.3.2 Element Selection
Four element types were used in modeling of split-disk testing of composites.
These are SOLID185 3-D 8-node structural solid element (for modeling the
split disk test fixture), SHELL99 linear layered structural shell element (for
modeling of filament-wound composite specimen), and TARGE170, 3-D
target segment - CONTA 174, 3-D, 8-node, surface-to-surface contact
elements (for modeling of the contact surface between the composite section
and the split-disk test fixture).

44
3.3.2.1 SOLID185 3-D 8-Node Structural Solid Element
SOLID185 is an 8-node structural solid element, capable for the three-
dimensional modeling of solid structures. The element has three degrees of
freedom at each node: translations in the nodal x, y, and z directions. The
element has plasticity, hyperelasticity, stress stiffening, creep, large deflection,
and large strain capabilities. It also has mixed formulation capability for
simulating deformations of nearly incompressible elastoplastic materials, and
fully incompressible hyperelastic materials.
A schematic view of the element, including its geometry, node locations, and
the coordinate system is presented in Figure 3.2. Element is defined by eight
nodes and the orthotropic material properties. In this study, these elements’s,
element coordinate systems was defined in global directions, since the split-
disk test fixture material properties are isotropic.
Figure 3.2 Description of SOLID185 structural shell element. [36]

45
3.3.2.2 SHELL99 Linear Layered Structural Shell Element
SHELL99 is an eight-node structural shell element, capable for layered
applications of a structural shell model. The element has six degrees of
freedom at each node: translations in the nodal x, y, and z directions and
rotations about the nodal x, y, and z-axes. Up to 250 layers can be specified
with the usage of this element.
A schematic view of the element, including its geometry, node location and
element coordinate system is presented in Figure 3.3. The element is defined
by eight nodes, average or corner layer thicknesses, layer material direction
angles, and orthotropic material properties.
Figure 3.3 Description of SHELL99 structural shell element. [36]

46
3.3.2.3 TARGE170, 3-D Target Segment - CONTA 174, 3-D, Surface-to-
Surface Contact Elements
CONTA 174 is an eight node, surface to surface contact element, which is
used to represent contact and sliding between 3-D "target" surfaces and a
deformable surface. The element is applicable to three-dimensional structural
and coupled thermal-structural contact analysis.
This element can be located on the surfaces of 3-D solids or shell elements
with midside nodes. (In this study, it was located on the outer surfaces of the
split-disk test fixture). It has the same geometric characteristics as the solid or
shell element face with which it is connected. Contact occurs when the
element surface penetrates one of the target segment elements (for our case,
TARGE170) on a specified target surface. Coulomb and shear stress friction
can be allowed.
The geometry and node locations of CONTA174 surface-to-surface contact
element is presented in Figure 3.4. The element is defined by eight nodes. It
can degenerate to a six node element depending on the shape of the underlying
solid or shell elements.
Figure 3.4 Description of CONTA174 3-D surface-to-surface contact
element.

47
In this study, TARGE170, 3-D target segment elements was used to represent
the target surfaces for the associated contact elements. These elements are
paired with its associated contact surface via a shared real constant set. Any
translational or rotational displacement, forces and moments can be imposed
on these elements. For rigid target surfaces, these elements can easily model
complex target shapes. For flexible targets, these elements will overlay the
solid elements describing the boundary of the deformable target body. In this
study, these elements were located on the inner surface of the composite ring
specimen.
3.3.3 Mesh Attributes
The mesh pattern of the model is presented in Figure 3.5. The composite
section was modeled with quadirilateral elements. The mesh pattern of the
split-disk section involves only brick type elements, with quadrilateral
surfaces.
Figure 3.5 Mesh pattern of the split disk section of the model.

48
3.3.4 Constants and Material Properties
As it is stated in the beginning of this chapter, results were obtained for both
carbon fiber reinforced and glass fiber reinforced specimen, having winding
angles of 25o, 45o, and 65o. Some part of the necessary data, required to
perform the analysis (layer thicknesses, layer configurations, and in-plane
stiffness values in primary material coordinates; E1, E2) were obtained from
real specimens, tested under the scope of the thesis. These specimens’
identification numbers and the related data are summarized in Tables 3.1 and
3.2.
Table 3.1 Layer configurations, layer thicknesses and in-plane stiffness
(E1, E2) of the specimens, used in the analysis.
Specimen
Name Layer Configuration
Thickness
(mm)
E1
(GPa)
E2
(GPa)
3221 (±25)3 0.350
3231 (±45)2 0.213
3241 (±65)4 0.200
148.76 8.57
Table 3.2 Layer configurations, layer thicknesses and in-plane stiffness
(E1, E2) of the specimens, used in the analysis.
Specimen
Name Layer Configuration
Thickness
(mm)
E1
(GPa)
E2
(GPa)
1221 (±25)2 0.480
1231 (±45)2 0.385
1241 (±65)2 0.375
70.02
10.78

49
The configurations of layers in the above tables are presented in usual
abbreviation, to designate stacking sequence of layers, for multilayered
composites. The rest of the necessary data (remaining in – plane elastic
properties, and through-thickness elastic constants) for modeling of composite
ring section were obtained from [30].
For calculations, referring to inner, steel, split-disk section of the model,
isotropic material constants were taken as follows [31]:
E = 207 GPa
υ (Poisson’s Ratio) = 0.3
3.3.5 Boundary Conditions
As stated in Section 3.3.1, modeling of full geometry was preferred in place of
half/quarter symmetrical model. Therefore no symmetry boundary conditions
was used upon modeling of split-disk tests.
Figure 3.6 The area/line on which the boundary conditions are defined.
Af
lm

50
The nodes on one face of the inner split-disk section (Af) was constrained in
two transverse directions, perpendicular to the direction of loading (x and z
directions), to prevent the motion of the entire model due to the effect of
normal-shear coupling (Figure 3.6). In addition, nodes on the line (lm), located
in the middle of the gage section were fixed to prevent the symmetry of the
model upon loading.

51
CHAPTER 4
RESULTS AND DISCUSSIONS
4.1 Introduction
This chapter involves the results and discussion of experimental and
simulation studies performed under the scope of the thesis. In the next section,
tabulated results of experimental work will be presented. Comprehensive
discussions of these results will be given in the following section. In Section
4.4, the results of the simulation study will be given and evaluated with the
results of the experimental work.
4.2 Experimental Results
4.2.1 Split-disk Test Results
In correlation with ASTM D 2290, load and strain data were taken until the
failure of the specimens. In addition, failure types and their locations on the
specimens were also recorded. These data were used so as to calculate the
hoop tensile strength of the specimens, and at the same time, converted into
stress – strain graphs, as stated in Section 2.4.1.5. These graphs were then used
in determination of hoop tensile modulus of elasticity of the specimens. For
this purpose, the slope of the linear portion of these curves was determined by
fitting a straight line, with the least-square method. These graphs were plotted
in Microsoft Excel Program. By using the equations stated in Section 2.4.1.5,
arithmetic mean of the measured ultimate hoop tensile strength and hoop

52
tensile modulus, standard deviation, and percent coefficient of variation were
calculated for each testing groups.
In Tables 4.1 through 4.12, the tabulated strength results of split-disk test
specimens are presented. In the first column of the tables, the specimen
designation numbers are tabulated. Second and third columns involve the
maximum load, and the calculated apparent composite hoop tensile strength of
each specimen. In the next three columns, the mean average tensile strength of
each testing group (including five specimens for a single group), their standard
deviation, and their percent sample coefficient of variation are tabulated
respectively.

53
Table 4.1 Hoop tensile strength results of split-disk tests and the related
statistical results for specimens 1111-1 through 1132-5.
Pmax s htu s htu
(average) Standard CV Specimen Designation (N) (Mpa) (MPa) Deviation (%)
1111-1 260.4 8.9 11.56 2.52 21.81 1111-2 252.7 8.9 1111-3 402.5 14.5 1111-4 364.3 12.7 1111-5 375.2 12.8
1121-1 2017 37.8 36.54 1.55 4.25 1121-2 2013 37.5 1121-3 2131 36.8 1121-4 1997 33.9 1121-5 2044 36.6
1131-1 7671 169.2 152.02 11.69 7.69 1131-2 7332 148.4 1131-3 7146 158.1 1131-4 6258 144.3 1131-5 6937 140.1
1141-1 25470 566.3 584.30 36.47 6.24 1141-2 24820 556.6 1141-3 27330 634.2 1141-4 25840 611.6 1141-5 24150 552.8
1151-1 35010 805.8 788.82 24.17 3.06 1151-2 35140 768.2 1151-3 35180 780.2 1151-4 37070 822.1 1151-5 35120 767.8
1112-1 254.7 8.8 11.46 2.42 21.15 1112-2 252.7 8.9 1112-3 388.2 13.9 1112-4 364.3 12.7 1112-5 381.2 13
1122-1 2399 45.5 41.62 3.07 7.39 1122-2 2317 44.3 1122-3 2119 39.1 1122-4 2241 40.4 1122-5 2103 38.9
1132-1 7802 169.5 159.26 14.60 9.17 1132-2 7707 178.9 1132-3 6704 155.6 1132-4 6827 147.7 1132-5 6669 144.6

54
Table 4.2 Hoop tensile strength results of split-disk tests and the related
statistical results for specimens 1142-1 through 1222-5.
Pmax s htu s htu
(average) Standard CV Specimen Designation (N) (MPa) (MPa) Deviation (%)
1142-1 25490 563.0 588.54 50.61 8.60 1142-2 26530 638.6 1142-3 26010 601.7 1142-4 22610 514.0 1142-5 25730 625.4
1152-1 37170 863.6 835.60 30.82 3.69 1152-2 34450 794.4 1152-3 37830 864.2 1152-4 36520 841.7 1152-5 36920 814.1
1211-1 1689 39.1 37.96 1.97 5.19 1211-2 1685 34.8 1211-3 1890 39.6 1211-4 1756 39.0 1211-5 1634 37.4
1221-1 2017 37.8 36.54 1.55 4.25 1221-2 2013 37.5 1221-3 2131 36.8 1221-4 1997 33.9 1221-5 2044 36.6
1231-1 5446 124.4 150.74 15.30 10.15 1231-2 7415 158.8 1231-3 7446 157.2 1231-4 7087 162.4 1231-5 7068 150.9
1241-1 25530 566.0 582.36 34.54 5.93 1241-2 26580 591.2 1241-3 25750 608.6 1241-4 27470 615.2 1241-5 22970 530.8
1251-1 37520 813.0 809.36 55.04 6.80 1251-2 38180 826.5 1251-3 34990 738.7 1251-4 40010 887.1 1251-5 36410 781.5
1212-1 98.59 3.5 4.03 0.61 15.01 1212-2 145.9 4.9 1212-3 95.25 3.5 1212-4 121.2 4.4 1212-5 102.7 3.9
1222-1 1831 38.7 36.95 1.20 3.24 1222-2 1791 35.3 1222-3 1756 37.3 1222-4 1922 36.9 1222-5 1890 36.7

55
Table 4.3 Hoop tensile strength results of split-disk tests and the related
statistical results for specimens 1232-1 through 2112-5.
Pmax σhtu σhtu
(average) Standard CV Specimen Designation (N) (MPa) (MPa) Deviation (%)
1232-1 7471 155.9 156.88 8.06 5.14 1232-2 7277 157.6 1232-3 7529 164.5 1232-4 6791 143.9 1232-5 7652 162.5 1242-1 25980 581.3 618.42 31.97 5.17 1242-2 26860 616.5 1242-3 29340 669.4 1242-4 26840 608.2 1242-5 26740 616.7 1252-1 37170 863.6 835.60 30.82 3.69 1252-2 34450 794.4 1252-3 37830 864.2 1252-4 36520 841.7 1252-5 36920 814.1 2111-1 276 10.8 9.65 0.88 9.15 2111-2 193 10.2 2111-3 185 8.8 2111-4 233 9.6 2111-5 185 8.8
2121-1 1673 29.2 28.44 1.25 4.41 2121-2 1555 27.6 2121-3 1669 30.1 2121-4 1559 26.9 2121-5 1622 28.4 2131-1 7229 136.9 146.94 9.68 6.59 2131-2 7853 160.5 2131-3 7734 144.4 2131-4 7829 152.9 2131-5 6945 140.0 2141-1 20940 443.0 482.10 37.96 7.87 2141-2 21100 454.1 2141-3 25000 522.4 2141-4 22400 468.4 2141-5 24870 522.6 2151-1 35610 788.5 742.84 38.11 5.13 2151-2 33450 701.3 2151-3 35530 776.3 2151-4 33620 714.7 2151-5 34110 733.4 2112-1 276 10.8 9.65 0.88 9.15 2112-2 193 10.2 2112-3 185 8.8 2112-4 233 9.6 2112-5 185 8.8
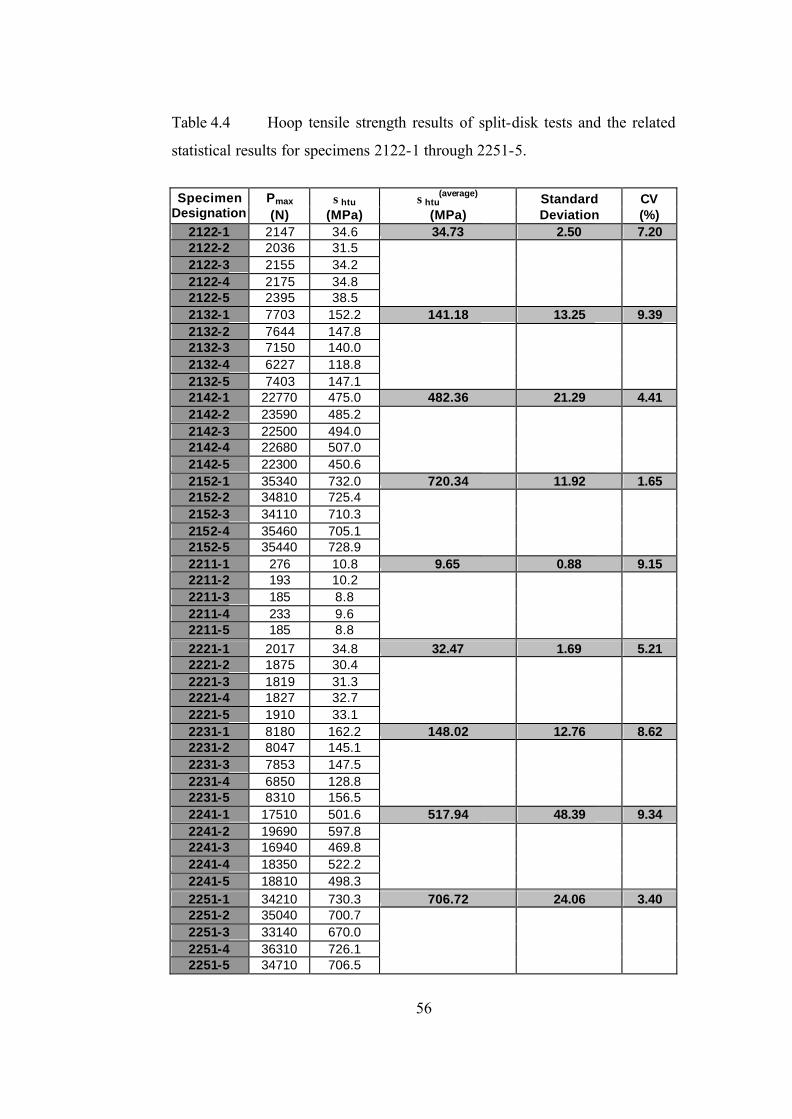
56
Table 4.4 Hoop tensile strength results of split-disk tests and the related
statistical results for specimens 2122-1 through 2251-5.
Pmax σhtu σhtu
(average) Standard CV Specimen Designation (N) (MPa) (MPa) Deviation (%)
2122-1 2147 34.6 34.73 2.50 7.20 2122-2 2036 31.5 2122-3 2155 34.2 2122-4 2175 34.8 2122-5 2395 38.5
2132-1 7703 152.2 141.18 13.25 9.39 2132-2 7644 147.8 2132-3 7150 140.0 2132-4 6227 118.8 2132-5 7403 147.1
2142-1 22770 475.0 482.36 21.29 4.41 2142-2 23590 485.2 2142-3 22500 494.0 2142-4 22680 507.0 2142-5 22300 450.6
2152-1 35340 732.0 720.34 11.92 1.65 2152-2 34810 725.4 2152-3 34110 710.3 2152-4 35460 705.1 2152-5 35440 728.9
2211-1 276 10.8 9.65 0.88 9.15 2211-2 193 10.2 2211-3 185 8.8 2211-4 233 9.6 2211-5 185 8.8
2221-1 2017 34.8 32.47 1.69 5.21 2221-2 1875 30.4 2221-3 1819 31.3 2221-4 1827 32.7 2221-5 1910 33.1
2231-1 8180 162.2 148.02 12.76 8.62 2231-2 8047 145.1 2231-3 7853 147.5 2231-4 6850 128.8 2231-5 8310 156.5
2241-1 17510 501.6 517.94 48.39 9.34 2241-2 19690 597.8 2241-3 16940 469.8 2241-4 18350 522.2 2241-5 18810 498.3
2251-1 34210 730.3 706.72 24.06 3.40 2251-2 35040 700.7 2251-3 33140 670.0 2251-4 36310 726.1 2251-5 34710 706.5

57
Table 4.5 Hoop tensile strength results of split-disk tests and the related
statistical results for specimens 2212-1 through 3141-5.
Pmax σhtu σhtu
(average) Standard CV Specimen Designation (N) (MPa) (MPa) Deviation (%)
2212-1 276 10.8 9.65 0.88 9.15 2212-2 193 10.2 2212-3 185 8.8 2212-4 233 9.6 2212-5 185 8.8
2222-1 2179 35.8 33.66 1.24 3.68 2222-2 1981 33.2 2222-3 2009 33.4 2222-4 2009 32.9 2222-5 1993 32.9 2232-1 8544 174.7 155.48 13.41 8.62 2232-2 7411 143.2 2232-3 8125 147.3 2232-4 8752 164.2 2232-5 7715 148.0 2242-1 23290 484.4 481.60 36.16 7.51 2242-2 22420 496.8 2242-3 20710 430.0 2242-4 22850 528.1 2242-5 22520 468.7 2252-1 32830 699.6 701.94 6.56 0.93 2252-2 34910 693.6 2252-3 34130 710.3 2252-4 34550 699.6 2252-5 34770 706.6 3111-1 205.1 6.5 4.61 0.55 11.94 3111-2 272.2 7.8 3111-3 39.4 1.3 3111-4 31.56 0.9 3111-5 205.6 6.5 3121-1 2005 39.7 39.46 2.30 5.83 3121-2 2159 43.1 3121-3 1922 39.4 3121-4 1965 38.0 3121-5 1910 37.1 3131-1 6231 165.3 156.80 8.28 5.28 3131-2 6429 163.9 3131-3 6437 158.2 3131-4 5860 149.9 3131-5 5615 146.7 3141-1 32690 717.2 667.92 44.22 6.62 3141-2 29750 681.1 3141-3 29340 607.7 3141-4 30140 638.6 3141-5 30980 695.0

58
Table 4.6 Hoop tensile strength results of split-disk tests and the related
statistical results for specimens 3151-1 through 3221-5.
Pmax σhtu σhtu
(average) Standard CV Specimen Designation (N) (MPa) (MPa) Deviation (%)
3151-1 42330 1224.0 1187.40 89.21 7.51 3151-2 39190 1080.0 3151-3 39090 1109.0 3151-4 44550 1291.0 3151-5 42110 1233.0
3112-1 205.1 6.5 4.61 0.58 12.59 3112-2 272.2 7.8 3112-3 39.4 1.3 3112-4 31.56 0.9
3112-5 205.6 6.5
3122-1 1855 41.0 39.91 2.46 6.16 3122-2 1842 37.6 3122-3 1756 37.6 3122-4 1953 43.4 3122-5 1871 40.1
3132-1 6930 160.9 172.48 8.16 4.73 3132-2 7155 173.8 3132-3 6764 173.4 3132-4 6850 170.6 3132-5 6886 183.7
3142-1 30570 733.5 691.84 44.24 6.39 3142-2 30030 694.4 3142-3 34350 734.8 3142-4 28970 663.1
3142-5 29340 633.4
3152-1 48130 1372.0 1201.20 103.72 8.63 3152-2 42310 1212.0 3152-3 39290 1105.0 3152-4 39880 1138.0 3152-5 40940 1179.0
3211-1 205.1 6.5 4.61 0.74 16.07 3211-2 272.2 7.8 3211-3 39.4 1.3 3211-4 31.56 0.9
3211-5 205.6 6.5
3221-1 1634 34.1 34.79 2.78 8.00 3221-2 1914 37.4 3221-3 1748 37.8 3221-4 1591 33.4 3221-5 1507 31.2

59
Table 4.7 Hoop tensile strength results of split-disk tests and the related
statistical results for specimens 3231-1 through 3252-5.
Pmax σhtu σhtu
(average) Standard CV Specimen Designation (N) (MPa) (MPa) Deviation (%)
3231-1 6295 151.7 153.26 4.80 3.13 3231-2 6587 157.1 3231-3 6104 145.9 3231-4 6247 153.8 3231-5 6283 157.8
3241-1 32650 638.8 627.46 22.32 3.56 3241-2 31510 654.8 3241-3 32160 620.9 3241-4 30220 594.7 3241-5 31210 628.1
3251-1 40670 1128.0 1157.60 30.13 2.60 3251-2 42440 1167.0 3251-3 40790 1157.0 3251-4 42700 1203.0
3251-5 41060 1133.0
3212-1 205.1 6.5 4.61 0.65 14.11 3212-2 272.2 7.8 3212-3 39.4 1.3 3212-4 31.56 0.9
3212-5 205.6 6.5
3222-1 2115 41.4 41.68 1.97 4.73 3222-2 2029 43.6 3222-3 1926 42.2 3222-4 1879 38.5
3222-5 1910 42.8
3232-1 6815 155.9 150.10 13.12 8.74 3232-2 6192 148.0 3232-3 6756 167.9 3232-4 5454 132.2 3232-5 6665 146.5
3242-1 29690 598.7 623.36 56.64 9.09 3242-2 32180 659.0 3242-3 32810 694.6 3242-4 27210 546.9 3242-5 28990 617.6
3252-1 44900 1289.0 1185.20 92.93 7.84 3252-2 40650 1104.0 3252-3 42560 1266.0 3252-4 40870 1185.0
3252-5 38360 1082.0

60
Table 4.8 Hoop tensile strength results of split-disk tests and the related
statistical results for specimens 4111-1 through 4132-5.
Pmax σhtu σhtu
(average) Standard CV Specimen Designation (N) (MPa) (MPa) Deviation (%)
4111-1 165.7 5.5 5.86 0.52 8.88 4111-2 43.32 1.5 4111-3 248.5 8.9 4111-4 59.19 2.1 4111-5 319.6 11.2
4121-1 2190 50.6 50.36 1.40 2.78 4121-2 2182 51.3 4121-3 2005 48.1 4121-4 2159 50.1 4121-5 2147 51.7
4131-1 7825 193.0 200.96 4.79 2.38 4131-2 7928 201.0 4131-3 8263 202.3 4131-4 8236 205.8
4131-5 8310 202.7
4141-1 21950 487.3 496.34 30.39 6.12 4141-2 20650 466.0 4141-3 23800 501.5 4141-4 23540 545.7 4141-5 22170 481.2
4151-1 30330 747.5 778.70 24.51 3.15 4151-2 30700 797.2 4151-3 30290 765.3 4151-4 30900 774.9 4151-5 31450 808.6 4112-1 165.7 5.5 5.86 0.87 14.85 4112-2 43.32 1.5 4112-3 248.5 8.9 4112-4 59.19 2.1
4112-5 319.6 11.2
4122-1 2280 52.7 50.82 2.50 4.91 4122-2 2198 51.9 4122-3 2099 47.0 4122-4 2269 52.8 4122-5 2222 49.6
4132-1 7703 196.3 205.18 6.23 3.04 4132-2 8279 203.1 4132-3 8236 204.9 4132-4 8417 208.7 4132-5 8437 212.9

61
Table 4.9 Hoop tensile strength results of split-disk tests and the related
statistical results for specimens 4142-1 through 4212-5.
Pmax σhtu σhtu
(average) Standard CV Specimen Designation (N) (MPa) (MPa) Deviation (%)
4142-1 16560 452.7 554.08 83.57 15.08 4142-2 16530 483.5 4142-3 21120 651.6 4142-4 19680 605.4 4142-5 19930 577.2
4152-1 31890 880.1 895.22 32.20 3.60 4152-2 32030 846.7 4152-3 33140 927.8 4152-4 33430 914 4152-5 33530 907.5 4211-1 165.7 5.5 5.86 0.92 15.70 4211-2 43.32 1.5 4211-3 248.5 8.9 4211-4 59.19 2.1
4211-5 319.6 11.2
4221-1 1827 41.89 42.99 1.64 3.81 4221-2 1705 41.31 4221-3 1851 43.25 4221-4 1847 42.92 4221-5 1930 45.56
4231-1 7668 201.3 198.14 5.13 2.59 4231-2 7802 193.3 4231-3 7691 196.2 4231-4 7502 194.4 4231-5 8094 205.5
4241-1 20060 601.5 594.05 24.60 4.14 4241-2 19330 552.5 4241-3 20170 613.3 4241-4 20280 610.3
4241-5 20410 592.7
4251-1 33700 890.6 862.92 55.99 6.49 4251-2 32670 894.1 4251-3 30570 768.1 4251-4 33760 905.0 4251-5 32320 856.8
4212-1 165.7 5.5 5.86 4.22 72.03 4212-2 43.32 1.5 4212-3 248.5 8.9 4212-4 59.19 2.1 4212-5 319.6 11.2

62
Table 4.10 Hoop tensile strength results of split-disk tests and the related
statistical results for specimens 4222-1 through 5141-5.
Pmax σhtu σhtu
(average) Standard CV Specimen Designation (N) (MPa) (MPa) Deviation (%)
4222-1 1930 45.0 42.49 2.73 6.43 4222-2 1875 44.1 4222-3 1772 40.5 4222-4 1752 38.7 4222-5 1902 44.1
4232-1 18550 502.4 565.24 51.19 9.06 4232-2 18100 522.5 4232-3 21170 575.3 4232-4 21020 608.4 4232-5 21120 617.6
4242-1 20060 601.5 594.05 24.60 4.14 4242-2 19330 552.5 4242-3 20170 613.3 4242-4 20280 610.3
4242-5 20410 592.7
4252-1 33100 942.2 880.12 45.23 5.14 4252-2 29890 814.4 4252-3 31810 879.2 4252-4 32340 882.3 4252-5 33310 882.5
5111-1 67.03 1.5 1.46 0.14 9.62 5111-2 42.65 1.1 5111-3 63.21 1.5 5111-4 41.17 1.1 5111-5 94.67 2.1
5121-1 1867 38.7 38.75 0.41 1.06 5121-2 1871 39.3 5121-3 1760 38.3 5121-4 1772 39.1
5121-5 1737 38.4
5131-1 5228 132.0 142.94 13.89 9.71 5131-2 5608 156.2 5131-3 6101 159.3 5131-4 5505 137.7 5131-5 5477 129.5
5141-1 40870 734.4 656.30 61.11 9.31 5141-2 31530 571.6 5141-3 39860 691.0 5141-4 36640 636.5 5141-5 36600 648.0

63
Table 4.11 Hoop tensile strength results of split-disk tests and the related
statistical results for specimens 5151-1 through 5221-5.
Pmax σhtu σhtu
(average) Standard CV Specimen Designation (N) (MPa) (MPa) Deviation (%)
5151-1 49940 1053.0 1009.62 41.10 4.07 5151-2 45780 946.1 5151-3 49260 1038.0 5151-4 46820 1006.0 5151-5 46050 1005.0
5112-1 580.1 16.4 10.36 1.54 14.86 5112-2 370.9 9.4 5112-3 430.1 10.3 5112-4 370.9 9.5 5112-5 240.7 6.2
5122-1 1748 34.6 40.57 3.49 8.61 5122-2 1918 43.5 5122-3 1788 41.2 5122-4 1883 41.1
5122-5 1851 42.5
5132-1 5430 142.9 145.04 6.92 4.77 5132-2 5481 152.9 5132-3 5055 134.5 5132-4 5074 146.4 5132-5 5465 148.5
5142-1 34390 577.6 616.08 34.11 5.54 5142-2 36150 607.6 5142-3 35100 594.9 5142-4 38220 663.0 5142-5 37390 637.3
5152-1 48380 1010.0 1014.20 19.37 1.91 5152-2 49880 1029.0 5152-3 49320 1039.0 5152-4 48440 999.9
5152-5 47950 993.1
5211-1 67.03 1.5 1.85 0.33 17.69 5211-2 87.87 2.1 5211-3 90.75 2.1 5211-4 90.45 2.1 5211-5 69.27 1.5
5221-1 193.4 6.4 6.76 0.65 9.59 5221-2 197.3 7.1 5221-3 196.2 7.1 5221-4 178.45 5.8 5221-5 203.25 7.4
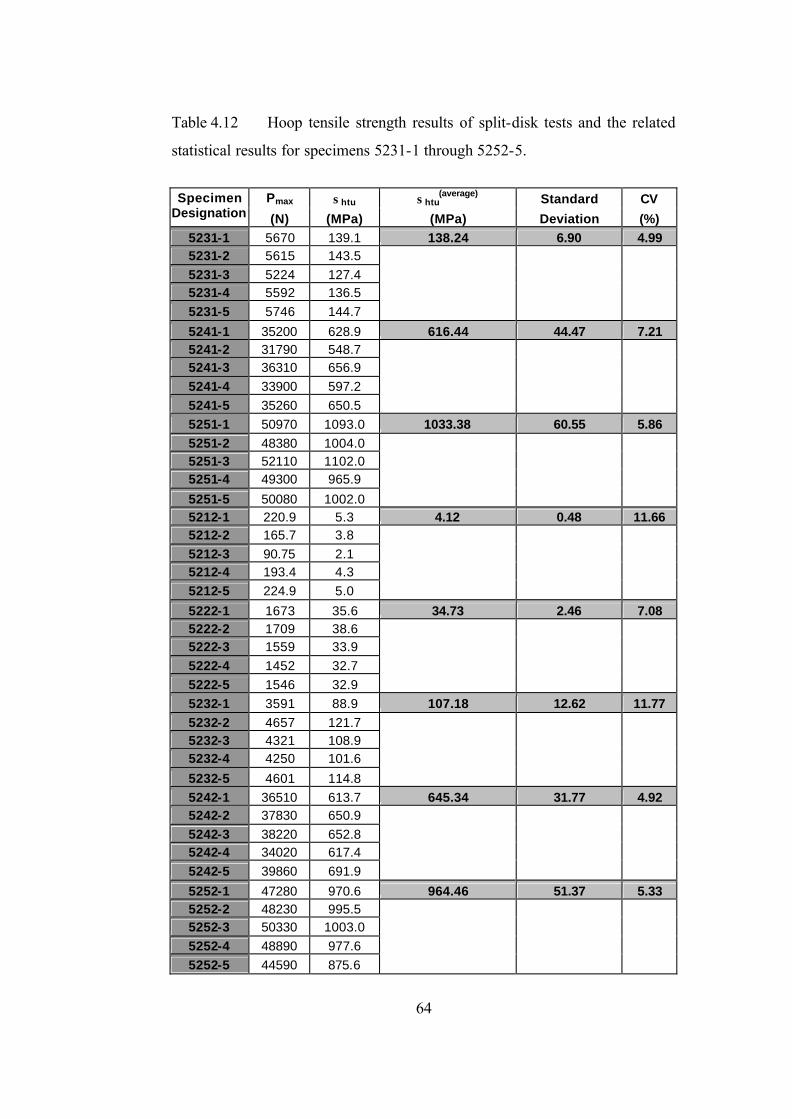
64
Table 4.12 Hoop tensile strength results of split-disk tests and the related
statistical results for specimens 5231-1 through 5252-5.
Pmax σhtu σhtu
(average) Standard CV Specimen Designation (N) (MPa) (MPa) Deviation (%)
5231-1 5670 139.1 138.24 6.90 4.99 5231-2 5615 143.5 5231-3 5224 127.4 5231-4 5592 136.5 5231-5 5746 144.7
5241-1 35200 628.9 616.44 44.47 7.21 5241-2 31790 548.7 5241-3 36310 656.9 5241-4 33900 597.2 5241-5 35260 650.5
5251-1 50970 1093.0 1033.38 60.55 5.86 5251-2 48380 1004.0 5251-3 52110 1102.0 5251-4 49300 965.9
5251-5 50080 1002.0 5212-1 220.9 5.3 4.12 0.48 11.66 5212-2 165.7 3.8 5212-3 90.75 2.1 5212-4 193.4 4.3 5212-5 224.9 5.0
5222-1 1673 35.6 34.73 2.46 7.08 5222-2 1709 38.6 5222-3 1559 33.9 5222-4 1452 32.7 5222-5 1546 32.9
5232-1 3591 88.9 107.18 12.62 11.77 5232-2 4657 121.7 5232-3 4321 108.9 5232-4 4250 101.6
5232-5 4601 114.8
5242-1 36510 613.7 645.34 31.77 4.92 5242-2 37830 650.9 5242-3 38220 652.8 5242-4 34020 617.4 5242-5 39860 691.9
5252-1 47280 970.6 964.46 51.37 5.33 5252-2 48230 995.5 5252-3 50330 1003.0 5252-4 48890 977.6 5252-5 44590 875.6

65
In Figures 4.1 and 4.3, stress-strain curves of two split-disk test specimens
(1251 – 1, 1251 – 2) are presented as an illustration. As seen in the figures, the
stress-strain graphs of the split-disk test specimens involve an initial decrease
in strain, followed by a linear increase in both stress and strain. This unusual
behavior (sharp decrease in strain) was observed in split-disk tests due to the
effect of a bending moment, imposed during test at the split, between the split-
disk test fixtures. This moment was induced by the change in contour of the
rings between the two disk sections as they separate [33]. Due to this reason,
an effective hoop tensile modulus of elasticity was obtained for each
specimen, by fitting a line to the linear region of the stress-strain graphs. This
is illustrated in Figures 4.2 and 4.4, which involve the least-square fitted lines
and their equations for the specimens 1251–1, and 1251–2, respectively.
0
100
200
300
400
500
600
700
0,000 0,002 0,004 0,006 0,008 0,010
Strain (mm/mm)
Str
ess
(MP
a)
Figure 4.1 Stress – strain curve of 1251-1 split-disk test specimen.

66
y = 69230x + 63,748R2 = 0,9997
120
170
220
270
320
370
420
0,001 0,002 0,003 0,004 0,005
Strain (mm/mm)
Str
ess
(MP
a)
Figure 4.2 Least-square fitted stress-strain curve of 1251-1 ring test
specimen.
080
160240320400480560640720800
0,000 0,002 0,004 0,006 0,008
Strain (mm/mm)
Str
ess
(MP
a)
Figure 4.3 Stress –Strain curve of 1251-2 ring test specimen.

67
y = 74799x + 160,81R2 = 0,9968
200
300
400
500
600
700
0,001 0,002 0,003 0,004 0,005 0,006 0,007
Strain (mm/mm)
Str
ess
(MP
a)
Figure 4.4 Least-square fitted stress-strain curve of 1251-2 ring test
specimen.
As illustrated in Figures 4.1 - 4.4, hoop tensile modulus of elasticity was
determined for each of the split-disk test specimens. These results are
tabulated in Tables 4.13 through 4.17. Similar to the strength results, the first
column involves the specimen designation numbers. In the second column, the
obtained hoop tensile modulus of elasticity of each specimen is presented. The
next three columns, involves the statistical data (mean average hoop tensile
modulus of elasticity, their standard deviation, and their percent sample
coefficient of variation).

68
Table 4.13 Hoop tensile modulus of elasticity results of split-disk tests and
related statistical results for specimens 1111-1 through 1252-2.
Specimen Eh Eh(average) Standard CV
Designation (GPa) (GPa) Deviation (%) 1111-1 11.88 12.090 0.297 2.456 1111-2 12.3 1121-1 13.81 13.585 0.318 2.342 1121-2 13.36 1131-1 21.55 21.030 0.735 3.497 1131-2 20.51 1141-1 45.02 47.380 3.338 7.044 1141-2 49.74 1151-1 56.87 56.560 0.438 0.775 1151-2 56.25 1112-1 11.21 11.730 0.735 6.269 1112-2 12.25 1122-1 14.49 14.440 0.071 0.490 1122-2 14.39 1132-1 29.09 29.975 1.252 4.175 1132-2 30.86 1142-1 54.77 55.215 0.629 1.140 1142-2 55.66 1152-1 63.53 70.680 10.112 14.306 1152-2 77.83 1211-1 11.56 10.780 1.103 10.233 1211-2 10 1221-1 10.53 12.125 2.256 18.603 1221-2 13.72 1231-1 19.48 18.070 1.994 11.035 1231-2 16.66 1241-1 50.33 49.900 0.608 1.219 1241-2 49.47 1251-1 72.8 70.015 3.939 5.625 1251-2 67.23 1212-1 13.43 14.090 0.933 6.624 1212-2 14.75 1222-1 14.3 13.965 0.474 3.392 1222-2 13.63 1232-1 17.81 18.315 0.714 3.899 1232-2 18.82 1242-1 45.88 46.820 1.329 2.839 1242-2 47.76 1252-1 62.25 64.190 2.744 4.274 1252-2 66.13

69
Table 4.14 Hoop tensile modulus of elasticity results of split-disk tests and
related statistical results for specimens 2111-1 through 2252-2.
Specimen Eh Eh(average) Standard CV
Designation (GPa) (GPa) Deviation (%) 2111-1 12.11 11.675 0.615 5.269 2111-2 11.24 2121-1 12.15 12.695 0.771 6.071 2121-2 13.24 2131-1 19.05 19.425 0.530 2.730 2131-2 19.8 2141-1 45.83 45.260 0.806 1.781 2141-2 44.69 2151-1 57.92 59.560 2.319 3.894 2151-2 61.2 2112-1 11.56 11.155 0.573 5.135 2112-2 10.75 2122-1 11.74 12.625 1.252 9.913 2122-2 13.51 2132-1 16.71 17.195 0.686 3.989 2132-2 17.68 2142-1 49.2 48.805 0.559 1.145 2142-2 48.41 2152-1 62.36 62.945 0.827 1.314 2152-2 63.53 2211-1 13.86 13.215 0.912 6.903 2211-2 12.57 2221-1 13.46 12.805 0.926 7.234 2221-2 12.15 2231-1 18.89 19.365 0.672 3.469 2231-2 19.84 2241-1 49.89 49.370 0.735 1.490 2241-2 48.85 2251-1 59.47 61.850 3.366 5.442 2251-2 64.23 2212-1 11.21 11.665 0.643 5.516 2212-2 12.12 2222-1 11.58 11.260 0.453 4.019 2222-2 10.94 2232-1 16.84 17.505 0.940 5.372 2232-2 18.17 2242-1 56.43 57.605 1.662 2.885 2242-2 58.78 2252-1 65.07 66.910 2.602 3.889 2252-2 68.75

70
Table 4.15 Hoop tensile modulus of elasticity results of split-disk tests and
related statistical results for specimens 3111-1 through 3252-2.
Specimen Eh Eh(average) Standard CV
Designation (GPa) (GPa) Deviation (%) 3111-1 10.25 9.950 0.424 4.264 3111-2 9.65 3121-1 13.88 13.045 1.181 9.052 3121-2 12.21 3131-1 25.71 25.145 0.799 3.178 3131-2 24.58 3141-1 97.42 96.715 0.997 1.031 3141-2 96.01 3151-1 144.07 140.750 4.695 3.336 3151-2 137.43 3112-1 9.56 9.050 0.721 7.970 3112-2 8.54 3122-1 13.78 13.010 1.089 8.370 3122-2 12.24 3132-1 22.89 21.165 2.440 11.526 3132-2 19.44 3142-1 102.77 102.030 1.047 1.026 3142-2 101.29 3152-1 170.23 169.395 1.181 0.697 3152-2 168.56 3211-1 8.99 8.555 0.615 7.191 3211-2 8.12 3221-1 9.22 8.750 0.665 7.596 3221-2 8.28 3231-1 16.73 16.830 0.141 0.840 3231-2 16.93 3241-1 93.27 93.980 1.004 1.068 3241-2 94.69 3251-1 141.65 148.700 9.970 6.705 3251-2 155.75 3212-1 9.56 9.050 0.721 7.970 3212-2 8.54 3222-1 10.91 9.745 1.648 16.907 3222-2 8.58 3232-1 18.02 19.200 1.669 8.692 3232-2 20.38 3242-1 97.62 99.655 2.878 2.888 3242-2 101.69 3252-1 160.01 159.215 1.124 0.706 3252-2 158.42

71
Table 4.16 Hoop tensile modulus of elasticity results of split-disk tests and
related statistical results for specimens 4111-1 through 4252-2.
Specimen Eh Eh(average) Standard CV
Designation (GPa) (GPa) Deviation (%) 4111-1 13.16 12.850 0.438 3.412 4111-2 12.54 4121-1 12.89 12.845 0.064 0.495 4121-2 12.8 4131-1 18.91 17.005 2.694 15.843 4131-2 15.1 4141-1 45.88 45.990 0.156 0.338 4141-2 46.1 4151-1 60.35 59.625 1.025 1.720 4151-2 58.9 4112-1 8.99 9.275 0.403 4.346 4112-2 9.56 4122-1 11.5 10.515 1.393 13.248 4122-2 9.53 4132-1 18.9 18.615 0.403 2.165 4132-2 18.33 4142-1 52.72 52.800 0.113 0.214 4142-2 52.88 4152-1 76.91 77.420 0.721 0.932 4152-2 77.93 4211-1 12.21 12.780 0.806 6.308 4211-2 13.35 4221-1 15.7 14.445 1.775 12.287 4221-2 13.19 4231-1 21.3 21.910 0.863 3.937 4231-2 22.52 4241-1 51.51 50.120 1.966 3.922 4241-2 48.73 4251-1 60.77 60.895 0.177 0.290 4251-2 61.02 4212-1 12.24 12.795 0.785 6.134 4212-2 13.35 4222-1 14.51 14.155 0.502 3.547 4222-2 13.8 4232-1 19.78 19.820 0.057 0.285 4232-2 19.86 4242-1 51.91 51.620 0.410 0.795 4242-2 51.33 4252-1 71.44 70.095 1.902 2.714 4252-2 68.75

72
Table 4.17 Hoop tensile modulus of elasticity results of split-disk tests and
related statistical results for specimens 5111-1 through 5252-2.
Specimen Eh Eh(average) Standard CV
Designation (GPa) (GPa) Deviation (%) 5111-1 10.89 10.390 0.707 6.806 5111-2 9.89 5121-1 10.19 11.200 1.428 12.753 5121-2 12.21 5131-1 24.72 24.745 0.035 0.143 5131-2 24.77 5141-1 120.8 120.300 0.707 0.588 5141-2 119.8 5151-1 178.71 179.960 1.768 0.982 5151-2 181.21 5112-1 9.34 10.060 1.018 10.122 5112-2 10.78 5122-1 15.95 14.340 2.277 15.878 5122-2 12.73 5132-1 20.45 20.810 0.509 2.447 5132-2 21.17 5142-1 105.61 104.920 0.976 0.930 5142-2 104.23 5152-1 184.53 190.670 8.683 4.554 5152-2 196.81 5211-1 8.85 8.420 0.608 7.222 5211-2 7.99 5221-1 14.357 13.284 1.518 11.429 5221-2 12.21 5231-1 25.1 26.035 1.322 5.079 5231-2 26.97 5241-1 109.3 108.975 0.460 0.422 5241-2 108.65 5251-1 176.65 169.630 9.928 5.853 5251-2 162.61 5212-1 7.56 8.070 0.721 8.937 5212-2 8.58 5222-1 9.02 9.780 1.075 10.990 5222-2 10.54 5232-1 25.68 24.240 2.036 8.401 5232-2 22.8 5242-1 102.81 104.150 1.895 1.820 5242-2 105.49 5252-1 191.53 190.190 1.895 0.996 5252-2 188.85

73
4.2.2 Tube Tensile Test Results
Load and strain data were taken until the failure of the specimens as specified
in ASTM D 210. Type of failure of each specimen, and its location were also
recorded. These data were then used so as to calculate the longitudinal tensile
strength of the specimens, and at the same time, converted into stress – strain
graphs, as stated in Section 2.4.2.5, to determine the longitudinal tensile
modulus of elasticity of the specimens. For this purpose, the slope of the linear
portion of these curves was determined by fitting a straight line, with the least-
square method.
Tables 4.18 and 4.19 involve the tabulated results of tube tensile test
specimens. In these tables, the specimen designation number, the cross-
sectional area, the maximum load observed during the test, the elongation
recorded at the instant of observation of maximum load, and the percent
elongation data are presented in each column, respectively.
Determination of longitudinal tensile modulus of elasticity is illustrated in
Figures 4.5–4.10. In Figures 4.5, 4.7, and 4.9, obtained stress-strain curves of
1211 – 1221 – 1231 tube tensile test specimens are presented, respectively.
The least square fitted curves and their equations are plotted for these
specimens in Figures 4.6, 4.8, and 4.10.
Longitudinal tensile modulus of elasticity of the remaining specimens are
tabulated in Tables 4.20 and 4.21. The maximum stress observed during the
tests, and the strains, recorded at the instant of observation of maximum stress
are also tabulated in these tables.

74
Table 4.18 Load and elongation results of tube tensile tests for specimens
1131 through 3152.
Specimen Cross. Area Max. Load Elongation at Max. Load Elongation
Designation (mm2) (N) (mm) (%) 1131 294.76 34470.0 39.9 8.876 1141 272.72 9692.0 1.2 0.273 1151 285.85 3777.0 0.4 0.100 1132 289.80 34433.1 51.4 11.422 1142 265.11 9669.0 1.2 0.269 1152 285.85 3018.0 0.4 0.091 1231 307.64 32549.6 44.2 9.822 1241 270.04 8441.0 1.9 0.423 1251 279.92 3781.0 0.5 0.105 1232 294.76 33834.7 41.3 9.176 1242 270.04 8405.0 1.1 0.243 1252 283.27 3662.0 0.4 0.094 2131 314.59 35257.1 44.2 9.824 2141 309.63 7825.0 1.6 0.351 2151 313.60 1760.0 1.5 0.344 2132 309.25 36621.0 43.8 9.729 2142 301.69 7317.0 1.2 0.257 2152 308.64 3409.0 0.4 0.099 2231 319.56 37729.3 41.5 9.222 2241 220.92 8867.0 1.5 0.330 2251 310.62 2301.0 0.3 0.077 2232 329.51 40466.3 40.4 8.984 2242 295.75 7901.0 1.2 0.270 2252 311.61 3602.0 0.4 0.096 3131 260.19 28861.0 36.7 8.144 3141 293.76 13220.0 2.7 0.597 3151 224.83 1973.0 0.5 0.118 3132 240.52 30950.6 40.1 8.907 3142 297.73 11820.0 2.3 0.519
3152 236.60 3197.0 0.9 0.190

75
Table 4.19 Load and elongation results of tube tensile tests for specimens
3231 through 5252.
Specimen Cross. Area Max. Load Elongation at Max. Load Elongation
Designation (mm2) (N) (mm) (%) 3231 262.16 30030.0 30.2 6.716 3241 274.98 11590.0 2.5 0.562 3251 218.96 2175.0 0.7 0.159 3232 252.31 32569.2 43.4 9.633 3242 305.66 13260.0 2.7 0.610
3252 226.79 1815.0 0.5 0.122 4131 256.25 36679.6 45.1 10.024 4141 295.75 7995.0 1.2 0.263 4151 244.45 4155.0 0.5 0.119 4132 277.94 34442.9 44.8 9.949 4142 216.03 8306.0 1.4 0.303
4152 240.52 2893.0 0.4 0.079 4231 260.19 30930.9 52.2 11.609 4241 220.92 8347.0 1.2 0.263 4251 236.60 954.9 0.2 0.046 4232 220.92 30570.0 39.3 8.733 4242 226.79 6247.0 1.9 0.427
4252 224.83 966.8 1.3 0.287 5131 299.71 29640.0 17.0 3.778 5141 353.46 17940.0 3.0 0.671 5151 309.63 4404.0 0.9 0.210 5132 228.75 26967.7 16.7 3.700 5142 364.47 15740.0 2.9 0.637
5152 307.64 5662.0 1.8 0.400 5231 270.04 26220.0 18.7 4.149 5241 355.46 16180.0 2.8 0.612 5251 293.76 4190.0 1.0 0.215
5232 248.38 24550.0 17.1 3.800 5242 365.47 15570.0 2.8 0.627 5252 317.58 4029.0 0.9 0.207

76
0
10
20
30
40
50
0,0E+00 5,0E-04 1,0E-03 1,5E-03 2,0E-03 2,5E-03
Strain (mm/mm)
Str
ess
(Mp
a)
Figure 4.5 Stress–strain curve of 1131 tube tensile test specimen.
y = 20963x - 0,015R2 = 0,9992
0
5
10
15
20
25
0,0E+00 4,0E-04 8,0E-04 1,2E-03
Strain (mm/mm)
Str
ess
(Mpa
)
Figure 4.6 Least-square fitted stress-strain curve of 1131 tube tensile test
specimen.

77
0
10
20
30
40
0,0E+00 4,0E-04 8,0E-04 1,2E-03 1,6E-03 2,0E-03
Strain (mm/mm)
Str
ess
(Mpa
)
Figure 4.7 Stress – Strain curve of 1141 tube tensile test specimen.
y = 19456x + 0,2353R2 = 0,9996
0
10
20
30
40
0,0E+00 4,0E-04 8,0E-04 1,2E-03 1,6E-03 2,0E-03
Strain (mm/mm)
Str
ess
(Mp
a)
Figure 4.8 Least-square fitted stress-strain curve of 1141 tube tensile test
specimen.

78
0
3
6
9
12
15
0,00E+00 2,00E-04 4,00E-04 6,00E-04
Strain (mm/mm)
Str
ess
(Mpa
)
Figure 4.9 Stress – Strain curve of 1151 tube tensile test specimen.
y = 20003x - 0,1122R2 = 0,9992
0
3
6
9
12
0,00E+00 2,00E-04 4,00E-04 6,00E-04
Strain (mm/mm)
Str
ess
(Mpa
)
Figure 4.10 Least-square fitted stress-strain curve of 1151 tube tensile test
specimen.

79
Table 4.20 Longitudinal tensile strength/tensile modulus of elasticity
results of tube tensile tests for specimens 1131 through 3152.
Specimen σltu εult EL
Designation (MPa) (mm/mm) (GPa) 1131 116.90 0.0998 20.96 1141 35.54 0.0031 19.46 1151 13.21 0.0011 20.00 1132 118.82 0.1285 27.56 1142 36.47 0.0030 17.84
1152 10.56 0.0010 19.12 1231 105.80 0.1105 24.07 1241 31.25 0.0048 19.45 1251 13.51 0.0012 20.92
1232 114.79 0.1032 22.23 1242 31.12 0.0027 17.38 1252 12.93 0.0011 16.74 2131 112.07 0.1105 20.43 2141 25.27 0.0039 17.40
2151 5.61 0.0039 18.08 2132 118.42 0.1079 16.13 2142 24.25 0.0029 14.57 2152 11.05 0.0011 15.95
2231 118.07 0.1037 26.00 2241 40.13 0.0037 22.09 2251 7.41 0.0009 14.63 2232 122.81 0.1011 23.45 2242 26.71 0.0030 17.63
2252 11.56 0.0011 18.61 3131 110.92 0.0814 16.95 3141 35.54 0.0670 9.49 3151 8.77 0.0013 10.37
3132 128.68 0.0891 19.17 3142 39.69 0.0058 16.83 3152 13.51 0.0021 8.59

80
Table 4.21 Longitudinal tensile strength/tensile modulus of elasticity
results of tube tensile tests for specimens 3231 through 5252.
Specimen σltu εult EL
Designation (MPa) (mm/mm) (GPa) 3231 114.50 0.0755 21.68 3241 42.16 0.0063 12.97
3251 9.93 0.0018 9.56 3232 129.08 0.0963 18.83 3242 43.38 0.0069 11.63 3252 8.00 0.0014 10.94
4131 143.14 0.1128 23.66 4141 27.03 0.0030 20.29 4151 17.00 0.0013 22.51 4132 123.92 0.1119 25.59 4142 38.45 0.0034 19.15
4152 12.03 0.0009 17.22 4231 118.88 0.1306 24.79 4241 37.78 0.0030 21.68 4251 4.04 0.0005 21.68
4232 138.30 0.0983 20.95 4242 27.54 0.0048 18.15 4252 4.30 0.0032 20.12 5131 98.87 0.4250 17.64 5141 50.76 0.0075 14.78
5151 14.22 0.0024 12.57 5132 117.89 0.4030 15.57 5142 43.18 0.0072 10.70 5152 18.40 0.0158 8.19
5231 97.07 0.0467 20.05 5241 45.51 0.0069 10.96 5251 14.26 0.0024 9.83 5232 98.83 0.0427 26.59 5242 42.60 0.0071 18.63
5252 12.68 0.0023 10.36

81
4.3 Discussion of Experimental Work
4.3.1 Split Disk Tests
In this section, the effect of winding angle, tension setting, and type of fiber
and resin on the hoop tensile properties of the specimens will be evaluated
independently by using the tabulated results given in the previous sections.
In Figure 4.11, dominant failure mechanisms observed during the tests and
their locations on specimens, having 90o (2151, 4151), 65° (4141, 2141), 45o
(4231, 2132), and 25o (2221, 2222) winding angles are compared. As seen
from the photographs, failure of specimens occurred in the gage section
whatever the winding angle is. For specimens, having 90o winding angle
(Figure 4.11(a)), fiber-matrix debonding, parallel to the fibers and loading
axis, was followed by rupture of fibers. For specimens, having ±65o winding
angle (Figure 4.11(b)), the progress of failure was occurred in a similar
manner. In addition, delamination of ±65o layers was observed. The outer
layer was observed to be totally damaged.
For ±45o winding angle specimens (Figure 4.11(c)), different from ±65o
winding angle specimens, fiber-matrix debonding occurred more dominantly.
Delamination of ±45o layers was also observed for these specimens. Finally,
for 25o winding angle specimens (Figure 4.11 (d)), fiber breakage was very
limited, and the specimen failed with the rupture of the matrix phase, which
causes the formation of less macroscopic damage on the specimens, and low
failure strength.
In Figures 4.12–4.16, winding angle dependence of hoop tensile strength of
specimens were represented by a continuous curve, fit by least square method,
by using the experimental data. These curves were obtained by using the

82
(a) (θ = 90o)
Fiber fracture, fiber-matrix debonding
(b) (θ = 65o)
Fiber failure, fiber-matrix debonding, delamination
(c) (θ = 45o)
Delamination, fiber-matrix debonding
(d) (θ = 25o)
Matrix cracking
Figure 4.11 Dominant failure mechanisms and their locations on split-disk
specimens.

83
results of the tests performed with the specimens 1211, 1221, 1231, 1241,
1251 (Figure 4.12); 2211, 2221, 2231, 2241, 2251 (Figure 4.13); 3211, 3221,
3231, 3241, 3251 (Figure 4.14); 4211, 4221, 4231, 4241, 4251 (Figure 4.15);
and 5211, 5221, 5231, 5241, 5251 (Figure 4.16). The figures involve both the
variation of hoop tensile strength of the specimens tested and also the error
bars, representing the range of expected strength values. These data were
obtained by using the calculated standard deviations for the specimens tested.
As it is expected, the highest strength values were obtained for the specimens,
having the winding angle of 900, since the fiber direction is parallel to the
direction of loading. The lowest strength values were obtained for the
specimens, having the winding angle of 00, where the fiber direction is
perpendicular to the direction of loading. The results for the specimens, having
250, 450, and 650 winding angles exhibited intermediate performance between
these two extremes as expected.
0
200
400
600
800
1000
0 10 20 30 40 50 60 70 80 90
Winding Angle
Ho
op
Ten
sile
Str
eng
th (
Mp
a)
Figure 4.12 Hoop tensile strength vs. winding angle for specimens (fiber 1,
resin 2, tension setting 1).
Epoxy Resin LY556 Glass Fiber PPG 2400 With normal fiber tension

84
0
200
400
600
800
0 10 20 30 40 50 60 70 80 90Winding Angle
Ho
op
Ten
sile
Str
eng
th (
Mp
a)
Figure 4.13 Hoop tensile strength vs. winding angle for specimens (fiber 2,
resin 2, tension setting 1).
0
200
400
600
800
1000
1200
1400
0 10 20 30 40 50 60 70 80 90
Winding Angle
Ho
op
Ten
sile
Str
eng
th (
Mp
a)
Figure 4.14 Hoop tensile strength vs. winding angle for specimens (fiber3,
resin 2, tension setting 1).
Epoxy Resin LY556 Carbon Fiber TENAX 2400 With normal fiber tension
Epoxy Resin LY556 Glass Fiber CAMELYAF 2400 With normal fiber tension

85
0
200
400
600
800
1000
0 10 20 30 40 50 60 70 80 90Winding Angle
Ho
op
Ten
sile
Str
eng
th (
Mp
a)
Figure 4.15 Hoop tensile strength vs. winding angle for specimens (fiber 4,
resin 2, tension setting 1).
0
200
400
600
800
1000
1200
0 10 20 30 40 50 60 70 80 90
Winding Angle
Ho
op
Ten
sile
Str
eng
th (
Mp
a)
Figure 4.16 Hoop tensile strength vs. winding angle for specimens (fiber 5,
resin 2, tension setting 1).
Epoxy Resin LY556 Carbon Fiber FORTAFIL 2190 With normal fiber tension
Epoxy Resin LY556 Glass Fiber PPG 600 With normal fiber tension

86
In Figure 4.17, hoop tensile strengths of specimens, having different fibers are
compared as a function of winding angle. The specimens having the same
resin system (resin 2) and tension setting (tension setting 1) are compared so
as to visualize the effect of fiber type on mechanical performance of
specimens. According to this figure, it can be stated that the specimens
produced by carbon fibers showed better mechanical performance compared to
the ones reinforced with glass fibers. This result became more dominant as the
winding angle of specimens approached to the direction of loading (90o). In
addition, highly anisotropic behavior of the carbon fiber system can also be
seen in the same figure, such that, a sharp decrease of hoop tens ile strength
was detected when the winding direction of the fibers were altered from the
direction of loading.
0
200
400
600
800
1000
1200
0 25 45 65 90
Winding Angle
Ho
op
Ten
sile
Str
eng
th (M
Pa)
Fiber 1
Fiber 2
Fiber 3
Fiber 4
Fiber 5
Figure 4.17 Comparison of hoop tensile strengths of specimens having
different fiber types, as a function of winding angle.
From the specimens, reinforced with glass fibers, the one reinforced with PPG
600 TEX glass fiber (Fiber 4) showed better performance. This result can be
explained by the effect of low linear density of Fiber 4. As the linear density
of fibers decreases, the diameters of the fiber bundles, used during the winding
operation, decreases, which causes the fiber bands to criss-cross more

87
efficiently, by creating a weaving effect. The same result can also be seen by
comparing the strength results of carbon fiber reinforced specimens. The
specimen produced with low linear density carbon fibers (fiber 3) showed
better mechanical performance compared to the one produced with high linear
density carbon fibers (fiber 5).
In Figure 4.18, hoop tensile strengths of specimens, having different resin
systems are compared for each fiber type. The specimens having the same
winding angle (±65o) and tension setting (tension setting 1) are compared so as
to visualize the effect of resin system on mechanical performance of
specimens. According to this figure, it can be stated that the effect of resin
system on hoop tensile properties of specimens is negligible.
156,8
200,96
142,94152,02
198,1
138,2148,0150,7 153,3
0
25
50
75
100
125
150
175
200
225
Fiber 1 Fiber 2 Fiber 3 Fiber 4 Fiber 5
Ho
op
Ten
sile
Str
eng
th (M
Pa)
Resin 1
Resin 2
Figure 4.18 Comparison of hoop tensile strengths of specimens having
different resin systems, as a function of fiber type.

88
The effect of tension setting on hoop tensile properties of the specimens can be
understood by inspecting Figures 4.19–4.23. In these figures, the variation of
hoop tensile strength is plotted for two cases, with tension and without tension,
as a function of winding angle. According to these figures, no significant
differences were detected in terms of hoop tensile strength of the specimens.
However, a slight increase in strength was detected for the specimens,
produced with PPG glass fibers (Fiber 1, Fiber 4), and wounded with tension
for winding angles greater than 600. For CAMELYAF Product, WR3 2400
TEX glass fiber, fiber feed was from the inner of the rolls, which made the
control of fiber tension more difficult. Therefore, the same effect was not
observed for the specimens, reinforced with CAMELYAF glass fiber (Fiber 2)
0
200
400
600
800
0 10 20 30 40 50 60 70 80 90Winding Angle
Ho
op
Ten
sile
Str
eng
th (
MP
a)
with normal fiber tension
with extra fiber tension
Figure 4.19 Hoop tensile strength vs. winding angle for specimens (fiber 1,
resin 1, tension settings 1-2).
Epoxy Resin MY740 Glass Fiber PPG 2400

89
0
200
400
600
800
0 10 20 30 40 50 60 70 80 90Winding Angle
Ho
op
Ten
sile
Str
eng
th (
MP
a)
with normal fiber tension
with extra fiber tension
Figure 4.20 Hoop tensile strength vs. winding angle for specimens (fiber 2,
resin 1, tension setting 1-2).
0,00
200,00
400,00
600,00
800,00
1000,00
1200,00
0 10 20 30 40 50 60 70 80 90
Winding Angle
Ho
op
Ten
sile
Str
eng
th (M
Pa)
with normal fiber tension
with extra fiber tension
Figure 4.21 Hoop tensile strength vs. winding angle for specimens (fiber 3,
resin 1, tension setting 1-2).
Epoxy Resin MY740 Glass Fiber CAMELYAF 2400
Epoxy Resin MY740 Carbon Fiber TENAX 2400

90
0
200
400
600
800
1000
1200
0 10 20 30 40 50 60 70 80 90Winding Angle
Ho
op
Ten
sile
Str
eng
th (
MP
a) with normal fiber tension
with extra fiber tension
Figure 4.22 Hoop tensile strength vs. winding angle for specimens (fiber 4,
resin 1, tension setting 1-2).
0
200
400
600
800
1000
1200
0 10 20 30 40 50 60 70 80 90Winding Angle
Ho
op
Ten
sile
Str
eng
th (
MP
a) with normal fiber tension
with extra fiber tension
Figure 4.23 Hoop tensile strength vs. winding angle for specimens (fiber 5,
resin 1, tension setting 1-2).
Epoxy Resin MY740 Glass Fiber PPG 600
Epoxy Resin MY740 Carbon Fiber FORTAFIL 2190

91
Similar to the strength results of split-disk tests, winding angle dependence of
hoop tensile modulus of elasticity of specimens are represented by a
continuous curve, fit by least square method. These curves were obtained by
using the results of the tests performed with the specimens 1111, 1121, 1131,
1141, 1151 (Figure 4.24); 2111, 2121, 2131, 2141, 2151 (Figure 4.25); 3111,
3121, 3131, 3141, 3151 (Figure 4.26); 4111, 4121, 4131, 4141, 4151 (Figure
4.27); and 5111, 5121, 5131, 5141, 5151 (Figure 4.28) The error bars are also
plotted, by using the calculated standard deviations.
In Figures 4.24–4.28, a similar distribution of hoop tensile modulus of
elasticity is obtained with the strength results, presented in Figures 4.12 –
4.16. Differently, the advanced properties of carbon fiber reinforced
specimens (Figure 4.26, Figure 4.28) became more dominant, such that, the
calculated hoop tensile modulus of elasticity of carbon fiber reinforced
specimens is almost 2–3 times greater than the ones reinforced with glass
0
10
20
30
40
50
60
0 10 20 30 40 50 60 70 80 90
Winding Angle
Ho
op
Ten
sile
Mo
du
lus
(GP
a)
Figure 4.24 Hoop tensile modulus of elasticity vs. winding angle for
specimens (fiber 1, resin 1, tension setting 1).
Epoxy Resin MY740 Glass Fiber PPG 2400 With normal fiber tension

92
0
10
20
30
40
50
60
70
0 10 20 30 40 50 60 70 80 90
Winding Angle
Ho
op
Ten
sile
Mo
du
lus
(GP
a)
Figure 4.25 Hoop tensile modulus of elasticity vs. winding angle for
specimens (fiber 2, resin 1, tension setting 1).
0
20
40
60
80
100
120
140
160
0 10 20 30 40 50 60 70 80 90
Winding Angle
Ho
op
Ten
sile
Mo
du
lus
(GP
a)
Figure 4.26 Hoop tensile modulus of elasticity vs. winding angle for
specimens (fiber 3, resin 1, tension setting 1).
Epoxy Resin MY740 Glass Fiber CAMELYAF 2400 With normal fiber tension
Epoxy Resin MY740 Carbon Fiber TENAX 2400 With normal fiber tension

93
0
10
20
30
40
50
60
70
0 10 20 30 40 50 60 70 80 90
Winding Angle
Ho
op
Ten
sile
Mo
du
lus
(GP
a)
Figure 4.27 Hoop tensile modulus of elasticity vs. winding angle for
specimens (fiber 4, resin 1, tension setting 1).
0
20
40
60
80
100
120
140
160
180
200
0 10 20 30 40 50 60 70 80 90
Winding Angle
Ho
op
Ten
sile
Mo
du
lus
(GP
a)
Figure 4.28 Hoop tensile modulus of elasticity vs. winding angle for
specimens (fiber 5, resin 1, tension setting 1).
Epoxy Resin MY740 Glass Fiber PPG 600 With normal fiber tension
Epoxy Resin MY740 Carbon Fiber FORTAFIL 2190 With normal fiber tension

94
Figu
re 4
.29
Com
paris
on o
f hoo
p te
nsile
mod
ulus
of e
last
icity
of s
peci
men
s ha
ving
diff
eren
t fib
ers
as a
func
tion
of w
indi
ng a
ngle
.

95
fibers, as long as the winding angles greater than 650 are concerned. This
result can be better observed from Figure 4.29, which involves the comparison
of hoop tensile modulus of elasticity of specimens having different fibers as a
function of winding angle.
4.3.2 Tube Tensile Tests
The effect of winding angle, tension setting, and type of fiber and resin on the
longitudinal tensile properties of tube tensile test specimens will be evaluated
in this section of the thesis by us ing the tabulated results, given in the previous
sections of the report.
In Figure 4.30, types of failure and their locations on tubular specimens,
having ±45o (5231, 2231), ±65o (5241, 4141), and 90o (3251, 1251) winding
angles are compared. Photographs of both a carbon fiber and a glass fiber
reinforced specimen are presented for each winding angles. As seen from the
photographs, failure occurred usually at the middle section of the specimens.
Less macroscopic damage was observed for these specimens compared to
split-disk test specimens.
For specimens, having 90o winding angle, cracking of matrix phase was
observed dominantly, parallel to the winding direction of fibers (Figure 4.30(a
- b)). Since rupture of fibers did not occur, less macroscopic damage and low
failure strengths was obtained for these specimens.
For glass fiber reinforced specimens, having ±65o winding angle (Figure 4.30
d), the same mechanism was observed. In addition, delamination of ±65o
layers was detected. The latter mechanism was observed more dominantly in
±65o carbon fiber reinforced specimens (Figure 4.30 (c)).

96
(a) Carbon fiber reinforced
θ = 90o
(b) Glass fiber reinforced
θ = 90o
(c) Carbon fiber reinforced
θ = 65o
(d) Glass fiber reinforced
θ = 65o
(e) Carbon fiber reinforced
θ = 45o
(f) Glass fiber reinforced
θ = 45o
Figure 4.30 Types of failure and their locations on carbon/glass fiber
reinforced tube tensile test specimens.

97
For carbon fiber reinforced specimens, having ±45o winding angle (Figure
4.30 (e)), delamination of layers was also observed in a similar manner. For
glass fiber reinforced specimens, having ±45o winding angle (Figure 4.30 (f)),
delamination was observed less dominantly, which makes its macroscopic
observation more difficult. Since the amount of fractured fibers is low for ±65o
and ±45o winding angle specimens, comparable strength performance was
obtained with 90o winding angle specimens.
According to Tables 4.18 and 4.19, it can be stated that tube tensile test
specimens, having ±65°, and 90° winding angles showed similar
performances. The tests, performed with ±45° filament-wound specimens
resulted with relatively higher strength values, as expected. This result was
plotted graphically in Figure 4.31, for specimens produced with resin system
1, and tension setting 1.
The effect of tension setting on longitudinal tensile properties of tube tensile
test specimens can be understood by inspecting Figure 4.32. In that figure,
longitudinal tensile strengths of tube tensile test specimens is plotted for the
two cases, with tension and without tension. (The plot was obtained by using
the results of the tests performed with specimens produced with resin system 1
and winding angle of ±45o).
From Figure 4.32, it was observed that the tube tensile test specimens,
produced with extra tensioning of fibers show higher mechanical performance.
Moreover, by comparing Figure 4.32 and 4.19-4.23, it can be stated that the
effect of tension setting is more dominant for tube tensile test specimens
compared to split-disk test specimens. This is actually an expected result since
fiber tension is a processing parameter, effecting the defect- free production of
specimens. Therefore, as the dimensions of the specimens increase, the effect
of this parameter is expected to increase. (As the dimensions of specimens
increase, defect-free production of specimens become more important).

98
Figu
re 4
.31
Com
pari
son
of l
ongi
tudi
nal
tens
ile s
tren
gths
of
tube
ten
sile
tes
t sp
ecim
ens
havi
ng d
iffe
rent
fib
ers
as a
fun
ctio
n of
win
ding
ang
le.

99
Figure 4.32 Comparison of longitudinal tensile strengths of tube tensile test
specimens having ±45o winding angle.
Differently from split-disk test results, carbon fiber reinforced specimens
showed similar performance with glass fiber reinforced specimens. This
difference was obtained since tube tensile test specimens tested under the
scope of the thesis have winding directions, much different than the direction
of loading ( ≥ 45o). Due to the strong anisotropic character of graphitic
structures of carbon fibers, even lower strength results was obtained compared
to glass fibers. The graphitic structure consist of hexagonal layers, in which
the bonding is covalent and strong, and the inter- layer bonds being weak Van
der Walls bonds. This anisotropy arises due to this reason and can be clearly
observed from Figure 4.31.
The effects of winding angle and fiber type on longitudinal tensile modulus of
elasticity of specimens are presented in Figure 4.33. The plot was obtained by
using the results of tube tensile tests, having resin system 1 and tension setting
2. According to figure, it is clear that tube tensile test specimens, having ±45,
±65°, and 90° winding angles showed similar performances. It is also obvious
that stiffness results of carbon fiber reinforced specimens are more sensitive to
structural anisotropy than strength results.
110,92 116,9 98,87
143,14
443,0 128,7
118,8 118,4 117,9 123,9
0
25
50
75
100
125
150
175
200
Fiber 1 Fiber 2 Fiber 3 Fiber 4 Fiber 5
Normal With Tension
Lo
ng
itu
din
al T
ensi
le S
tren
gth
(M
Pa)

100
Figu
re 4
.33
Com
paris
on o
f lo
ngitu
dina
l te
nsile
mod
ulus
of
elas
ticity
of
tube
ten
sile
tes
t sp
ecim
ens
havi
ng d
iffer
ent
fiber
s as
a
func
tion
of w
indi
ng a
ngle
.

101
4.4 Results and Discussions of Simulation of Split-disk Tests
Modeling of split-disk testing of composite specimens, whose results were
tabulated in the preceeding sections of this chapter, were performed mainly to
verify the accuracy of the test results and to provide a comprehensive base to
the study. This objective was fulfilled with the following procedure:
- During the split-disk testing of the specimens, the axial
displacements of the two half split-disk sections, at the instant of
maximum loading, were recorded.
- Loading of specimens was performed with small increments until
the maximum loads, observed in the experiments was reached.
These loads were applied as a distributed force on the inner
surfaces (A1) of the split disk test fixture (Figure 4.34). Therefore,
the maximum pressure applied on these surfaces is:
1
exp1 A
P=σ (4.1)
where, Pexp is the maximum load observed in experiments, and σ1 is
the pressure applied on the inner surfaces(A1) of the split-disk test
fixture.
- The displacements of the split-disk test fixture (analysis output)
were discussed comprehensively with the experimentally obtained
data.

102
Figure 4.34 Schematic view of split-disk test fixture upon loading.
- The strain data, obtained in the analysis (from the gage section)
were used in order to plot stress-strain graphs for the selected
specimens. Load data were converted into strength data in
correlation with Section 2.2.2.5, as follows:
h2
exp2 A.2
Pσ==σ (4.2)
where, A2 is the area of the gage section of specimens(Figure 4.43).
- These graphs were used so as to predict the hoop tensile modulus
of elasticity of these specimens. (The slopes of the linear portion of
these curves were determined, by least – square method, as stated
in Section 4.2.1).
- This data were then compared with the experimental results.
P

103
The failure loads obtained in split-disk tests (the inputs for the analysis) and
displacements of the two half split-disk sections, corresponding to these data
(the experimental data, with which the results of the analysis was compared)
are tabulated in Table 4.22, for the specimens, selected for the analysis. In
Table 4.23, the displacements of the inner split-disk sections, computed in the
analysis and the related percent errors are tabulated.
Table 4.22 Failure loads and maximum elongations of specimens, obtained
experimentally.
Specimen Designation Failure Load (Pmax)
(N)
Max. Elongation
(mm)
1221 2040.4 0.38
1231 6892.4 1.71
1241 25660.0 2.14
3221 1678.8 0.43
3231 6303.2 3.26
3241 31550.0 3.46
Table 4.23 The displacement data of the inner split-disk sections,
computed in the analysis and the related percent errors.
Specimen Name Elongation at the
instant of maximum
Error (%)
1221 0.48 20,42
1231 0.92 85,25
1241 2.00 6,83
3221 0.39 10,63
3231 2.86 13,86
3241 2.49 39,07

104
In Figures 4.35, 4.37, 4.39, 4.41, 4.43, and 4.45, the stress/strain plots,
obtained from the analysis were presented. These graphs involve an initial
linear region, followed by another linear region having relatively higher slope.
This result is actually in good agreement with the experimentally obtained
stress-strain curves (Figures 4.1 and 4.3). Due to the effect of the bending
moment, imposed during the test at the split, between the split-disk test
fixture, this unusual behaviour was observed.
In Figures 4.36, 4.38, 4.40, 4.42, 4.44, and 4.46 least square fitted stress-strain
curves are presented. The initial linear region with a relatively smaller slope
were not taken into account upon fitting the curve, due to the reason stated
above. Therefore, these graphs were not ploted, starting from zero
stress/strain. Hoop tensile modulus of elasticity results, obtained from these
curves are tabulated in Table 4.24 and presented graphically in Figure 4.47.
According to this figure, it can be stated that a good agreement between the
results of the simulation and the experimental data was obtained as long as the
glass fiber reinforced specimens were considered. The results of the simulation
for carbon fiber reinforced specimens have larger errors.

105
0
10
20
30
40
50
60
0 0,001 0,002 0,003 0,004 0,005
Strain (mm/mm)
Str
ess
(MP
a)
Figure 4.35 Hoop tensile stress–strain graph of split-disk test specimen
1221, obtained by FEM.
y = 12907x - 4,119R2 = 0,9987
49
141924293439444954
0,0005 0,001 0,0015 0,002 0,0025 0,003 0,0035 0,004 0,0045
Strain (mm/mm)
Str
ess
(MP
a)
Figure 4.36 Least-square fitted stress-strain graph of 1221 split-disk test
specimen, obtained by FEM.

106
0
10
20
30
40
50
60
70
80
0 0,001 0,002 0,003 0,004 0,005
Strain (mm/mm)
Str
ess
(MP
a)
Figure 4.37 Hoop tensile stress–strain graph of split-disk test specimen
1231, obtained by FEM.
y = 17454x - 6,0146
R2 = 0,9997
11
21
31
41
51
61
71
81
0,001 0,0015 0,002 0,0025 0,003 0,0035 0,004 0,0045 0,005
Strain (mm/mm)
Str
ess
(MP
a)
Figure 4.38 Least-square fitted stress-strain graph of 1231 split-disk test
specimen, obtained by FEM.

107
0
50
100
150
200
250
0 0,001 0,002 0,003 0,004 0,005
Strain (mm/mm)
Str
ess
(MP
a)
Figure 4.39 Hoop tensile stress–strain graph of split-disk test specimen
1241, obtained by FEM.
y = 49498x - 10,237R2 = 0,9959
34
54
74
94
114
134
154
174
194
214
0,001 0,0015 0,002 0,0025 0,003 0,0035 0,004 0,0045
Strain (mm/mm)
Str
ess
(MP
a)
Figure 4.40 Least-square fitted stress-strain graph of 1241 split-disk test
specimen, obtained by FEM.
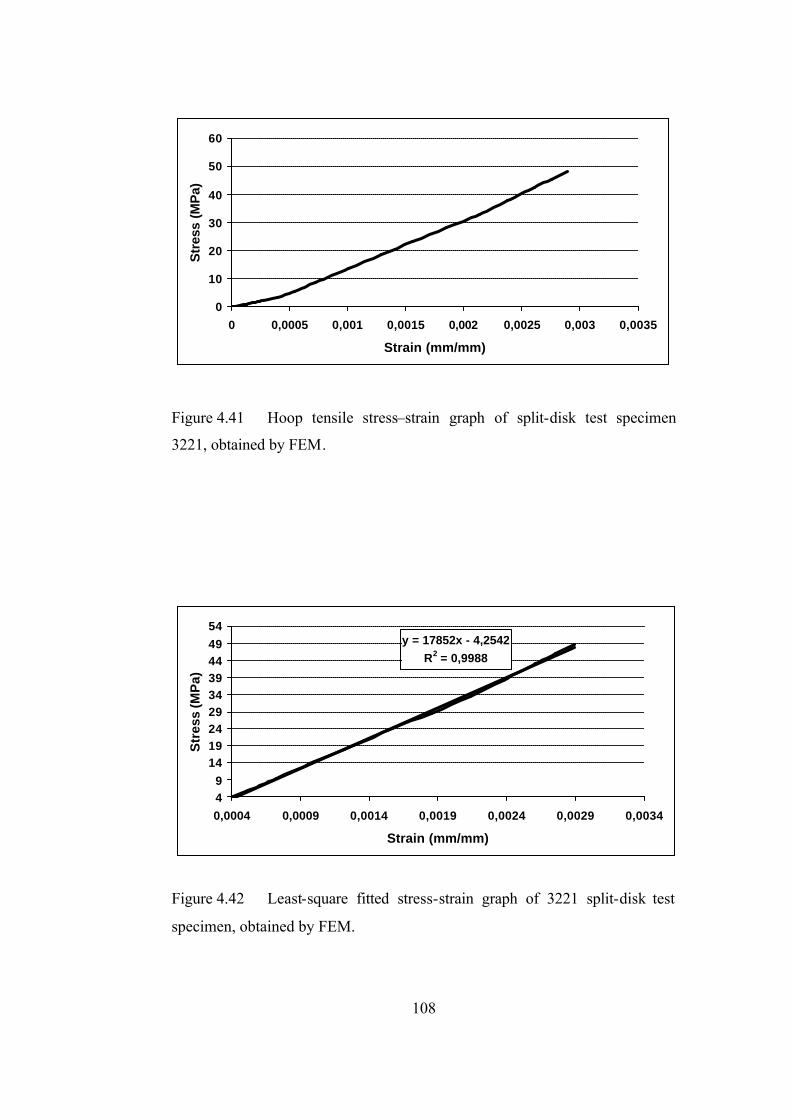
108
0
10
20
30
40
50
60
0 0,0005 0,001 0,0015 0,002 0,0025 0,003 0,0035
Strain (mm/mm)
Str
ess
(MP
a)
Figure 4.41 Hoop tensile stress–strain graph of split-disk test specimen
3221, obtained by FEM.
y = 17852x - 4,2542R2 = 0,9988
49
141924293439444954
0,0004 0,0009 0,0014 0,0019 0,0024 0,0029 0,0034
Strain (mm/mm)
Str
ess
(MP
a)
Figure 4.42 Least-square fitted stress-strain graph of 3221 split-disk test
specimen, obtained by FEM.

109
020406080
100120140160180
0 0,001 0,002 0,003 0,004 0,005 0,006 0,007 0,008
Strain (mm/mm)
Str
ess
(MP
a)
Figure 4.43 Hoop tensile stress–strain graph of split-disk test specimen
3231, obtained by FEM.
y = 22932x - 8,8555R2 = 0,9992
20
40
60
80
100
120
140
160
180
0,0012 0,0022 0,0032 0,0042 0,0052 0,0062 0,0072 0,0082
Strain (mm/mm)
Str
ess
(MP
a)
Figure 4.44 Least-square fitted stress-strain graph of 3231 split-disk test
specimen, obtained by FEM.

110
0
100
200
300
400
500
600
700
800
0,000 0,002 0,004 0,006 0,008 0,010
Strain (mm/mm)
Str
ess
(MP
a)
Figure 4.45 Hoop tensile stress–strain graph of split-disk test specimen
3241, obtained by FEM.
y = 69436x - 12,662R2 = 0,9996
47
147
247
347
447
547
647
747
0,001 0,003 0,005 0,007 0,009
Strain (mm/mm)
Str
ess
(MP
a)
Figure 4.46 Least-square fitted stress-strain graph of 3241 split-disk test
specimen, obtained by FEM.

111
Table 4.24 Tabulated hoop tensile modulus of elasticity results computed
by FEM and obtained from experiments.
Figure 4.47 Comparison of hoop tensile modulus of elasticity results
obtained by FEM and experiments.
Hoop Tensile
Modulus (FEM) (GPa)
Hoop Tensile Modulus (Exp.)
(GPa)
Error (%)
1221 12.9 12.1 6.0
1231 17.5 18.1 3.6
1241 49.5 49.9 0.8
3221 17.9 8.8 51.0
3231 22.9 16.8 26.6
3241 69.4 94.0 35.3
0
10
20
30
40
50
60
70
80
90
100
1221 1231 1241 3221 3231 3241
Ho
op
Ten
sile
Mo
du
lus
(GP
a)
Hoop Tensile Modulus (FEM) (GPa)
Hoop Tensile Modulus (Exp.) (GPa)

112
CHAPTER 5
CONCLUSION
This study was aimed to fulfill the requirement of experimental data for the
characterization of filament-wound composite tubes. For this purpose, hundred
different testing groups were defined by considering five winding angles, two
reinforcements, two resin systems and two tension settings. Tensile and split-
disk tests were performed with specimens from each group. The results of
these experiments were summarized in Table 5.1 – 5.2.
Table 5.1 Experimental results of glass fiber reinforced specimens
Tube Tensile Tests
45° 65° 90°
Longitudinal Tensile Strength (MPa) 143-106 40-24 17-6
Longitudinal Modulus (GPa) 28-20 22-15 20-14
Split-disk Tests
0° 25° 45° 65° 90°
Hoop Tensile Strength (MPa) 11-6 50-28 198-141 584-482 895-701
Hoop Modulus (GPa) 14-9 14-11 30-17 55-45 65-55

113
Table 5.2 Experimental results of carbon fiber reinforced specimens.
Tube Tensile Tests
45° 65° 90°
Longitudinal Tensile Strength (MPa) 129-97 51-36 18-8
Longitudinal Modulus (GPa) 22-16 17-9 13-8
Split-disk Tests
0° 25° 45° 65° 90°
Hoop Tensile Strength (MPa) 5-2 51-34 172-142 691-616 1201-1009
Hoop Modulus (GPa) 11-8 14-9 26-16 120-93 191-141
It was observed that the longitudinal and hoop tensile stress-strain curves are
linear up to the point of failure. For split-disk test specimens having 0o
winding angle, deviation from linearity was detected as the failure occurs
dominantly by matrix cracking. The experimental data were used to
investigate the general distribution of hoop tensile properties of the selected
composites as a function of winding angle. Winding angle dependence of hoop
tensile properties of filament-wound composite tubes was visualized
efficiently by least-square fitting through data points by using a higher order
polynomial. It was observed that both hoop tensile stength and tensile modulus
of elasticity depend strongly on the winding angle (fiber direction) of
specimens.
It was observed that split-disk test is an effective method for determination of
hoop tensile properties of filament-wound tubular structures. Reliable results
were obtained with low standard deviations. Tests with carbon fiber reinforced
specimens resulted with relatively larger deviations.

114
Fiber fracture and fiber-matrix debonding is observed to be the dominant
failure mechanisms for split-disk test specimens, having 90o winding angle.
For specimens having 65o winding angle, in addition to these mechanisms,
delamination of layers was detected. For 45o filament-wound specimens, fiber-
matrix debonding occurred more dominantly. For specimens, having 25o
winding angle fiber breakage was very limited, and the specimens failed with
the rupture of the matrix phase, which causes the formation of less
macroscopic damage on the specimens and low failure strength.
In almost all of the split-disk tests, failure occurred in the gage section of the
specimens. Less macroscopic damage was observed in tube tensile testing of
specimens compared to split-disk tests. Failure of tube tensile test specimens
occurred usually from the middle section.
Tests were performed with two different epoxy+hardener systems. The
properties of these systems are quite similar, with a slight difference in glass
transiton temperature and resin viscocity. The effect of resin system on
mechanical performance was inspected and it was found that the effect of resin
system is negligible as long as the resin systems stated above are considered.
It was observed that the specimens produced by carbon fibers showed much
better mechanical properties compared to the ones produced with glass fibers
for loading directions close to the direction of loading.
The effect of tension setting on longitudinal and hoop tensile properties of
composite tubes were determined. An increase was observed in
longitudinal/hoop tensile properties of tube tensile/split-disk test specimens,
for winding angles close to the direction of loading. It can be further stated
that tube tensile test specimens are more sensitive to the tension setting of
fibers.

115
The split-disk test of selected composite specimens was simulated by finite
element method. Hoop tensile modulus of elasticity and the elongation at the
instant of maximum loading were computed for the selected specimens. The
experimental results were used as material data to perform the simulation. The
results of the analysis were then compared with the experimental results. A
good agreement between the simulation results and the experimental work was
obtained for glass fiber reinforced specimens.
For carbon fiber reinforced specimens, the deviation of the numerical results
from the experimental data is significant. This is caused by the usage of
inaccurate material data during the analysis for carbon fiber reinforced
specimens. Some part of the deviation between the numerical results and the
experimental data can be due to the friction model used in the analysis. Rough
contac surface with infinite friction resistance was defined in the analysis
between the target and contac surfaces whereas in reality sliding along the
contac/target surface can occur.
In the computational study, structures were assumed to be defect- free.
However, this assumption can not be strictly fullfilled for real test specimens.
Test specimens can not be perfectly defect- free, which can result in early
failure of specimens compared to numerical results.
As a future study, longitudinal tensile properties of tubular specimens having
winding angles close to the direction of loading can be tested with tube tensile
test method. This objective could not be achieved in this study due to the
requirement of better test fixture design. Therefore, by the improvements in
tube tensile test fixture, variation of longitudinal tensile properties as a
function of winding angle can be obtained, which can then be compared with
the split-disk test results.
116
Numerical solution for carbon fiber reinforced specimens can be improved by
the usage of more accurate material data. Also, numerical solution can be
further developed by using an iterative procedure to define failure loads, by
the application of a suitable failure criteria.
There are some studies in literature, aiming to optimize the ring testing system
[22]. In the proposed design, the lateral (or radial) displacement is blocked in
order to reduce the bending moment to a minimum. Therefore, as a further
study, this new design can be taken into consideration upon making split-disk
tests.

117
REFERENCES
[1] I. M. Daniel, O. Ishai, Engineering Mechanics of Composite Materials,
Oxford University Press, 1994.
[2] S. T. Peters, W. D. Humphrey, R. F. Foral, Filament Winding Composite
Structure Fabrication, Second Edition.
[3] S. W. Tsai, Composite Design, Thick Composites, Ohio, USA, 1987.
[4] C. S. Chouchaoui, O. O. Ochoa, “Similitude Study for a Laminated
Cylindrical Tube Under Tensile, Torsion, Bending, Internal and External
Pressure” Composite Structures, 44 (1999) 221 – 229.
[5] C. Cazeneuve, P. Joguet, J. C. Maile and C. Oytana, “Predicting the
Mechanical Behavior of Kevlar/epoxy and Carbon/epoxy Filament-
wound Tubes” Composites, 1992, 23, 6, 415 - 424.
[6] C. Wüthrich, “Thick-Walled Composite Tubes under Mechanical and
Hydrothermal Loading” Composites, 1992, 23, 6, 407-413.
[7] L. P. Kollar, M. J. Paterson and G. S. Springer, “Composite Cylinders
Subjected to Hydrothermal and Mechanical Loads” International Journal
of Solid Structures, 1992, 29, 12, 1519-1534.
[8] J. C. Prucz, J. D’ Acquisto and J. E. Smith, “Dynamic-Response of
Composite Pressure-Vessels to Inertia Loads”, Journal of Pressure
Vessel Technology, 1991, 113, 86-91.
[9] S. G. Lekhnitskii, Theory of Elasticity of an Anisotropic Body, Mir
Publishers, Moscow, Soviet Union, 1981.
[10] P. M. Wild, G. W. Vickers, “Analysis of Filament-wound Cylindrical
Shells Under Combined Centrifugal, Pressure, and Axial Loading”,
Composites Part A, 28A, 1997, 47 – 55.
[11] C. S. Chouchaoui, O. O. Ochoa, Composite Structures, 44, 1999, 221 –
229.

118
[12] C. T. Sun, S. Li, “Three-Dimensional Effective Elastic Constants for
Thick Laminates”, Journal of Composite Materials, 1988, Vol. 22, 629-
639.
[13] S. Aleçakir,”Structural Design and Experimental Analysis of a Filament-
Wound Composite Tube Under Combined Loading”, M. S. Thesis,
Middle East Technical University, 1998.
[14] K. Chandrashekhara, and P. Gopalakrishnan, “Elasticity Solution for a
Multilayered Transversely Isotropic Circular Cylindrical Shell”, Journal
of Applied Mechanics, 1982, Vol. 49, 108 – 114.
[15] M. F. S. Al-Khalil, P. D. Soden, “Theoretical Through-thickness Elastic
Constants for Filament-wound Tubes”, Int. J. Mech Sci. Vol. 36, No. 1,
pp 49-62, 1994.
[16] Qi Zhao, S. V. Hoa, “Triaxial Woven Fabric (TWF) Composites with
Open Holes (Part 1): Finite Element Models for Analysis”, Journal Of
Composite Materials, Vol. 37. No 9, 2003, 763 – 789.
[17] Ala Tabiei, Ivelin Ivanov, “Fiber Reorientation in Laminated and Woven
Composites for Finite Element Simulations”, J. of Thermoplastic
Composite Materials, Vol.16, September 2003, 457 – 473.
[18] Doh YD, Hong CS, J. Reinforced Plastic Composites, “Progressive
failure analysis for filament wound pressure vessel”, 1995, 14 (12),
1278-1306.
[19] Jeusette JP, Laschet G, Chapentier P, Deloo Ph, “Finite element analysis
of composite revolution structures wound by wide plies”, Composite
Structures, 1987, 8, 221-237.
[20] K. A. Ilhan, “Computational Design of Composite Tubes and Pressure
Vessels”, M. S. Thesis, Middle East Technical University, 2001.
[21] M. G. Garrell, Albert J. Shih, Edgar Lara-Curzio, and Ronald O.
Scattergood, “Finite-Element Analysis of Stress Concentration in
ASTM-D 638 Tension Specimens”, Journal of Testing and Evaluation,
Vol. 31, No 1, 52-57, Paper ID JTE 11402_311.

119
[22] S. Arsene, J. Bai, “A New Approach to Measuring Transverse Properties
of Structural Tubing by a Ring Test”, Journal of Testing and Evaluation,
Vol. 24, No. 6, November 1996, 386-391.
[23] D. Cohen, “Influence of Filament-winding Parameters on Composite
Vessel Quality and Strength”, Composites Part A 28A (1997) 1035-
1047.
[24] D. Cohen, Y. T. Toombes, A. K. Johnson, M F. Hansen, “Pressurized
Ring Test for Composite Pressure-Vessel Hoop Strength and Stiffness
Evaluation”, Journal of Composites Technology and Research, 1995,
17(4), 331-340.
[25] H. Wang, R. Bouchard, R. Eagleson, P. Martin, and W. R. Tyson, “Ring
Hoop Tension Test (RHTT): A Test for Transverse Tensile Properties of
Tubular Materials”, Journal of Testing and Evaluation, Vol. 30, No. 5,
September 2002, 382-391.
[26] C. S. Lee, W. Hwang, H.C Park, and K. S. Han, “Failure of
Carbon/epoxy Composite Tubes under Combined Axial and Torsional
Loading I. Experimental Results and Prediction of Biaxial Strength by
the use of Neutral Networks”, Composites Science and Technology, 59
(1999), 1779-1788.
[27] Jinbo Bai, Philippe Seeleuthner, and P. Bompard, “Mechanical
Behaviour of ±55o Filament-wound Glass fiber/Epoxy Resin Tubes: I.
Microstructural Analyses, Mechanical Behaviour and Damage
Mechanism of Composite Tubes Under Pure Tensile Loading, Pure
Internal Pressure, and Combined Loading”, Composite Science ad
Technology, 57 (1997), 141-153.
[28] M. Caroll, F. Ellyin, D. Kujawski, and A. S. Chiu, “The Rate Dependent
Behaviour of ±55o Filament-wound Glass fiber/Epoxy Tubes Under
Biaxial Loading”, Composite Science and Technology 55 (1995) 391-
403.

120
[29] A. E. Ayral, “ Tensile, Flexural, Inplane Shear, and Impact Properties of
Polyether-Ether-Ketone (PEEK) Matrix Reinforced by Carbon Fiber
Composites”, M. S. Thesis, Middle East Technical University, 2001.
[30] Baris Elektrik Endüstrisi A. S., MISAG 39 REPORT, Design of High
Pressure Resistant Filament-Wound Composite Tubes, 1996.
[31] American Society for Metals, Metals Handbook. Ed. by Taylor Lyman,
8th edition.
[32] Annual Book of ASTM Standards D 3039/D 3039M-00, ‘Standard Test
Method for Tensile Properties of Polymer Matrix Composites’.
[33] Annual Book of ASTM Standards D 2290-00, ‘Standard Test Method for
Apparent Hoop Tensile Strength of Plastic or Reinforced Plastic Pipe by
Split Disk Method’.
[34] Annual Book of ASTM Standards D 2105, ‘Standard Test Method for
Longitudinal Tensile Properties of “Fiberglass” (Glass-Fiber-Reinforced
Thermosetting-Resin) Pipe and Tube’.
[35] John W. Bull, Finite Element Applications to Thin-Walled Structures,
Elsevier Applied Science.
[36] ANSYS Workbench 7.1, User’s Manual.

121
APPENDIX A
Table A.1 Winding configuration and tension setting for specimens 1111
through 3152 .
Specimen Winding Tension Specimen Winding Tension
Designation Configuration Setting Designation Configuration Setting
1111 (0)2 Without weight 2112 (0)2 With 1.5 kg weight
1121 (±25)2 Without weight 2122 (±25)2 With 1.5 kg weight
1131 (±45)2 Without weight 2132 (±45)2 With 1.5 kg weight
1141 (±65)2 Without weight 2142 (±65)2 With 1.5 kg weight
1151 (90)4 Without weight 2152 (90)4 With 1.5 kg weight
1112 (0)2 With 1.5 kg weight 2211 (0)2 Without weight
1122 (±25)2 With 1.5 kg weight 2221 (±25)2 Without weight
1132 (±45)2 With 1.5 kg weight 2231 (±45)2 Without weight
1142 (±65)2 With 1.5 kg weight 2241 (±65)2 Without weight
1152 (90)4 With 1.5 kg weight 2251 (90)4 Without weight
1211 (0)2 Without weight 2212 (0)2 With 1.5 kg weight
1221 (±25)2 Without weight 2222 (±25)2 With 1.5 kg weight
1231 (±45)2 Without weight 2232 (±45)2 With 1.5 kg weight
1241 (±65)2 Without weight 2242 (±65)2 With 1.5 kg weight
1251 (90)4 Without weight 2252 (90)4 With 1.5 kg weight
1212 (±25)2 With 1.5 kg weight 3111 (0)2 Without weight
1222 (±25)2 With 1.5 kg weight 3121 (±25)3 Without weight
1232 (±45)2 With 1.5 kg weight 3131 (±45)3 Without weight
1242 (±65)2 With 1.5 kg weight 3141 (±65)4 Without weight
1252 (90)4 With 1.5 kg weight 3151 (90)6 Without weight
2111 (0)2 Without weight 3112 (0)2 With 1.5 kg weight
2121 (±25)2 Without weight 3122 (±25)3 With 1.5 kg weight
2131 (±45)2 Without weight 3132 (±45)3 With 1.5 kg weight
2141 (±65)2 Without weight 3142 (±65)4 With 1.5 kg weight
2151 (90)4 Without weight 3152 (90)6 With 1.5 kg weight
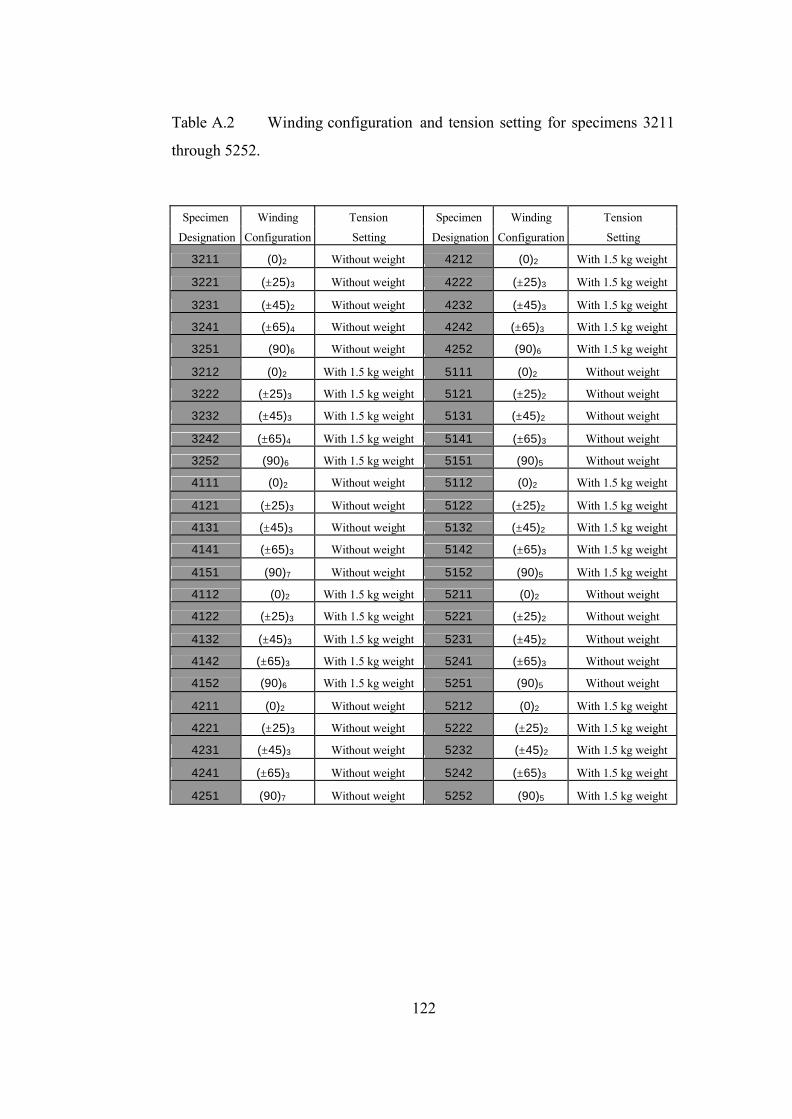
122
Table A.2 Winding configuration and tension setting for specimens 3211
through 5252.
Specimen Winding Tension Specimen Winding Tension
Designation Configuration Setting Designation Configuration Setting
3211 (0)2 Without weight 4212 (0)2 With 1.5 kg weight
3221 (±25)3 Without weight 4222 (±25)3 With 1.5 kg weight
3231 (±45)2 Without weight 4232 (±45)3 With 1.5 kg weight
3241 (±65)4 Without weight 4242 (±65)3 With 1.5 kg weight
3251 (90)6 Without weight 4252 (90)6 With 1.5 kg weight
3212 (0)2 With 1.5 kg weight 5111 (0)2 Without weight
3222 (±25)3 With 1.5 kg weight 5121 (±25)2 Without weight
3232 (±45)3 With 1.5 kg weight 5131 (±45)2 Without weight
3242 (±65)4 With 1.5 kg weight 5141 (±65)3 Without weight
3252 (90)6 With 1.5 kg weight 5151 (90)5 Without weight
4111 (0)2 Without weight 5112 (0)2 With 1.5 kg weight
4121 (±25)3 Without weight 5122 (±25)2 With 1.5 kg weight
4131 (±45)3 Without weight 5132 (±45)2 With 1.5 kg weight
4141 (±65)3 Without weight 5142 (±65)3 With 1.5 kg weight
4151 (90)7 Without weight 5152 (90)5 With 1.5 kg weight
4112 (0)2 With 1.5 kg weight 5211 (0)2 Without weight
4122 (±25)3 With 1.5 kg weight 5221 (±25)2 Without weight
4132 (±45)3 With 1.5 kg weight 5231 (±45)2 Without weight
4142 (±65)3 With 1.5 kg weight 5241 (±65)3 Without weight
4152 (90)6 With 1.5 kg weight 5251 (90)5 Without weight
4211 (0)2 Without weight 5212 (0)2 With 1.5 kg weight
4221 (±25)3 Without weight 5222 (±25)2 With 1.5 kg weight
4231 (±45)3 Without weight 5232 (±45)2 With 1.5 kg weight
4241 (±65)3 Without weight 5242 (±65)3 With 1.5 kg weight
4251 (90)7 Without weight 5252 (90)5 With 1.5 kg weight

123
APPENDIX B
Table B.1 Split-disk test specimen dimensions for 1111-1 through 1212-5.
Minimum Minimum Reduced Minimum Minimum Reduced Specimen
Designation Thickness (mm)
Width (mm)
Sec. Area (mm2)
Specimen Designation Thickness
(mm) Width (mm)
Sec. Area (mm2)
1111-1 0.99 14.76 14.61 1142-1 1.54 14.70 22.64 1111-2 0.99 14.76 14.61 1142-2 1.41 14.73 20.77 1111-3 0.94 14.80 13.91 1142-3 1.47 14.70 21.61 1111-4 0.93 14.78 13.75 1142-4 1.49 14.76 21.99 1111-5 0.99 14.76 14.61 1142-5 1.40 14.69 20.57 1121-1 1.73 14.86 25.71 1152-1 1.47 14.64 21.52 1121-2 1.78 14.77 26.29 1152-2 1.48 14.65 21.68 1121-3 1.68 14.83 24.91 1152-3 1.49 14.69 21.89 1121-4 1.64 14.77 24.22 1152-4 1.47 14.76 21.70 1121-5 1.67 14.81 24.73 1152-5 1.54 14.72 22.67 1131-1 1.54 14.72 22.67 1211-1 1.45 14.91 21.62 1131-2 1.68 14.71 24.71 1211-2 1.64 14.77 24.22 1131-3 1.53 14.77 22.60 1211-3 1.62 14.73 23.86 1131-4 1.47 14.75 21.68 1211-4 1.52 14.81 22.51 1131-5 1.68 14.74 24.76 1211-5 1.47 14.87 21.86 1141-1 1.43 14.60 20.88 1221-1 1.79 14.89 26.65 1141-2 1.52 14.67 22.30 1221-2 1.81 14.81 26.80 1141-3 1.51 14.27 21.55 1221-3 1.96 14.76 28.93 1141-4 1.44 14.67 21.12 1221-4 1.98 14.87 29.44 1141-5 1.49 14.66 21.84 1221-5 1.88 14.87 27.96 1151-1 1.49 14.58 21.72 1231-1 1.49 14.69 21.89 1151-2 1.56 14.66 22.87 1231-2 1.59 14.68 23.34 1151-3 1.54 14.64 22.55 1231-3 1.60 14.80 23.68 1151-4 1.54 14.64 22.55 1231-4 1.48 14.74 21.82 1151-5 1.56 14.66 22.87 1231-5 1.59 14.73 23.42 1112-1 1.45 14.91 21.62 1241-1 1.53 14.74 22.55 1112-2 1.64 14.77 24.22 1241-2 1.53 14.69 22.48 1112-3 1.62 14.73 23.86 1241-3 1.44 14.69 21.15 1112-4 1.52 14.81 22.51 1241-4 1.52 14.69 22.33 1112-5 1.47 14.87 21.86 1241-5 1.48 14.62 21.64 1122-1 1.79 14.72 26.35 1251-1 1.49 14.74 21.96 1122-2 1.76 14.87 26.17 1251-2 1.52 14.69 22.32 1122-3 1.84 14.73 27.10 1251-3 1.50 14.72 22.08 1122-4 1.88 14.77 27.77 1251-4 1.46 14.79 21.59 1122-5 1.82 14.86 27.05 1251-5 1.45 14.72 21.34 1132-1 1.55 14.85 23.02 1212-1 0.95 14.89 14.15 1132-2 1.46 14.77 21.56 1212-2 1.01 14.78 14.93 1132-3 1.46 14.75 21.53 1212-3 0.94 14.75 13.86 1132-4 1.56 14.81 23.10 1212-4 0.99 14.76 14.61 1132-5 1.56 14.78 23.06 1212-5 0.99 14.76 14.61

124
Table B.2 Split-disk test specimen dimensions for 1222-1 through 2241-5.
Minimum Minimum Reduced Minimum Minimum Reduced Specimen
Designation Thickness (mm)
Width (mm)
Sec. Area (mm2)
Specimen Designation Thickness
(mm) Width (mm)
Sec. Area (mm2)
1222-1 1.61 14.85 23.91 2112-1 0.86 14.83 12.75 1222-2 1.55 14.83 22.99 2112-2 0.64 14.82 9.48 1222-3 1.58 14.85 23.46 2112-3 0.71 14.81 10.51 1222-4 1.55 14.83 22.99 2112-4 0.82 14.76 12.10 1222-5 1.60 14.89 23.82 2112-5 0.71 14.81 10.51 1232-1 1.61 14.88 23.96 2122-1 2.08 14.92 31.03 1232-2 1.56 14.80 23.09 2122-2 2.17 14.90 32.33 1232-3 1.55 14.77 22.89 2122-3 2.12 14.85 31.48 1232-4 1.59 14.84 23.60 2122-4 2.10 14.87 31.23 1232-5 1.59 14.81 23.55 2122-5 2.10 14.81 31.10 1242-1 1.52 14.70 22.34 2132-1 1.71 14.80 25.31 1242-2 1.48 14.72 21.79 2132-2 1.75 14.78 25.86 1242-3 1.50 14.61 21.91 2132-3 1.72 14.85 25.54 1242-4 1.50 14.71 22.06 2132-4 1.77 14.81 26.21 1242-5 1.47 14.75 21.68 2132-5 1.70 14.80 25.16 1252-1 1.54 14.71 22.65 2142-1 1.63 14.70 23.96 1252-2 1.32 14.64 19.32 2142-2 1.65 14.73 24.30 1252-3 1.47 14.62 21.49 2142-3 1.55 14.69 22.77 1252-4 1.47 14.61 21.48 2142-4 1.52 14.71 22.36 1252-5 1.50 14.64 21.96 2142-5 1.68 14.73 24.75 2111-1 0.86 14.83 12.75 2152-1 1.65 14.63 24.14 2111-2 0.64 14.82 9.48 2152-2 1.62 14.81 23.99 2111-3 0.71 14.81 10.51 2152-3 1.62 14.82 24.01 2111-4 0.82 14.76 12.10 2152-4 1.70 14.79 25.14 2111-5 0.71 14.81 10.51 2152-5 1.65 14.73 24.30 2121-1 1.92 14.91 28.63 2211-1 1.84 14.87 27.36 2121-2 1.90 14.81 28.14 2211-2 0.64 14.82 9.48 2121-3 1.87 14.85 27.77 2211-3 0.71 14.81 10.51 2121-4 1.95 14.87 29.00 2211-4 0.82 14.76 12.10 2121-5 1.92 14.87 28.55 2211-5 0.71 14.81 10.51 2131-1 1.78 14.83 26.40 2221-1 1.94 14.94 28.98 2131-2 1.65 14.82 24.45 2221-2 2.06 14.96 30.82 2131-3 1.81 14.80 26.79 2221-3 1.94 14.97 29.04 2131-4 1.74 14.71 25.60 2221-4 1.87 14.93 27.92 2131-5 1.67 14.85 24.80 2221-5 1.93 14.93 28.81 2141-1 1.61 14.68 23.63 2231-1 1.69 14.92 25.21 2141-2 1.59 14.61 23.23 2231-2 1.86 14.91 27.73 2141-3 1.63 14.68 23.93 2231-3 1.79 14.87 26.62 2141-4 1.63 14.67 23.91 2231-4 1.79 14.86 26.60 2141-5 1.62 14.69 23.80 2231-5 1.78 14.91 26.54 2151-1 1.53 14.76 22.58 2241-1 1.19 14.67 17.46 2151-2 1.62 14.72 23.85 2241-2 1.12 14.70 16.46 2151-3 1.56 14.67 22.89 2241-3 1.23 14.66 18.03 2151-4 1.60 14.70 23.52 2241-4 1.20 14.64 17.57 2151-5 1.58 14.72 23.26 2241-5 1.29 14.63 18.87

125
Table B.3 Split-disk test specimen dimensions for 2251-1 through 3221-5.
Minimum Minimum Reduced Minimum Minimum Reduced Specimen
Designation Thickness (mm)
Width (mm)
Sec. Area (mm2)
Specimen Designation Thickness
(mm) Width (mm)
Sec. Area (mm2)
2251-1 1.59 14.73 23.42 3141-1 1.54 14.80 22.79 2251-2 1.70 14.71 25.01 3141-2 1.49 14.66 21.84 2251-3 1.67 14.81 24.73 3141-3 1.64 14.72 24.14 2251-4 1.71 14.63 25.02 3141-4 1.60 14.75 23.60 2251-5 1.67 14.71 24.57 3141-5 1.51 14.76 22.29 2212-1 0.86 14.83 12.75 3151-1 1.18 14.65 17.29 2212-2 0.64 14.82 9.48 3151-2 1.24 14.64 18.15 2212-3 0.71 14.81 10.51 3151-3 1.20 14.69 17.63 2212-4 0.82 14.76 12.10 3151-4 1.18 14.62 17.25 2212-5 0.71 14.81 10.51 3151-5 1.17 14.60 17.08 2222-1 2.03 14.97 30.39 3112-1 1.09 14.81 17.48 2222-2 2.00 14.90 29.80 3112-2 1.04 14.84 16.47 2222-3 2.01 14.97 30.09 3112-3 1.06 14.73 15.61 2222-4 2.04 14.97 30.54 3112-4 1.18 14.81 17.48 2222-5 2.04 14.83 30.25 3112-5 1.11 14.84 16.47 2232-1 1.65 14.82 24.45 3122-1 1.53 14.80 22.64 2232-2 1.75 14.79 25.88 3122-2 1.66 14.78 24.53 2232-3 1.86 14.83 27.58 3122-3 1.58 14.80 23.38 2232-4 1.79 14.89 26.65 3122-4 1.52 14.82 22.53 2232-5 1.76 14.89 26.21 3122-5 1.58 14.76 23.32 2242-1 1.63 14.75 24.04 3132-1 1.45 14.85 21.53 2242-2 1.53 14.75 22.57 3132-2 1.39 14.81 20.59 2242-3 1.63 14.77 24.08 3132-3 1.31 14.89 19.51 2242-4 1.47 14.72 21.64 3132-4 1.38 14.55 20.08 2242-5 1.66 14.47 24.02 3132-5 1.27 14.76 18.74 2252-1 1.58 14.81 23.40 3142-1 1.41 14.78 20.84 2252-2 1.70 14.80 25.16 3142-2 1.47 14.71 21.62 2252-3 1.63 14.74 24.03 3142-3 1.59 14.70 23.37 2252-4 1.70 14.52 24.68 3142-4 1.48 14.76 21.84 2252-5 1.67 14.73 24.60 3142-5 1.58 14.66 23.16 3111-1 1.05 14.80 15.54 3152-1 1.20 14.62 17.54 3111-2 1.06 14.86 15.75 3152-2 1.19 14.67 17.46 3111-3 1.02 14.84 15.14 3152-3 1.22 14.57 17.78 3111-4 1.05 14.80 15.54 3152-4 1.19 14.72 17.52 3111-5 1.06 14.86 15.75 3152-5 1.18 14.71 17.36 3121-1 1.70 14.85 25.24 3211-1 1.06 14.79 15.68 3121-2 1.68 14.90 25.03 3211-2 1.18 14.83 17.50 3121-3 1.64 14.88 24.40 3211-3 1.06 14.73 15.61 3121-4 1.74 14.86 25.86 3211-4 1.18 14.81 17.48 3121-5 1.73 14.88 25.74 3211-5 1.11 14.84 16.47 3131-1 1.29 14.61 18.85 3221-1 1.64 14.60 23.94 3131-2 1.33 14.75 19.62 3221-2 1.72 14.88 25.59 3131-3 1.37 14.85 20.34 3221-3 1.61 14.36 23.12 3131-4 1.32 14.81 19.55 3221-4 1.65 14.42 23.79 3131-5 1.30 14.72 19.14 3221-5 1.67 14.46 24.15

126
Table B.4 Split-disk test specimen dimensions for 3231-1 through 4152-5.
.
Minimum Minimum Reduced Minimum Minimum Reduced Specimen Designation Thickness
(mm) Width (mm)
Sec. Area (mm2)
Specimen Designation Thickness
(mm) Width (mm)
Sec. Area (mm2)
3231-1 1.40 14.82 20.75 4121-1 1.47 14.73 21.65 3231-2 1.43 14.66 20.96 4121-2 1.44 14.76 21.25 3231-3 1.42 14.73 20.92 4121-3 1.41 14.77 20.83 3231-4 1.40 14.55 20.37 4121-4 1.46 14.77 21.56 3231-5 1.35 14.75 19.91 4121-5 1.40 14.83 20.76 3241-1 1.72 14.86 25.56 4131-1 1.37 14.80 20.28 3241-2 1.62 14.85 24.06 4131-2 1.33 14.83 19.72 3241-3 1.75 14.80 25.90 4131-3 1.38 14.80 20.42 3241-4 1.71 14.86 25.41 4131-4 1.35 14.82 20.01 3241-5 1.68 14.79 24.85 4131-5 1.39 14.75 20.50 3251-1 1.22 14.78 18.03 4141-1 1.53 14.72 22.52 3251-2 1.23 14.79 18.19 4141-2 1.50 14.77 22.15 3251-3 1.20 14.69 17.63 4141-3 1.61 14.74 23.73 3251-4 1.21 14.67 17.75 4141-4 1.47 14.67 21.56 3251-5 1.23 14.73 18.12 4141-5 1.57 14.67 23.03 3212-1 1.06 14.79 15.68 4151-1 1.38 14.70 20.29 3212-2 1.18 14.83 17.50 4151-2 1.31 14.70 19.26 3212-3 1.06 14.73 15.61 4151-3 1.35 14.66 19.79 3212-4 1.18 14.81 17.48 4151-4 1.36 14.66 19.94 3212-5 1.11 14.84 16.47 4151-5 1.33 14.62 19.44 3222-1 1.72 14.86 25.56 4112-1 1.01 14.83 14.98 3222-2 1.57 14.83 23.28 4112-2 0.98 14.79 14.49 3222-3 1.55 14.73 22.83 4112-3 0.94 14.82 13.93 3222-4 1.64 14.89 24.42 4112-4 0.94 14.83 13.94 3222-5 1.50 14.86 22.29 4112-5 0.96 14.84 14.25 3232-1 1.49 14.67 21.86 4122-1 1.46 14.81 21.62 3232-2 1.42 14.73 20.97 4122-2 1.44 14.70 21.17 3232-3 1.38 14.58 20.12 4122-3 1.51 14.79 22.33 3232-4 1.40 14.73 20.62 4122-4 1.45 14.81 21.47 3232-5 1.54 14.77 22.75 4122-5 1.51 14.83 22.39 3242-1 1.67 14.85 24.80 4132-1 1.33 14.75 19.62 3242-2 1.53 14.62 22.37 4132-2 1.39 14.66 20.38 3242-3 1.61 14.67 23.62 4132-3 1.37 14.67 20.10 3242-4 1.68 14.81 24.88 4132-4 1.37 14.72 20.17 3242-5 1.59 14.76 23.47 4132-5 1.35 14.68 19.82 3252-1 1.18 14.76 17.42 4142-1 1.24 14.75 18.29 3252-2 1.24 14.85 18.41 4142-2 1.16 14.74 17.10 3252-3 1.15 14.62 16.81 4142-3 1.10 14.73 16.20 3252-4 1.18 14.61 17.24 4142-4 1.11 14.64 16.25 3252-5 1.21 14.65 17.73 4142-5 1.18 14.63 17.26 4111-1 1.01 14.83 14.98 4152-1 1.24 14.61 18.12 4111-2 0.98 14.79 14.49 4152-2 1.29 14.66 18.91 4111-3 0.94 14.82 13.93 4152-3 1.21 14.76 17.86 4111-4 0.94 14.83 13.94 4152-4 1.25 14.63 18.29 4111-5 0.96 14.84 14.25 4152-5 1.26 14.66 18.47

127
Table B.5 Split-disk test specimen dimensions for 4211-1 through 5132-5.
Minimum Minimum Reduced Minimum Minimum Reduced Specimen
Designation Thickness (mm)
Width (mm)
Sec. Area (mm2)
Specimen Designation Thickness
(mm) Width (mm)
Sec. Area (mm2)
4211-1 1.01 14.83 14.98 4252-1 1.20 14.64 17.57 4211-2 0.98 14.79 14.49 4252-2 1.25 14.68 18.35 4211-3 0.94 14.82 13.93 4252-3 1.23 14.71 18.09 4211-4 0.94 14.83 13.94 4252-4 1.25 14.66 18.32 4211-5 0.96 14.84 14.25 4252-5 1.29 14.63 18.87 4221-1 1.48 14.73 21.80 5111-1 1.43 14.79 21.15 4221-2 1.40 14.74 20.64 5111-2 1.54 14.83 22.84 4221-3 1.45 14.76 21.40 5111-3 1.45 14.74 21.37 4221-4 1.46 14.74 21.52 5111-4 1.51 14.75 22.27 4221-5 1.43 14.81 21.18 5111-5 1.52 14.89 22.63 4231-1 1.29 14.76 19.04 5121-1 1.62 14.88 24.11 4231-2 1.36 14.84 20.18 5121-2 1.62 14.71 23.83 4231-3 1.32 14.85 19.60 5121-3 1.55 14.83 22.99 4231-4 1.30 14.84 19.29 5121-4 1.53 14.82 22.67 4231-5 1.33 14.81 19.70 5121-5 1.52 14.86 22.59 4241-1 1.14 14.75 16.81 5131-1 1.36 14.56 19.80 4241-2 1.19 14.90 17.73 5131-2 1.23 14.59 17.95 4241-3 1.12 14.68 16.44 5131-3 1.31 14.62 19.15 4241-4 1.13 14.74 16.66 5131-4 1.36 14.70 19.99 4241-5 1.17 14.72 17.22 5131-5 1.44 14.69 21.15 4251-1 1.29 14.67 18.92 5141-1 1.88 14.80 27.82 4251-2 1.26 14.50 18.27 5141-2 1.89 14.59 27.58 4251-3 1.36 14.63 19.90 5141-3 1.95 14.79 28.84 4251-4 1.28 14.57 18.65 5141-4 1.95 14.76 28.78 4251-5 1.29 14.62 18.86 5141-5 1.92 14.71 28.24 4212-1 1.01 14.83 14.98 5151-1 1.63 14.55 23.72 4212-2 0.98 14.79 14.49 5151-2 1.64 14.75 24.19 4212-3 0.94 14.82 13.93 5151-3 1.61 14.74 23.73 4212-4 0.94 14.83 13.94 5151-4 1.58 14.73 23.27 4212-5 0.96 14.84 14.25 5151-5 1.56 14.68 22.90 4222-1 1.45 14.79 21.45 5112-1 1.19 14.85 17.67 4222-2 1.44 14.75 21.24 5112-2 1.33 14.77 19.64 4222-3 1.48 14.77 21.86 5112-3 1.41 14.87 20.97 4222-4 1.53 14.80 22.64 5112-4 1.31 14.88 19.49 4222-5 1.46 14.77 21.56 5112-5 1.32 14.74 19.46 4232-1 1.26 14.65 18.46 5122-1 1.71 14.79 25.29 4232-2 1.18 14.68 17.32 5122-2 1.49 14.81 22.07 4232-3 1.26 14.60 18.40 5122-3 1.46 14.85 21.68 4232-4 1.18 14.64 17.28 5122-4 1.54 14.87 22.90 4232-5 1.17 14.61 17.09 5122-5 1.47 14.82 21.79 4242-1 1.34 14.84 19.89 5132-1 1.29 14.73 19.00 4242-2 1.39 14.83 20.61 5132-2 1.22 14.69 17.92 4242-3 1.28 14.61 18.70 5132-3 1.27 14.80 18.80 4242-4 1.35 14.83 20.02 5132-4 1.17 14.81 17.33 4242-5 1.35 14.83 20.02 5132-5 1.26 14.61 18.41

128
Table B.6 Split-disk test specimen dimensions for 5142-1 through 5252-5.
Minimum Minimum Reduced Minimum Minimum Reduced Specimen
Designation Thickness (mm)
Width (mm)
Sec. Area (mm2)
Specimen Designation Thickness
(mm) Width (mm)
Sec. Area (mm2)
5142-1 2.01 14.81 29.77 5251-1 1.58 14.76 23.32 5142-2 2.01 14.80 29.75 5251-2 1.63 14.78 24.09 5142-3 2.00 14.75 29.50 5251-3 1.60 14.78 23.65 5142-4 1.95 14.78 28.82 5251-4 1.57 14.79 23.22 5142-5 1.99 14.74 29.33 5251-5 1.69 14.79 25.00 5152-1 1.62 14.78 23.94 5212-1 1.39 14.88 20.68 5152-2 1.64 14.78 24.24 5212-2 1.47 14.89 21.89 5152-3 1.62 14.66 23.75 5212-3 1.47 14.69 21.59 5152-4 1.64 14.77 24.22 5212-4 1.51 14.83 22.39 5152-5 1.63 14.81 24.14 5212-5 1.51 14.79 22.33 5211-1 1.52 14.86 22.59 5222-1 1.58 14.88 23.51 5211-2 1.55 14.88 23.06 5222-2 1.49 14.85 22.13 5211-3 1.49 14.73 21.95 5222-3 1.55 14.85 23.02 5211-4 1.52 14.86 22.59 5222-4 1.51 14.72 22.22 5211-5 1.55 14.88 23.06 5222-5 1.59 14.78 23.50 5221-1 1.02 14.78 15.08 5232-1 1.37 14.74 20.19 5221-2 0.94 14.79 13.90 5232-2 1.30 14.72 19.14 5221-3 0.92 14.79 13.61 5232-3 1.35 14.70 19.84 5221-4 0.94 14.78 13.89 5232-4 1.41 14.83 20.91 5221-5 0.97 14.78 14.34 5232-5 1.36 14.74 20.05 5231-1 1.38 14.77 20.38 5242-1 2.00 14.87 29.74 5231-2 1.33 14.71 19.56 5242-2 1.97 14.75 29.06 5231-3 1.39 14.75 20.50 5242-3 1.97 14.86 29.27 5231-4 1.39 14.74 20.49 5242-4 1.86 14.81 27.55 5231-5 1.35 14.71 19.86 5242-5 1.95 14.77 28.80 5241-1 1.90 14.73 27.99 5252-1 1.65 14.76 24.35 5241-2 1.96 14.78 28.97 5252-2 1.63 14.86 24.22 5241-3 1.88 14.70 27.64 5252-3 1.70 14.76 25.09 5241-4 1.91 14.86 28.38 5252-4 1.70 14.71 25.00
5241-5 1.83 14.81 27.10 5252-5 1.71 14.89 25.46

129
Table B.7 Tube tensile test specimen dimensions.
Specimen Outer Diameter Thickness Area Specimen Outer Diameter Thickness Area
Designation (mm) (mm) (mm2) Designation (mm) (mm) (mm2) 1131 63.05 1.52 294.76 3231 62.72 1.36 262.16 1141 62.83 1.41 272.72 3241 62.85 1.42 274.98 1151 62.96 1.48 285.85 3251 62.28 1.14 218.96 1132 63.00 1.50 289.8 3232 62.62 1.31 252.31 1142 62.75 1.37 265.11 3242 63.16 1.58 305.66 1152 62.96 1.48 285.85 3252 62.36 1.18 226.79 1231 63.18 1.59 307.64 4131 62.66 1.33 256.25 1241 62.80 1.40 270.04 4141 63.06 1.53 295.75 1251 62.90 1.45 279.92 4151 62.54 1.27 244.45 1232 63.05 1.52 294.76 4132 62.88 1.44 277.94 1242 62.80 1.40 270.04 4142 62.25 1.12 216.03 1252 62.93 1.47 283.27 4152 62.50 1.25 240.52 2131 63.25 1.62 314.59 4231 62.70 1.35 260.19 2141 63.20 1.60 309.63 4241 62.30 1.15 220.92 2151 63.24 1.62 313.6 4251 62.46 1.23 236.6 2132 63.20 1.60 309.25 4232 62.30 1.15 220.92 2142 63.12 1.56 301.69 4242 62.36 1.18 226.79 2152 63.19 1.59 308.64 4252 62.34 1.17 224.83 2231 63.30 1.65 319.56 5131 63.10 1.55 299.71 2241 62.30 1.15 220.92 5141 63.64 1.82 353.46 2251 63.21 1.60 310.62 5151 63.20 1.60 309.63 2232 63.40 1.70 329.51 5132 62.38 1.19 228.75 2242 63.06 1.53 295.75 5142 63.75 1.87 364.47 2252 63.22 1.61 311.61 5152 63.18 1.59 307.64 3131 62.70 1.35 260.19 5231 62.80 1.40 270.04 3141 63.04 1.52 293.76 5241 63.66 1.83 355.46 3151 62.34 1.17 224.83 5251 63.04 1.52 293.76 3132 62.50 1.25 240.52 5232 62.58 1.29 248.38 3142 63.08 1.54 297.73 5242 63.76 1.88 365.47
3152 62.46 1.23 236.6 5252 63.28 1.64 317.58