EXPERIMENTAL EVALUATION OF SOIL-PIPE FRICTION COEFFICIENTS ... · PDF fileEXPERIMENTAL...
12
EXPERIMENTAL EVALUATION OF SOIL-PIPE FRICTION COEFFICIENTS FOR COATED STEEL PIPES Shaurav Alam 1 , Erez N.Allouche 1 , Chris Bartlett 1 , Ang Sherpa 1 , and Brent Keil 2 1 Trenchless Technology Center, Dept. of Civil Engineering, Louisiana Tech University, Ruston, LA, 71270; Tel:(318)257-4072, Fax: (318)257-2777. 2 Northwest Pipe Company, Vancouver, Washington. ABSTRACT Significant thrust forces can be generated on a pressurized pipeline wall or fitting due to internal pressure, momentum forces, surge forces, and/or thermal changes. The produced thrust force can lead to longitudinal movement of a pipeline and its connections. Soil frictional resistance, which is a function of the pipe’s surface area and coating material, depth of cover, and soil characteristics, plays a key role in restraining such axial movements. Thus, soil frictional resistance is an important factor in designing restrained buried pipes that operate under internal pressure. When soil conditions are stable, considerable economies could be realized by utilizing the embedment soil to restrain the pipe. A series of controlled laboratory tests were performed, aimed at establishing friction coefficient values for combinations of selected soil types and three external coating systems, namely, Cement mortar, per AWWA C205; Polyurethane, per AWWA C222; and Prefabricated Polyethylene tape, per AWWA C214 (used in conjunction with steel pipes). The work was performed using the Trenchless Technology Center’s (TTC) soil chamber testing apparatus (6 ft wide × 12 ft long and 5 ft deep), which is equipped with an air bladder and a stiff steel lid capable of applying a uniformly distributed load of up to 18 psi on the soil surface. The internal diameters of the pipes were 14” for the specimens coated with polyurethane and prefab- plastic tape and 12” for the specimen coated with cement mortar lining. This was done to obtain a comparable external surface area for the pipe specimens. The pipes were pulled through the soil using a horizontally mounted 150,000 lb servo-controlled hydraulic actuator. The embedment materials were compacted to the level of the crown of the pipe, for conservatism. Earth pressure cells placed in the vicinity of the pipe registered stress changes in the soil medium due to longitudinal movement of pipe. All embedment materials underwent an array of laboratory soil characterization tests to establish key characterization parameters. Test results were compared with predictions provided by appropriate clauses in the current version of the AWWA M11 design manual for steel pipe design. KEY WORDS: soil friction, steel pipe, over burden pressure, coating material INTRODUCTION Results of controlled laboratory tests performed on coated steel pipe specimens to establish friction coefficient values for three external coating systems, namely, cement mortar, 360 Pipelines 2013 © ASCE 2013
Transcript of EXPERIMENTAL EVALUATION OF SOIL-PIPE FRICTION COEFFICIENTS ... · PDF fileEXPERIMENTAL...

EXPERIMENTAL EVALUATION OF SOIL-PIPE FRICTION COEFFICIENTS FOR COATED STEEL PIPES
Shaurav Alam1, Erez N.Allouche1, Chris Bartlett1, Ang Sherpa1, and Brent Keil2
1 Trenchless Technology Center, Dept. of Civil Engineering, Louisiana Tech University, Ruston, LA, 71270; Tel:(318)257-4072, Fax: (318)257-2777.
2 Northwest Pipe Company, Vancouver, Washington.
ABSTRACT
Significant thrust forces can be generated on a pressurized pipeline wall or fitting due to internal pressure, momentum forces, surge forces, and/or thermal changes. The produced thrust force can lead to longitudinal movement of a pipeline and its connections. Soil frictional resistance, which is a function of the pipe’s surface area and coating material, depth of cover, and soil characteristics, plays a key role in restraining such axial movements. Thus, soil frictional resistance is an important factor in designing restrained buried pipes that operate under internal pressure. When soil conditions are stable, considerable economies could be realized by utilizing the embedment soil to restrain the pipe. A series of controlled laboratory tests were performed, aimed at establishing friction coefficient values for combinations of selected soil types and three external coating systems, namely, Cement mortar, per AWWA C205; Polyurethane, per AWWA C222; and Prefabricated Polyethylene tape, per AWWA C214 (used in conjunction with steel pipes). The work was performed using the Trenchless Technology Center’s (TTC) soil chamber testing apparatus (6 ft wide × 12 ft long and 5 ft deep), which is equipped with an air bladder and a stiff steel lid capable of applying a uniformly distributed load of up to 18 psi on the soil surface. The internal diameters of the pipes were 14” for the specimens coated with polyurethane and prefab-plastic tape and 12” for the specimen coated with cement mortar lining. This was done to obtain a comparable external surface area for the pipe specimens. The pipes were pulled through the soil using a horizontally mounted 150,000 lb servo-controlled hydraulic actuator. The embedment materials were compacted to the level of the crown of the pipe, for conservatism. Earth pressure cells placed in the vicinity of the pipe registered stress changes in the soil medium due to longitudinal movement of pipe. All embedment materials underwent an array of laboratory soil characterization tests to establish key characterization parameters. Test results were compared with predictions provided by appropriate clauses in the current version of the AWWA M11 design manual for steel pipe design.
KEY WORDS: soil friction, steel pipe, over burden pressure, coating material
INTRODUCTION
Results of controlled laboratory tests performed on coated steel pipe specimens to establish friction coefficient values for three external coating systems, namely, cement mortar,
360Pipelines 2013 © ASCE 2013
polyurethane, and prefabricated plastic tape, are presented in this paper. The research focused on direct measurement of the soil-pipe bulk friction coefficients (both, dynamic, and static) for the coating systems of interest. The coating systems were applied in accordance with relevant AWWA standards (AWWA C205-07, AWWA C214-07, and AWWA C222-08). Variables included overburden pressures, type of coating material, soil type, and soil moisture content. Soil types utilized were silty-clay, sand, and pea gravel.
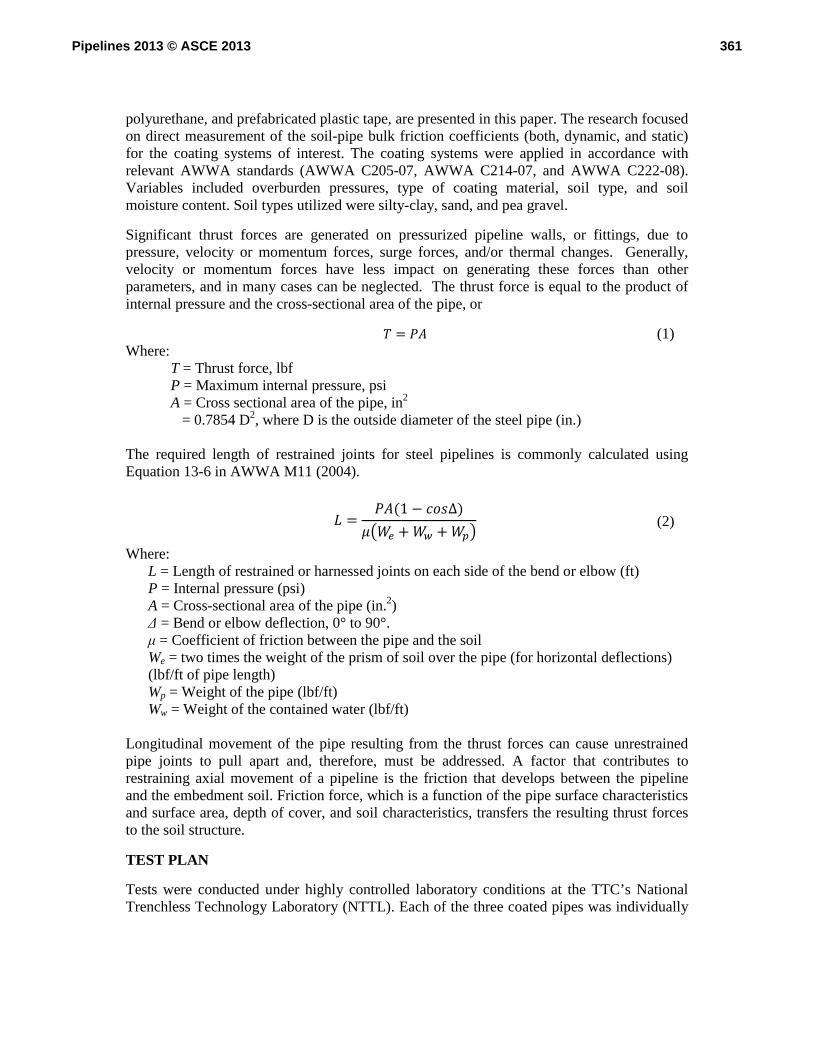
Significant thrust forces are generated on pressurized pipeline walls, or fittings, due to pressure, velocity or momentum forces, surge forces, and/or thermal changes. Generally, velocity or momentum forces have less impact on generating these forces than other parameters, and in many cases can be neglected. The thrust force is equal to the product of internal pressure and the cross-sectional area of the pipe, or
= (1)Where:
T = Thrust force, lbf P = Maximum internal pressure, psi A = Cross sectional area of the pipe, in2 = 0.7854 D2, where D is the outside diameter of the steel pipe (in.) The required length of restrained joints for steel pipelines is commonly calculated using Equation 13-6 in AWWA M11 (2004).
= (1 − ∆)+ + (2)
Where: L = Length of restrained or harnessed joints on each side of the bend or elbow (ft) P = Internal pressure (psi) A = Cross-sectional area of the pipe (in.2) Δ = Bend or elbow deflection, 0° to 90°. μ = Coefficient of friction between the pipe and the soil We = two times the weight of the prism of soil over the pipe (for horizontal deflections) (lbf/ft of pipe length) Wp = Weight of the pipe (lbf/ft) Ww = Weight of the contained water (lbf/ft)
Longitudinal movement of the pipe resulting from the thrust forces can cause unrestrained pipe joints to pull apart and, therefore, must be addressed. A factor that contributes to restraining axial movement of a pipeline is the friction that develops between the pipeline and the embedment soil. Friction force, which is a function of the pipe surface characteristics and surface area, depth of cover, and soil characteristics, transfers the resulting thrust forces to the soil structure.
TEST PLAN
Tests were conducted under highly controlled laboratory conditions at the TTC’s National Trenchless Technology Laboratory (NTTL). Each of the three coated pipes was individually
361Pipelines 2013 © ASCE 2013

buried inside a 12 ft long, 6 ft wide, and 5 ft deep, soil chamber testing apparatus. Laboratory tests were performed to determine key characteristics of the soil types employed in the soil box (i.e., sand, silty-clay, and Pea gravel). Compaction (~85% compaction level) was carried out only to the crown of the pipe for conservatism. Earth pressure cells were placed at the vicinity of the pipe’s invert, crown, and spring lines to monitor the compressive stresses in the soil during the test. The overburden pressure was applied using an air bladder system. The axial force applied to the pipe and the movement of the 14” pipe were monitored and recorded by the actuator’s servo-controller unit. The test matrix is shown in Table 1, where the characteristics of each test series performed are outlined.
Table 1: Test Matrix Test
Series Soil Type Coating Type
Overburden Depth, ft
Moisture Level
Number of Setups
Number of Tests
1 Silty-Clay
1. Cement mortar
4, 8, 12, 16 Optimal 3 12 2. Polyurethane Type – I
3. Pre-fabricated plastic tape
2 Sand
1. Cement mortar
4, 8, 12, 16
Optimal 3 12
2. Polyurethane Type – I
Flooded - 3 3. Pre-fabricated plastic tape
3 Pea gravel
(Engineered Embedment)
1. Cement mortar
4, 8, 12, 16 Optimal 3 12 2. Polyurethane Type – I
3. Pre-fabricated plastic tape
Total No. of Tests Performed 9 39
Four earth pressure cells (EPCs) were used to monitor soil pressure during the test. Two EPCs were placed 4" above the pipe’s crown. One was located at an 18” offset from the pipe’s centerline (to capture any arching effect); the other one was placed parallel to, and 4" away from, the pipe’s spring line (for measuring lateral pressure [see Figure 1]).
Figure 1: Location and placement of EPCs in the soil chamber (not to scale)
362Pipelines 2013 © ASCE 2013

SOIL-PIPE CONTACT SURFACE
Due to variations in thickness of the coating used on the outer surface areas of the pipes, soil-pipe interface for each coating material was slightly different, but in general the pipe outside diameter after coating was approximately 14”. The pipe’s effective surface areas for the three coating materials are shown in Table 2.
Table 2: Pipe’s Effective Surface Area
Coating Type Embedded Length
Outer Circumference
Pipe’s Surface Area
ft in ft2
Cement Mortar 12 44.625 44.63
Polyurethane Type – I 12 45.125 45.13
Prefab. Plastic Tape 12 45.25 45.25
SOIL CHARACTERIZATION
Soil characterizations of three soil types were performed by determining bulk and apparent specific gravity, grain size distribution, cohesion, friction angle, absorption, and optimum moisture content. Standard Proctor tests were performed on sand and silty-clay samples. The Atterberg limits test (ASTM D4318) was performed on the silty-clay sample. Dry density for sand and silty-clay were calculated to be 106 pcf at an optimum moisture content of approximately 12.5%, and 109 pcf at an optimum moisture content of 15%, respectively (see Figure 2).
Figure 2: Determination of Optimum Moisture Content of Sand A direct shear test (ASTM D3080) under consolidated drained conditions was performed on remolded samples to estimate the cohesion and friction angle value using a direct shear testing machine (Model G-128-26-2114/02 manufactured by ELE International, LLC). The specimen achieved 90 percent consolidation at 6.50 psi of normal stress within approximately 5 min. Therefore, total time estimated was around 58.50 min, and the loading rate for sand was found to be 0.086 in/min assuming 0.50 in. total displacement. For silty clay the loading rate was found to be 0.05 in/min. Three samples were tested for each soil type to obtain the cohesion and friction angle values.
363Pipelines 2013 © ASCE 2013
Results of the soil tests are summarized in Table 3. The specific gravity of silty-clay was found to be 1.72, while the absorption was 9.86%. Pea gravel had the lowest absorption, 1.28%, and the highest specific gravity, 2.57. Cohesion of the silty-clay was 12.5 psi and the friction angle was found to be 22°. The cohesion values of sand and pea gravel were found to be 0.93 and 0.12, respectively. The saturated surface-dry specific gravity values were used in the calculations.
Table 3: Properties of Different Soil Materials
Soil Type
Bulk Specific Gravity,
OD*
Bulk Specific Gravity, SSD**
Absorption %Optimum Moisture
Content, %
Cohesion psi
Friction Angle
° LL PL PI
Silty-clay 1.72 1.89 9.86 15 12.5 22.2 24.3 14.8 9.5
Sand 2.07 2.27 9.71 12.5 0.9 31.3
Pea gravel 2.57 2.60 1.28 - 0.1 35.2
* Oven Dry Condition ** Saturated Surface Dry Condition
EXPERIMENTAL SETUP
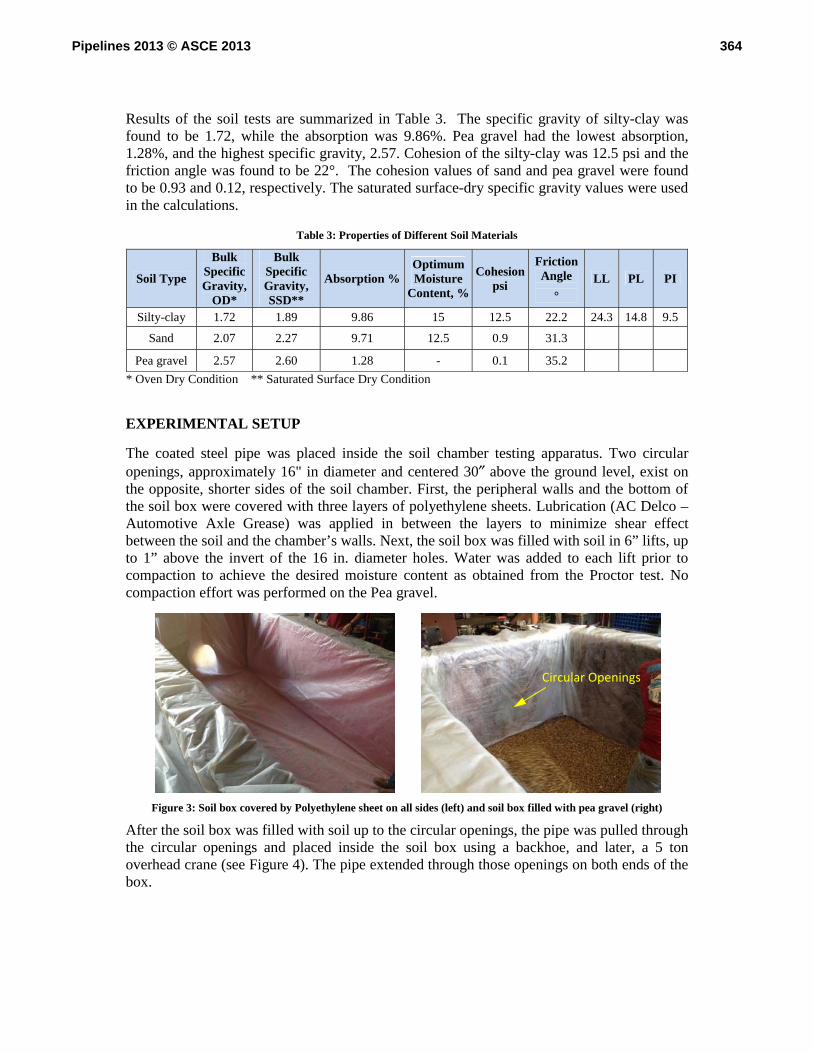
The coated steel pipe was placed inside the soil chamber testing apparatus. Two circular openings, approximately 16" in diameter and centered 30″ above the ground level, exist on the opposite, shorter sides of the soil chamber. First, the peripheral walls and the bottom of the soil box were covered with three layers of polyethylene sheets. Lubrication (AC Delco – Automotive Axle Grease) was applied in between the layers to minimize shear effect between the soil and the chamber’s walls. Next, the soil box was filled with soil in 6” lifts, up to 1” above the invert of the 16 in. diameter holes. Water was added to each lift prior to compaction to achieve the desired moisture content as obtained from the Proctor test. No compaction effort was performed on the Pea gravel.
Figure 3: Soil box covered by Polyethylene sheet on all sides (left) and soil box filled with pea gravel (right)
After the soil box was filled with soil up to the circular openings, the pipe was pulled through the circular openings and placed inside the soil box using a backhoe, and later, a 5 ton overhead crane (see Figure 4). The pipe extended through those openings on both ends of the box.
Circular Openings
364Pipelines 2013 © ASCE 2013

Figure 4: Placing of the Polyurethane Coated Pipe inside the Soil Box
For tests where Pea gravel was used, the EPCs were placed inside an encased wooden box filled with dry sand and covered with geo-textile. This minimized the likelihood of recording localized stress caused by the individual stones. For the other soil types, the EPCs were placed within the soil material (see Figure 5).
Figure 5: Placing of the EPCs above the pipe – Pea Gravel (left) and Sand (right)
The soil chamber was then backfilled up to its rim in 6" lifts and slightly overfilled to account for any volume changes due to consolidation. Next, the rubber bladder was placed on top of the soil surface to ensure uniform pressure (see Figure 6).
Figure 6: Soil chamber filled with Sand(left); Rubber bladder on top of the soil’s surface (right)
For flooded conditions, performed only for sand, a series of perforated conduits (see Figure 7) were placed on top of the soil under the rubber bladder. Approximately 195 gallons of
365Pipelines 2013 © ASCE 2013

water were added, using a conduit passed through the circular opening in the short wall, to ensure flooded conditions based on the volume and in situ moisture content of the sand.
Figure 7: Water Supply Conduit (left) and Perforated Conduits Lying on Top of Soil (right)
A ½” x ½” rectangular seal was glued to the lid. The lid was placed on top of the soil box keeping the holes, used to insert the bolts connecting the lid to the chamber’s main body, aligned (see Figure 8).
Figure 8: Rectangular seal glued to the lid (left) and lid being placed on top of soil chamber (right)
The lid was then bolted using twenty-two ½”-13 TPI bolts. Low level air pressure was applied inside the soil chamber and soapy water was sprayed along the seal to insure for zero leakage (see Figure 9).
Figure 9: Lid placed and bolted on top of the soil chamber (left) Checking for leakage (right)
Conduit
366Pipelines 2013 © ASCE 2013

Pressure was then applied to the soil box to simulate the over burden depth. A pressure transducer and a digital pressure gauge were connected to monitor and record the overburden pressure (see Figure 10).
Figure 10: Pressure applied to the soil box (left); Pressure reading on the gauge (right)
A pull head was fabricated and welded to a cap attached to the host pipe, connecting the pipe to the actuator using a pin joint, which ensured that no movement could be transferred to the pipe. Another cap, with two threaded taps, was attached on the other end of the host pipe (see Figure 11). The pipe was filled with water prior to each test, while simultaneously purging the air (see Figure 11, right image).
Figure 11: Fabricated Pull-head welded to host pipe (left); water supply line attachment to rear cap (right)
The prescribed overburden pressure was applied for 24 hours prior to performing the pull test. Following the American Water Works Association (AWWA) installation and field hydrostatic test procedures it may be possible to put a line into service within 24 hours of the backfill placement around the pipe. In terms of resisting loading from thrust, the initial period after installation is when the pipe-soils system is most vulnerable.
Data was collected using a National Instruments DAQ system, for which a LABVIEW Virtual Instrument (VI) program was written to monitor and record data from each electronic measuring device, facilitating efficient analysis of the experimental data.
367Pipelines 2013 © ASCE 2013

EXPERIMENTAL RESULTS
The maximum required pulling forces and corresponding friction factors, which were back-calculated based on Equation 13-6 in AWWA M11 for the three coating systems and various soil types, are listed in Table 4. The results revealed that the cement mortar (CM) coating tends to produce higher friction resistance compared with the two other coating systems. Friction values were found to be similar for the Polyurethane Type-I and Prefabricated Polyethylene Tape. The friction factor for sand was found to be less than that of silty clay, which might be attributed to a somewhat lower compaction effort.
Table 4: Summary of Friction Factor for Selected Over Burden Depths
Soil Type
Over Burden
Pressure
psi
Over Burden Depth
ft
Normal Load Cement Mortar Polyurethane
Type – I Prefab. Plastic
Tape
We kip/ft
Ww kip/ft
Wp kip/ft
Pulling Load kip/ft
Friction Factor
Pulling Load kip/ft
Friction Factor
Pulling Load kip/ft
Friction Factor
Pea Gravel
2.22 4.0 1.53 0.05 0.04 1.61 1.00 0.97 0.59 0.88 0.53
6.68 8.0 3.05 0.05 0.04 2.54 0.81 1.37 0.43 1.39 0.43
11.14 12.0 4.58 0.05 0.04 3.60 0.77 1.95 0.41 1.69 0.36
15.60 16.0 6.10 0.05 0.04 3.88 0.63 - - 2.36 0.38
Sand
1.82 4.0 1.30 0.05 0.04 1.11 0.80 0.96 0.68 0.75 0.53
5.50 8.0 2.56 0.05 0.04 1.14 0.43 1.14 0.42 0.86 0.32
8.90 12.0 3.72 0.05 0.04 1.29 0.34 1.44 0.37 1.04 0.27
12.50 16.0 4.95 0.05 0.04 1.47 0.29 1.69 0.33 1.32 0.26
Flooded 12.50 16.0 4.95 0.05 0.04 1.41 0.28 1.71 0.33 1.27 0.25
Silty Clay
1.80 4.0 1.18 0.05 0.04 1.13 0.90 1.70 1.30 1.15 0.96
4.40 7.5 2.07 0.05 0.04 1.52 0.71 1.96 0.76 1.10 0.49
7.40 11.0 3.09 0.05 0.04 1.93 0.61 1.97 0.52 1.46 0.45
10.40 15.0 4.12 0.05 0.04 2.67 0.64 2.31 0.46 1.66 0.39
It is important to note that the friction factor was back-calculated from Equation 13-6 in AWWA M11 (2004). As a result, the friction factor ‘declines’ with depth. This is attributed to the fact that the relative contribution of the weight of the pipe and its content decline as the weight of the soil prism above the pipe crown increases. Another observation is that pea gravel yielded a higher friction factor due to localized point loads represented by individual aggregates, tending to “grab” the pipe, thereby increasing resistance to motion. Consequently, the friction force for a CM coated pipe is ~0.2 ksi/ft per foot of burial depth, while the corresponding value for polyurethane type-I and pre-fabricated plastic tape is around 0.11-0.12 ksi/ft per foot of burial depth. Average friction factor values for CM, Polyurethane, and Prefabricated plastic tape were found to be 0.63, 0.55, and 0.43, respectively. Figure 12 provides a graphical representation of measured axial pull force values for different combinations of coatings and soil conditions. It can be seen that the required pulling force increased for all soil types with overburden pressure in a predominantly linear fashion. As a general rule, the required pull force was higher for the cement mortar coated pipe. Flooded conditions were simulated for only sandy soil, with a 12.5 psi overburden
368Pipelines 2013 © ASCE 2013
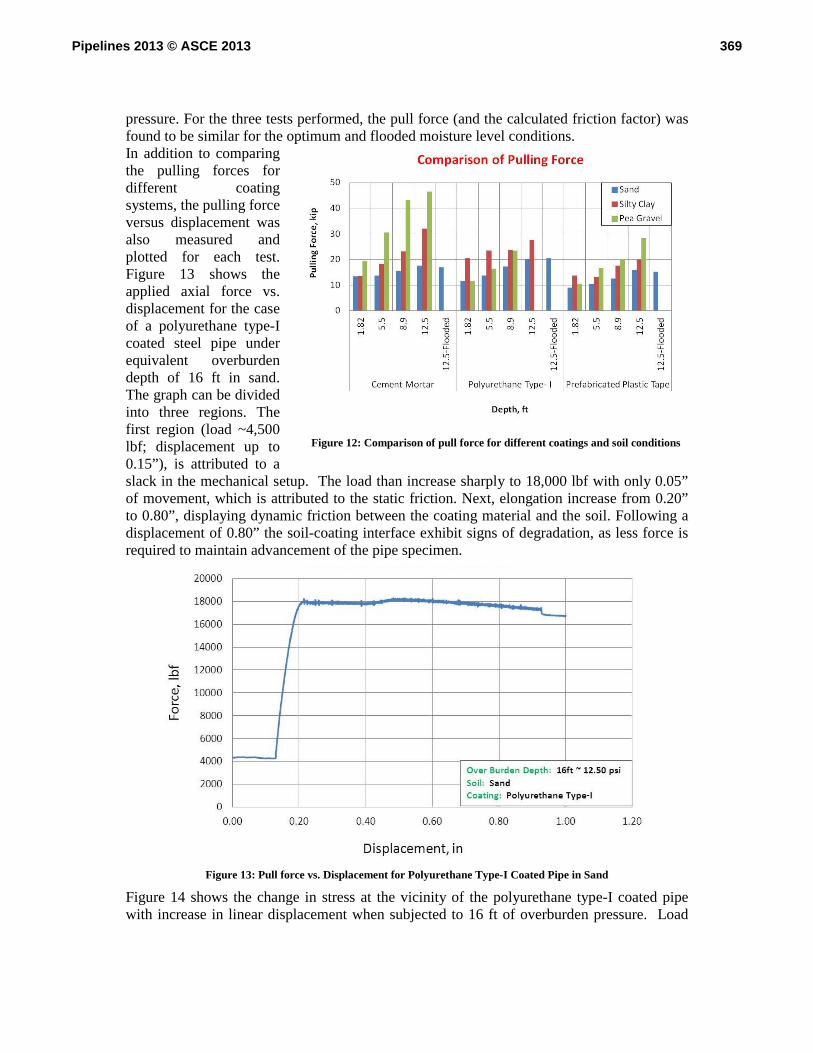
pressure. For the three tests performed, the pull force (and the calculated friction factor) was found to be similar for the optimum and flooded moisture level conditions. In addition to comparing the pulling forces for different coating systems, the pulling force versus displacement was also measured and plotted for each test. Figure 13 shows the applied axial force vs. displacement for the case of a polyurethane type-I coated steel pipe under equivalent overburden depth of 16 ft in sand. The graph can be divided into three regions. The first region (load ~4,500 lbf; displacement up to 0.15”), is attributed to a slack in the mechanical setup. The load than increase sharply to 18,000 lbf with only 0.05” of movement, which is attributed to the static friction. Next, elongation increase from 0.20” to 0.80”, displaying dynamic friction between the coating material and the soil. Following a displacement of 0.80” the soil-coating interface exhibit signs of degradation, as less force is required to maintain advancement of the pipe specimen.
Figure 13: Pull force vs. Displacement for Polyurethane Type-I Coated Pipe in Sand
Figure 14 shows the change in stress at the vicinity of the polyurethane type-I coated pipe with increase in linear displacement when subjected to 16 ft of overburden pressure. Load
Figure 12: Comparison of pull force for different coatings and soil conditions
369Pipelines 2013 © ASCE 2013

cell EPC1, positioned perpendicular to the soil surface and 4 in. away from the pipe’s spring line, registered a slight increase in lateral pressure as displacement reached 0.2” (i.e., static friction overcome and pipe began moving). Simultaneously, EPC2 and EPC3 located above the crown of the pipe, registered a decrease in stress level, as the pipe movement resulted in the rearrangement of the sand particles in the vicinity of the pipe’s wall. Load cell EPC4, located at the same elevation as EPC2 and EPC3, but at an offset of 18 in. from the pipe’s centerline, registered a slight increase in pressure with pipe motion. With the reading of EPC 4 been similar to these of EPC 1 and EPC 2, one can conclude that the arching effect in the experimental setup was minimal.
Figure 14: Change in Earth Pressure Vs Linear Motion of the Polyurethane Type - I Coated Pipe Buried in Sand
SUMMARY
An extensive full-scale experimental program was undertaken to measure frictional pulling force and friction factor at the soil-pipe interface for coated steel pipes. The testing programs included 39 different tests that covered a range of soil types, overburden pressures, and moisture contents. Friction factor was computed from the experimentally obtained pulling force and was compared for different coating systems. The experimentally measured values were substituted into Equation 13-6 in AWWA M11-04, and the friction factor, μ , was back-calculated.
Cement mortar coating was found to produce higher friction resistance compared with the two other coating systems. Friction values were found to be similar for the Polyurethane Type-I and Prefabricated Polyethylene Tape. Pulling loads (and correspondently, friction factors) were found to be significantly higher for pea gravel compared with finer grain soil. This is attributed to the point loads applied by the individual aggregates, which increase the overall force needed to mobilize the pipe. Pull-forces for the fine-grain embedment materials were found to be similar for a given coating material, particularly when a higher overburden pressure (12 ft and 16 ft) was applied. As the period over which the overburden pressure was applied was brief (24 hours), little settlement and compaction due to particle rearrangement
370Pipelines 2013 © ASCE 2013

was expected to take place. Flooded conditions tests were performed only for sand with cover of 16 ft (12.5 psi OBP). For these tests the short-term friction factor was found to be similar to that measured for the sand with optimum-moisture level condition. It is important to note that friction factor values reported herein can be considered inherently conservative, as they do not take into account the effect of consolidation and aging mechanisms that occur over longer time periods than these allowed for in this testing program (24 hrs). These mechanisms can substantially increase the pull-out force measured in the very short term test reported herein (Schmertmann, 1981, Schmertmann, 1991).
ACKNOWLEDGMENT
The authors would like to acknowledge the technical and financial support provided by Northwest Pipe Company, Vancouver, WA for this research work. We also acknowledge Mr. Chris Morgan, Mr. Jack Pierce, and Mr. Ben Curry, TTC technical staff members, for their invaluable assistance during the experimental program.
REFERENCES
Alam, S. and Allouche, E.N. (2010). Experimental Investigation of Pipe Soil Friction for Direct Buried PVC Pipes, Proceedings of the Pipeline Division Conference, ASCE, Keystone, CO, August.
ASCE Task Committee on Thrust Restraint Design of Buried Pipelines (2010). Contribution of Frictional Resistance to Restrain Unbalanced Thrust in Buried Pipelines. Proceedings, Pipeline Division Conference, Keystone, CO, Aug. 28-Sept 1.
AWWA M11 (2004). Steel Water Pipe: A Guide for Design and Installation, 4th Ed.
AWWA C 205-07. Cement Mortar Protective Lining and coating for Steel Water Pipe.
AWWA C 214-07. Tape Coating Systems for the Exterior of Steel Water Pipelines.
AWWA C222-08. Polyurethane Coatings for Interior & Exterior of Steel Water Pipe Fittings.
Schmertmann, J. H. (1981). A General Time-Related Soil Friction Increase Phenomenon. In Laboratory Shear Strength of Soil, ASTM STP 740, Editors R.N. Yong and F.C. Townsend, 456-484. American Society for Testing and Materials.
Schmertmann, J. H. (1991). The Mechanical Aging of Soils. Journal of Geotechnical Engineering, (ASCE), September, 1288-1330.
371Pipelines 2013 © ASCE 2013