Fuel Cell-Performance and Durability--Modeling, Evaluation ...

PUBLICATION [P1]
Experimental Analysis on Performanceand Durability of SOFC Demonstration
UnitIn: Fuel Cells 10 (3), pp. 440-452
© 2010 WILEY-VCH Verlag GmbH & Co
Reprinted with permission from the publisher

I/1
Experimental Analysis on Performanceand Durability of SOFC DemonstrationUnitM. Halinen1*, J. Saarinen1, M. Noponen1a, I. C. Vinke2, J. Kiviaho1
1 VTT Technical Research Centre of Finland, Fuel Cells, P.O. Box 1000, Biologinkuja 5, Espoo, FI-02044 VTT, Finland2 Forschungszentrum Jülich GmbH, Institute of Energy Research -Fuel Cells (IEF-3), D-52425 Jülich, Germany
Received August 06, 2009; accepted December 02, 2009
1 IntroductionSolid oxide fuel cells (SOFCs) are considered an advanta-
geous technology in energy production due to the high fuelconversion efficiency, modular design possibilities and fuelflexibility. High operating temperature makes SOFCs wellsuited for combined heat and power production (CHP) or forhybrid systems where the SOFC stack is coupled with a gasturbine. Fuel processor design is simplified compared to lowtemperature fuel cell types due to high operating temperaturethat enables direct oxidation of carbon monoxide and the useof hydrocarbon fuels via internal reforming reactions. Thetheoretical efficiency of the SOFC is not governed by sizewhen compared to e.g. Carnot- or Rankine-cycle basedenergy production. Thus, SOFCs can be utilised for variousapplications with different power scale e.g. auxiliary powerunits for cars and trucks, residential and distributed CHP orstationary power production.
The widespread commercialisation of the SOFC technol-ogy is hindered by relatively higher cost of the SOFC systems
when compared to the established technology for energyproduction e.g. engines or gas turbines. The price for bothSOFC stacks along with other system components is high andthe availability of products is poor due to the absence ofdeveloped markets and production. Along with the reductionof cost, long lifetime and high availability are prerequisitesfor a SOFC system for both stationary and micro CHP appli-cations. The inherent voltage degradation phenomenon of theSOFC stacks is the most important factor that affects the dur-ability and lifetime of a SOFC system. For stationary applica-tions, voltage degradation rates below 0.25% kh–1 have to beachieved to ensure a long enough lifetime for the products [1,2]. Currently, operating times for planar SOFC stacks that
–[*] Corresponding author, [email protected]
[a] Present affiliation: Wärtsilä, Product Centre Ecotech, FuelCells
AbstractA technical description and experimental analysis of a SOFCdemonstration unit is presented. The unit contains most ofthe primary BoP-components of a complete SOFC system,except of air and fuel recirculation equipment or fuel systemcompressor. Natural gas is used as the fuel and electricity issupplied to the electric grid. A 5 kW power class planarSOFC stack from Research Centre Jülich is assembled to thedemo unit and a long-term experiment is conducted toassess the characteristic performance and durability of dif-ferent components of the unit (e.g. the SOFC stack, the fuelpre-reformer and air heat exchangers). The evolution ofabsolute voltage drop of the stack over time is found to be of
the same magnitude when compared to short stack experi-ments. Thus, other system components are not observed tocause an increase in the characteristic voltage drop of thestack. Two BoP-components, the afterburner and the powerconversion unit failed to operate as designed. The perfor-mance of other BoP-components i.e. fuel pre-reformer andheat exchangers were satisfactory during the test run, andno significant performance loss could be measured.
Keywords: Balance of Plant, Durability, ExperimentalResults, Solid Oxide Fuel Cell, Stack, Voltage Degradation
440 © 2010 WILEY-VCH Verlag GmbH & Co. KGaA, Weinheim FUEL CELLS 10, 2010, No. 3, 440–452
ORIG
INAL
RES
EARCH
PAPER
DOI: 10.1002/fuce.200900152

I/2 I/3
M. Halinen et al.: Experimental Analysis on Performance and Durability of SOFC Demonstration Unit
replacements of different components easy. Thus, the unitwas not designed to be thermally self-sufficient. Componentsand piping that operated above the room temperature wereinsulated with ceramic fibre insulation felts (isoTHERM S)and mineral wool sleeves. Additionally, the heat loss in thepipelines between the heat exchangers, the reformer unit andthe stack was compensated with electric trace heating ele-ments. Furthermore, it was necessary to position the SOFCstack in a furnace to make the assembly and curing of thestack possible on-site. The furnace was also used for start-upand to influence the temperature of the stack during systemoperation. Heating elements were used in the fuel system tovaporise the water and preheat the gas before the reformerreactor.
In order to collect relevant measurement information ofthe different components of the system, temperature andpressure were measured at several positions at the fuel andair systems. At the fuel system, temperature was measured atpositions f2–f7 and f9–f13, and pressure at positions f1, f2, f7,f8, f11 and f12, depicted in Figure 1. At the air system, thetemperature was measured at positions a1-a8 and the pres-sure at positions a1, a3, a6 and a8. Thermocouples (K-type,Class 1, ± 4 °C) were used for all temperature measurements.Pressure was measured with digital differential pressuremeters (0–1,000 ± 3 mbarg, Keller PR-33).
The SOFC stack used in the unit was designed, manufac-tured and assembled by Forschungzentrum Jülich (FZJ) [14].It utilised planar anode-supported cells with metallic inter-connect plates made from CroFer22APU steel, which werecoated with a MnOx/LCC10 contact layer at the air side.Glass-ceramic seals (Glass #76) were used to seal the stack.Fuel and air were distributed to cells in counter-flow patternwith internal manifold [15]. The 5 kW class stack used in theexperiments consisted of 50 rectangular unit cells with anactive area of 361 cm2. The stack was resting on top of cera-mic bricks inside the furnace. The inner dimensions of thefurnace were 1,100 mm × 1,100 mm, the inner height was640 mm and the thickness of the insulation layer was150 mm. The heating elements of the furnace were situatedon two opposite sides of the furnace. Current was collectedfrom the end plates of the stack with steel bars that were ledthrough the bottom of the furnace. Gas pipelines were, like-wise, led through the bottom of the furnace.
The voltage was measured individually from all 50 unitcells in the stack with platinum wires that were spot-weldedto the interconnect plates and end plates of the stack. Themaximum error for the voltage measurements was ±9 mV.The flow-wise temperature profile was measured from inter-connect plates situated above cells 3, 25 and 48, counting fromthe bottom of the stack. Thermocouples (K-type, Class 1) wereused for the temperature measurements. The thermocoupleswere inserted inside 35 mm deep holes in the interconnectplates. In addition, the inlet and outlet temperatures of thefuel and air were measured from the pipeline ∼10 cm frombottom plate of the stack (positions a4, a5, f9 and f10 in Fig-ure 1).
2.2 Fuel System
The conventional nickel-cermet anode used in SOFCs is aneffective steam-reforming catalyst, and therefore, able to con-vert hydrocarbons to hydrogen and carbon monoxide thatcan be utilised in electrochemical reactions. However, com-plete internal reforming can lead to local cooling at the fuelinlet area caused by a fast endothermic steam reforming reac-tions, and large temperature gradients can develop whichmay lead to cell cracking. Additionally, heating the fueldirectly to operating temperature of the stack without pre-reforming of the fuel at lower temperatures increases theprobability of hydrocarbon cracking and carbon formation inthe heat exchangers or pipelines [16]. Without pre-reforming,some higher hydrocarbons can coke the nickel substrate atthe anode electrode resulting in performance degradationand ultimately destruction of the cell [17, 18]. Due to theabove-mentioned issues, prereforming of hydrocarbon fuelsis usually necessary.
With natural gas, where the methane is the main constitu-ent of the fuel, the degree of pre-reforming (DoR) of methaneshould be selected to optimise system-operating conditions.At nominal operating conditions, it is beneficial to maximisethe amount of internal reforming reactions as the endother-mic steam reforming of methane cools down the stack anddecreases the need for surplus cathode air, which improveselectrical efficiency [19]. At part-load and system stand-bysituations, the amount of heat losses from the system isincreased with respect to the heat produced by the stack.Therefore, in these situations, it may be beneficial to increasethe DoR and limit the amount of methane fed into the stack[13]. As a result, the temperature and the voltage of the stackare increased, which can improve the system efficiency.
The reformer unit for natural gas used in the system couldbe operated at steam reforming conditions and, additionally,air could be supplied into the reactor to utilise exothermicpartial oxidation reactions [20–22]. It consisted of mass flowcontrollers for natural gas (0–35.0 ± 0.5 lN min–1), water(0–80 ± 1 g min–1) and air (0–60.0 ± 0.7 lN min–1), sulphurremoval reactor, vaporiser, preheater, reactor chamberequipped with a proprietary monolithic catalyst (Süd-Che-mie) and a heat exchanger before the stack. The natural gasused in Finland contains 4–10 ppm of sulphur containingTHT odorant, and if not removed from the natural gas, it candeactivate the anode, lower the cell voltage and causeincreased degradation [20]. The THT odourant was removedwith an absorbent (Süd-Chemie) operating at room tempera-ture. The adsorbent was changed on regular basis to keep thefuel supply free of sulphur. Concurrently, the impurities inthe water supply were removed with ion-exchange resin.Natural gas and water were fed through a gas atomising noz-zle into the vaporisation chamber. The supply pressure fornatural gas and water was ∼3 barg. Air was fed into thevaporisation chamber through a separate inlet. The reactorand the catalyst were not heated during operation. The heatused in the steam reforming reaction was provided by pre-
ORIG
INAL
RES
EARCH
PAPER
442 © 2010 WILEY-VCH Verlag GmbH & Co. KGaA, Weinheim FUEL CELLS 10, 2010, No. 3, 440–452www.fuelcells.wiley-vch.de
M. Halinen et al.: Experimental Analysis on Performance and Durability of SOFC Demonstration Unit
span up to and over 10,000 h with degradation rates below1% kh–1 have been reported [3–5].
In addition to the SOFC stack, also the other componentsof the system, and the system as a whole, must endureyears of continuous operation without unreasonable perfor-mance degradation or component failures. In the absence oflarge-scale production of dedicated components and periph-erals for SOFC systems, the lifetime and performance of sys-tem components are not well established. Operation times ofover thousands of hours for complete SOFC systems with avarying degree of availability have been achieved andreported [3, 6–9]. However, the level of reporting is typicallyvery general and no information is given on the fundamentalprocess parameters such as fuel and air utilisation, orcurrent density during the operation of the system. Addition-ally, the effect of different system components on the perfor-mance and durability of the system as a whole is notassessed.
It can be argued that a more comprehensive understand-ing of issues related to the reliability and durability of SOFCsystems is needed in order to attain similar operation timesand degradation rates for complete SOFC systems when com-pared to the lifetime of individual stacks. Therefore, long-term experiments with complete SOFC systems are needed tomeasure and determine the effect of system components onthe degradation and lifetime of SOFC stack. In this paper, thetechnical design and experimental analysis of a SOFC demon-stration unit are presented. The unit was designed and con-structed in a Finnish publicly funded SOFC research anddevelopment programme, which consisted of system andBoP-component development, system modelling and charac-terisation of SOFC cells and short stacks in system relevantoperating conditions [10, 13, 20, 24]. The unit was constructed
in order to demonstrate SOFC technology and assess the per-formance, durability and reliability of a complete grid con-nected SOFC system with natural gas as the fuel [10]. More-over, the experimental results obtained with the unit could beused to develop and validate modelling tools for SOFC sys-tems [11–13]. Results from a 7,000 h test run with a 5 kWpower class stack are presented. Characteristic performanceand durability of different system components e.g. fuelprocessing unit, heat exchangers, and the SOFC stack arereported.
2 Experimental2.1 System Layout and the SOFC Stack
The demonstration unit included all the most importantbalance of plant components (BoP) of a SOFC system i.e. aplanar stack, fuel pre-reformer unit, power conversion andgrid interconnection equipment, heat exchangers for air andfuel, a catalytic burner, a blower for cathode air and massflow controllers for other reactants, automation and controlsystem, and purge gas containers for system shutdown andstart-up situations (Figure 1).
The unit was constructed in order to demonstrate SOFCtechnology, assess the durability and reliability of SOFCstacks and BoP-components with long-term testing for sever-al thousands of hours and to study the characteristic perfor-mance of different components and the interactions betweenthe components. In order to obtain characteristic measure-ment data from individual components, a non-integrateddesign was applied. The intention with the non-integrateddesign was to reduce the effect of surface-to-surface heattransfer between components and to make modifications and
Exhaust
Afterburner
Water
Furnace
Air
Electricgrid
SOFCstack
Vaporizer
Preheater
Reformerreactor
Heatexchangers
Powerconversion
Blower
Exhaust
NG
Water
Air
DC
AC
Air
Desulphurizer
a2a1 a5
a6a7
a4a3
a8
f10
f2
f1
f5
f6
f7
f4f3
f8 f9
f11f12
f13
H2
Water
N2
Fig. 1 Principle layout of the SOFC demonstration unit. Numbered circles represent measurement positions at the air and fuel systems of the unit.
ORIG
INAL
RES
EARCH
PAPER
FUEL CELLS 10, 2010, No. 3, 440–452 © 2010 WILEY-VCH Verlag GmbH & Co. KGaA, Weinheim 441www.fuelcells.wiley-vch.de

I/4 I/5
M. Halinen et al.: Experimental Analysis on Performance and Durability of SOFC Demonstration Unit
conversion unit was manufactured from off-the-shelf components by Verteco Inc. Electric currentfrom the stack to the power conversion unit wasmeasured using a shunt resistor (Metrix Electronics)with a maximum error of ±0.7 A. Alternatively, thestack could be operated without the power conver-sion unit by dissipating the produced electricitywith a DC load (Chroma 63203) e.g. during initialcharacterisation of the stacks with hydrogen as afuel. The DC load was connected parallel to thestack with grid interconnection equipment. Themaximum error for the current measurement of theDC load was ±1.2 A.
In order to provide the capability for long termtesting in a safe and reliable way, the demonstrationunit was designed to be capable of unmannedoperation. This was made viable by constructing anautomation and control system, which consisted ofa standard industrial PLC (Schneider Premium Ser-ies) and a PC-based monitoring station. The PC-based monitoring station was used as a human-machine-interface and as a measurement database.During unmanned operation, several critical pro-cess measurements i.e. individual cell voltages, tem-perature of the inlet and outlet gases of the stack,supply pressure of the reactants, air blower orpower conditioning faults, temperature of the refor-mer reactor and system-wide pressure measure-ments were used to monitor the safe operatingconditions of the unit. If the critical process mea-surements deviated beyond predefined limits, theunit was brought to a stand-by state by disconnect-ing the stack from the electric grid and aborting thefuel feed to the unit. Air and safety gas containing97% Ar and 3% H2 were supplied from gas bottles to therespective sides of the unit to keep the anode at reducing andcathode at oxidising atmosphere. The gas flow through thesystem during emergency shutdown situations was set to be∼1 lN min–1.
3 Results and Discussion3.1 Performance and Durability of the Stack
A long-term test run for a total period of 7,000 h was con-ducted with the demonstration unit, during which the stackwas electrically loaded for over 6,000 h. During the experi-ment, the system was operated both at steady-state operatingconditions, to assess the durability of the stack and BoP-com-ponents, and at varying operating conditions, to measure thecharacteristic operation of the unit components. The gross DCpower (Pel,stack) of the stack along with the gross DC effi-ciency (gel,stack), the current density, the air utilisation (UAIR)and the degree of pre-reforming (DoR) of the fed methane(98% in natural gas) during the experiment are depicted inFigure 2. During the first 500 h of the experiment, fuel utilisa-
tion (UFUEL) of the stack was 51%. During 500 to 4,500 h,UFUEL was kept at 71% and the current density at 0.35 A cm–2
in order to measure the durability of the unit at nominal oper-ating conditions. During this period, the Pel,stack was between4.5 and 5 kW and the gel,stack between 45 and 50%, dependingon the operating parameters and duration of the experiment.After 4,500 h, the unit was used at lower current densities tomeasure the performance at part-load conditions at 0.2–0.25 A cm–2, and also at lower operating temperature. Until5,900 h, temperature of the furnace was kept at 780 °C duringwhich gel,stack of 50% was achieved at part-load operatingconditions. After 5,900 h, furnace temperature was decreasedto 730 °C and a lower gel,stack of 40–45% was measured due todecreased stack voltage. At the end of the long term testing,at 7,000 h, the stack was insulated and the unit was operatedwithout heating of the furnace in order to measure the effectof varying DoR to the temperature, voltage and effciency ofthe stack.
The demonstration unit and the stack could be operatedover a wide range of operating conditions. During the experi-ment, the DoR varied between 0.1 and 0.9, UFUEL between0.51 and 0.71 and UAIR between 0.17 and 0.68 when the cur-
0 1000 2000 3000 4000 5000 6000 70000123456
a)
P el,st
ack /
kW
Time / h
#1 #2 #3 #4 #5 #6
0 1000 2000 3000 4000 5000 6000 70000
0.1
0.2
0.3
0.4
0.5b)
j / A
cm−2
& η
el,st
ack
Time / h
ηel,stack
j
0 1000 2000 3000 4000 5000 6000 70000
0.2
0.4
0.6
0.8
1c)
UA
IR &
DoR
Time / h
UAIR
DoR
Fig. 2 Operating conditions of the demonstration unit and the electric power of thestack during the experiment. a) Gross electric power of the stack (Pel,stack). b) currentdensity (j, dashed line) and gross electric efficiency (gel,stack, solid line). c) Air utilisa-tion (UAIR, solid line) and degree of pre-reforming (DoR, dashed line). Shutdown situa-tions are marked with numbers in the top figure.
ORIG
INAL
RES
EARCH
PAPER
444 © 2010 WILEY-VCH Verlag GmbH & Co. KGaA, Weinheim FUEL CELLS 10, 2010, No. 3, 440–452www.fuelcells.wiley-vch.de
M. Halinen et al.: Experimental Analysis on Performance and Durability of SOFC Demonstration Unit
heating the inlet gases with electric heaters. Additionally,heat was supplied to the reactor by exothermic partial oxida-tion reactions when air was fed to the reformer unit. Temper-ature was measured at the reactor inlet, from the leading sur-face of the catalyst and at the reactor outlet (positions f4, f5and f6 in Figure 1). Pressure was measured from the naturalgas inlet before the gas atomising nozzle and from the vapori-sation chamber (positions f1 and f2). A heat exchanger wassituated between the reactor and the stack in order to increasethe temperature of the fuel before the stack inlet. The heatexchanger was of a welded plate type and it was manufac-tured in-house. Temperature (positions f7, f8 and f11) andpressure (positions f7, f8, f10 and f11) were measured beforeand after the heat exchanger. Steel grade 1.4404 was used forthe vaporiser and steel grade 1.4835 was used for all othercomponents and piping at the fuel system of the demonstra-tion unit.
Reformer exhaust gas was analysed with an online gasanalyser (Sick S710 series) and with gas chromatographs (HP6850A and HP 5890 Series II). The accuracy of the online ana-lyser was further improved by calibrating it with varying gasmixture that correspond the different compositions of theexhaust gas. After calibration, the accuracy of the online ana-lyser was ±0.5% for CO, CO2 and CH4 and ±1% for H2. Thecomposition of the exhaust gas on wet basis was calculatedon the basis of carbon and nitrogen mass balances solvedwith the inlet mass flow measurements for air, water and nat-ural gas and with exhaust gas analysis.
The unit could also be operated with gas mixturecontaining hydrogen (0–70.0 ± 0.8 lN min–1), nitrogen(0–70.0 ± 0.8 lN min–1) and steam (0–200 ± 2 gh–1). Water wasevaporated and mixed with gases by using a temperature-controlled evaporative mixer (Bronkhorst CEM-202). The gasmixture could be used to reduce the anode substrate after thestack assembly, as fuel during system operation and as purgegas during the heating and cooling of the unit to keep theanode substrate at reducing atmosphere.
Unused fuel in the anode exhaust gas was oxidised withair in a catalytic burner. The burner consisted of four succes-sive segments equipped with cylindrical monolith catalysts.The burner and catalysts were manufactured in-house.Each catalyst segment had an individual air inlet. Air wassupplied to the burner with a thermal mass flow controller(0–500 ± 6 lN min–1) and divided between the segments withrotameters. Downstream from the burner, the exhaust gaswas fed through a water-cooled heat exchanger in order toretrieve the heat and condensate the water vapour before theexhaust.
2.3 Air System
Ambient air provides the source of oxygen, which isneeded for electrochemical reactions at the cathode, and theair can be fed into the stack e.g. with air blowers. The use ofover-stoichiometric amounts of air is necessary to dissipatethe heat produced by the SOFC stack under electrical loading
and prevent overheating of the stack to excessive operatingtemperatures. The inlet ambient air has to be preheated closerto the operating temperature of the stack to avoid local cool-ing of the stack at the air inlet, which could cause damagingtemperature gradients or decrease the stack voltage underelectric current by lowering the operating temperature [16].The needed over-stoichiometric amount of air can varybetween 3 and 10 (UAIR between 0.10 and 0.33) depending onthe DoR and the permissible temperature increase of air inthe stack [19]. Such amounts of air lead to large air preheatduty and the energy needed for preheating must be recuper-ated from the stack’s exhaust gases in order to achieve practi-cal system efficiencies.
Ambient air was supplied to the unit with two-side chan-nel blowers connected mechanically into series (Ventur SC-20C). Two blowers were used to reach pressures above300 mbar. A filter was present at the blower inlet to removeparticles from the air. Rotation speed of the blower was con-trolled with an inverter and the air flow was measured with athermal mass flow metre (0–1,000 ± 20 lN min–1). Two heatexchangers for low and high temperature were connected inseries in order to pre-heat inlet air to the stack. The designwith two heat exchangers was chosen for the air system inorder to reduce the temperature difference between the inletand outlet and thus the thermal stresses induced to the heatexchangers. Concurrently, poor commercial availability ofsingle heat exchanger that would meet the specified operat-ing temperature necessitated this approach.
The low temperature heat exchanger was of a fully weldedplate type (Raucell 120-23). Maximum operating temperaturefor this heat exchanger was designed to be below 450 °C. Thehigh temperature heat exchanger was of a tube and shell typedesigned and manufactured in-house, and the maximumoperating temperature was designed to be below 800 °C. Steelgrades used in the construction of the heat exchangers were1.4404 and 1.4835 for lower and higher operating tempera-ture, respectively. Temperature was measured before, afterand between the heat exchangers at cold and hot sides (posi-tions a1, a2, a3, a6, a7 and a8 in Figure 1). Pressure was mea-sured before and after the two heat exchangers at hot andcold sides (positions a1, a3, a6, and a8).
2.4 Power Conditioning Equipment and Automation System
Power conditioning equipment is needed in SOFC systemsin order to increase the stack’s DC voltage high enough toenable high efficiency DC power conversion to AC powerand synchronisation with the electricity grid. Power condi-tioning and grid interconnection equipment consisted of DC–DC converters, regenerative inverter, LC-filter and transfor-mer. DC–DC converters were used to increase the voltage ofthe SOFC stack to ∼400 VDC required by the inverter. Theinverter transmuted DC to 200 VAC. A LC-filter was used tocompensate the possible current and voltage disturbancefrom the system to electric grid. Finally, a transformer wasused to increase the voltage from 200 to 400 VAC. The power
ORIG
INAL
RES
EARCH
PAPER
FUEL CELLS 10, 2010, No. 3, 440–452 © 2010 WILEY-VCH Verlag GmbH & Co. KGaA, Weinheim 443www.fuelcells.wiley-vch.de

I/6 I/7
M. Halinen et al.: Experimental Analysis on Performance and Durability of SOFC Demonstration Unit
can be due to differing contact resistances caused by inhomo-geneous settling of the stack during the stack assembly andcuring.
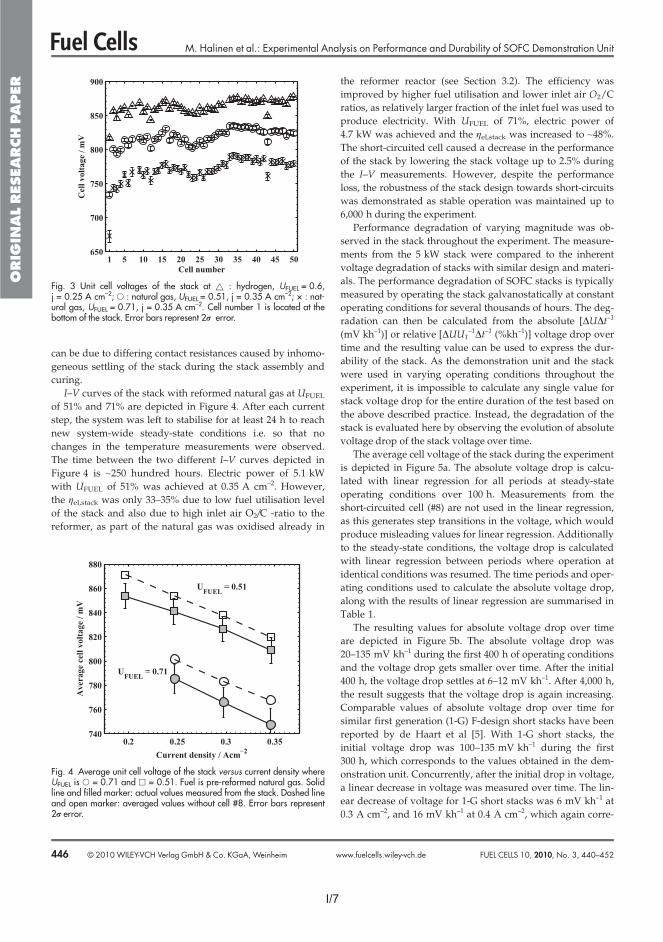
I–V curves of the stack with reformed natural gas at UFUEL
of 51% and 71% are depicted in Figure 4. After each currentstep, the system was left to stabilise for at least 24 h to reachnew system-wide steady-state conditions i.e. so that nochanges in the temperature measurements were observed.The time between the two different I–V curves depicted inFigure 4 is ∼250 hundred hours. Electric power of 5.1 kWwith UFUEL of 51% was achieved at 0.35 A cm–2. However,the gel,stack was only 33–35% due to low fuel utilisation levelof the stack and also due to high inlet air O2/C -ratio to thereformer, as part of the natural gas was oxidised already in
the reformer reactor (see Section 3.2). The efficiency wasimproved by higher fuel utilisation and lower inlet air O2/Cratios, as relatively larger fraction of the inlet fuel was used toproduce electricity. With UFUEL of 71%, electric power of4.7 kW was achieved and the gel,stack was increased to ∼48%.The short-circuited cell caused a decrease in the performanceof the stack by lowering the stack voltage up to 2.5% duringthe I–V measurements. However, despite the performanceloss, the robustness of the stack design towards short-circuitswas demonstrated as stable operation was maintained up to6,000 h during the experiment.
Performance degradation of varying magnitude was ob-served in the stack throughout the experiment. The measure-ments from the 5 kW stack were compared to the inherentvoltage degradation of stacks with similar design and materi-als. The performance degradation of SOFC stacks is typicallymeasured by operating the stack galvanostatically at constantoperating conditions for several thousands of hours. The deg-radation can then be calculated from the absolute [DUDt–1
(mV kh–1)] or relative [DUU1–1Dt–1 (%kh–1)] voltage drop over
time and the resulting value can be used to express the dur-ability of the stack. As the demonstration unit and the stackwere used in varying operating conditions throughout theexperiment, it is impossible to calculate any single value forstack voltage drop for the entire duration of the test based onthe above described practice. Instead, the degradation of thestack is evaluated here by observing the evolution of absolutevoltage drop of the stack voltage over time.
The average cell voltage of the stack during the experimentis depicted in Figure 5a. The absolute voltage drop is calcu-lated with linear regression for all periods at steady-stateoperating conditions over 100 h. Measurements from theshort-circuited cell (#8) are not used in the linear regression,as this generates step transitions in the voltage, which wouldproduce misleading values for linear regression. Additionallyto the steady-state conditions, the voltage drop is calculatedwith linear regression between periods where operation atidentical conditions was resumed. The time periods and oper-ating conditions used to calculate the absolute voltage drop,along with the results of linear regression are summarised inTable 1.
The resulting values for absolute voltage drop over timeare depicted in Figure 5b. The absolute voltage drop was20–135 mV kh–1 during the first 400 h of operating conditionsand the voltage drop gets smaller over time. After the initial400 h, the voltage drop settles at 6–12 mV kh–1. After 4,000 h,the result suggests that the voltage drop is again increasing.Comparable values of absolute voltage drop over time forsimilar first generation (1-G) F-design short stacks have beenreported by de Haart et al [5]. With 1-G short stacks, theinitial voltage drop was 100–135 mV kh–1 during the first300 h, which corresponds to the values obtained in the dem-onstration unit. Concurrently, after the initial drop in voltage,a linear decrease in voltage was measured over time. The lin-ear decrease of voltage for 1-G short stacks was 6 mV kh–1 at0.3 A cm–2, and 16 mV kh–1 at 0.4 A cm–2, which again corre-
1 5 10 15 20 25 30 35 40 45 50650
700
750
800
850
900
Cell number
Cel
l vol
tage
/ m
V
Fig. 3 Unit cell voltages of the stack at � : hydrogen, UFUEL = 0.6,j = 0.25 A cm–2; � : natural gas, UFUEL = 0.51, j = 0.35 A cm–2; × : nat-ural gas, UFUEL = 0.71, j = 0.35 A cm–2. Cell number 1 is located at thebottom of the stack. Error bars represent 2r error.
0.2 0.25 0.3 0.35740
760
780
800
820
840
860
880
Ave
rage
cel
l vol
tage
/ m
VCurrent density / Acm−2
UFUEL = 0.71
UFUEL = 0.51
Fig. 4 Average unit cell voltage of the stack versus current density whereUFUEL is � = 0.71 and � = 0.51. Fuel is pre-reformed natural gas. Solidline and filled marker: actual values measured from the stack. Dashed lineand open marker: averaged values without cell #8. Error bars represent2r error.
ORIG
INAL
RES
EARCH
PAPER
446 © 2010 WILEY-VCH Verlag GmbH & Co. KGaA, Weinheim FUEL CELLS 10, 2010, No. 3, 440–452www.fuelcells.wiley-vch.de
M. Halinen et al.: Experimental Analysis on Performance and Durability of SOFC Demonstration Unit
rent density was at or above 0.2 A cm–2. For the major part ofthe test, when the furnace was in use, varying the DoR didnot result in significant changes in the temperature or voltageof stack, and the stack could be operated with DoR of 0.1between 0.25 and 0.35 A cm–2. At the end of the long termtesting, when the furnace was not in use, a more pronouncedeffect of the DoR was observed, and DoR below 0.5 could notbe achieved with 0.2 A cm–2. This was due to the temperaturesmoothing effect of the furnace because of its high heat trans-fer area: the higher the temperature of the stack was withrespect to the furnace temperature, the higher were the heatlosses from the stack and vice versa. Therefore, the use of fur-nace affected the thermal balance of the stack to a great extentand provided an increased operability for the system, whichwould not have been possible without the furnace. It was ob-served that at low UAIR values, the stack voltage decreased asthe temperature of the stack was decreased due to increasedair flow rate (Figure 2, 3,000–3,500 h). Interestingly, the oper-ability of the stack was maintained at high UAIR (above 0.33[19]) values and no overheating of the stack occurred. Thiscan be explained again by the use of furnace during theexperiment.
As can be seen in Figure 2, the experiment was interruptedand the electric loading of the stack discontinued severaltimes during the test run. Shutdown #1 at 2,200 h wasinitiated due to system servicing. The system was brought toa standby state and switched to hydrogen-nitrogen purge gasin order to clean the atomising nozzle of the fuel processor.The nozzle was clogged due to saturation of the ion-exchangeresin, and the impurities present in the water deposited at theorifice of the nozzle. This induced a pressure drop increaseover the nozzle (between f1 and f2), which would have even-tually hindered the fuel and water flow to the fuel processingunit. As the ion-exchange mass was changed on a more regu-lar basis based on the conductivity measurement of the water,clogging was not observed later during the experiment. Shut-down #2 at 4,500 h, occurred automatically due to supply fail-ure of the natural gas and the system was brought to emer-gency shutdown. The fuel and air feeds were immediatelydiscontinued and the unit was purged with a safety gas fromgas bottles. Shutdowns #3 and #4 at 5,800 and 6,100 h, respec-tively, occurred automatically due to high pressure and lowvoltage alarms caused by partially frozen exhaust pipeline.The dew point of the anode exhaust gas after heat recoveryand condensation was ∼10 °C and the coincident outside tem-perature was –20 °C. As a result, the water vapour left in theexhaust gas froze in the exhaust pipeline obstructing the gasflow. The problem was solved by installing an electric traceheater to the exhaust pipeline.
After each of the above-mentioned shutdown situations,the individual cell voltages were compared at identical oper-ating conditions with respect to current density, UFUEL, UAIR,DoR and furnace and stack temperature. The differencebetween individual cell voltages was at maximum ±20 mVbefore and after each shutdown, as some of the cells exhibitedan increase in voltage. An exception to this was after the shut-
down #3 at 5,800 h, where the flow of air purge gas was cutoff for 3 h, due to exhaustion of purge air container, resultingin a significant loss of performance in cells number 1 and 7.With respect to these results, it can be concluded that theshutdown routines developed for the unit, if executed in a de-signed manner, along with a robust enough stack design,were sufficient to bring the system down safely without rele-vant decrease in the performance.
The shutdown #5 at 6,400 h was initiated to cool down thestack to room temperature to assemble insulation layer as theadjacent cells to cell #8 had already started to show progres-sive decrease in voltage after the shutdown at 5,800 h. Thestack was then insulated with microporous insulation layer,heated back up to operating temperature mainly by pre-heat-ing the inlet gases of the stack, and operated for another∼200 h. During this time, the effect of DoR on the tempera-ture, voltage and efficiency of the stack was measured with-out external heating of the furnace. The final shutdown #6 at7,400 h was initiated automatically due to progressive fail-ures of the cells adjacent to short-circuited cell #8, which ledto increasing leakages between the fuel and air sides of thestack and excessive temperatures, both in the stack and at theexhaust pipeline due to the burning of the fuel. This was seenas a catastrophic failure of the stack.
Additionally, between 2,500 and 3,500 h recurring difficul-ties related to the control of the inlet cathode air flow causeda steady increase in the inlet air flow, which manifests as adecrease of UAIR in Figure 2. As a result of increased inlet air,the stack was cooled down progressively and the tempera-ture and voltage of the stack were decreased. This decrease involtage is seen as a decrease in Pel,stack in Figure 2, as thestack was used with constant current density. The problemwas solved by reconfiguring the control loop for cathode air,and thus a steady supply of air was restored.
Polarisation of the 5 kW stack was measured with hydro-gen immediately after assembly and curing. After the curingand evaluation of stack performance with hydrogen, the unitand the stack were cooled down to ambient temperature forinspection and heated back to operating temperature to com-mence the experiments. Individual cell voltages of the stackwith hydrogen at current density of 0.25 A cm–2 are depictedin Figure 3. Additionally, individual cell voltages measuredduring the experiment with reformed natural gas at0.35 A cm–2 are shown for comparison. The distribution of in-dividual cell voltages is identical with hydrogen and refor-mate gas i.e. the initial thermal cycle did not cause changes inthe voltage distribution. Voltage of the cell #1 (bottom cell)was 50–100 mV lower compared to the other cells, and short-circuit was measured in the cell #8. The other cell voltageswere within ±25 mV and similar values have been reportedpreviously for FZJ stacks [23]. A slight increase in the voltageis observed towards the top of the stack, which is probablycaused by the heating effect of the furnace, and due to theheat loss through the ceramic bricks at the bottom of the fur-nace. The differences between individual cell voltages, whichare more pronounced in the middle of the stack (cells 20–30),
ORIG
INAL
RES
EARCH
PAPER
FUEL CELLS 10, 2010, No. 3, 440–452 © 2010 WILEY-VCH Verlag GmbH & Co. KGaA, Weinheim 445www.fuelcells.wiley-vch.de
I/6 I/7
M. Halinen et al.: Experimental Analysis on Performance and Durability of SOFC Demonstration Unit
can be due to differing contact resistances caused by inhomo-geneous settling of the stack during the stack assembly andcuring.
I–V curves of the stack with reformed natural gas at UFUEL
of 51% and 71% are depicted in Figure 4. After each currentstep, the system was left to stabilise for at least 24 h to reachnew system-wide steady-state conditions i.e. so that nochanges in the temperature measurements were observed.The time between the two different I–V curves depicted inFigure 4 is ∼250 hundred hours. Electric power of 5.1 kWwith UFUEL of 51% was achieved at 0.35 A cm–2. However,the gel,stack was only 33–35% due to low fuel utilisation levelof the stack and also due to high inlet air O2/C -ratio to thereformer, as part of the natural gas was oxidised already in
the reformer reactor (see Section 3.2). The efficiency wasimproved by higher fuel utilisation and lower inlet air O2/Cratios, as relatively larger fraction of the inlet fuel was used toproduce electricity. With UFUEL of 71%, electric power of4.7 kW was achieved and the gel,stack was increased to ∼48%.The short-circuited cell caused a decrease in the performanceof the stack by lowering the stack voltage up to 2.5% duringthe I–V measurements. However, despite the performanceloss, the robustness of the stack design towards short-circuitswas demonstrated as stable operation was maintained up to6,000 h during the experiment.
Performance degradation of varying magnitude was ob-served in the stack throughout the experiment. The measure-ments from the 5 kW stack were compared to the inherentvoltage degradation of stacks with similar design and materi-als. The performance degradation of SOFC stacks is typicallymeasured by operating the stack galvanostatically at constantoperating conditions for several thousands of hours. The deg-radation can then be calculated from the absolute [DUDt–1
(mV kh–1)] or relative [DUU1–1Dt–1 (%kh–1)] voltage drop over
time and the resulting value can be used to express the dur-ability of the stack. As the demonstration unit and the stackwere used in varying operating conditions throughout theexperiment, it is impossible to calculate any single value forstack voltage drop for the entire duration of the test based onthe above described practice. Instead, the degradation of thestack is evaluated here by observing the evolution of absolutevoltage drop of the stack voltage over time.
The average cell voltage of the stack during the experimentis depicted in Figure 5a. The absolute voltage drop is calcu-lated with linear regression for all periods at steady-stateoperating conditions over 100 h. Measurements from theshort-circuited cell (#8) are not used in the linear regression,as this generates step transitions in the voltage, which wouldproduce misleading values for linear regression. Additionallyto the steady-state conditions, the voltage drop is calculatedwith linear regression between periods where operation atidentical conditions was resumed. The time periods and oper-ating conditions used to calculate the absolute voltage drop,along with the results of linear regression are summarised inTable 1.
The resulting values for absolute voltage drop over timeare depicted in Figure 5b. The absolute voltage drop was20–135 mV kh–1 during the first 400 h of operating conditionsand the voltage drop gets smaller over time. After the initial400 h, the voltage drop settles at 6–12 mV kh–1. After 4,000 h,the result suggests that the voltage drop is again increasing.Comparable values of absolute voltage drop over time forsimilar first generation (1-G) F-design short stacks have beenreported by de Haart et al [5]. With 1-G short stacks, theinitial voltage drop was 100–135 mV kh–1 during the first300 h, which corresponds to the values obtained in the dem-onstration unit. Concurrently, after the initial drop in voltage,a linear decrease in voltage was measured over time. The lin-ear decrease of voltage for 1-G short stacks was 6 mV kh–1 at0.3 A cm–2, and 16 mV kh–1 at 0.4 A cm–2, which again corre-
1 5 10 15 20 25 30 35 40 45 50650
700
750
800
850
900
Cell number
Cel
l vol
tage
/ m
V
Fig. 3 Unit cell voltages of the stack at � : hydrogen, UFUEL = 0.6,j = 0.25 A cm–2; � : natural gas, UFUEL = 0.51, j = 0.35 A cm–2; × : nat-ural gas, UFUEL = 0.71, j = 0.35 A cm–2. Cell number 1 is located at thebottom of the stack. Error bars represent 2r error.
0.2 0.25 0.3 0.35740
760
780
800
820
840
860
880
Ave
rage
cel
l vol
tage
/ m
V
Current density / Acm−2
UFUEL = 0.71
UFUEL = 0.51
Fig. 4 Average unit cell voltage of the stack versus current density whereUFUEL is � = 0.71 and � = 0.51. Fuel is pre-reformed natural gas. Solidline and filled marker: actual values measured from the stack. Dashed lineand open marker: averaged values without cell #8. Error bars represent2r error.
ORIG
INAL
RES
EARCH
PAPER
446 © 2010 WILEY-VCH Verlag GmbH & Co. KGaA, Weinheim FUEL CELLS 10, 2010, No. 3, 440–452www.fuelcells.wiley-vch.de
M. Halinen et al.: Experimental Analysis on Performance and Durability of SOFC Demonstration Unit
rent density was at or above 0.2 A cm–2. For the major part ofthe test, when the furnace was in use, varying the DoR didnot result in significant changes in the temperature or voltageof stack, and the stack could be operated with DoR of 0.1between 0.25 and 0.35 A cm–2. At the end of the long termtesting, when the furnace was not in use, a more pronouncedeffect of the DoR was observed, and DoR below 0.5 could notbe achieved with 0.2 A cm–2. This was due to the temperaturesmoothing effect of the furnace because of its high heat trans-fer area: the higher the temperature of the stack was withrespect to the furnace temperature, the higher were the heatlosses from the stack and vice versa. Therefore, the use of fur-nace affected the thermal balance of the stack to a great extentand provided an increased operability for the system, whichwould not have been possible without the furnace. It was ob-served that at low UAIR values, the stack voltage decreased asthe temperature of the stack was decreased due to increasedair flow rate (Figure 2, 3,000–3,500 h). Interestingly, the oper-ability of the stack was maintained at high UAIR (above 0.33[19]) values and no overheating of the stack occurred. Thiscan be explained again by the use of furnace during theexperiment.
As can be seen in Figure 2, the experiment was interruptedand the electric loading of the stack discontinued severaltimes during the test run. Shutdown #1 at 2,200 h wasinitiated due to system servicing. The system was brought toa standby state and switched to hydrogen-nitrogen purge gasin order to clean the atomising nozzle of the fuel processor.The nozzle was clogged due to saturation of the ion-exchangeresin, and the impurities present in the water deposited at theorifice of the nozzle. This induced a pressure drop increaseover the nozzle (between f1 and f2), which would have even-tually hindered the fuel and water flow to the fuel processingunit. As the ion-exchange mass was changed on a more regu-lar basis based on the conductivity measurement of the water,clogging was not observed later during the experiment. Shut-down #2 at 4,500 h, occurred automatically due to supply fail-ure of the natural gas and the system was brought to emer-gency shutdown. The fuel and air feeds were immediatelydiscontinued and the unit was purged with a safety gas fromgas bottles. Shutdowns #3 and #4 at 5,800 and 6,100 h, respec-tively, occurred automatically due to high pressure and lowvoltage alarms caused by partially frozen exhaust pipeline.The dew point of the anode exhaust gas after heat recoveryand condensation was ∼10 °C and the coincident outside tem-perature was –20 °C. As a result, the water vapour left in theexhaust gas froze in the exhaust pipeline obstructing the gasflow. The problem was solved by installing an electric traceheater to the exhaust pipeline.
After each of the above-mentioned shutdown situations,the individual cell voltages were compared at identical oper-ating conditions with respect to current density, UFUEL, UAIR,DoR and furnace and stack temperature. The differencebetween individual cell voltages was at maximum ±20 mVbefore and after each shutdown, as some of the cells exhibitedan increase in voltage. An exception to this was after the shut-
down #3 at 5,800 h, where the flow of air purge gas was cutoff for 3 h, due to exhaustion of purge air container, resultingin a significant loss of performance in cells number 1 and 7.With respect to these results, it can be concluded that theshutdown routines developed for the unit, if executed in a de-signed manner, along with a robust enough stack design,were sufficient to bring the system down safely without rele-vant decrease in the performance.
The shutdown #5 at 6,400 h was initiated to cool down thestack to room temperature to assemble insulation layer as theadjacent cells to cell #8 had already started to show progres-sive decrease in voltage after the shutdown at 5,800 h. Thestack was then insulated with microporous insulation layer,heated back up to operating temperature mainly by pre-heat-ing the inlet gases of the stack, and operated for another∼200 h. During this time, the effect of DoR on the tempera-ture, voltage and efficiency of the stack was measured with-out external heating of the furnace. The final shutdown #6 at7,400 h was initiated automatically due to progressive fail-ures of the cells adjacent to short-circuited cell #8, which ledto increasing leakages between the fuel and air sides of thestack and excessive temperatures, both in the stack and at theexhaust pipeline due to the burning of the fuel. This was seenas a catastrophic failure of the stack.
Additionally, between 2,500 and 3,500 h recurring difficul-ties related to the control of the inlet cathode air flow causeda steady increase in the inlet air flow, which manifests as adecrease of UAIR in Figure 2. As a result of increased inlet air,the stack was cooled down progressively and the tempera-ture and voltage of the stack were decreased. This decrease involtage is seen as a decrease in Pel,stack in Figure 2, as thestack was used with constant current density. The problemwas solved by reconfiguring the control loop for cathode air,and thus a steady supply of air was restored.
Polarisation of the 5 kW stack was measured with hydro-gen immediately after assembly and curing. After the curingand evaluation of stack performance with hydrogen, the unitand the stack were cooled down to ambient temperature forinspection and heated back to operating temperature to com-mence the experiments. Individual cell voltages of the stackwith hydrogen at current density of 0.25 A cm–2 are depictedin Figure 3. Additionally, individual cell voltages measuredduring the experiment with reformed natural gas at0.35 A cm–2 are shown for comparison. The distribution of in-dividual cell voltages is identical with hydrogen and refor-mate gas i.e. the initial thermal cycle did not cause changes inthe voltage distribution. Voltage of the cell #1 (bottom cell)was 50–100 mV lower compared to the other cells, and short-circuit was measured in the cell #8. The other cell voltageswere within ±25 mV and similar values have been reportedpreviously for FZJ stacks [23]. A slight increase in the voltageis observed towards the top of the stack, which is probablycaused by the heating effect of the furnace, and due to theheat loss through the ceramic bricks at the bottom of the fur-nace. The differences between individual cell voltages, whichare more pronounced in the middle of the stack (cells 20–30),
ORIG
INAL
RES
EARCH
PAPER
FUEL CELLS 10, 2010, No. 3, 440–452 © 2010 WILEY-VCH Verlag GmbH & Co. KGaA, Weinheim 445www.fuelcells.wiley-vch.de

I/8 I/9
M. Halinen et al.: Experimental Analysis on Performance and Durability of SOFC Demonstration Unit
f6, Figure 1) of the reactor and on the gas composition of thereactor exhaust gas is depicted in Figure 6. The temperatureat the reactor inlet (position f5) varied between 530 and550 °C. At steam reforming mode (O2/C ratio = 0), the DoRof methane in the natural gas was ∼10%, and the DoR ofethane and propane was above 97% while the rest of the high-er hydrocarbons in the natural gas were below detectionlimit. It should be noted that the DoR was nearly proportionalto the inlet O2/C-ratio and at O2/C-ratio of 0.4 the degree ofpre-reforming was increased to 90%. Concurrently, gfar
decreased from 100% at steam reforming mode to 80% at O2/C-ratio of 0.4.
The experimental results of the reformer characterisationwere compared to the thermodynamic equilibrium at corre-sponding conditions. The equilibrium temperature and thecomposition of the reformate gas was calculated with Canteratoolbox [25] using GRI-Mech 3.0 reactions developed for nat-ural gas combustion [26]. Equilibrium was solved for an adia-batic system, where the total enthalpy and pressure betweenreactants and products were kept constant. Temperature
measurement at the reactor inlet (Figure 6) and measure-ments from mass flow controllers were used to define inletgas mixture temperature and composition.
The experimental values are within the error limits whencompared to the corresponding equilibrium values, except atO2/C -ratios below 0.1 (Figure 6). At O2/C -ratios below 0.1the measured outlet temperature methane concentration arehigher with respect to the equilibrium values. This deviationcan be due to the catalyst kinetics, which limit the extent ofthe endothermic steam reforming reactions, as both themethane concentration and temperature at the outlet arehigher than the corresponding equilibrium values.
Ageing of a natural gas pre-reformer catalyst can beassessed by observing the change in the methane conversionover time [27]. Decrease in the catalyst activity towards con-version of methane with an adiabatic reactor would show asdecrease in the DoR and increase in the reactor outlet temper-ature, as less methane is consumed by endothermic steamreforming reactions. The long-term performance of the cata-lyst with respect to DoR and reactor outlet temperature isdepicted in Figure 7. Again, both experimental and equilib-
0 0.1 0.2 0.3 0.4350
400
450
500
550
600
650
Tem
pera
ture
/ ° C
Inlet O 2/C / mol mol−1
TOUT
a)
TIN
0 0.1 0.2 0.3 0.40.00
0.05
0.10
0.15
0.20
0.25
0.30
0.35
0.40
0.45
Inlet O 2/C / mol mol−1
Mol
ar fr
actio
n, w
et b
asis
CH4
b)
H2
Fig. 6 Inlet O2/C-ratio versus a) x = temperature at the reactor inlet and� = temperature at the reactor outlet and b) � = molar fraction of hydro-gen and � = molar fraction of methane. Markers represent the measuredvalues and lines the equilibrium values.
0 1000 2000 3000 4000 5000 6000 7000350
375
400
425
450
475
500
525
550a)
Tem
pera
ture
/ °C
Time/ h
0.0
0.05
0.1
0.2
0 1000 2000 3000 4000 5000 6000 70000.05
0.10
0.15
0.20
0.25
0.30
0.35
0.40
0.45
0.50
0.55b)
Deg
ree
of p
re−r
efor
min
g
Time / h
0.0
0.05
0.1
0.2
Fig. 7 a) Temperature at the reactor outlet and b) degree of pre-reforminggas during the test run with varying inlet air O2/C -ratio. Markers rep-resent the measured values and lines equilibrium values. Inlet air O2/C-ratio was 0.0 (�, solid line), 0.05 (�, dash-dot), 0.1 (�, dotted) and 0.2(�, dashed).
ORIG
INAL
RES
EARCH
PAPER
448 © 2010 WILEY-VCH Verlag GmbH & Co. KGaA, Weinheim FUEL CELLS 10, 2010, No. 3, 440–452www.fuelcells.wiley-vch.de
M. Halinen et al.: Experimental Analysis on Performance and Durability of SOFC Demonstration Unit
spond to the values between 1,000 and 4,000 h of operationpresented in Figure 5b. When the 1-G short stacks were usedat current a density of 0.4 A cm–2 or higher, the voltage dropstarted to increase progressively before 3,000 h of operation.This progressive degradation was observed to increasetowards higher current densities. After 4,000 h, the stack inthe demonstration unit exhibits signs of progressive voltagedecrease as well. However, relatively large error margin forthe absolute voltage drop, due to measurement noise andshort period of constant operation conditions, preventsobtaining a reliable value for the magnitude of progression.Nevertheless, both the magnitude and the different periodsin the evolution of the absolute voltage drop over time corre-spond well between the 5 kW stack and similar 1-G stacks.Therefore, it can be concluded that the voltage degradation ofthe stack is inherent to the stack design itself i.e. no distinctincrease in the degradation is observed due to choice of BoP-components, materials and design or system operating condi-tions.
3.2 Performance and Durability of BoP-components
The performance of the BoP-components used in the dem-onstration unit was suffcient to obtain the designed electricaloutput for the stack with gross electric efficiency of 45–50%.Fuel processing unit, air and fuel heat exchangers and theautomation system worked as designed and performed reli-ably during the test run. The performances of the afterburnerand power conversion unit were sub-optimal, but did notimpede the performance of the stack.
The fuel reformer used in the demonstration unit providedmeans to control the degree of pre-reforming of the naturalgas by varying the inlet air O2/C-ratio and the H2O/C-ratio[22]. By increasing the inlet air O2/C-ratio, the faradic equiva-lent current efficiency of the reformer is lowered [24], as the
part of the inlet fuel reacts with oxygenvia partial oxidation reactions (Eq. 1).
gfar � 1 � 0�5 ×O2
C
� ��1�
In order to minimise the risk of carbonformation in the reactor, fuel pipelinesand stack, the H2O/C-ratio was increasedas the O2/C-ratio was decreased. Theminimum H2O/C-ratio in relation to O2/C-ratio was selected to exhibit no graph-ite formation at thermodynamic equilib-rium above 350 °C, and was definedaccording to Equation 2.
H2OC
� 1�44 ×O2
C
� �2
�2�88 ×O2
C� 2 �2�
The effect of varying inlet air O2/C-ratio to the outlet temperature (position
0 1000 2000 3000 4000 5000 6000 7000650
700
750
800
850
900a)
Ave
rage
cel
l vol
tage
/ m
V
Time / h
0 1000 2000 3000 4000 5000 6000 7000−160
−140
−120
−100
−80
−60
−40
−20
0
20b)
Abs
olut
e vo
ltage
dro
p / m
V k
h−1
Time / h
Fig. 5 Evolution of the stack voltage during experiment. a) Average cellvoltage of the stack over time without cell #8 (grey line), linear fit for volt-age at steady-state operating conditions (black solid line) and linear fitbetween identical operating conditions (black dashed line). b) Voltagedecrease obtained with linear fitting at steady-state operating conditions(�) and between identical operating conditions (�). Error bars represent2r error in linear fit.
Table 1 Time period and operating conditions where the absolute voltage drop over time is calcu-lated with linear regression. Error estimate for linear regression that meets 2r variance in voltagemeasurements.
t1 t2 j UFUEL UAIR Inlet O2/C Operating DU DU 2r errorHours A cm–2 Conditions mV kh–1 mV kh–1
185 345 0.35 0.51 0.35 0.25 Steady-state –136 21156 462 0.25 0.51 0.38 0.30 Identical –77 11355 465 0.25 0.51 0.37 0.35 Steady-state –28 32545 660 0.30 0.71 0.37 0.10 Steady-state –1 68670 2 130 0.35 0.71 0.36 0.10 Steady-state –10 6510 2 428 0.25 0.71 0.38 0.19 Identical –8 4650 2 509 0.30 0.71 0.38 0.10 Identical –6 4650 4 460 0.30 0.71 0.37 0.10 Identical –9 22 509 4 460 0.30 0.71 0.38 0.10 Identical –12 33 590 4 200 0.35 0.71 0.26 0.00 Steady-state –7 204 890 5 000 0.20 0.71 0.64 0.00 Steady-state –28 815 000 5 130 0.20 0.71 0.68 0.00 Steady-state –31 675 370 5 720 0.25 0.71 0.49 0.00 Steady-state –2 276 190 6 345 0.20 0.71 0.59 0.20 Steady-state –31 386 445 6 600 0.20 0.70 0.54 0.20 Steady-state –16 42
ORIG
INAL
RES
EARCH
PAPER
FUEL CELLS 10, 2010, No. 3, 440–452 © 2010 WILEY-VCH Verlag GmbH & Co. KGaA, Weinheim 447www.fuelcells.wiley-vch.de

I/10 I/11
M. Halinen et al.: Experimental Analysis on Performance and Durability of SOFC Demonstration Unit
backpressure of the system (a1, Figure 1). Constant total effi-ciency (electricity to pV-work) was assumed for the entireoperating range of the blower. The power consumption of theblower is calculated to be 300 W at 400 lN min–1, which corre-sponds 26% of UAIR at a current density of 0.35 A cm–2. WithPel,stack of 4.5–5 kW, the power consumption of the blower isbelow 10% of the gross stack electric power, and the decreasein the gel,stack is below 3%-units. The pressure loss of eachcomponent at the air system contributes to the total backpres-sure. With 400 lN min–1, the individual pressure losses of thehot and cold side of the heat exchanger bundle, and the stackare ∼30 mbar. With this backpressure, the use of regular side-channel blowers is feasible as the parasitic power lossescaused by the air blower remain below 300 W and the result-ing decrease in the electrical efficiency is kept at an adequatelevel.
Two BoP -components, the power conversion unit and theafterburner, failed to operate as expected. The SOFC stackwas connected to the electric grid with a power conversionunit whenever electric load was applied during the test run.A current setpoint was imposed on the power conversionunit, which limited the current density of the stack to thedesired value. However, at maximum, half of the electricityproduced by the stack could be supplied to the grid as thepower conversion equipment caused an increasing voltageripple on the stack at higher current levels. Therefore, thestack was loaded in parallel with the DC load to limit the cur-rent to the power conversion unit and to obtain high enoughcurrent densities for the test.
Cabling losses were 5–10%, calculated as loss of voltagebetween the stack end plates and the power conversion unit,and redesign of the current collection and cabling is requiredto decrease the losses. The conversion efficiency from DCinput to AC output of the power conversion unit was ∼70%with 2.5 kW input power. DC–DC converters that increasedthe DC voltage of the stack to 400 VDC for the inverter were
the primary cause for the poor efficiency, having efficiency of∼80%. The low efficiency of the power conversion unit ispartly explained by the use of regular off-the-shelf compo-nents that were not optimised for the low voltage and highcurrent output of the stack. Significant improvements in thepower conversion unit can be expected by utilising custo-mised components.
Shortly after the stack assembly and system start-up, theburner failed to ignite and burn the anode off-gas from thestack. The failure was probably caused by condensation ofliquid water to the surface of the catalysts during commis-sioning of the stack and the first thermal cycle. The con-densed water rinsed away the catalytically active material,and no oxidation of fuel could occur in the afterburner. Priorto the long term testing, the afterburner was characterised ina separate test bench [24] and an endurance test of 1,000 hwas conducted before assembling the burner to the demounit. During the endurance test the burner showed no mea-surable decrease in performance. In the future experiments, amore robust afterburning catalyst tolerant to water condensa-tion is needed or the condensation has to be prevented byredesigning the burner.
4 ConclusionA SOFC demonstration unit was designed and con-
structed. The unit was operated with a planar SOFC stack fora total of over 7,000 h. During the test run the performanceand durability of the stack and other BoP-components wereassessed. Two components, the afterburner and the powerconversion unit failed to operate as intended, but the perfor-mance of other components was satisfactory during the testrun. The SOFC stack used in the system showed stable opera-tion for long term testing and towards several shutdownsituations, even with one cell in short-circuit.
The heat exchanger bundle at the air system operated withsufficient effectiveness to pre-heat the inlet air for stackoperation. The total pressure losses at the air system werelow enough to make use of regular side channel blowers fea-sible. At the fuel system, the combined effect of high heat lossand the use of trace heating prevented the assessing of theeffectiveness of the heat exchanger. Nevertheless, the fuelheat exchanger was used successfully throughout the experi-ment and no distinct changes in the pressure loss or stackinlet temperature at the fuel side were observed. The opera-tional characteristics of the reformer unit are assessed bycomparison with thermodynamic equilibrium. A minordecrease in the DoR of the reformer was measured during thetest run, but the change is not significant for system operationand was not observed to impede the performance of thestack.
The evolution of the voltage drop of the 5 kW power classstack used during the test run corresponds with the measure-ments conducted with similar short stacks. A period of largeinitial drop in voltage, followed by a period of nearly con-
100 200 300 400 500 600
0
25
50
75
100
125
150
175
200 a1
a3
a6
a8
Air flow rate / lN min−1
Pres
sure
/ m
barg
100 200 300 400 500 600 700
0
0.1
0.2
0.3
0.4
0.5
0.6
0.7
0.8
Blo
wer
pow
er c
onsu
mpt
ion
/ kW
Fig. 9 Pressure at different measurement positions at air system (solid lineand markers) and the power consumption of the blower (dashed line).Current density was 0.25–0.35 A cm–2 during the measurements. Errorbars represent 2r error.
ORIG
INAL
RES
EARCH
PAPER
450 © 2010 WILEY-VCH Verlag GmbH & Co. KGaA, Weinheim FUEL CELLS 10, 2010, No. 3, 440–452www.fuelcells.wiley-vch.de
M. Halinen et al.: Experimental Analysis on Performance and Durability of SOFC Demonstration Unit
rium results are presented. The performance can be evaluatedwith several inlet O2/C -ratios as the demo unit was used atvarying conditions. With inlet O2/C -ratio of 0.2, no changesin either the temperature or the DoR can be seen over time.With lower O2/C -ratios, the difference in the reactor outlettemperature increases by a maximum of 25 °C as the experi-ment proceeds further when compared to equilibrium values.A similar effect can be perceived with DoR, but the effect isnot so pronounced as with temperature. These results indi-cate that some deactivation of the catalyst occurred, as theextent of steam reforming reactions decreased during the testrun. Moreover, the deactivation can be more pronouncedtowards lower O2/C -ratios, where larger portion of themethane is converted via steam reforming instead of partialoxidation reactions. However, the changes in the temperatureare within 25 °C and the corresponding change in the DoR isonly a few percent units. It can be argued that a deactivationof this magnitude is not an issue in the system operation, asthe heat balance of the system is not significantly changed.
The characteristic performance of the air heat exchangerbundle is depicted in Figure 8a. It can be seen that the inletair (position a3) was preheated to 530–580 °C and the temper-ature was increasing with the inlet air flow. The conductanceof the heat exchanger bundle was 28.5 W K–1 and 79 W K–1
with 200 lN min–1 and 600 lN min–1, respectively. The conduc-tance increased linearly as a function of air flow rate. The rel-ative decrease in temperature at lower air flow rates is due toconsiderable heat losses from the air exhaust pipelinebetween the stack and the heat exchangers, and from the heatexchanger bundle itself. Heat loss was calculated to be 13–15% from the hot air flow in the heat exchangers and 6–12%in the stack exhaust pipeline, depending on the air flow rate(data not shown). The temperature difference between the airflows at the stack end of the heat exchanger bundle remainedat 150 ± 10 °C, regardless of the variation in the inlet air flowrate and the temperature of the hot air from the stack.
The characteristic performance of the air heat exchangerbundle remained constant during the test run. Figure 8bdepicts the difference between temperature measurements atthe stack end and blower end of the heat exchanger bundle. Itis clear that the temperature difference remains at the abovementioned 150 ± 10 °C over time with some fluctuationscaused by system stand-by situations. This indicates that theheat-transfer properties of the heat exchangers remainunchanged during the experiment. Likewise, no changes inthe characteristic pressure drop at the hot side and the coldside of the HEX bundle were measured (data not shown).
No changes in the pressure losses at the fuel heat exchan-ger were observed over time. The pressure loss at each side ofthe fuel exchanger and in the fuel side of the stack was5–20 mbar depending on inlet fuel flow rate, degree of pre-reforming and fuel utilisation of the stack. The pressure lossof the reformer reactor was below 5 mbar, while the vaporiserand fuel heater contributed 40–100 mbar to the total back-pressure of the fuel system. The total backpressure of thecomponents at the fuel system remained below 200 mbar
during the experiment. The heat transfer properties of thefuel heat exchanger cannot be evaluated reliably as the traceheating elements inflicted bias to the temperature measure-ments of the fuel and exhaust gases. Additionally, the vicinityof the air heat exchanger of considerably larger mass mayhave caused bias in the measurements as the heat exchangerswere insulated under the same insulation layer. However, theheat exchanger operated through the entire test run and pro-vided sufficient pre-heating of inlet fuel to operate the unit.
In atmospheric SOFC systems, the air blower is typicallylargest consumer of electric power among all auxiliary com-ponents [19]. Therefore, the characteristic backpressure of aSOFC system largely defines the parasitic power losses andthe resulting decrease in the electric efficiency. The backpres-sure at different measurement positions at the air system ver-sus the inlet air flow, along with the calculated power con-sumption of the air blower, are depicted in Figure 9. Thepower consumption of the air blower as a function of the airflow rate is calculated with fan efficiency of 25% and the total
0 1000 2000 3000 4000 5000 6000 70000
20
40
60
80
100
120
140
160
180
∆Ta8−a1
∆Ta6−a3
b)
Time / h
∆T /
° C
100 200 300 400 500 600500
550
600
650
700
750
800
Ta3
Ta6
Ta5
a)
Air flow rate / lN min−1
Tem
pera
ture
/ ° C
Fig. 8 Operation of the heat exchangers at the air system. a) Temperatureof the air at the fresh side outlet of the HEX (�), hot side inlet of the HEX(�) and at the stack exhaust (�). b) Temperature difference the inlet andout-let gases at the hot end and cold end of the HEX bundle, respectively.Current density was 0.2–0.35 A cm–2 during the measurements.
ORIG
INAL
RES
EARCH
PAPER
FUEL CELLS 10, 2010, No. 3, 440–452 © 2010 WILEY-VCH Verlag GmbH & Co. KGaA, Weinheim 449www.fuelcells.wiley-vch.de
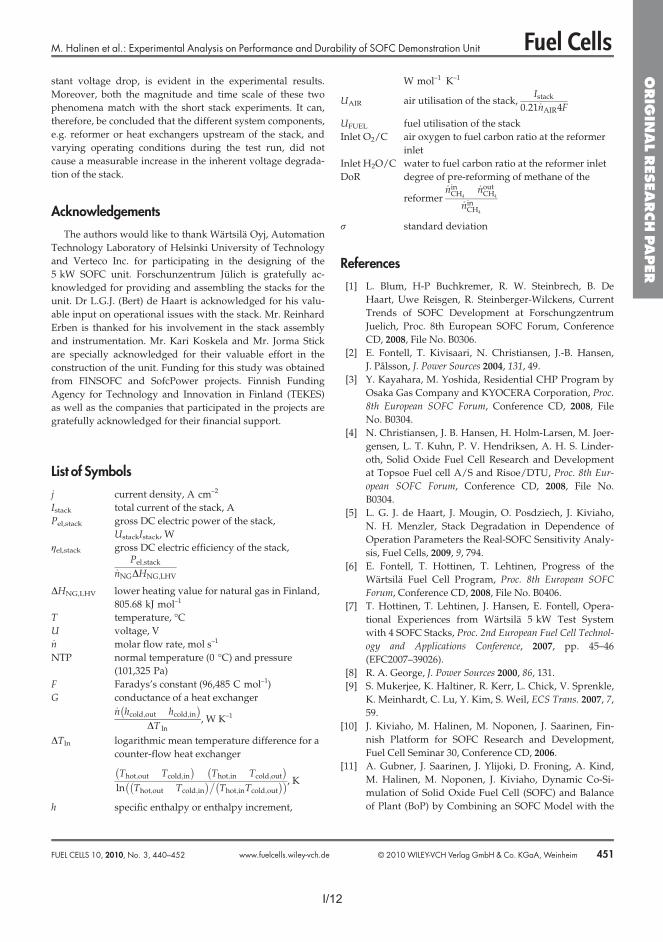
I/12 I/13
M. Halinen et al.: Experimental Analysis on Performance and Durability of SOFC Demonstration Unit
BoP-Modelling tool APROS, Proc. 7th European SOFCForum, Conference CD, 2006, File No. B092.
[12] T. Ollikainen, J. Saarinen, M. Halinen, T. Hottinen,M. Noponen, E. Fontell, J. Kiviaho, ECS Trans. 2007, 7,1821.
[13] J. Saarinen, M. Halinen, A. Gubner, M. Noponen, J. Yli-joki, A. Kind, J. Kiviaho, Steady-State Simulation Studyof Thermal Management of Planar SOFC Stack, FuelCell Seminar 30, Conference CD, 2006.
[14] I. Vinke, R. Erben, R.-H. Song, J. Kiviaho, Installationand Operation of kW-Class Stacks from Jülich in Exter-nal Laboratories, Proc. 7th European SOFC Forum, Confer-ence CD, 2006, File No. B036.
[15] R. Steinberger-Wilckens, I. C. Vinke, L. Blum, L. B. deHaart, J. Remmel, F. Tietz, W. Quadakkers, Progress inStack Development at Forschungzentum Jülich, Proc.6th European SOFC Forum 2004, 1, 11.
[16] J. J. Hartvigsen, S. Elangovan, A. Khandkar, System de-sign, in: Handbook of Fuel Cells Fundamentals, Technologyand Applications, Vol. 4, 2003, pp. 1071–1085, ISBN:0-471-49926-9.
[17] N. Dekker, J. Outweltjes, G. Rietveld, ECS Trans. 2007,7, pp. 1465.
[18] H. Timmermann, W. Sawady, D. Campbell, A. Weber,R. Reimert, E. Ivers-Tiffé, J. Electrochem. Soc. 2008, 155,B354.
[19] E. Riensche, U. Stimming, G. Unverzagt, J. Power Sources1998, 73, 251.
[20] M. Noponen, M. Halinen, J. Kiviaho, J. Saarinen, J. FuelCell Sci. Tech. 2006, 3, 444.
[21] M. Noponen, M. Halinen, J. Saarinen, J. Kiviaho, ECSTrans. 2007, 5, 545.
[22] M. Halinen, M. Noponen, J. Saarinen, J. Kiviaho, Char-acterization and Control of a Autothermal Reformer forSOFC Applications, Fuel Cell Seminar 30, ConferenceCD, 2006.
[23] L. Blum, H.-P. Buchkremer, S. Gross, A. Gubner, L. B.deHaart, H. Nabielek, W. Quadakkers, U. Reisgen, M. J.Smith, R. Steinberger-Wilckens, R. Steinbrech, F. Tietz,I. Vinke, 2007, Fuel Cells 3, pp. 204–210.
[24] J. Saarinen, M. Halinen, J. Ylijoki, M. Noponen, P. Si-mell, J. Kiviaho, J. Fuel Cell Sci. Tech. 2007, 4, 397.
[25] D. Goodwin, An open-source, extensible softwaresuite for cvd process simulation, Proceedings ofCVD XVI and EuroCVD 14, The Electrochemical SocietyPV 2003-2008, 2003, pp. 155–162, see also http://www.cantera.org/.
[26] G. Smith, GRI-MECH 3.0, http://www.me.berkeley.edu/gri_mech/.
[27] R. Peters, E. Riensche, P. Cremer, J. Power Sources 2000,86, 432.
______________________
ORIG
INAL
RES
EARCH
PAPER
452 © 2010 WILEY-VCH Verlag GmbH & Co. KGaA, Weinheim FUEL CELLS 10, 2010, No. 3, 440–452www.fuelcells.wiley-vch.de
M. Halinen et al.: Experimental Analysis on Performance and Durability of SOFC Demonstration Unit
stant voltage drop, is evident in the experimental results.Moreover, both the magnitude and time scale of these twophenomena match with the short stack experiments. It can,therefore, be concluded that the different system components,e.g. reformer or heat exchangers upstream of the stack, andvarying operating conditions during the test run, did notcause a measurable increase in the inherent voltage degrada-tion of the stack.
AcknowledgementsThe authors would like to thank Wärtsilä Oyj, Automation
Technology Laboratory of Helsinki University of Technologyand Verteco Inc. for participating in the designing of the5 kW SOFC unit. Forschunzentrum Jülich is gratefully ac-knowledged for providing and assembling the stacks for theunit. Dr L.G.J. (Bert) de Haart is acknowledged for his valu-able input on operational issues with the stack. Mr. ReinhardErben is thanked for his involvement in the stack assemblyand instrumentation. Mr. Kari Koskela and Mr. Jorma Stickare specially acknowledged for their valuable effort in theconstruction of the unit. Funding for this study was obtainedfrom FINSOFC and SofcPower projects. Finnish FundingAgency for Technology and Innovation in Finland (TEKES)as well as the companies that participated in the projects aregratefully acknowledged for their financial support.
List of Symbolsj current density, A cm–2
Istack total current of the stack, APel,stack gross DC electric power of the stack,
UstackIstack, Wgel,stack gross DC electric efficiency of the stack,
Pel�stack
�nNGDHNG�LHV
DHNG,LHV lower heating value for natural gas in Finland,805.68 kJ mol–1
T temperature, °CU voltage, V�n molar flow rate, mol s–1
NTP normal temperature (0 °C) and pressure(101,325 Pa)
F Faradys’s constant (96,485 C mol–1)G conductance of a heat exchanger
�n hcold�out � hcold�in� �
DT ln, W K–1
DTln logarithmic mean temperature difference for acounter-flow heat exchanger
Thot�out � Tcold�in� �� Thot�in � Tcold�out
� �
ln Thot�out � Tcold�in� ��
Thot�inTcold�out� �� �, K
h specific enthalpy or enthalpy increment,
W mol–1 K–1
UAIR air utilisation of the stack,Istack
0�21 �nAIR4F
UFUEL fuel utilisation of the stackInlet O2/C air oxygen to fuel carbon ratio at the reformer
inletInlet H2O/C water to fuel carbon ratio at the reformer inletDoR degree of pre-reforming of methane of the
reformer�nin
CH4� �nout
CH4
�ninCH4
r standard deviation
References[1] L. Blum, H-P Buchkremer, R. W. Steinbrech, B. De
Haart, Uwe Reisgen, R. Steinberger-Wilckens, CurrentTrends of SOFC Development at ForschungzentrumJuelich, Proc. 8th European SOFC Forum, ConferenceCD, 2008, File No. B0306.
[2] E. Fontell, T. Kivisaari, N. Christiansen, J.-B. Hansen,J. Pålsson, J. Power Sources 2004, 131, 49.
[3] Y. Kayahara, M. Yoshida, Residential CHP Program byOsaka Gas Company and KYOCERA Corporation, Proc.8th European SOFC Forum, Conference CD, 2008, FileNo. B0304.
[4] N. Christiansen, J. B. Hansen, H. Holm-Larsen, M. Joer-gensen, L. T. Kuhn, P. V. Hendriksen, A. H. S. Linder-oth, Solid Oxide Fuel Cell Research and Developmentat Topsoe Fuel cell A/S and Risoe/DTU, Proc. 8th Eur-opean SOFC Forum, Conference CD, 2008, File No.B0304.
[5] L. G. J. de Haart, J. Mougin, O. Posdziech, J. Kiviaho,N. H. Menzler, Stack Degradation in Dependence ofOperation Parameters the Real-SOFC Sensitivity Analy-sis, Fuel Cells, 2009, 9, 794.
[6] E. Fontell, T. Hottinen, T. Lehtinen, Progress of theWärtsilä Fuel Cell Program, Proc. 8th European SOFCForum, Conference CD, 2008, File No. B0406.
[7] T. Hottinen, T. Lehtinen, J. Hansen, E. Fontell, Opera-tional Experiences from Wärtsilä 5 kW Test Systemwith 4 SOFC Stacks, Proc. 2nd European Fuel Cell Technol-ogy and Applications Conference, 2007, pp. 45–46(EFC2007–39026).
[8] R. A. George, J. Power Sources 2000, 86, 131.[9] S. Mukerjee, K. Haltiner, R. Kerr, L. Chick, V. Sprenkle,
K. Meinhardt, C. Lu, Y. Kim, S. Weil, ECS Trans. 2007, 7,59.
[10] J. Kiviaho, M. Halinen, M. Noponen, J. Saarinen, Fin-nish Platform for SOFC Research and Development,Fuel Cell Seminar 30, Conference CD, 2006.
[11] A. Gubner, J. Saarinen, J. Ylijoki, D. Froning, A. Kind,M. Halinen, M. Noponen, J. Kiviaho, Dynamic Co-Si-mulation of Solid Oxide Fuel Cell (SOFC) and Balanceof Plant (BoP) by Combining an SOFC Model with the
ORIG
INAL
RES
EARCH
PAPER
FUEL CELLS 10, 2010, No. 3, 440–452 © 2010 WILEY-VCH Verlag GmbH & Co. KGaA, Weinheim 451www.fuelcells.wiley-vch.de