Experiences with Structural Adjustment of the Australian ...
24
Experiences with Structural Adjustment of the Australian Steel industry Presentation by Dr Bob Every Managing Director and CEO of OneSteel Limited September 9, 2004
Transcript of Experiences with Structural Adjustment of the Australian ...

Experiences with Structural Adjustment of the Australian Steel industryPresentation by Dr Bob EveryManaging Director and CEO of OneSteel LimitedSeptember 9, 2004

Slide 2
Contents
• Global Industry Landscape• Australian Industry Landscape• Current Trends and Structural Impacts• The Future of Steel

Global Steel Industry Landscape
Slide 4
Global Steel Industry Landscape
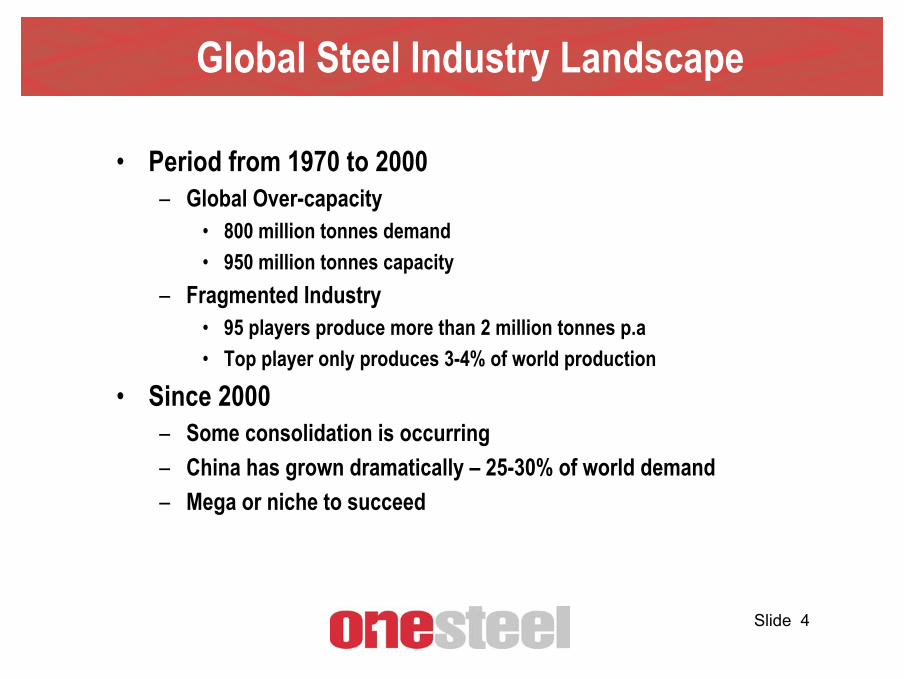
• Period from 1970 to 2000– Global Over-capacity
• 800 million tonnes demand• 950 million tonnes capacity
– Fragmented Industry• 95 players produce more than 2 million tonnes p.a• Top player only produces 3-4% of world production
• Since 2000– Some consolidation is occurring– China has grown dramatically – 25-30% of world demand– Mega or niche to succeed
Slide 5
Steel in the Global Context
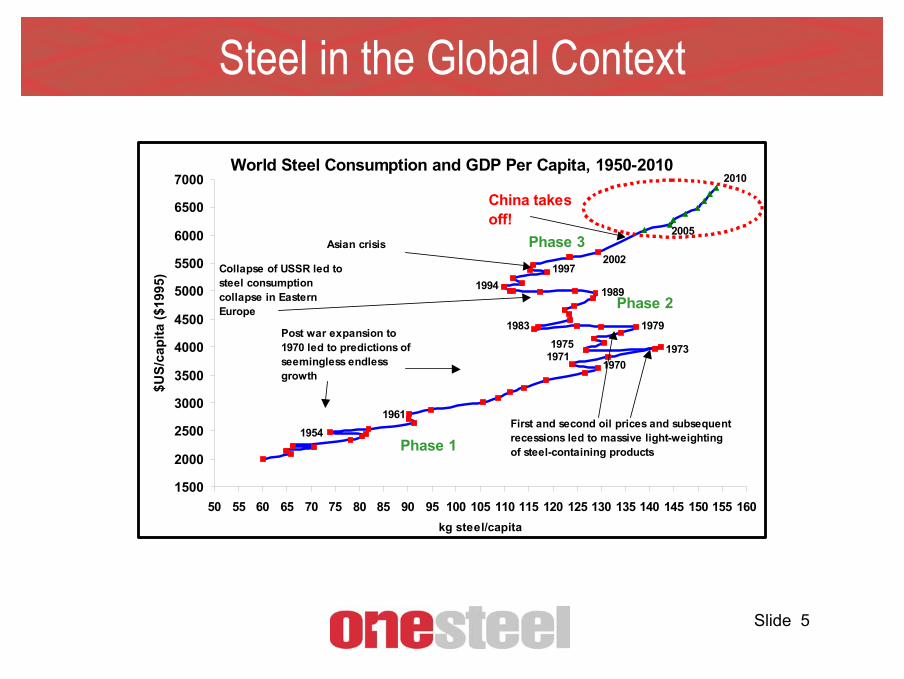
World Steel Consumption and GDP Per Capita, 1950-2010
1500
2000
2500
3000
3500
4000
4500
5000
5500
6000
6500
7000
50 55 60 65 70 75 80 85 90 95 100 105 110 115 120 125 130 135 140 145 150 155 160kg steel/capita
$US/
capi
ta ($
1995
)
20021997
1994 1989
1983 19791975
19711970
1973
1961First and second oil prices and subsequent recessions led to massive light-weighting of steel-containing products
Post war expansion to 1970 led to predictions of seemingless endless growth
Collapse of USSR led to steel consumption collapse in Eastern Europe
Asian crisis
China takes off!
1954
2005
2010
Phase 1
Phase 2
Phase 3
Source: Macquarie Research
Slide 6
Steel in the Global Context
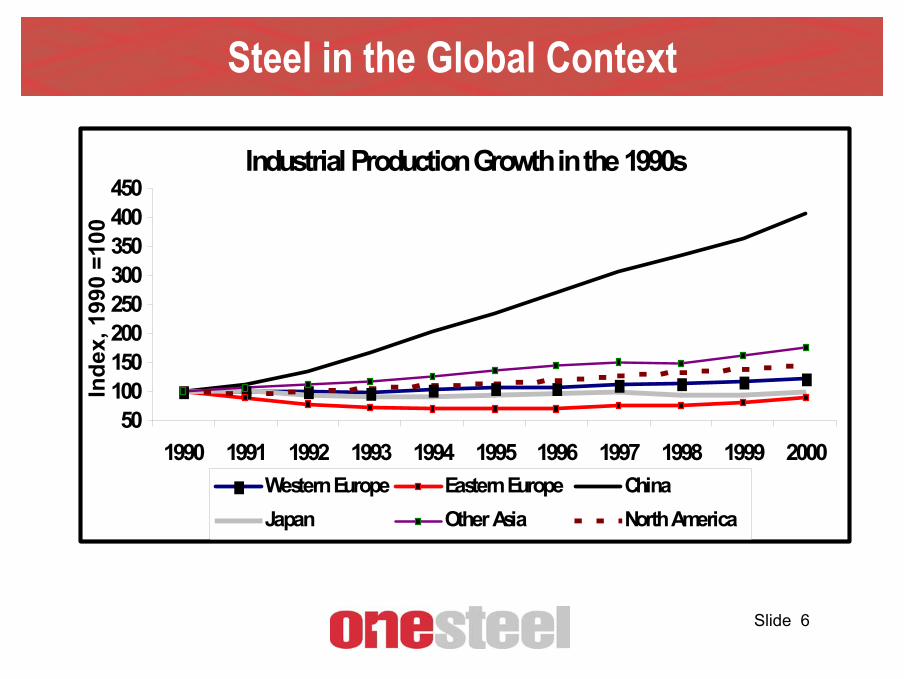
Industrial Production Growth in the 1990s
50100150200250300350400450
1990 1991 1992 1993 1994 1995 1996 1997 1998 1999 2000
Inde
x, 1
990
=100
Western Europe Eastern Europe ChinaJapan Other Asia North America
Source: Ecowin

Slide 7
Steel in the Global Context
World Steel Consumption by Region
0
100000
200000
300000
400000
500000
600000
700000
800000
900000
1955
1958
1961
1964
1967
1970
1973
1976
1979
1982
1985
1988
1991
1994
1997
2000
'000
t cru
de s
teel
ChinaJapanOther AsiaWestern EuropeEastern EuropeFormer Soviet UnionMiddle EastAfricaOceaniaLatin AmericaCanadaUSA
Source: IISI

Slide 8
International Steel Production and Prices

Slide 9
International Steel Forecast Demand

Slide 10
Steel in the Global Context
• Early signs of a complementary change on the production side
• Consolidation is occurring- Corus – from merger of British Steel and Hoogovens- Arcelor – from merger of Usinor, Arbed and Aceralia- JFE Steel – from NKK and Kawasaki- U.S. Steel acquired assets of National Steel- Nucor has made four acquisitions over two years

Slide 11
Steel in the Global Context
• So what does this all mean?– We may be entering a new period of growth
in international steel – the first time in three decades
– It has the potential to change the balance in the industry from over to under supply

Australian Steel Industry Landscape

Slide 13
Australian Steel Industry Landscape
• 1970s– One Steel producer – BHP (Blast furnace based)
• 1980s– Emergence of Smorgon Steel (Electric Arc furnace)
• 1990s– BHP closes Newcastle steel works (1.5 million tonne facility)
• 2000s, BHP exits steel– BHP spins off OneSteel Limited (long products)– BHP Billiton spins off BlueScope Steel (flat products)
Slide 14
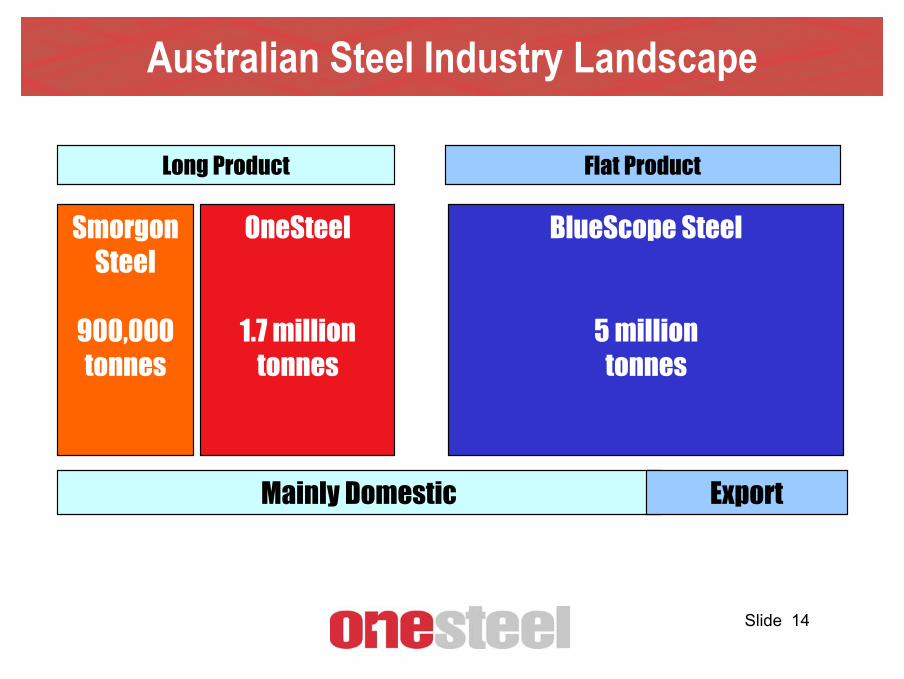
Australian Steel Industry Landscape
Smorgon Steel
900,000 tonnes
Long Product Flat Product
OneSteel
1.7 milliontonnes
BlueScope Steel
5 milliontonnes
Mainly Domestic Export
Current Trends and Structural Impacts

Slide 16
Scrap PricesAsian HM1 Scrap Price
Jan 1994 to Jul 2004
$80$100$120$140$160$180$200$220$240$260$280$300$320$340$360$380$400$420$440$460
Jul-9
5
Jan-
96
Jul-9
6
Jan-
97
Jul-9
7
Jan-
98
Jul-9
8
Jan-
99
Jul-9
9
Jan-
00
Jul-0
0
Jan-
01
Jul-0
1
Jan-
02
Jul-0
2
Jan-
03
Jul-0
3
Jan-
04
Jul-0
4
$/t
$US/t $A/t
Source : Tex Report

Slide 17
Trends in International Long Product Steel Prices
Long Products International PricesJan 1994 to Jul 2004. (US$)
150
200
250
300
350
400
450
500
550
600
Jan-94
Jul-94
Jan-95
Jul-95
Jan-96
Jul-96
Jan-97
Jul-97
Jan-98
Jul-98
Jan-99
Jul-99
Jan-00
Jul-00
Jan-01
Jul-01
Jan-02
Jul-02
Jan-03
Jul-03
Jan-04
Jul-04U
S$/T
onne
(c&
f int
o C
hina
) ex
Non
-CIS
BEAMS MER.BAR REBARS LC WIRE ROD
Source : CRU
Slide 18
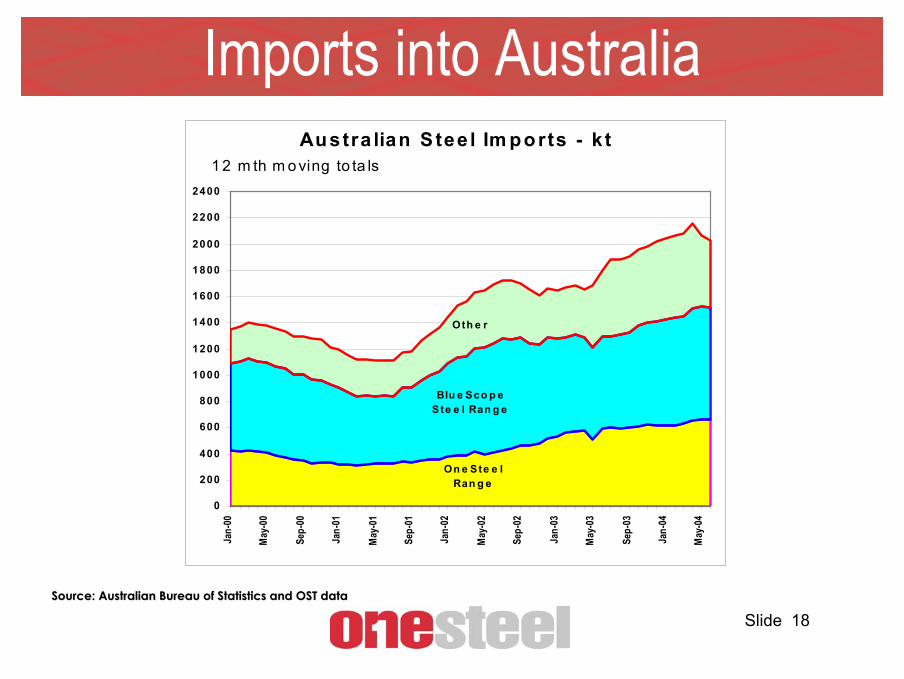
Imports into Australia
Source: Australian Bureau of Statistics and OST dataSource: Australian Bureau of Statistics and OST data
Austra lian S tee l Im ports - k t
On e Ste e l Ran g e
Blu e Sco p e Ste e l Ran g e
Oth e r
0
200
400
600
800
1000
1200
1400
1600
1800
2000
2200
2400
Jan-
00
May
-00
Sep-
00
Jan-
01
May
-01
Sep-
01
Jan-
02
May
-02
Sep-
02
Jan-
03
May
-03
Sep-
03
Jan-
04
May
-04
1 2 m th m o ving to ta ls

Slide 19
Import versus International Prices - $AUDFrom January 1999 to June 2004
0 .9
1.1
1.3
1.5
1.7
1.9
2 .1
Jan-9 9
M ay-9 9
S e p -9 9
Jan-0 0
M ay-0 0
S e p -0 0
Jan-0 1
M ay-0 1
S e p -0 1
Jan-0 2
M ay-0 2
S e p -0 2
Jan-0 3
M ay-0 3
S e p -0 3
Jan-0 4
M ay-0 4
Basket of Goods (Rebar, Mebar, Structural)
Inde
x
Import Price
International Price
Source: Australian Bureau of Statistics and OST dataSource: Australian Bureau of Statistics and OST data
Import versus International Prices
Australian Dollar Australian Dollar Appreciation Appreciation
ImpactImpact

Slide 20
Australian Steel Price Index
Source: Australian Bureau of StatisticsSource: Australian Bureau of Statistics
Prices for Steel Construction Materials from 1990-2004
90
100
110
120
130
140
150
QUARTERS FROM MARCH 1990 TO JUNE 2004
IND
EX (1
989-
90=1
00)
Steel decking and cladding Structural steel Reinforcing steel bar, fabric and mesh
Weighted Average of 8 Capital Cities CPI Steel products used in Res construction
Structural steel
Rebar & mesh
Decking & cladding
Steel in Res Construc
CPI

Slide 21
International Freight Rates
Source: Clarkson Research StudiesSource: Clarkson Research Studies

Slide 22
Performance of Australian Steel Companies
Share Price Performance of Australian Steel Companies versus All Ordinaries(Indexed at 100 on 21 July 2002)
80
100
120
140
160
180
200
Jul-0
2
Aug-
02
Sep-
02
Oct
-02
Nov
-02
Dec
-02
Jan-
03
Feb-
03
Mar
-03
Apr
-03
May
-03
Jun-
03
Jul-0
3
Aug-
03
Sep-
03
Oct
-03
Nov
-03
Dec
-03
Jan-
04
Feb-
04
Mar
-04
Apr
-04
May
-04
Jun-
04
Jul-0
4
Inde
x Va
lue
All Ordinaries Index
Australian Steel Companies Index*
* Index of the share prices of BlueScope Steel, OneSteel, Sims and Smorgon Steel (not weighted by market capitalisation)

Slide 23
The Future for Steel
• Steel Consumption is rising, driven by China
• Less government ownership
• Consolidation is occurring, at least regionally

Slide 24
Conclusion• Australian steel industry undergone massive
restructuring• An exciting decade ahead
- supply and demand changing- potential for strong sustainable steel prices
• Australian steel companies are creating value• OneSteel has undergone a process of
reinvention
I believe we really are seeing the reinvention of steel