Expected Results on 14 November 2014 - Nirmal Bang - … Results on 1411… · · 2014-11-13Addi...
98
Co. Name Co. Name Co. Name 7Seas Entertainment Arcee Industries Biofil Chemicals & Pharmaceuticals Aankit Granites Archidply Industries Birla Capital And Financial Services Aarey Drugs & Pharmaceuticals Archit Organosys Birla Cotsyn (India) Aarti Drugs Ardi Investments & Trading Company Birla Shloka Edutech Aarvee Denims & Exports Aries Agro BITS ABC India Arihant Avenues & Credit BJ Duplex Boards ABG Infralogistics Arihant Multi Commercial BLB Abhishek Corporation Arora Fibres Bloom Dekor ABM Knowledgeware Arshiya Blue Blends (India) Accel Transmatic Artefact Projects Blue Chip India ACE EduTrend Asahi Industries BNR Udyog Ace Software Exports Aseem Global Bodal Chemicals Acknit Industries Ashiana Ispat Brakes Auto (India) Adarsh Mercantile Asis Logistics Britannia Industries Addi Industries Assam Company India Brooks Laboratories Adhunik Metaliks Asya Infosoft Brushman (India) Adi Rasayan Atlanta Devcon BS Adinath Textiles Atlanta Infrastructure and Finance Burnpur Cement Advance Powerinfra Tech AUNDE India Butterfly Gandhimathi Appliances Advik Laboratories Aurangabad Paper Mills C Mahendra Exports Aegis Logistics Aurum Soft Systems Cals Refineries Aftek Autoriders Finance Cambridge Technology Enterprises Agarwal Industrial Corporation Avonmore Capital & Management Services Camphor & Allied Products Ahluwalia Contracts (India) Axis Capital Markets (India) Capital Trade Links AI Champdany Industries Axis Rail India Ceenik Exports (India) Aimco Pesticides B Nanji Enterprises Ceeta Industries Aishwarya Technologies and Telecom Bacil Pharma Centenial Surgical Suture Ajanta Soya Bagalkot Udyog Centrum Capital Ajmera Realty & Infra India Bajrang Finance Century Extrusions AK Capital Services Balaji Amines Cerebra Integrated Technologies Alfa Transformers Bannari Amman Spinning Mills CES Allied Digital Services Barak Cement CESC Alpine Housing Development Corporation Bartronics India CFL Capital Financial Services Amforge Industries BCL Industries & Infrastructures Chandni Textiles Engineering Amines & Plasticizers BDH Industries Charms Industries Amulya Leasing & Finance Bell Agromachina Chartered Logistics Anant Raj BEML Chase Bright Steel Ananthi Constructions Best Eastern Hotels Chhattisgarh Industries Andhra Pradesh Tanneries Betex India Choice Infra Ventures ANG Industries Bhagawati Gas Choice International Anik Industries Bhageria Dye-Chem Cigniti Technologies Ankit Metal & Power Bhagiradha Chemicals & Industries Cistro Telelink Ansal Housing & Construction Bharat Heavy Electricals Classic Diamonds (India) Ansal Properties & Infrastructure Bharatiya Global Infomedia Classic Electricals Anshuni Commercials Bhushan Steel Comfort Fincap Anuh Pharma Bihar Sponge Iron Commex Technology Anukaran Commercial Enterprises Bilcare Compuage Infocom Apte Amalgamations Bimetal Bearings Core Education & Technologies Aptech Binayak Tex Processors Corporate Courier & Cargo Aravali Securities & Finance Binny Country Club (India) Expected Results on 14 November 2014 Expected Results on 14 November 2014
-
Upload
nguyenlien -
Category
Documents
-
view
214 -
download
1
Transcript of Expected Results on 14 November 2014 - Nirmal Bang - … Results on 1411… · · 2014-11-13Addi...

Co. Name Co. Name Co. Name
7Seas Entertainment Arcee Industries Biofil Chemicals & Pharmaceuticals
Aankit Granites Archidply Industries Birla Capital And Financial Services
Aarey Drugs & Pharmaceuticals Archit Organosys Birla Cotsyn (India)
Aarti Drugs Ardi Investments & Trading Company Birla Shloka Edutech
Aarvee Denims & Exports Aries Agro BITS
ABC India Arihant Avenues & Credit BJ Duplex Boards
ABG Infralogistics Arihant Multi Commercial BLB
Abhishek Corporation Arora Fibres Bloom Dekor
ABM Knowledgeware Arshiya Blue Blends (India)
Accel Transmatic Artefact Projects Blue Chip India
ACE EduTrend Asahi Industries BNR Udyog
Ace Software Exports Aseem Global Bodal Chemicals
Acknit Industries Ashiana Ispat Brakes Auto (India)
Adarsh Mercantile Asis Logistics Britannia Industries
Addi Industries Assam Company India Brooks Laboratories
Adhunik Metaliks Asya Infosoft Brushman (India)
Adi Rasayan Atlanta Devcon BS
Adinath Textiles Atlanta Infrastructure and Finance Burnpur Cement
Advance Powerinfra Tech AUNDE India Butterfly Gandhimathi Appliances
Advik Laboratories Aurangabad Paper Mills C Mahendra Exports
Aegis Logistics Aurum Soft Systems Cals Refineries
Aftek Autoriders Finance Cambridge Technology Enterprises
Agarwal Industrial Corporation Avonmore Capital & Management Services Camphor & Allied Products
Ahluwalia Contracts (India) Axis Capital Markets (India) Capital Trade Links
AI Champdany Industries Axis Rail India Ceenik Exports (India)
Aimco Pesticides B Nanji Enterprises Ceeta Industries
Aishwarya Technologies and Telecom Bacil Pharma Centenial Surgical Suture
Ajanta Soya Bagalkot Udyog Centrum Capital
Ajmera Realty & Infra India Bajrang Finance Century Extrusions
AK Capital Services Balaji Amines Cerebra Integrated Technologies
Alfa Transformers Bannari Amman Spinning Mills CES
Allied Digital Services Barak Cement CESC
Alpine Housing Development Corporation Bartronics India CFL Capital Financial Services
Amforge Industries BCL Industries & Infrastructures Chandni Textiles Engineering
Amines & Plasticizers BDH Industries Charms Industries
Amulya Leasing & Finance Bell Agromachina Chartered Logistics
Anant Raj BEML Chase Bright Steel
Ananthi Constructions Best Eastern Hotels Chhattisgarh Industries
Andhra Pradesh Tanneries Betex India Choice Infra Ventures
ANG Industries Bhagawati Gas Choice International
Anik Industries Bhageria Dye-Chem Cigniti Technologies
Ankit Metal & Power Bhagiradha Chemicals & Industries Cistro Telelink
Ansal Housing & Construction Bharat Heavy Electricals Classic Diamonds (India)
Ansal Properties & Infrastructure Bharatiya Global Infomedia Classic Electricals
Anshuni Commercials Bhushan Steel Comfort Fincap
Anuh Pharma Bihar Sponge Iron Commex Technology
Anukaran Commercial Enterprises Bilcare Compuage Infocom
Apte Amalgamations Bimetal Bearings Core Education & Technologies
Aptech Binayak Tex Processors Corporate Courier & Cargo
Aravali Securities & Finance Binny Country Club (India)
Expected Results on 14 November 2014
Exp
ecte
d R
esu
lts
on
14
No
vem
ber
201
4

Exp
ecte
d R
esu
lts
on
14
No
vem
ber
201
4
Co. Name Co. Name Co. Name
Covidh Technologies First Custodian Fund (India) GVK Power & Infrastructure
Cox & Kings (India) First Financial Services Haldyn Glass
Cranex First Winner Industries Haria Apparels
Creative Merchants Firstobject Technologies Haria Exports
Credit Analysis And Research Firstsource Solutions Hariyana Ship Breakers
CSS Technergy Fischer Chemic Hasti Finance
Cura Technologies Focus Industrial Resources Hathway Bhawani Cabletel & Datacom
Daulat Securities Foods & Inns HB Leasing & Finance Company
DCM Foseco India HB Portfolio
Deccan Cements Freshtrop Fruits HBL Power Systems
Delma Infrastructure Frontline Business Solutions High Ground Enterprise
Delta Leasing & Finance Frontline Securities High Street Filatex
Den Networks Future Consumer Enterprise Himalaya Granites
DFM Foods Future Retail Himalchuli Food Products
Dhanlaxmi Fabrics Futuristic Securities Hind Aluminium Industries
Dhoot Industrial Finance Gaekwar Mills Hind Industries
Dhoot Industries Gajra Bevel Gears Hindustan Adhesives
DHP India Galada Power & Telecommunication Hindustan Appliances
Diana Tea Company Gandhinagar Hotels Hindustan Everest Tools
DIL Gandhinagar Leasing & Finance Hindustan Organic Chemicals
Diligent Industries Ganga Papers India Hipolin
Divinus Fabrics Garnet Construction Hiran Orgochem
DMC Education Gayatri Tissue & Papers Housing Development & Infrastructure
Dolphin Medical Services Gee Gee Granites HS India
Donear Industries Gemstone Investments Hubtown
Dr. Datasons Labs Genesys International Corporation IB Infotech Enterprises
Dynamatic Technologies Genus Power Infrastructures ICDS
Dynamic Industries GI Engineering Solutions ICVL Steels
Dynamic Portfolio Management & Services Gitanjali Gems IDream Film Infrastructure Company
Eastern Silk Industries GIVO Impex Ferro Tech
Easun Reyrolle Globus Power Generation Inani Marbles & Industries
Eco Recycling GMR Infrastructure Ind Tra Deco
Educomp Solutions Goenka Diamond & Jewels India E-Commerce
Eins Edutech Gokaldas Exports India Infraspace
EL Forge GOL Offshore India Steel Works
Elpro International Golechha Global Finance Indiabulls Real Estate
Emami Infrastructure Govind Rubber Indian Extractions
Emergent Global Edu & Services Goyal Associates Indian Infotech & Software
Emmbi Industries GPT Infraprojects Indian Link Chain Manufacturers
Esaar (India) Gratex Industries Indianivesh
Eskay KNIt (India) Grauer & Weil (India) Indo Borax & Chemicals
Essar Ports Greenearth Resources and Projects Indokem
Ester Industries Greycells Education Indosolar
ETT GSL Nova Petrochemicals Indsoya
Eureka Industries Gujarat Apollo Industries Indu Nissan Oxo Chemical Industries
Euro Ceramics Gujarat Craft Industries Inducto Steel
Expo Gas Containers Gujarat Natural Resources Infra Industries
Faze Three Gujarat Petrosynthese Infronics Systems
FCS Software Solutions Gulf Oil Corporation Innovative Tech Pack
FE India Gulshan Polyols Innoventive Industries
Finaventure Capital Gupta Synthetics Integra Switchgear
Fintech Communication GV Films Integrated Financial Services
Exp
ecte
d R
esu
lts
on
14
No
vem
ber
201
4

Exp
ecte
d R
esu
lts
on
14
No
vem
ber
201
4
Co. Name Co. Name Co. Name
Integrated Thermoplastics KIC Metaliks Mathew Easow Research Securities
Intellivate Capital Advisors Kilburn Engineering Matra Realty
Intellivate Capital Ventures Kiran Print-Pack Maximaa Systems
Inter State Oil Carrier K-Lifestyle Industries Maxwell Industries
International Conveyors KM Sugar Mills Meenakshi Steel Industries
International Housing Finance Corporation KMF Builders & Developers Megasoft
Interworld Digital KNR Construction Meglon Infra-Real (India)
ISL Consulting Konark Synthetic Melstar Information Technologies
ISMT Kothari Fermentation & Biochem Mercury Trade Links
IST Kridhan Infra Metal Coatings (India)
ITL Industries Kriti Industries (India) Metropoli Overseas
Ivee Injectaa Kriti Nutrients MIC Electronics
Jagatjit Industries Krypton Industries Mid India Industries
Jagjanani Textiles Kshitij Investments Midas Infra Trade
Jagsonpal Pharmaceuticals KSL & Industries Milkfood
Jaipan Industries KSS Millenium Online Solution (India)
Jattashankar Industries Kuberkamal Industrial Investment Mini Diamonds (India)
Jauss Polymers Kumar Wire Cloth Mfg. Company Minolta Finance
Jaybharat Textiles & Real Estate Kwality Credit & Leasing Mirch Technologies
JBF Industries Ladderup Finance Mobile Tele Communications
JCT Laffans Petrochemicals Modern Steels
JD Orgochem Lakshmi Energy & Foods Modi Naturals
Jindal Cotex Lakshmi Precision Screws Mohit Industries
Jindal Photo Lanco Infratech Mohit Paper Mills
Jindal Poly Films Landmarc Leisure Corporation Monnet Ispat & Energy
Jindal Poly Investment and Finance Company LCC Infotech Morarka Finance
Jindal Worldwide Lesha Industries Morgan Ventures
JJ Exporters Linc Pen & Plastics Mudra Lifestyle
JK Tyre & Industries Lincoln Pharmaceuticals Mudunuru
JMT Auto Lohia Securities Mukesh Babu Financial Services
Joindre Capital Services Lok Housing & Constructions Mukesh Steels
Jolly Plastic Industries Lokesh Machines Mukesh Strips
JRI Industries & Infrastructure Longview Tea Company Muller & Phipps (India)
Jyothi Infraventures Lords Chloro Alkali Multi Commodity Exchange Of India
Kailash Auto Finance Lotus Eye Hospital And Institute Murli Industries
Kajal Synthetics & Silk Mills Luminaire Technologies MVL
Kalpena Industries Lykis Nahar Industrial Enterprises
Kanishk Steel Industries Madhucon Projects Nakoda
Karuturi Global Magna Colors NAM Securities
Kay Power and Paper Mahaan Foods Narbada Gems And Jewellery
Kaycee Industries Mahalaxmi Seamless Narendra Properties
KBS India Mahamaya Steel Industries National Aluminium Company
Kellton Tech Solutions Maharashtra Corporation National Fittings
Kerala Ayurveda Mahavir Advanced Remedies Natraj Proteins
Kernex Microsystems (India) Man Industries (India) NB Footwear
Kesar Enterprises Mangal Credit and Fincorp NCL Industries
Kesoram Industries Mangalam Drugs & Organics NCL Research & Financial Services
KG Petrochem Mangalore Chemicals & Fertilizers Neha International
KGN Industries Manipal Finance Corporation Nelcast
Khaitan Electricals Manjeera Constructions Neogem India
Khandwala Securities Mansoon Trading Company Net 4 India
Khator Fibre & Fabrics Marsons Networth Stock Broking
Exp
ecte
d R
esu
lts
on
14
No
vem
ber
201
4E
xpec
ted
Res
ult
s o
n 1
4 N
ove
mb
er 2
014

Exp
ecte
d R
esu
lts
on
14
No
vem
ber
201
4
Co. Name Co. Name Co. Name
New Markets Advisory Phaarmasia Rasi Electrodes
NHC Foods Photoquip (India) Rasoya Proteins
Nikhil Adhesives Piccadily Agro Industries Rathi Graphic Technologies
Nila Infrastructures Piccadily Sugar & Allied Industries Rathi Steel & Power
Nilkanth Engineering Pine Animation Redex Protech
Nimbus Foods Industries Pipavav Defence and Offshore Engineering Company Refnol Resins & Chemicals
Nirav Commercials PlanterS Polysacks Regal Entertainment & Consultants
Nissan Copper Poddar Developers Regency Ceramics
Nivedita Mercantile & Financing Polson Reliance Capital
Northward Technologies Polytex India Reliance Communications
Nouveau Global Ventures Pooja Entertainment & Films Remi Edelstahl Tubulars
NTC Industries Pradip Overseas Remi Elektrotechnik
Nu Tek India Prag Bosimi Synthetics Remi Process Plant & Machinery
Nutraplus India Prajay Engineers Syndicate Remi Sales & Engg.
OCL Iron and Steel Prakash Industries Remi Securities
Odyssey Corporation Pratibha Industries Repro India
Oil & Natural Gas Corporation Pratiksha Chemicals Resonance Specialties
Ojas Asset Reconstruction Company Premier Pipes Responsive Industries
OK Play India Pressman Advertising Rexnord Electronics & Controls
Olympia Capitals Prime Capital Market Ritesh International
Olympia Industries Prime Focus Ritesh Properties & Industries
Olympic Oil Industries Prime Property Development Corporation RLF
Om Metals Infraprojects Provogue (India) RM Mohite Industries
Omega Ag-Seeds (Punjab) PS IT Infrastructure & Services Rockon Fintech
Omnitech Infosolutions PSL Rodium Realty
Omnitex Industries (India) PTC India Rohit Ferro-Tech
Onelife Capital Advisors Punj Lloyd Roopa Industries
Optiemus Infracom Punjab Chemicals & Crop Protection Rossell India
Opto Circuits (India) Qpro Infotech Roto Pumps
Oricon Enterprises Quadrant Televentures Royale Manor Hotels & Industries
Oriental Veneer Products Quantum Digital Vision (India) RPP Infra Projects
Ortin Laboratories Quest Softech (India) RR Financial Consultants
Pacific Industries Raaj Medisafe India RTCL
Padmalaya Telefilms Radaan Mediaworks India RTS Power Corporation
Palred Technologies Radha Madhav Corporation Ruby Mills
Pan India Corporation Radhe Developers (India) Ruchira Papers
Panama Petrochem Raghunath International Rudraksh Cap-Tech
Panchmahal Steel Rainbow Papers Rupa & Company
Parabolic Drugs Raj Irrigation Pipes & Fittings Rutron International
Paragon Finance Raj Oil Mills S Kumars Online
Paramount Cosmetics (India) Raj Rayon Industries Saamya Biotech (India)
Parenteral Drugs (India) Rajesh Exports Sadbhav Engineering
Parnax Lab Rajesh Solvex Sadhana Nitro Chem
Parsvnath Developers Rajkamal Synthetics Sagar Soya Products
Pasupati Spinning & Weaving Mills Rajvir Industries Sagar Systech
Patel Engineering Ram Informatics Sai Baba Investment And Commercial Enterprises
Pearl Agriculture Rama Phosphates Sai Capital
Pearl Electronics Rama Vision Sai Industries
Pearl Global Industries Ramgopal Polytex Samrat Pharmachem
Pee Cee Cosma Sope Rana Sugars Samtex Fashions
Perfect-Octave Media Projects Rap Media Sanathnagar Enterprises
PG Electroplast Rasandik Engineering Industries India Sanblue Corporation
Exp
ecte
d R
esu
lts
on
14
No
vem
ber
201
4E
xpec
ted
Res
ult
s o
n 1
4 N
ove
mb
er 2
014

Exp
ecte
d R
esu
lts
on
14
No
vem
ber
201
4
Co. Name Co. Name Co. Name
Sand Plast (India) SMC Credits Supra Trends
Sanghvi Forging & Engineering Smiths & Founders (India) Supreme Infrastructure India
Sanmitra Commercial Smruthi Organics Supreme Tex Mart
Sarda Papers Softsol India Surabhi Chemicals & Investment
Saregama India Solid Carbide Tools Suraj Industries
Sarthak Industries Som Distilleries & Breweries Surana Industries
Sarvamangal Mercantile Company Soma Textiles & Industries Surya Roshni
Sathavahana Ispat Southern Online Bio Technologies Suryachakra Power Corporation
Sayaji Hotels Sovereign Diamonds Suryakrupa Finance
SBEC Sugar Sparc Systems Suryalakshmi Cotton Mills
SE Investments Spectra Industries Suryanagri Fin-Lease
SE Power Spentex Industries Suryavanshi Spinning Mills
Sea Gold Infrastructure Spice Islands Apparels Suven Life Sciences
Sea TV Network Spice Mobility Svam Softwares
Seshachal Technologies Spicejet SVC Resources
Seya Industries SPL Industries SW Investments
Shah Construction Company Splash Media & Infra Swagruha Infrastructure
Shakti Pumps (India) Springform Technology Swan Energy
Shalimar Productions SPS International Swarnasarita Gems
Sharad Fibres & Yarn Processors Square Four Projects India Swastik Safe Deposit & Investments
Shikhar Leasing & Trading Sree Rayalaseema Hi-Strength Hypo Swiss Glascoat Equipments
Shilp Gravures Sreeleathers Syncom Healthcare
Shirpur Gold Refinery Sri Adhikari Brothers Television Network T&I Global
Shiva Texyarn Sri Ganapathy Mills Company Tai Industries
Shiv-Vani Oil & Gas Exploration Services SRK Industries Tamilnadu Jai Bharath Mills
Shree Ajit Pulp & Paper SRM Energy Tarai Foods
Shree Bhawani Paper Mills SS Forgings & Engineering Tarrif Cine & Finance
Shree Ganesh Elastoplast SS Organics Tata Motors
Shree Hari Chemicals Export SSK Lifestyles Terai Tea Company
Shree Manufacturing Company Stampede Capital Terraform Magnum
Shree Nath Commercial & Finance Standard Batteries Terraform Realstate
Shree Precoated Steels Standard Capital Markets Thacker & Company
Shree Salasar Investments State Bank Of India Thambbi Modern Spinning Mills
Shree Shaleen Textiles Steel Exchange India The Great Eastern Shipping Company
Shreejal Info Hubs Steelco Gujarat The Indian Hotels Company
Shreeyash Industries Stellant Securities (India) Thomas Scott (India)
Shri Bajrang Alloys Sterling Biotech Tilaknagar Industries
Shri Jagdamba Polymers Sterling Green Woods Tirupati Industries (India)
Shri Krishna Devcon Stone India Tirupati Inks
Shri Lakshmi Cotsyn Sudal Industries Tobu Enterprises
Shristi Infrastructure Development Corporation Sudarshan Chemical Industries Tokyo Finance
Shyamal Holdings & Trading Sudev Industries Tokyo Plast International
Sikozy Realtors Sundaram Multi Pap Total Hospitality
Silveroak Commercials Sunil Hitech Engineers Transchem
Silverton Spinners Sunil Industries Transglobe Foods
Simbhaoli Sugars Sunitee Chemicals Tree House Education & Accessories
Simplex Castings Sunlake Resorts and Hotels Trend Electronics
Simplex Infrastructures Sunraj Diamond Exports Tricom Fruit Products
Simplex Projects Sunrise Soaps & Chemicals Tricom India
Simran Farms Sunshield Chemicals Trident
Sinclairs Hotels Sunteck Realty Tridev InfraEstates
Sky Industries Superhouse Trilogic Digital Media
Exp
ecte
d R
esu
lts
on
14
No
vem
ber
201
4E
xpec
ted
Res
ult
s o
n 1
4 N
ove
mb
er 2
014

Exp
ecte
d R
esu
lts
on
14
No
vem
ber
201
4
Co. Name Co. Name
Triton Corp Veritas (India)
Triveni Engineering & Industries Vertex Spinning
TTI Enterprise Videocon Industries
Tulsi Extrusions Vidhi Dyestuffs Manufacturing
Tuni Textile Mills Vippy Spinpro
TVS Motor Company Vipul Dye Chem
Twinstar Industries Visa Steel
Tyroon Tea Company Visagar Financial Services
Unimin India Vishnu Chemicals
Unison Metals Vista Pharmaceuticals
Unisys Softwares & Holding Industries VLS Finance
United Breweries (Holdings) Vogue Textiles
United Interactive Vora Constructions
Universal Office Automation VR Woodart
Ushakiran Finance Warner Multimedia
Vadilal Dairy International Warren Tea
Vaghani Techno-Build Websol Energy Systems
Vaishno Cement Company Western Ministil
Vakrangee Wim Plast
Valecha Engineering Windsor Machines
Vallabh Poly-Plast International Winsome Breweries
Vallabh Steels Worldwide Leather Exports
Valson Industries Worth Investment & Trading Co
Value Industries WS Industries (India)
Vama Industries XL Energy
Vardhman Concrete Yamini Investments
Vardhman Industries York Exports
Vaswani Industries Yuvraaj Hygiene Product
VCCL Zenith Birla (India)
Vedavaag Systems Zenith Computers
Veena Textiles Zenith Exports
Ventura Guaranty Zigma Software
Ventura Textiles Zodiac Ventures
Exp
ecte
d R
esu
lts
on
14
No
vem
ber
201
4

Co_Name Year Equity N.Sale O.O.I T. Exp O.I PBIDT Int. Dep. PBT T.Tax PAT A.PAT EPS Div (%)
7Seas Entertainment 201309 7.04 0.87 0.93 0.00 -0.05 0.18 0.69 -0.92 0.08 -1.00 -1.00 -1.42 0
7Seas Entertainment 201312 7.11 0.10 0.74 0.00 -0.63 0.17 0.66 -1.46 0.09 -1.55 -1.55 -2.18 0
7Seas Entertainment 201403 7.11 0.11 0.44 0.00 -0.33 0.20 0.79 -1.32 -1.28 -0.04 -0.04 -0.05 0
7Seas Entertainment 201406 7.11 0.11 0.53 0.00 -0.42 0.17 1.34 -1.93 -1.24 -4.06 -0.69 -5.72 0
Aankit Granites 201312 8.14 0.84 0.77 0.00 0.07 0.03 0.04 0.01 0.00 0.01 0.01 0.01 0
Aankit Granites 201403 8.14 1.15 1.13 0.03 0.05 0.07 0.02 -0.03 0.02 -0.05 -0.05 -0.06 0
Aankit Granites 201406 8.14 0.80 0.90 -0.10 0.04 0.02 -0.16 -0.16 -0.16 -0.20 0
Aarey Drugs & Pharmaceuticals 201309 16.82 57.44 56.25 0.10 1.29 0.20 0.13 0.96 0.15 0.81 0.81 0.48 0
Aarey Drugs & Pharmaceuticals 201312 16.82 58.34 57.84 0.09 0.60 0.21 0.13 0.25 0.25 0.25 0.15 0
Aarey Drugs & Pharmaceuticals 201403 16.82 36.99 37.70 1.04 0.33 0.20 0.23 -0.10 0.15 -0.25 -0.25 -0.15 0
Aarey Drugs & Pharmaceuticals 201406 16.82 34.61 33.65 0.04 1.00 0.28 0.14 0.58 0.58 0.58 0.34 0
Aarti Drugs 201309 12.11 247.80 0.15 212.74 35.21 7.80 6.84 20.57 7.72 13.76 12.84 11.36 130
Aarti Drugs 201312 12.11 221.76 0.40 184.71 37.44 9.24 6.99 21.21 7.05 14.16 14.16 11.69 130
Aarti Drugs 201403 12.11 281.79 1.25 240.34 42.70 9.17 7.59 25.94 3.99 21.95 21.95 18.13 130
Aarti Drugs 201406 12.11 259.60 0.10 219.85 39.85 9.82 7.41 22.62 5.39 17.24 17.24 14.24 130
Aarvee Denims & Exports 201309 23.46 188.26 4.84 163.62 0.21 29.69 10.82 7.93 10.94 3.37 7.58 7.58 3.23 0
Aarvee Denims & Exports 201312 23.46 149.15 4.35 134.90 0.24 18.83 10.00 8.37 0.46 -0.47 0.93 0.93 0.40 0
Aarvee Denims & Exports 201403 23.46 166.36 5.50 166.65 1.90 7.11 9.22 8.19 -10.30 -1.27 -9.03 -9.03 -3.85 0
Aarvee Denims & Exports 201406 23.46 170.28 4.06 159.44 0.55 15.46 8.53 8.51 -1.58 0.04 -1.62 -1.62 -0.69 0
ABC India 201309 5.41 39.21 0.05 38.24 0.01 1.03 2.19 2.28 9.99 0.82 9.17 9.17 17.00 10
ABC India 201312 5.41 40.32 0.06 38.66 0.04 1.76 2.59 2.31 -3.15 -0.49 -2.66 -2.66 -5.00 10
ABC India 201403 5.41 40.62 0.19 42.77 0.38 -1.58 2.11 2.19 -5.29 -1.16 -4.13 -4.13 -8.00 10
ABC India 201406 5.41 38.08 0.04 37.21 0.05 0.96 2.03 2.16 -3.23 -3.23 -3.23 -6.00 10
ABG Infralogistics 201309 11.97 19.35 8.18 1.86 13.03 6.97 9.75 -3.69 0.17 -3.86 -3.86 -3.22 14
ABG Infralogistics 201312 11.97 18.82 10.24 8.58 7.53 9.25 -8.20 -4.94 -3.26 -3.26 -2.72 14
ABG Infralogistics 201403 11.97 11.57 7.25 0.04 4.36 9.37 7.03 -12.04 -3.64 -8.40 -8.40 -7.02 14
ABG Infralogistics 201406 11.97 15.32 11.08 0.04 4.28 8.22 5.40 -2.89 -0.73 -2.16 -2.16 -1.80 14
Abhishek Corporation 201309 16.01 14.25 19.02 0.00 -4.77 24.99 7.50 -37.26 -37.26 -37.26 -23.28 0
Abhishek Corporation 201312 16.01 2.06 3.71 -1.65 13.32 3.75 -18.71 -18.71 -18.71 -11.69 0
Abhishek Corporation 201403 16.01 6.07 10.90 -4.84 13.92 3.72 -22.48 -22.48 -22.48 -14.04 0
Abhishek Corporation 201406 16.01 5.29 5.22 0.00 0.07 14.75 3.72 -18.40 0.00 -18.40 -18.40 -11.50 0
ABM Knowledgeware 201309 10.00 15.41 10.70 0.35 5.06 0.06 0.18 4.82 1.64 3.18 3.18 3.18 20
ABM Knowledgeware 201312 10.00 14.94 9.17 0.33 6.09 0.02 0.18 5.89 2.00 3.89 3.89 3.89 20
ABM Knowledgeware 201403 10.00 28.66 0.49 22.54 0.00 6.61 0.01 0.18 6.42 2.07 4.35 4.35 4.35 20
ABM Knowledgeware 201406 10.00 15.40 8.97 0.25 6.68 0.17 0.43 6.08 2.06 4.03 4.03 4.02 20
Exp
ecte
d R
esu
lts
on
14
No
vem
ber
201
4

Co_Name Year Equity N.Sale O.O.I T. Exp O.I PBIDT Int. Dep. PBT T.Tax PAT A.PAT EPS Div (%)
Exp
ecte
d R
esu
lts
on
14
No
vem
ber
201
4
Accel Transmatic 201309 11.04 0.04 0.57 0.04 -0.49 0.64 1.08 -2.21 -2.21 -2.21 -3.69 0
Accel Transmatic 201312 11.04 0.43 0.39 0.03 0.07 0.62 0.95 -1.50 -1.50 -1.50 -1.36 0
Accel Transmatic 201403 11.04 0.28 0.68 0.56 0.15 0.35 0.97 -1.17 0.00 -1.17 -1.17 -1.06 0
Accel Transmatic 201406 11.04 0.30 0.56 0.04 -0.23 0.22 0.67 -1.63 -1.63 -1.63 -1.48 0
ACE EduTrend 201309 9.16 5.74 5.11 0.63 0.63 0.63 0.63 0.69 0
ACE EduTrend 201312 9.16 5.77 5.13 0.65 0.65 0.65 0.65 0.70 0
ACE EduTrend 201403 9.16 6.19 4.05 0.00 2.15 2.68 -0.53 0.00 -0.53 -0.53 0
ACE EduTrend 201406 9.16 5.96 5.33 0.64 0.64 0.64 0.64 0.69 0
Ace Software Exports 201309 4.68 1.08 0.97 0.08 0.19 0.00 0.05 0.14 0.14 0.14 0.29 0
Ace Software Exports 201312 4.68 1.27 1.16 0.13 0.24 0.01 0.05 0.18 0.18 0.18 0.39 0
Ace Software Exports 201403 4.68 1.57 1.76 0.33 0.14 0.01 0.06 0.07 0.00 0.07 0.07 0.16 0
Ace Software Exports 201406 4.68 1.26 1.30 0.15 0.11 0.01 0.09 0.02 0.02 0.02 0.03 0
Acknit Industries 201309 2.52 31.19 2.56 31.82 0.12 2.06 0.50 0.38 1.19 0.40 0.79 0.79 3.13 15
Acknit Industries 201312 2.52 30.78 2.61 31.51 0.02 1.90 0.40 0.47 1.03 0.36 0.68 0.68 2.69 15
Acknit Industries 201403 2.52 37.85 3.22 39.36 0.18 1.89 0.51 0.50 0.89 0.36 0.52 0.52 2.08 15
Acknit Industries 201406 2.52 34.46 2.73 35.97 0.84 2.07 0.62 0.34 1.10 0.36 0.75 0.75 2.96 15
Adarsh Mercantile 201403 3.68 0.02 -0.07 -0.08 0.03 -0.11 0.00 -0.11 -0.11 -0.30 0
Adarsh Mercantile 201406 3.68 0.02 0.04 0.08 0.06 0.03 0.04 0.04 0.04 0.10 0
Addi Industries 201309 5.40 0.00 0.00 0.24 0.18 -0.05 0.00 0.13 -0.19 -0.02 -0.17 -0.17 -0.16 0
Addi Industries 201312 5.40 0.44 0.00 0.65 0.17 -0.04 0.01 0.13 -0.22 -0.03 -0.19 -0.19 -0.18 0
Addi Industries 201403 5.40 0.22 0.00 0.65 0.45 0.02 0.13 -0.11 -0.01 -0.11 -0.11 -0.10 0
Addi Industries 201406 5.40 0.29 0.58 0.29 0.00 0.15 0.14 0.03 0.11 0.11 0.10 0
Adhunik Metaliks 201309 123.50 541.04 1.98 437.24 31.30 137.08 86.51 35.95 14.62 3.15 11.47 -2.57 -0.21 0
Adhunik Metaliks 201312 123.50 595.83 0.65 481.61 33.18 148.05 93.18 35.96 18.91 1.43 17.48 17.45 1.41 0
Adhunik Metaliks 201403 123.50 720.57 0.70 575.93 10.87 156.20 93.73 35.43 27.04 4.88 22.16 22.16 1.79 0
Adhunik Metaliks 201406 123.50 695.49 1.08 585.81 12.59 123.36 103.04 38.53 -18.21 -7.55 -10.65 -10.70 -0.87 0
Adi Rasayan 201309 6.52 0.01 -0.01 -0.01 -0.01 -0.01 0
Adi Rasayan 201312 6.52 0.01 -0.01 -0.01 -0.01 -0.01 0
Adi Rasayan 201403 6.52 0.06 0.01 0.04 0.00 0.04 0.04 0.04 0.01 0
Adi Rasayan 201406 6.52 0.02 0.02 0.00 0.00 0.00 0.00 0
Adinath Textiles 201309 6.81 0.15 0.05 0.27 -0.07 0.02 -0.09 -0.09 -0.09 -0.13 0
Adinath Textiles 201312 6.81 0.20 0.17 0.30 0.00 0.08 0.01 0.02 0.04 0.04 0.04 0.06 0
Adinath Textiles 201403 6.81 0.18 0.22 0.38 0.06 0.08 0.02 0.05 0.04 0.02 0.02 0.02 0
Adinath Textiles 201406 6.81 0.22 0.25 0.29 0.19 0.04 0.14 0.03 0.11 0.11 0.16 0
Advance Powerinfra Tech 201309 11.64 1.23 1.23 0.07 0.07 0.01 0.07 0.03 0.04 0.04 0.03 0
Advance Powerinfra Tech 201312 11.64 1.87 1.88 0.05 0.04 0.00 0.01 0.03 0.00 0.03 0.03 0.02 0
Advance Powerinfra Tech 201403 11.64 7.68 0.04 7.67 0.05 0.01 0.03 0.01 0.00 0.01 0.01 0
Advance Powerinfra Tech 201406 11.64 0.53 0.55 0.06 0.05 0.02 0.03 0.01 0.02 0.02 0.02 0

Co_Name Year Equity N.Sale O.O.I T. Exp O.I PBIDT Int. Dep. PBT T.Tax PAT A.PAT EPS Div (%)
Exp
ecte
d R
esu
lts
on
14
No
vem
ber
201
4
Advik Laboratories 201309 9.35 3.41 0.31 3.30 0.00 0.42 0.27 0.14 0.02 0.01 0.01 0.01 0.01 0
Advik Laboratories 201312 15.03 8.42 -0.43 7.38 0.00 0.60 0.24 0.14 0.23 0.07 0.16 0.16 0.01 0
Advik Laboratories 201403 15.03 9.95 0.11 9.42 0.61 1.25 0.27 0.30 0.68 0.41 0.27 0.27 0.24 0
Advik Laboratories 201406 15.03 3.20 0.30 3.03 0.46 0.30 0.15 0.02 0.01 0.01 0.01 0.01 0
Aegis Logistics 201309 33.40 1562.80 0.10 1529.49 1.25 34.66 4.18 5.59 24.89 2.45 22.44 20.67 6.19 53
Aegis Logistics 201312 33.40 1561.52 0.09 1533.51 2.32 30.42 4.60 5.33 20.49 3.82 16.67 14.50 4.34 53
Aegis Logistics 201403 33.40 1099.80 0.10 1078.20 3.98 25.68 4.78 6.03 14.87 1.07 13.80 11.60 3.47 53
Aegis Logistics 201406 33.40 949.32 0.10 921.50 3.87 31.79 5.09 5.57 21.13 2.29 18.84 17.28 5.17 53
Aftek 201309 22.04 18.53 3.22 6.86 22.17 1.93 20.32 -0.09 -0.09 -0.09 -0.01 0
Aftek 201312 22.04 18.22 5.31 0.00 12.91 1.98 20.32 -9.39 -9.39 -9.39 -0.85 0
Aftek 201403 22.04 18.74 8.13 10.61 1.98 17.30 -8.67 -0.54 -8.12 -8.12 -0.74 0
Aftek 201406 22.04 15.32 0.98 0.01 14.35 1.97 14.44 -2.07 -2.07 -2.07 -0.19 0
Agarwal Industrial Corporation 201309 5.51 7.84 5.59 10.70 0.12 2.84 0.67 1.26 0.91 0.18 0.73 0.73 1.32 14
Agarwal Industrial Corporation 201312 5.51 31.96 8.68 37.97 0.08 2.75 0.97 1.26 0.53 0.32 0.21 0.21 0.38 14
Agarwal Industrial Corporation 201403 5.51 70.63 9.00 75.64 0.35 4.33 0.99 0.70 2.64 0.38 2.26 2.26 14
Agarwal Industrial Corporation 201406 5.51 52.33 8.64 55.97 0.02 5.02 0.89 1.02 3.11 0.76 2.35 2.35 4.26 14
Ahluwalia Contracts (India) 201309 12.55 248.71 0.84 252.71 1.56 -1.60 9.38 1.68 1.45 0.30 1.15 1.15 0.18 0
Ahluwalia Contracts (India) 201312 12.55 239.53 1.23 227.39 1.13 14.50 8.39 3.03 3.08 0.63 2.45 2.45 0.39 0
Ahluwalia Contracts (India) 201403 12.55 249.63 0.20 230.98 9.63 28.48 9.24 3.07 16.17 -1.11 17.29 17.29 2.75 0
Ahluwalia Contracts (India) 201406 12.55 238.69 0.19 206.08 0.95 33.75 10.16 5.68 17.90 1.01 16.89 16.89 2.69 0
AI Champdany Industries 201309 13.71 75.20 0.69 71.27 0.01 4.63 2.22 1.83 0.59 -0.02 0.61 0.61 0.22 0
AI Champdany Industries 201312 13.71 77.79 2.64 76.57 0.01 3.87 2.17 1.65 0.05 -0.01 0.07 0.07 0.02 0
AI Champdany Industries 201403 13.71 87.95 0.90 84.92 0.37 4.29 3.08 1.50 -0.29 -0.17 -0.12 -0.12 -0.04 0
AI Champdany Industries 201406 13.71 61.92 1.13 61.39 0.01 1.68 2.85 1.39 -2.57 -0.95 -1.61 -1.61 -0.59 0
Aimco Pesticides 201309 9.24 35.64 0.07 33.88 0.02 1.84 0.30 0.09 1.46 0.46 1.00 1.00 1.09 0
Aimco Pesticides 201312 9.24 28.57 0.04 27.64 0.35 1.32 0.18 0.09 1.05 0.84 0.22 0.22 0.23 0
Aimco Pesticides 201403 9.24 42.68 0.10 43.20 -0.33 -0.74 0.20 0.09 -1.03 0.01 -1.05 -1.05 -1.13 0
Aimco Pesticides 201406 9.24 46.30 0.19 44.84 0.01 1.65 0.06 0.11 1.48 -0.02 1.51 1.51 1.63 0
Aishwarya Technologies and Telecom 201309 10.78 6.96 6.13 0.12 0.95 0.39 0.24 0.32 0.26 0.05 0.05 0.02 0
Aishwarya Technologies and Telecom 201312 10.78 6.13 7.66 0.11 -1.42 0.26 0.25 -1.92 -0.75 -1.18 -1.18 -0.55 0
Aishwarya Technologies and Telecom 201403 10.78 6.74 4.30 -0.04 2.40 0.38 0.24 1.78 1.04 0.74 0.74 0.34 0
Aishwarya Technologies and Telecom 201406 10.78 5.41 5.05 0.00 0.37 0.26 0.22 -0.11 -0.10 -0.01 -0.01 -0.01 0
Ajanta Soya 201309 15.50 113.72 111.38 0.17 2.51 1.29 0.41 0.81 0.29 0.52 0.52 0.33 0
Ajanta Soya 201312 15.50 138.71 138.17 0.65 1.19 0.31 0.43 0.45 0.07 0.38 0.38 0.25 0
Ajanta Soya 201403 15.50 133.32 133.85 2.28 1.75 0.41 1.34 0.37 0.97 0.97 0.63 0
Ajanta Soya 201406 15.50 142.91 143.02 1.25 1.14 0.23 0.41 0.50 0.06 0.44 0.44 0.28 0

Co_Name Year Equity N.Sale O.O.I T. Exp O.I PBIDT Int. Dep. PBT T.Tax PAT A.PAT EPS Div (%)
Exp
ecte
d R
esu
lts
on
14
No
vem
ber
201
4
Ajmera Realty & Infra India 201309 35.48 3.92 0.65 0.99 3.59 0.92 1.35 1.32 0.33 0.99 0.90 0.25 15
Ajmera Realty & Infra India 201312 35.48 6.60 0.57 3.88 3.29 0.89 1.40 1.00 0.25 0.75 0.69 0.19 15
Ajmera Realty & Infra India 201403 35.48 64.91 2.74 50.07 5.25 22.83 0.98 1.42 20.43 4.90 15.52 14.51 4.09 15
Ajmera Realty & Infra India 201406 35.48 6.90 0.66 3.86 3.70 0.84 1.25 1.61 0.40 1.21 1.15 0.32 15
AK Capital Services 201309 6.60 23.99 13.10 0.71 11.59 3.37 0.44 7.78 2.63 5.16 5.16 7.81 60
AK Capital Services 201312 6.60 20.92 11.14 0.71 10.50 3.12 0.44 6.94 2.40 4.54 4.54 6.88 60
AK Capital Services 201403 6.60 26.48 15.26 0.71 11.93 3.23 0.44 8.27 2.82 5.44 5.44 8.25 60
AK Capital Services 201406 6.60 20.03 10.93 0.71 9.81 2.56 0.55 6.70 1.35 5.35 5.35 8.11 60
Alfa Transformers 201309 5.36 8.09 0.17 7.46 0.08 0.89 0.49 0.21 0.19 0.19 0.19 0.35 0
Alfa Transformers 201312 5.36 6.67 0.06 6.75 0.36 0.34 0.48 0.21 -0.34 -0.34 -0.34 -0.63 0
Alfa Transformers 201403 5.36 7.06 0.05 8.10 0.10 -0.90 0.46 0.20 0.15 0.15 0.15 0.28 0
Alfa Transformers 201406 5.36 4.65 0.04 4.15 0.06 0.60 0.37 0.40 -0.17 -0.17 -0.17 -0.31 0
Allied Digital Services 201309 23.09 78.09 4.17 84.76 17.47 14.96 3.06 7.08 4.86 0.22 4.64 4.52 0.98 0
Allied Digital Services 201312 23.09 64.92 -3.58 55.97 1.54 6.91 3.10 6.18 -2.64 -0.95 -1.69 -2.14 -0.47 0
Allied Digital Services 201403 23.09 40.77 -1.00 29.69 4.58 14.66 6.35 6.72 1.48 -3.36 4.84 5.67 1.23 0
Allied Digital Services 201406 23.09 68.17 -1.51 65.49 1.57 2.74 3.44 6.24 -7.13 0.19 -7.32 -7.29 -1.58 0
Alpine Housing Development Corporation 201309 6.50 7.83 7.25 0.30 0.88 0.23 0.27 0.38 0.02 0.36 0.36 0.55 10
Alpine Housing Development Corporation 201312 6.50 5.36 4.86 0.30 0.80 0.09 0.27 0.39 -0.03 0.42 0.42 0.65 10
Alpine Housing Development Corporation 201403 6.50 10.37 9.58 0.39 1.18 0.16 0.29 0.55 0.16 0.39 0.39 0.61 10
Alpine Housing Development Corporation 201406 6.50 6.72 6.27 0.32 0.76 0.13 0.28 0.36 0.05 0.31 0.31 0.48 10
Amforge Industries 201309 2.96 0.78 0.38 -0.40 0.30 0.11 -0.81 -0.81 -0.81 -0.55 0
Amforge Industries 201312 2.96 0.46 0.53 0.07 0.12 0.11 1.95 1.95 1.95 1.31 0
Amforge Industries 201403 2.96 0.69 0.73 0.04 0.11 0.05 -0.12 -0.87 0.75 0.75 0.51 0
Amforge Industries 201406 2.96 0.57 0.51 -0.06 0.11 0.09 -0.26 -0.26 -0.26 -0.17 0
Amines & Plasticizers 201309 5.50 62.08 0.03 57.04 0.21 5.28 2.22 0.38 2.67 0.95 1.73 1.73 3.12 10
Amines & Plasticizers 201312 5.50 60.76 0.03 56.38 0.19 4.59 2.21 0.40 1.98 0.52 1.46 1.46 2.66 10
Amines & Plasticizers 201403 5.50 70.27 0.03 66.49 0.21 4.01 2.45 0.64 0.93 0.27 0.66 0.66 1.20 10
Amines & Plasticizers 201406 5.50 68.95 0.03 64.74 0.20 4.45 2.43 0.45 1.57 0.46 1.11 1.11 2.01 10
Amulya Leasing & Finance 201309 5.00 0.18 0.04 0.15 0.15 0.05 0.10 0.10 0.20 0
Amulya Leasing & Finance 201312 5.00 0.18 0.05 0.13 0.13 0.05 0.08 0.08 0.16 0
Amulya Leasing & Finance 201403 5.00 0.18 0.04 0.14 0.14 0.06 0.09 0.09 0.17 0
Amulya Leasing & Finance 201406 5.00 0.21 0.03 0.18 0.18 0.06 0.12 0.12 0.24 0
Anant Raj 201309 59.02 100.19 60.08 8.34 48.45 4.58 3.74 39.80 9.68 30.11 29.42 1.02 12
Anant Raj 201312 59.02 155.51 121.64 3.62 37.49 4.22 3.91 31.73 6.64 24.46 23.74 0.83 12
Anant Raj 201403 59.02 147.71 0.00 109.61 3.69 41.80 7.31 4.15 28.17 -1.20 29.38 27.81 12
Anant Raj 201406 59.02 70.91 47.85 1.93 24.98 4.48 6.09 14.42 2.77 11.65 10.71 0.39 12

Co_Name Year Equity N.Sale O.O.I T. Exp O.I PBIDT Int. Dep. PBT T.Tax PAT A.PAT EPS Div (%)
Exp
ecte
d R
esu
lts
on
14
No
vem
ber
201
4
Ananthi Constructions 201309 4.28 0.03 -0.03 -0.03 -0.03 -0.03 0
Ananthi Constructions 201312 4.28 0.02 -0.02 -0.02 -0.02 -0.02 0
Ananthi Constructions 201403 4.28 0.07 0.02 0.05 0.01 0.05 0.05 0.05 0.11 0
Ananthi Constructions 201406 4.28 0.01 -0.01 -0.01 -0.01 -0.01 0
Andhra Pradesh Tanneries 201309 2.21 0.00 0.02 0.00 -0.02 0.00 -0.02 0.00 -0.02 -0.02 0
Andhra Pradesh Tanneries 201312 2.21 0.03 -0.03 0.00 -0.04 -0.04 -0.04 -0.82 0
Andhra Pradesh Tanneries 201403 2.21 0.02 -0.02 0.00 -0.02 -0.02 -0.02 -0.57 0
Andhra Pradesh Tanneries 201406 2.21 0.03 -0.03 0.00 -0.03 -0.03 -0.03 -0.08 0
ANG Industries 201309 15.59 39.35 33.92 5.43 5.10 1.71 -1.38 -1.38 -1.38 0
ANG Industries 201312 15.59 36.53 32.97 3.55 4.72 1.72 -2.89 -2.89 -2.89 0
ANG Industries 201403 15.59 47.07 0.00 39.64 0.00 7.43 5.65 1.74 0.04 0.00 0.04 0.04 0
ANG Industries 201406 15.59 38.49 34.66 3.83 4.54 1.73 -6.34 -6.34 -6.34 -16.28 0
Anik Industries 201309 27.75 316.77 1.68 309.31 9.80 18.95 16.48 1.36 1.11 0.10 1.02 1.02 0.37 0
Anik Industries 201312 27.75 335.42 0.71 333.91 13.55 15.76 12.64 1.35 1.77 0.09 1.68 1.68 0.61 0
Anik Industries 201403 27.75 425.88 1.03 428.53 26.43 24.81 16.16 1.32 7.33 1.99 5.34 5.34 1.93 0
Anik Industries 201406 27.75 369.63 0.25 353.46 3.09 19.51 13.99 1.51 4.02 0.45 3.57 3.57 1.29 0
Ankit Metal & Power 201309 95.38 345.45 7.52 307.79 0.53 45.72 25.43 13.44 6.85 1.79 5.06 5.06 0.53 0
Ankit Metal & Power 201312 122.08 375.74 1.16 376.64 0.58 0.84 27.05 15.09 -41.30 -16.30 -25.01 -25.01 -2.45 0
Ankit Metal & Power 201403 122.08 422.06 0.68 454.54 1.11 -30.70 36.56 17.82 -85.08 -18.07 -67.00 -67.00 -4.72 0
Ankit Metal & Power 201406 122.08 358.00 0.80 372.06 1.75 -11.52 31.77 18.55 -61.83 -61.83 -61.83 -4.36 0
Ansal Housing & Construction 201309 59.39 205.59 3.88 181.27 1.79 29.98 10.81 0.78 18.39 7.66 10.73 10.73 1.81 8
Ansal Housing & Construction 201312 59.39 183.00 4.76 158.46 6.90 36.20 18.43 0.76 18.41 6.56 11.85 11.85 2.00 8
Ansal Housing & Construction 201403 59.39 99.21 5.66 89.34 4.90 20.42 8.87 0.74 10.82 3.62 7.20 7.20 1.21 8
Ansal Housing & Construction 201406 59.39 120.96 5.81 105.24 4.37 25.90 10.05 0.93 14.92 5.11 9.81 9.81 1.65 8
Ansal Properties & Infrastructure 201309 78.70 430.66 13.68 366.50 0.79 78.63 13.08 3.57 61.99 15.88 46.11 32.43 2.06 0
Ansal Properties & Infrastructure 201312 78.70 255.42 11.66 246.08 0.08 21.08 10.79 4.37 5.92 3.63 2.29 1.49 0.09 0
Ansal Properties & Infrastructure 201403 78.70 337.79 12.03 375.11 1.91 -23.38 15.97 4.36 -43.71 -2.26 -41.45 -36.67 -2.33 0
Ansal Properties & Infrastructure 201406 78.70 273.60 8.57 249.58 0.15 32.74 10.50 5.78 16.46 8.20 8.26 7.20 0.46 0
Anshuni Commercials 201309 0.24 0.01 0.03 0.01 0.01 0.01 0.01 0.57 0
Anshuni Commercials 201312 0.24 0.01 0.03 0.02 0.02 0.02 0.02 0.74 0
Anshuni Commercials 201403 0.24 0.25 0.26 0.03 0.02 0.01 0.01 0.01 -0.01 -0.01 -0.33 0
Anshuni Commercials 201406 0.24 0.04 0.02 -0.01 -0.01 -0.01 -0.01 -0.52 0
Anuh Pharma 201309 4.18 67.42 61.75 0.93 6.60 0.02 0.51 6.08 1.94 4.14 4.14 4.96 155
Anuh Pharma 201312 4.18 66.81 61.22 1.06 6.64 0.02 0.45 6.17 1.86 4.31 4.31 5.16 155
Anuh Pharma 201403 4.18 76.61 69.20 1.77 9.18 0.06 0.40 8.72 3.03 5.69 5.69 6.81 155
Anuh Pharma 201406 4.18 75.34 66.93 1.41 9.82 0.01 0.45 9.36 2.80 6.56 6.56 7.86 155

Co_Name Year Equity N.Sale O.O.I T. Exp O.I PBIDT Int. Dep. PBT T.Tax PAT A.PAT EPS Div (%)
Exp
ecte
d R
esu
lts
on
14
No
vem
ber
201
4
Anukaran Commercial Enterprises 201309 19.37 10.21 10.21 0.01 0.00 0.00 0.00 0.00 0
Anukaran Commercial Enterprises 201312 19.37 2.68 3.09 0.70 0.28 0.28 0.28 0.28 0
Anukaran Commercial Enterprises 201403 19.37 0.47 0.29 -0.18 -0.18 0.04 -0.22 -0.22 -0.01 0
Anukaran Commercial Enterprises 201406 19.37 0.06 0.35 0.30 0.30 0.30 0.30 0.02 0
Apte Amalgamations 201309 1.95 0.03 -0.03 0.61 0.01 -0.65 -0.65 -0.65 -3.33 0
Apte Amalgamations 201312 1.95 0.00 0.01 0.00 0.65 0.01 -0.67 -0.67 -0.67 -3.42 0
Apte Amalgamations 201403 1.95 0.45 0.29 0.17 0.56 0.01 -0.40 -0.40 -0.40 -2.06 0
Apte Amalgamations 201406 1.95 0.01 0.02 -0.01 0.70 0.01 -0.72 -0.72 -0.72 -3.71 0
Aptech 201309 44.99 49.60 40.01 3.24 12.83 0.11 1.97 10.75 2.05 8.70 8.68 1.81 45
Aptech 201312 40.26 37.22 1.37 30.97 1.79 9.41 0.13 2.14 7.14 1.60 5.54 5.52 1.20 45
Aptech 201403 39.89 48.04 2.42 37.45 0.73 13.74 0.03 2.07 11.64 2.37 9.27 9.27 2.09 45
Aptech 201406 39.89 41.93 1.50 37.88 1.17 6.72 0.16 2.52 4.04 0.92 3.12 3.11 0.78 45
Aravali Securities & Finance 201309 15.15 0.12 0.16 0.12 0.07 0.45 0.02 -0.39 1.56 -1.95 -1.95 -1.29 0
Aravali Securities & Finance 201312 15.15 0.15 0.13 0.12 0.13 0.38 0.02 -0.27 0.00 -0.27 -0.27 -0.18 0
Aravali Securities & Finance 201403 15.15 0.05 0.14 1.36 1.27 0.24 0.02 1.01 0.06 0.95 0.95 6.28 0
Aravali Securities & Finance 201406 15.15 0.13 0.17 0.08 0.04 0.28 0.03 -0.27 -0.27 -0.27 -0.18 0
Arcee Industries 201309 5.14 2.44 2.71 0.11 -0.17 0.09 0.06 -0.32 -0.32 -0.32 0
Arcee Industries 201312 5.14 3.74 3.79 0.12 0.07 0.07 0.06 -0.06 -0.06 -0.06 0
Arcee Industries 201403 5.14 2.65 2.64 -0.20 -0.18 0.07 0.06 -0.31 -0.18 -0.13 -0.13 -0.25 0
Arcee Industries 201406 5.14 6.25 5.78 0.01 0.48 0.07 0.06 0.36 0.36 0.36 0.70 0
Archidply Industries 201309 22.07 59.88 55.16 0.24 4.96 2.25 1.37 1.34 0.24 1.11 1.11 0.05 0
Archidply Industries 201312 22.07 54.90 50.16 0.28 5.02 2.27 1.43 1.33 0.15 1.18 1.18 0.05 0
Archidply Industries 201403 22.07 64.75 60.38 0.70 5.07 2.52 1.40 1.15 0.31 0.87 0.84 0.04 0
Archidply Industries 201406 22.07 62.99 57.58 0.03 5.44 2.11 2.12 1.22 -0.05 1.27 1.27 0.57 0
Archit Organosys 201309 3.04 11.03 10.63 0.07 0.47 0.21 0.07 0.19 0.06 0.13 0.13 0.44 0
Archit Organosys 201312 3.04 12.36 11.93 0.17 0.60 0.26 0.07 0.26 0.09 0.17 0.17 0.57 0
Archit Organosys 201403 3.04 13.75 0.01 13.25 -0.23 0.29 0.05 0.08 0.16 0.03 0.14 0.14 0.45 0
Archit Organosys 201406 3.04 14.92 0.09 14.44 0.30 0.86 0.42 0.12 0.33 0.26 0.07 0.07 0.24 0
Ardi Investments & Trading Company 201312 0.40 0.01 0.01 0.00 0.00 0.00 0.00 0.00 0.00 0.00 -0.03 0
Ardi Investments & Trading Company 201403 0.40 0.01 0.01 0.00 0.00 0.00 0.00 0.00 0.04 0
Ardi Investments & Trading Company 201406 0.40 0.00 0.00 0.00 0.00 0.00 -0.02 0
Aries Agro 201309 13.00 75.57 61.79 0.03 13.81 6.37 2.33 5.10 2.49 2.62 3.26 2.51 20
Aries Agro 201312 13.00 78.42 55.31 0.41 23.51 8.19 2.10 13.22 3.39 9.51 8.27 6.36 20
Aries Agro 201403 13.00 96.00 88.71 1.49 8.78 7.81 2.08 -1.10 -0.80 -0.30 -0.77 -0.59 20
Aries Agro 201406 13.00 51.25 40.36 0.25 11.13 4.71 2.31 4.12 0.72 3.40 2.77 2.13 20

Co_Name Year Equity N.Sale O.O.I T. Exp O.I PBIDT Int. Dep. PBT T.Tax PAT A.PAT EPS Div (%)
Exp
ecte
d R
esu
lts
on
14
No
vem
ber
201
4
Arihant Avenues & Credit 201309 7.32 0.11 0.05 0.05 0.05 0.02 0.04 0.04 0.01 0
Arihant Avenues & Credit 201312 7.32 0.13 0.04 0.09 0.09 0.03 0.06 0.06 0.09 0
Arihant Avenues & Credit 201403 7.32 0.11 0.20 -0.09 -0.09 -0.09 -0.09 -0.12 0
Arihant Avenues & Credit 201406 7.32 0.11 0.06 0.05 0.05 0.02 0.03 0.03 0.04 0
Arihant Multi Commercial 201309 3.62 3.26 3.24 0.10 0.12 0.12 0.12 0.12 0.32 0
Arihant Multi Commercial 201312 3.62 9.64 9.50 0.23 0.37 0.37 0.37 0.37 0.10 0
Arihant Multi Commercial 201403 3.62 17.60 17.65 0.44 0.39 0.00 0.39 0.32 0.07 0.07 0.02 0
Arihant Multi Commercial 201406 3.62 13.84 13.73 0.44 0.55 0.00 0.55 0.55 0.55 0.15 0
Arora Fibres 201309 10.05 13.45 12.16 0.07 1.36 0.42 0.31 0.63 0.63 0.63 0.63 0
Arora Fibres 201312 10.05 11.40 12.26 -0.86 0.49 0.30 -1.64 -1.64 -1.64 -1.63 0
Arora Fibres 201403 10.05 26.49 20.50 0.01 5.99 0.64 0.07 5.28 0.00 5.28 5.28 5.25 0
Arora Fibres 201406 10.05 13.46 13.41 0.05 0.23 0.23 -0.41 -0.41 -0.41 -0.40 0
Arshiya 201309 12.38 76.68 115.18 0.00 -38.50 35.58 4.68 -75.15 -75.15 -75.15 -12.14 0
Arshiya 201312 12.38 61.70 80.50 0.02 -18.78 49.30 4.69 -73.35 15.40 -88.75 -88.75 -14.34 0
Arshiya 201403 13.43 70.66 0.33 81.14 14.42 4.28 65.58 5.26 -82.31 -0.67 -81.64 -81.64 -13.18 0
Arshiya 201406 14.49 73.61 69.50 0.25 4.36 96.59 26.33 -121.10 -121.10 -121.10 -16.72 0
Artefact Projects 201309 5.53 7.79 6.59 0.45 1.66 1.05 0.24 0.37 -0.14 0.51 0.48 0.87 8
Artefact Projects 201312 5.53 6.77 5.90 0.46 1.32 1.49 0.25 -0.42 0.09 -0.51 -0.58 -1.04 8
Artefact Projects 201403 5.53 10.79 8.69 0.37 2.46 0.74 0.26 1.46 0.75 0.71 0.61 1.11 8
Artefact Projects 201406 5.53 5.05 3.87 0.51 1.68 0.73 0.20 0.76 0.34 0.42 0.42 0.75 8
Asahi Industries 201309 6.64 63.55 59.47 4.08 0.37 3.44 0.27 0.05 0.22 0.22 0.03 0
Asahi Industries 201312 6.64 66.09 62.03 4.07 0.37 3.40 0.30 0.06 0.24 0.24 0.04 0
Asahi Industries 201403 6.64 69.73 66.87 2.86 0.35 3.40 -0.89 -1.08 0.19 0.19 -0.13 0
Asahi Industries 201406 6.64 88.46 84.45 4.01 0.33 3.40 0.28 0.05 0.23 0.23 0.03 0
Aseem Global 201309 10.58 108.75 0.10 107.76 0.42 1.51 0.92 0.13 0.46 0.18 0.28 0.28 0.26 1
Aseem Global 201312 10.58 65.03 0.04 63.13 0.07 2.02 1.16 0.13 0.73 0.24 0.49 0.49 0.46 1
Aseem Global 201403 10.58 97.75 0.12 96.21 0.13 1.80 1.24 0.14 0.41 0.23 0.18 0.18 0.17 1
Aseem Global 201406 10.58 48.45 0.13 47.17 0.01 1.42 1.24 0.06 0.12 0.03 0.09 0.09 0.08 1
Ashiana Ispat 201309 4.26 62.20 60.74 1.46 0.97 0.35 0.15 0.05 0.10 0.10 0.97 0
Ashiana Ispat 201312 4.26 69.95 68.55 1.40 0.85 0.35 0.21 0.05 0.15 0.15 1.44 0
Ashiana Ispat 201403 4.26 74.49 0.20 68.76 5.93 3.49 0.52 1.92 0.43 1.48 1.48 3.44 0
Ashiana Ispat 201406 4.26 68.52 65.50 3.02 1.60 0.39 1.03 0.33 0.70 0.70 6.53 0
Asis Logistics 201309 0.32 19.88 16.58 2.30 5.59 4.73 4.00 -3.14 -3.14 -3.14 -99.41 0
Asis Logistics 201312 0.32 8.10 8.43 0.03 -0.31 1.46 2.00 -3.76 -3.76 -3.76 -119.13 0
Asis Logistics 201403 0.75 9.27 9.93 0.25 -0.42 -2.99 2.18 0.39 -1.28 1.67 1.67 334.02 0
Asis Logistics 201406 0.75 8.15 8.67 0.05 -0.47 0.02 2.05 -2.54 -2.54 -2.54 -803.33 0

Co_Name Year Equity N.Sale O.O.I T. Exp O.I PBIDT Int. Dep. PBT T.Tax PAT A.PAT EPS Div (%)
Exp
ecte
d R
esu
lts
on
14
No
vem
ber
201
4
Assam Company India 201309 30.98 72.57 2.95 40.49 11.13 46.16 10.73 1.49 33.94 33.94 33.94 1.10 0
Assam Company India 201312 30.98 89.05 2.72 73.64 0.00 18.13 14.05 1.49 2.59 0.00 2.59 2.59 0.08 0
Assam Company India 201403 30.98 27.08 18.34 47.20 -1.78 22.44 1.19 -25.41 -25.41 -25.41 -0.82 0
Assam Company India 201406 30.98 20.63 4.11 16.30 8.44 11.49 1.21 -4.26 -4.26 -4.26 -0.14 0
Asya Infosoft 201309 3.00 0.02 0.01 0.00 0.00 0.00 0.00 0.00 0.00 0.00 0.01 0
Asya Infosoft 201312 3.00 0.03 0.03 0.00 0.00 0.00 0.00 0.01 0
Asya Infosoft 201403 3.00 0.15 0.06 0.09 0.09 0.02 0.08 0.08 0.02 0
Asya Infosoft 201406 3.00 0.03 0.02 0.00 0.00 0.00 0.00 0.01 0
Atlanta Devcon 201309 12.25 0.01 -0.01 -0.01 -0.01 -0.01 0
Atlanta Devcon 201312 12.25 0.01 -0.01 -0.01 -0.01 -0.01 0
Atlanta Devcon 201403 14.06 0.01 -0.01 -0.01 -0.01 -0.01 0
Atlanta Devcon 201406 14.06 0.02 -0.02 -0.02 -0.02 -0.02 0
Atlanta Infrastructure and Finance 201309 11.10 -0.20 0.05 -0.25 0.00 -0.26 -0.26 -0.26 -0.23 0
Atlanta Infrastructure and Finance 201312 11.55 1.28 1.28 0.00 0.01 0.00 0.00 0.00 0.00 0
Atlanta Infrastructure and Finance 201403 11.55 0.78 0.35 0.42 0.01 0.41 0.00 0.41 0.41 0.04 0
Atlanta Infrastructure and Finance 201406 11.55 4.08 4.08 0.01 0.00 0.00 0.00 0.00 0
AUNDE India 201309 10.72 41.00 36.59 0.32 4.73 1.99 1.11 1.64 0.33 1.31 1.31 1.22 0
AUNDE India 201312 10.72 28.14 23.52 0.10 4.73 2.13 1.11 1.49 0.30 1.19 1.19 1.11 0
AUNDE India 201403 10.72 34.26 29.80 0.67 5.13 2.25 1.14 1.74 0.35 1.40 1.40 1.30 0
AUNDE India 201406 10.72 31.55 28.84 0.11 2.82 2.47 0.76 -0.41 0.12 -0.53 -0.53 -0.50 0
Aurangabad Paper Mills 201309 5.81 0.14 -0.14 0.13 -0.28 -0.28 -0.28 0
Aurangabad Paper Mills 201312 5.81 0.10 0.01 -0.09 0.13 -0.23 -0.23 -0.23 0
Aurangabad Paper Mills 201403 5.81 0.02 0.00 -0.02 0.13 -10.13 -10.13 -10.13 0
Aurangabad Paper Mills 201406 5.81 0.06 -0.06 0.12 -0.18 -0.18 -0.18 0
Aurum Soft Systems 201309 13.02 2.96 2.83 0.34 0.48 0.27 0.21 0.11 0.10 0.10 0.02 0
Aurum Soft Systems 201312 13.02 2.90 2.90 0.06 0.05 0.27 -0.22 0.08 -0.30 -0.30 -0.05 0
Aurum Soft Systems 201403 13.02 2.78 2.65 -0.11 0.02 0.27 -5.60 -0.23 -5.37 -5.37 -0.83 0
Aurum Soft Systems 201406 13.02 2.82 2.68 0.12 0.26 0.27 -0.01 0.00 -0.01 -0.01 0.06 0
Autoriders Finance 201309 13.11 0.03 0.01 -0.03 -0.03 -0.03 -0.03 0
Autoriders Finance 201312 13.11 0.00 0.00 0.00 0.00 0.00 0
Autoriders Finance 201403 13.11 0.00 0.00 -0.74 -0.74 -0.74 0
Autoriders Finance 201406 13.11 0.00 0.00 0.00 0.00 0.00 0
Avonmore Capital & Management Services 201309 14.42 0.15 0.11 0.04 0.01 0.03 0.03 -3.51 -2.56 0
Avonmore Capital & Management Services 201312 14.42 0.13 0.15 0.01 -0.01 -0.01 -0.09 0.08 0.66 0.47 0
Avonmore Capital & Management Services 201403 14.42 0.02 0.21 -0.19 -0.01 -0.18 -0.03 -0.15 3.36 2.54 0
Avonmore Capital & Management Services 201406 21.92 1.07 0.74 0.30 0.01 1.52 0.17 1.35 1.35 7.15 3.36 0

Co_Name Year Equity N.Sale O.O.I T. Exp O.I PBIDT Int. Dep. PBT T.Tax PAT A.PAT EPS Div (%)
Exp
ecte
d R
esu
lts
on
14
No
vem
ber
201
4
Axis Capital Markets (India) 201309 5.80 -0.02 0.44 0.02 0.40 0.00 0.39 0.00 0.40 0.40 0.68 13
Axis Capital Markets (India) 201312 5.80 0.04 -0.04 0.00 -0.05 -0.05 -0.05 -0.08 13
Axis Capital Markets (India) 201403 5.80 0.02 -0.02 0.00 -0.03 -0.03 -0.03 -0.04 13
Axis Capital Markets (India) 201406 5.78 4.26 0.08 0.34 4.00 0.02 0.11 3.87 1.14 2.73 2.01 3.48 13
Axis Rail India 201309 4.39 0.03 -0.03 -0.03 -0.03 -0.03 -0.06 0
Axis Rail India 201312 4.39 0.00 0.00 0.00 0.00 0.00 -0.01 0
Axis Rail India 201403 4.39 0.00 0.00 0.00 0.00 0.00 -0.01 0
Axis Rail India 201406 4.39 0.00 0.00 0.00 0.00 0.00 -0.01 0
B Nanji Enterprises 201309 5.50 0.54 -1.00 0.06 1.60 1.56 0.07 -0.03 -0.03 -0.03 -0.03 0
B Nanji Enterprises 201312 5.50 3.37 1.15 2.22 1.41 0.07 0.74 0.74 0.74 1.35 0
B Nanji Enterprises 201403 5.50 13.56 0.71 11.49 0.00 2.78 1.37 0.07 1.34 0.65 0.68 0.68 1.24 0
B Nanji Enterprises 201406 5.50 4.41 2.33 0.01 2.09 1.30 0.06 0.73 0.00 0.73 0.73 1.33 0
Bacil Pharma 201309 5.89 0.02 0.02 -0.01 0.00 -0.01 -0.01 -0.01 0
Bacil Pharma 201312 5.89 0.02 0.01 -0.01 -0.01 -0.01 -0.01 0
Bacil Pharma 201403 5.89 0.10 0.02 -0.08 0.00 -0.08 -0.08 -0.08 0
Bacil Pharma 201406 5.89 0.03 0.01 -0.02 -0.02 -0.02 -0.02 -0.03 0
Bagalkot Udyog 201309 0.85 0.00 0.00 0.00 0.00 0.00 0.00 0
Bagalkot Udyog 201312 0.85 0.02 -0.02 0.00 -0.02 -0.02 -0.02 0
Bagalkot Udyog 201403 0.85 0.10 0.25 -0.15 0.00 -0.15 -0.15 -0.15 0
Bagalkot Udyog 201406 0.85 0.01 -0.01 -0.01 -0.01 -0.01 0
Bajrang Finance 201309 1.40 0.15 0.00 0.02 0.13 0.13 0.04 0.09 0.09 0.64 0
Bajrang Finance 201312 1.40 0.13 0.02 0.11 0.11 0.06 0.05 0.05 0.34 0
Bajrang Finance 201403 1.40 0.12 0.04 0.00 0.09 0.09 0.03 0.06 0.06 0.43 0
Bajrang Finance 201406 1.40 0.13 0.02 0.11 0.11 0.04 0.08 0.08 0.55 0
Balaji Amines 201309 6.48 161.01 133.26 0.72 28.48 7.13 3.79 17.56 5.83 11.74 11.74 3.62 50
Balaji Amines 201312 6.48 137.51 118.08 0.54 19.97 8.70 4.50 6.78 2.58 4.20 4.20 1.30 50
Balaji Amines 201403 6.48 171.50 150.37 0.54 21.67 8.33 4.41 8.93 -0.16 9.09 9.09 2.81 50
Balaji Amines 201406 6.48 164.47 139.51 0.78 25.74 8.36 4.90 12.48 3.17 9.31 9.31 2.87 50
Bannari Amman Spinning Mills 201309 15.75 183.46 3.26 150.43 36.29 9.11 9.10 18.08 5.78 12.30 12.30 7.81 20
Bannari Amman Spinning Mills 201312 15.75 171.35 3.55 147.87 0.07 27.09 8.94 9.13 9.02 2.88 6.14 6.14 3.90 20
Bannari Amman Spinning Mills 201403 15.75 187.94 3.88 170.93 0.94 21.83 10.36 7.82 3.66 0.90 2.76 2.76 1.75 20
Bannari Amman Spinning Mills 201406 15.75 168.38 4.18 146.11 26.45 10.26 7.49 8.70 2.70 6.00 6.00 3.81 20
Barak Cement 201309 22.16 22.99 0.15 21.06 -0.18 1.90 2.94 2.02 -3.10 -3.10 -3.10 -1.40 0
Barak Cement 201312 22.16 26.47 0.00 24.66 0.05 1.86 2.96 2.07 -3.19 -3.19 -3.19 -1.44 0
Barak Cement 201403 22.16 41.49 0.06 36.96 0.16 4.75 2.97 2.01 -0.47 -0.16 -0.31 -0.31 -0.14 0
Barak Cement 201406 22.16 40.52 35.59 0.02 4.96 2.76 1.96 0.23 0.23 0.23 0.10 0

Co_Name Year Equity N.Sale O.O.I T. Exp O.I PBIDT Int. Dep. PBT T.Tax PAT A.PAT EPS Div (%)
Exp
ecte
d R
esu
lts
on
14
No
vem
ber
201
4
Bartronics India 201309 34.05 4.42 6.96 15.79 13.25 14.00 13.33 -14.08 -14.11 0.03 0.03 0.01 0
Bartronics India 201312 34.05 5.47 11.31 -6.38 -12.22 13.59 12.46 -38.26 -7.03 -31.24 -31.24 -9.17 0
Bartronics India 201403 34.05 11.23 11.53 -11.29 -11.59 11.68 12.14 -35.41 -2.94 -32.48 -32.48 -9.54 0
Bartronics India 201406 34.05 5.18 5.36 0.98 0.79 11.96 11.36 -22.53 -2.66 -19.88 -19.88 -5.84 0
BCL Industries & Infrastructures 201309 14.15 125.16 119.40 1.61 7.37 4.19 2.94 0.24 0.24 0.24 0
BCL Industries & Infrastructures 201312 14.15 182.46 0.20 176.52 0.96 7.10 3.69 3.04 0.37 0.37 0.37 0
BCL Industries & Infrastructures 201403 14.15 207.21 198.24 0.90 9.87 1.69 2.42 5.76 1.49 4.27 4.27 0
BCL Industries & Infrastructures 201406 14.15 147.26 139.43 0.99 8.82 4.50 2.62 1.70 0.25 1.45 1.45 0
BDH Industries 201309 5.76 9.28 0.00 8.56 0.36 1.08 0.20 0.20 0.69 0.22 0.47 0.47 0.81 12
BDH Industries 201312 5.76 10.91 0.00 9.97 0.34 1.29 0.21 0.19 0.89 0.29 0.60 0.60 1.05 12
BDH Industries 201403 5.76 12.87 0.00 11.77 0.39 1.49 0.19 0.18 1.13 0.37 0.76 0.76 1.32 12
BDH Industries 201406 5.76 12.18 0.00 11.06 0.31 1.44 0.14 0.19 1.10 0.36 0.75 0.75 1.29 12
Bell Agromachina 201309 3.50 0.02 0.00 0.01 0.01 0.00 0.01 0.01 0.01 0
Bell Agromachina 201312 3.50 0.03 0.03 0.01 0.00 0.00 0.00 0.00 0
Bell Agromachina 201403 3.50 0.02 0.02 0.00 0.00 0.00 0.00 0.00 0.00 0
Bell Agromachina 201406 3.50 0.03 0.02 0.00 0.00 0.00 0.00 0.00 0
BEML 201309 41.64 743.21 7.85 751.12 7.04 6.98 33.15 13.10 -38.83 0.05 -38.88 -38.88 -9.34 10
BEML 201312 41.64 772.20 11.10 743.67 8.57 48.20 29.68 13.14 5.51 5.51 5.51 1.32 10
BEML 201403 41.64 773.51 6.11 730.03 35.55 85.14 17.67 14.22 68.24 4.35 63.89 63.89 15.34 10
BEML 201406 41.64 498.08 3.61 569.00 5.63 -61.68 21.38 12.47 -95.53 -95.53 -95.53 -22.94 10
Best Eastern Hotels 201309 1.69 0.69 0.65 0.04 0.05 0.12 -0.13 -0.04 -0.09 -0.09 -0.11 10
Best Eastern Hotels 201312 1.69 1.26 0.00 1.00 0.00 0.27 0.05 0.13 0.09 0.03 0.07 0.07 0.04 10
Best Eastern Hotels 201403 1.69 1.34 0.14 0.92 0.02 0.58 0.04 0.12 0.42 0.16 0.25 0.25 0.15 10
Best Eastern Hotels 201406 1.69 1.70 1.12 0.57 0.05 0.14 0.39 0.14 0.25 0.25 0.15 10
Betex India 201309 1.50 10.59 10.08 0.00 0.52 0.08 0.22 0.23 0.04 0.19 0.19 1.25 0
Betex India 201312 1.50 10.27 9.65 0.00 0.63 0.00 0.29 0.33 0.03 0.30 0.30 2.02 0
Betex India 201403 1.50 9.84 8.54 0.31 1.61 0.56 0.44 0.61 0.35 0.26 0.26 1.75 0
Betex India 201406 1.50 10.08 9.32 0.00 0.77 0.07 0.33 0.36 -0.03 0.39 0.39 2.59 0
Bhagawati Gas 201309 16.74 0.30 0.03 -0.27 0.06 0.15 -0.47 -0.47 -0.47 -0.28 0
Bhagawati Gas 201312 16.74 0.28 0.01 -0.27 0.05 0.15 -0.48 -0.48 -0.48 -0.28 0
Bhagawati Gas 201403 16.74 0.15 0.01 -0.14 0.05 0.15 -0.33 -0.33 -0.33 -0.20 0
Bhagawati Gas 201406 16.74 0.17 -0.17 0.03 0.14 -0.34 -0.34 -0.34 -0.20 0
Bhageria Dye-Chem 201309 7.96 88.79 85.35 0.12 3.55 0.46 0.19 2.90 0.77 2.13 2.13 2.68 35
Bhageria Dye-Chem 201312 7.96 88.88 86.10 0.25 3.02 0.26 0.24 2.53 1.20 1.33 1.33 1.67 35
Bhageria Dye-Chem 201403 7.96 139.99 126.55 2.15 15.59 0.37 0.24 14.98 4.60 10.38 10.38 13.03 35
Bhageria Dye-Chem 201406 7.96 181.62 156.48 0.61 25.75 0.39 0.28 25.08 8.50 16.58 16.58 20.82 35

Co_Name Year Equity N.Sale O.O.I T. Exp O.I PBIDT Int. Dep. PBT T.Tax PAT A.PAT EPS Div (%)
Exp
ecte
d R
esu
lts
on
14
No
vem
ber
201
4
Bhagiradha Chemicals & Industries 201309 5.05 38.89 37.31 0.85 2.44 0.40 0.97 1.07 0.02 1.06 1.06 2.09 10
Bhagiradha Chemicals & Industries 201312 5.05 46.85 43.85 0.19 3.20 1.60 1.30 0.30 -0.32 0.61 0.61 1.21 10
Bhagiradha Chemicals & Industries 201403 5.05 47.73 46.04 0.95 2.64 1.12 1.36 0.16 0.21 -0.05 -0.05 -0.09 10
Bhagiradha Chemicals & Industries 201406 5.05 64.32 62.11 0.97 3.17 1.29 0.67 1.21 0.59 0.62 0.62 1.22 10
Bharat Heavy Electricals 201309 489.52 8819.00 165.35 8572.42 497.90 909.83 24.66 238.68 646.49 190.54 455.95 455.95 1.86 142
Bharat Heavy Electricals 201312 489.52 8462.38 172.47 7648.91 290.78 1276.72 32.28 241.61 1002.83 308.02 694.81 694.81 2.84 142
Bharat Heavy Electricals 201403 489.52 14754.89 276.62 12298.13 288.87 3022.25 47.93 271.83 2696.48 851.89 1844.59 1844.59 7.54 142
Bharat Heavy Electricals 201406 489.52 5067.59 87.38 4937.05 347.79 565.71 47.27 272.54 245.90 52.40 193.50 193.50 0.79 142
Bharatiya Global Infomedia 201309 15.84 8.87 7.39 0.01 1.49 0.01 1.04 0.44 0.08 0.35 0.36 0.22 0
Bharatiya Global Infomedia 201312 15.84 9.46 8.18 0.01 1.29 0.05 1.07 0.17 0.03 0.14 0.14 0.09 0
Bharatiya Global Infomedia 201403 15.84 26.70 25.04 0.08 1.73 0.06 1.18 0.49 0.10 0.39 0.39 0.24 0
Bharatiya Global Infomedia 201406 15.84 8.34 7.81 0.01 0.54 0.09 1.09 -0.63 -0.63 -0.63 -0.40 0
Bhushan Steel 201309 45.30 2176.39 91.10 1568.64 9.11 707.96 389.24 235.14 83.58 23.52 60.06 60.06 2.52 25
Bhushan Steel 201312 45.30 2318.29 88.87 1805.52 3.40 605.04 432.08 242.28 -69.32 -14.53 -54.79 -54.79 -2.55 25
Bhushan Steel 201403 45.30 2407.52 102.80 1854.68 13.29 668.93 439.37 252.56 -23.00 -3.43 -19.57 -19.57 -0.99 25
Bhushan Steel 201406 45.30 2671.28 130.40 2086.34 2.04 717.38 552.49 306.52 -141.63 -141.63 -141.63 -6.37 25
Bihar Sponge Iron 201309 90.25 5.77 0.27 9.21 0.15 -3.02 2.77 0.86 -6.65 -6.65 -6.65 -0.74 0
Bihar Sponge Iron 201312 90.25 0.23 0.70 0.15 -0.32 0.44 0.87 -1.63 -1.63 -1.63 -0.18 0
Bihar Sponge Iron 201403 90.25 1.27 0.89 2.06 2.44 0.83 0.58 0.58 0.58 0.06 0
Bihar Sponge Iron 201406 90.25 0.27 0.78 0.18 -0.33 0.08 0.85 -1.26 -1.26 -1.26 -0.14 0
Bilcare 201309 23.55 849.99 9.58 812.21 47.36 60.56 51.49 -41.41 18.53 -59.99 -58.25 -24.73 0
Bilcare 201312 23.55 774.29 3.24 735.49 42.04 62.23 37.88 -58.07 8.76 -66.85 -66.48 -28.23 0
Bilcare 201403 23.55 725.36 12.60 644.69 93.27 56.91 39.24 -15.71 3.85 -19.45 -19.33 -8.21 0
Bilcare 201406 23.55 690.65 5.10 641.05 54.70 50.04 38.00 -12.03 -2.31 -9.72 -9.89 -4.20 0
Bimetal Bearings 201309 3.83 36.92 1.48 35.69 1.26 3.96 0.06 1.11 2.80 0.90 1.90 1.90 4.96 70
Bimetal Bearings 201312 3.83 32.01 1.16 32.89 1.04 1.32 0.05 1.14 0.12 -0.09 0.21 0.21 0.54 70
Bimetal Bearings 201403 3.83 37.53 1.63 37.56 1.44 3.04 0.11 1.09 1.84 0.27 1.57 1.57 4.11 70
Bimetal Bearings 201406 3.83 34.17 1.42 34.76 1.18 2.00 0.07 1.37 0.56 0.18 0.39 0.39 1.01 70
Binayak Tex Processors 201309 0.71 40.94 38.70 0.30 2.54 1.17 0.21 1.16 0.39 0.77 0.77 10.82 20
Binayak Tex Processors 201312 0.71 42.94 40.16 0.29 3.07 0.86 0.21 2.00 0.62 1.38 1.38 19.34 20
Binayak Tex Processors 201403 0.71 49.00 47.79 0.98 2.19 1.16 0.22 0.81 0.33 0.48 0.48 6.74 20
Binayak Tex Processors 201406 0.71 37.13 35.70 0.30 1.74 0.60 0.22 0.92 0.30 0.62 0.62 8.72 20
Binny 201309 11.16 2.29 0.84 0.03 1.48 0.06 1.42 -0.54 -34.82 1.96 -15.60 0
Binny 201312 11.16 2.42 1.19 0.03 1.26 0.06 1.20 -19.17 1.20 -8.59 0
Binny 201403 11.16 2.23 5.13 0.12 -2.78 2.03 0.06 -7.78 -7.78 -7.78 -3.49 0
Binny 201406 11.16 2.39 0.63 0.10 1.86 0.22 0.07 1.57 0.29 1.28 1.28 0.57 0

Co_Name Year Equity N.Sale O.O.I T. Exp O.I PBIDT Int. Dep. PBT T.Tax PAT A.PAT EPS Div (%)
Exp
ecte
d R
esu
lts
on
14
No
vem
ber
201
4
Biofil Chemicals & Pharmaceuticals 201309 16.27 0.91 0.80 0.01 0.12 0.04 0.05 0.03 0.03 0.03 0
Biofil Chemicals & Pharmaceuticals 201312 16.27 1.97 1.16 2.64 0.01 0.50 0.04 0.05 0.41 0.41 0.41 0.03 0
Biofil Chemicals & Pharmaceuticals 201403 16.27 1.13 1.13 1.46 0.03 0.83 0.04 0.07 0.71 0.12 0.59 0.59 0.36 0
Biofil Chemicals & Pharmaceuticals 201406 16.27 0.50 0.50 0.15 0.14 0.04 0.06 0.05 0.05 0.05 0
Birla Capital And Financial Services 201309 7.81 0.11 0.30 -0.19 0.00 -0.19 0.24 -0.44 -0.44 -0.11 0
Birla Capital And Financial Services 201312 7.81 0.05 0.21 0.43 0.27 0.01 0.00 0.25 0.25 0.25 0.07 0
Birla Capital And Financial Services 201403 9.38 0.08 0.92 0.08 -0.77 0.01 0.01 -0.54 -0.07 -0.47 -0.47 -0.12 0
Birla Capital And Financial Services 201406 9.38 0.42 0.41 0.13 0.15 0.00 0.01 0.14 -0.31 0.14 -0.07 0
Birla Cotsyn (India) 201309 266.86 26.17 4.36 30.89 0.96 0.61 12.26 2.55 -14.20 -14.20 -14.20 -0.05 0
Birla Cotsyn (India) 201312 266.86 30.37 1.60 41.28 2.60 -6.72 12.21 2.55 -21.48 -21.48 -21.48 -0.08 0
Birla Cotsyn (India) 201403 266.86 28.33 2.81 36.00 0.42 -4.45 12.00 2.43 -18.87 -18.87 -18.87 -0.07 0
Birla Cotsyn (India) 201406 266.86 27.47 1.49 29.42 0.99 0.53 12.96 2.50 -14.92 -14.92 -14.92 -0.06 0
Birla Shloka Edutech 201309 20.95 1.16 1.52 0.16 -0.19 1.19 2.06 -3.45 1.29 -4.74 -4.74 -2.26 0
Birla Shloka Edutech 201312 20.95 1.61 1.14 0.59 1.06 0.74 2.06 -1.74 0.42 -2.16 -2.16 -1.03 0
Birla Shloka Edutech 201403 20.95 33.19 33.01 0.51 0.68 1.39 2.02 -2.73 -6.25 3.52 3.52 1.68 0
Birla Shloka Edutech 201406 20.95 2.88 0.00 0.88 0.16 2.16 0.15 1.50 0.52 0.15 0.36 0.36 0.17 0
BITS 201309 22.38 0.02 0.17 0.12 -0.03 0.02 -0.05 -0.05 -0.05 0
BITS 201312 22.38 0.00 0.13 0.12 -0.01 0.00 0.02 -0.02 0.00 -0.02 -0.02 0
BITS 201403 22.38 0.13 0.33 0.13 -0.06 0.02 -0.08 0.01 -0.09 -0.09 -0.01 0
BITS 201406 22.38 0.03 0.15 0.19 0.06 0.02 0.05 0.05 0.05 0.00 0
BJ Duplex Boards 201406 5.04 0.56 0.54 0.00 0.02 0.02 0.02 0.02 0.05 0
BLB 201309 5.29 14.66 16.65 0.23 -1.76 0.02 0.08 -1.86 -0.66 -1.20 -1.20 -0.22 10
BLB 201312 5.29 44.69 0.13 42.46 0.24 2.60 0.08 0.08 2.44 0.78 1.66 1.66 0.31 10
BLB 201403 5.29 53.19 57.06 0.27 -3.60 0.10 -3.70 -0.85 -2.85 -2.85 -0.54 10
BLB 201406 5.29 95.98 0.07 88.93 0.59 7.71 0.12 0.08 7.51 2.50 5.01 5.01 0.95 10
Bloom Dekor 201309 6.00 18.43 0.04 15.97 0.03 2.53 1.02 0.35 1.15 1.15 1.15 1.68 0
Bloom Dekor 201312 6.85 14.78 0.20 14.93 0.06 1.01 0.36 -1.32 -1.32 -1.32 -1.92 0
Bloom Dekor 201403 6.85 16.03 0.15 17.06 0.86 -0.01 0.80 0.33 -1.14 -0.22 -0.92 -0.92 -1.34 0
Bloom Dekor 201406 6.85 14.52 0.57 14.10 1.00 0.98 0.56 -0.55 -0.55 -0.55 -0.80 0
Blue Blends (India) 201309 19.41 42.72 0.56 39.90 0.01 3.39 1.22 1.08 1.95 1.95 1.95 1.07 0
Blue Blends (India) 201312 19.41 39.26 0.57 34.51 0.00 5.31 2.36 1.10 1.85 1.85 1.85 0.95 0
Blue Blends (India) 201403 19.41 53.30 0.52 47.55 0.04 6.31 5.18 1.07 0.25 -2.27 2.52 2.52 1.30 0
Blue Blends (India) 201406 19.41 40.10 0.47 36.08 0.03 4.53 1.93 1.11 1.49 1.49 1.49 0.77 0
Blue Chip India 201309 11.06 0.31 0.57 0.04 -0.23 0.00 0.01 -0.27 -0.27 -0.27 -0.05 0
Blue Chip India 201312 11.06 1.64 0.58 0.03 1.10 0.00 0.01 1.09 1.09 1.09 0.20 0
Blue Chip India 201403 11.06 0.48 1.03 0.03 -0.52 0.01 -0.53 -0.53 -0.53 -0.09 0
Blue Chip India 201406 11.06 1.29 0.58 0.01 0.72 0.01 0.72 0.72 0.72 0.13 0

Co_Name Year Equity N.Sale O.O.I T. Exp O.I PBIDT Int. Dep. PBT T.Tax PAT A.PAT EPS Div (%)
Exp
ecte
d R
esu
lts
on
14
No
vem
ber
201
4
BNR Udyog 201309 3.00 0.49 0.02 0.32 0.04 0.23 0.02 0.03 0.18 0.18 0.18 0.61 10
BNR Udyog 201312 3.00 1.23 0.00 0.93 0.04 0.34 0.02 0.10 0.21 0.21 0.21 0.71 10
BNR Udyog 201403 3.00 0.41 0.28 0.54 0.03 0.18 0.01 0.07 0.10 0.00 0.10 0.10 0.34 10
BNR Udyog 201406 3.00 0.49 0.06 0.34 0.04 0.25 0.00 0.06 0.18 0.18 0.18 0.60 10
Bodal Chemicals 201309 21.82 192.32 2.24 173.40 1.20 22.37 9.34 4.02 9.01 2.86 6.15 6.15 0.56 0
Bodal Chemicals 201312 21.82 252.32 1.35 188.97 0.84 65.54 13.20 11.18 -32.44 -10.55 -21.89 -21.89 -2.00 0
Bodal Chemicals 201403 21.82 328.48 3.91 245.90 1.41 87.91 14.03 6.01 67.75 23.21 44.53 44.53 4.08 0
Bodal Chemicals 201406 21.82 381.11 4.17 293.22 1.85 93.91 9.43 5.73 78.75 26.75 52.01 52.01 4.77 0
Brakes Auto (India) 201309 20.97 0.06 0.03 0.03 0.03 0.00 0.00 0.00 0
Brakes Auto (India) 201312 20.97 0.07 0.04 0.03 0.03 0.00 0.00 0.00 0
Brakes Auto (India) 201403 20.97 0.35 0.38 -0.03 0.03 -0.06 -0.06 -0.06 -0.03 0
Brakes Auto (India) 201406 20.97 0.07 0.05 0.02 0.03 -0.01 -0.01 -0.01 0
Britannia Industries 201309 23.97 1740.48 15.27 1594.90 4.09 164.94 1.04 21.05 142.85 45.13 97.72 97.64 8.15 600
Britannia Industries 201312 23.99 1771.94 21.07 1633.18 4.57 164.40 1.54 21.15 141.71 41.39 100.32 100.56 8.39 600
Britannia Industries 201403 23.99 1777.28 35.16 1643.96 11.02 179.50 1.50 21.41 156.59 48.47 108.12 107.66 8.98 600
Britannia Industries 201406 23.99 1772.63 14.36 1617.39 21.60 191.20 0.97 31.79 158.44 44.71 113.73 113.66 9.48 600
Brooks Laboratories 201309 16.19 25.20 23.00 2.20 0.03 0.21 1.96 0.06 1.90 1.90 1.17 0
Brooks Laboratories 201312 16.19 19.14 17.43 1.71 0.03 0.21 1.47 0.05 1.42 1.42 0.87 0
Brooks Laboratories 201403 16.19 18.82 16.41 2.41 0.04 0.20 2.17 0.17 2.00 2.00 1.23 0
Brooks Laboratories 201406 16.19 16.46 15.35 0.69 1.79 0.02 0.28 1.49 -0.05 1.53 1.53 0.95 0
Brushman (India) 201309 14.76 0.41 0.87 0.46 0.00 0.31 -0.31 -0.31 -0.31 -0.21 0
Brushman (India) 201312 14.76 0.38 0.89 0.45 -0.06 0.31 -0.37 -0.37 -0.37 -0.25 0
Brushman (India) 201403 14.76 0.66 1.86 0.45 -0.75 0.28 -1.03 -1.03 -1.03 -0.70 0
Brushman (India) 201406 14.76 0.67 1.09 0.47 0.05 0.28 -0.23 -0.23 -0.23 -0.15 0
BS 201309 21.94 619.50 563.51 1.39 57.38 27.22 7.04 22.64 7.15 15.49 15.49 7.06 10
BS 201312 43.90 541.25 494.20 1.20 48.25 27.83 7.18 12.76 4.00 8.77 8.77 2.00 10
BS 201403 43.90 653.05 0.00 570.62 2.56 84.98 28.94 7.68 47.89 17.03 30.86 30.86 10
BS 201406 43.90 501.76 433.23 0.45 68.98 30.72 9.18 28.61 9.54 19.07 19.07 0.43 10
Burnpur Cement 201309 65.14 24.92 22.38 0.06 2.60 0.79 0.37 1.44 0.47 0.97 0.97 0.15 0
Burnpur Cement 201312 65.14 20.33 18.02 0.06 2.38 0.86 0.38 1.15 0.39 0.76 0.76 0.12 0
Burnpur Cement 201403 65.14 26.81 25.07 0.14 1.89 1.57 0.15 0.17 -0.11 0.28 0.28 0.04 0
Burnpur Cement 201406 75.55 20.20 18.43 0.12 1.88 0.91 0.38 0.59 0.20 0.39 0.39 0.05 0
Butterfly Gandhimathi Appliances 201309 17.88 143.37 1.45 126.52 0.50 18.80 7.65 1.21 9.94 3.27 6.67 6.67 3.73 0
Butterfly Gandhimathi Appliances 201312 17.88 240.26 1.36 224.45 0.21 17.38 7.38 1.36 8.64 2.75 5.88 5.88 3.29 0
Butterfly Gandhimathi Appliances 201403 17.88 173.65 1.13 164.76 0.32 10.33 6.46 1.21 2.66 1.65 1.01 1.01 0.57 0
Butterfly Gandhimathi Appliances 201406 17.88 107.02 1.03 98.99 0.39 9.46 6.67 2.53 0.26 0.09 0.18 0.18 0.10 0

Co_Name Year Equity N.Sale O.O.I T. Exp O.I PBIDT Int. Dep. PBT T.Tax PAT A.PAT EPS Div (%)
Exp
ecte
d R
esu
lts
on
14
No
vem
ber
201
4
C Mahendra Exports 201309 60.00 454.14 4.71 456.77 0.60 2.69 23.44 2.11 -22.86 4.07 -26.93 -26.93 1.46 1
C Mahendra Exports 201312 60.00 397.92 0.83 371.14 -0.15 27.47 27.29 2.10 -1.93 -2.93 1.00 1.00 0.14 1
C Mahendra Exports 201403 60.00 361.02 0.56 361.86 4.85 4.56 9.13 2.11 -6.69 3.34 0.99 -10.02 0.11 1
C Mahendra Exports 201406 60.57 216.43 2.55 203.97 0.90 15.91 26.78 2.04 -12.91 0.20 -13.11 -13.11 -2.17 1
Cals Refineries 201309 829.40 0.76 -0.76 2.05 0.01 1.48 1.48 1.48 0
Cals Refineries 201312 829.40 0.05 -0.05 0.21 0.00 -0.21 -0.21 -0.21 0
Cals Refineries 201403 829.40 0.26 0.38 0.12 2.05 0.01 -1.94 -1.94 -1.94 0
Cals Refineries 201406 829.40 0.25 -0.25 2.05 0.01 -26.97 -26.97 -26.97 -0.01 0
Cambridge Technology Enterprises 201309 19.63 6.44 5.83 0.40 1.01 0.16 0.86 0.29 0.56 0.56 0.29 0
Cambridge Technology Enterprises 201312 19.63 6.24 5.95 0.48 0.77 0.15 0.60 0.29 0.31 0.31 0.16 0
Cambridge Technology Enterprises 201403 19.63 5.98 6.18 0.08 -0.12 0.26 -0.37 0.00 -0.37 -0.37 -0.19 0
Cambridge Technology Enterprises 201406 19.63 6.69 6.52 0.05 0.21 0.14 0.07 0.23 -0.16 -0.16 -0.08 0
Camphor & Allied Products 201309 5.13 76.01 0.15 63.63 0.29 12.83 2.59 1.88 8.37 2.70 5.68 5.68 11.06 20
Camphor & Allied Products 201312 5.13 76.52 0.49 61.02 0.02 16.02 2.38 1.94 12.76 4.56 8.20 8.20 15.97 20
Camphor & Allied Products 201403 5.13 87.23 0.86 75.99 0.02 12.13 2.37 2.02 9.24 3.67 5.57 5.57 10.85 20
Camphor & Allied Products 201406 5.13 80.31 0.20 70.59 0.04 9.96 2.09 2.42 5.86 1.77 4.09 4.09 7.97 20
Capital Trade Links 201403 5.00 0.15 0.08 0.00 0.06 0.07 0.00 0.00 0.00 0.00 0
Capital Trade Links 201406 5.00 0.14 0.10 0.04 0.03 0.01 0.01 0.01 0
Ceenik Exports (India) 201309 3.35 2.08 -0.01 2.17 -0.10 0.36 0.06 -0.53 -0.53 -0.53 -1.57 0
Ceenik Exports (India) 201312 3.35 2.54 0.01 2.73 -0.18 0.56 0.01 -0.75 -0.75 -0.75 -2.24 0
Ceenik Exports (India) 201403 3.35 2.35 1.96 0.39 0.80 0.15 -0.56 -0.29 -0.28 -0.28 -0.82 0
Ceenik Exports (India) 201406 3.35 2.26 2.27 -0.01 0.45 0.07 -0.53 -0.53 -0.53 -1.58 0
Ceeta Industries 201309 1.45 0.32 0.59 0.36 0.09 0.00 0.05 0.04 0.04 0.04 0.03 0
Ceeta Industries 201312 1.55 0.73 0.12 0.77 0.41 0.49 0.05 0.44 0.44 0.44 0.30 0
Ceeta Industries 201403 1.45 1.40 1.28 2.71 0.46 0.44 0.00 0.05 0.39 0.39 0.39 0.27 0
Ceeta Industries 201406 1.45 0.41 0.87 1.17 0.28 0.38 0.00 0.06 0.33 0.33 0.33 0.22 0
Centenial Surgical Suture 201309 3.65 13.09 12.01 0.04 1.12 0.20 0.15 0.78 0.26 0.51 0.51 1.40 0
Centenial Surgical Suture 201312 3.65 12.74 11.55 1.19 0.25 0.15 0.79 0.27 0.52 0.52 1.43 0
Centenial Surgical Suture 201403 3.65 11.56 10.71 0.85 0.48 0.14 0.23 0.07 0.16 0.16 0.43 0
Centenial Surgical Suture 201406 3.65 13.58 12.30 0.03 1.31 0.40 0.14 0.77 0.26 0.51 0.51 1.39 0
Centrum Capital 201309 41.60 12.99 2.13 7.63 0.01 7.50 4.83 0.92 1.74 -0.63 2.37 2.37 0.06 0
Centrum Capital 201312 41.60 13.82 2.37 7.32 0.01 8.87 5.02 0.92 2.93 1.28 1.65 1.65 0.04 0
Centrum Capital 201403 41.60 13.66 2.67 8.11 0.03 8.25 6.45 0.92 0.88 0.36 0.53 0.53 0.01 0
Centrum Capital 201406 41.60 10.97 2.68 9.52 0.12 4.24 0.82 0.88 4.39 -2.46 6.85 6.85 0.16 0
Century Extrusions 201309 8.00 52.32 49.83 0.59 3.08 1.99 1.14 -0.05 -0.22 0.17 0.17 0.02 0
Century Extrusions 201312 8.00 48.91 45.96 0.72 3.67 2.14 1.08 0.45 -0.12 0.57 0.57 0.07 0
Century Extrusions 201403 8.00 45.52 44.17 1.01 2.36 2.06 1.07 -0.80 -0.36 -0.44 -0.44 -0.06 0
Century Extrusions 201406 8.00 39.58 37.23 0.67 3.02 1.90 1.10 0.02 -0.35 0.37 0.37 0.05 0

Co_Name Year Equity N.Sale O.O.I T. Exp O.I PBIDT Int. Dep. PBT T.Tax PAT A.PAT EPS Div (%)
Exp
ecte
d R
esu
lts
on
14
No
vem
ber
201
4
Cerebra Integrated Technologies 201309 48.09 60.69 60.28 0.99 1.39 0.43 0.61 0.35 -0.68 1.03 1.32 0
Cerebra Integrated Technologies 201312 48.09 62.16 0.58 61.94 0.72 1.52 0.25 0.24 1.03 0.04 0.99 0.97 0.07 0
Cerebra Integrated Technologies 201403 48.09 68.31 -0.12 65.63 -0.37 2.19 0.92 0.23 1.03 0.21 0.82 0.46 0
Cerebra Integrated Technologies 201406 48.09 55.87 55.10 0.07 0.85 0.32 0.17 0.36 0.14 0.22 0.10 0
CES 201309 1.30 7.74 6.03 0.07 1.77 0.01 0.10 1.66 0.75 0.91 0.91 7.01 0
CES 201312 1.30 7.74 5.55 0.04 2.22 0.02 0.11 2.10 0.51 1.59 1.59 12.26 0
CES 201403 1.30 8.44 6.56 0.18 2.06 0.02 0.10 1.94 0.19 1.75 1.75 13.42 0
CES 201406 1.30 9.39 6.60 0.12 2.91 0.03 0.16 2.72 1.10 1.61 1.61 12.40 0
CESC 201309 126.00 1611.00 21.00 1256.00 27.00 403.00 103.00 84.00 216.00 45.00 171.00 171.00 13.69 80
CESC 201312 126.00 1186.00 21.00 914.00 26.00 319.00 99.00 85.00 135.00 28.00 107.00 107.00 8.53 80
CESC 201403 126.00 1229.00 17.00 792.00 17.00 471.00 77.00 86.00 308.00 65.00 243.00 243.00 19.49 80
CESC 201406 126.00 1848.00 15.00 1485.00 15.00 393.00 100.00 94.00 199.00 48.00 151.00 151.00 12.12 80
CFL Capital Financial Services 201309 138.66 0.11 0.68 -0.57 13.61 0.02 -14.20 -14.20 -14.20 -1.08 0
CFL Capital Financial Services 201312 138.66 0.14 0.51 -0.37 14.24 0.01 -14.62 -14.62 -14.62 -1.11 0
CFL Capital Financial Services 201403 138.66 0.12 0.01 0.59 -0.46 14.43 0.02 -14.41 -14.41 -14.41 -1.10 0
CFL Capital Financial Services 201406 138.63 0.13 0.44 0.00 -0.31 15.29 -15.52 0.00 -15.52 -15.52 -1.18 0
Chandni Textiles Engineering Industries 201309 16.14 2.81 2.93 0.27 0.15 0.01 0.05 0.08 0.02 0.07 0.07 0
Chandni Textiles Engineering Industries 201312 16.14 2.27 2.24 0.22 0.24 0.01 0.05 0.04 0.03 0.00 0.00 0
Chandni Textiles Engineering Industries 201403 16.14 7.44 7.48 0.17 0.13 0.01 0.06 0.05 0.01 0.04 0.04 0
Chandni Textiles Engineering Industries 201406 16.14 1.37 1.57 0.33 0.13 0.02 0.09 1.33 0.40 0.93 0.93 0.06 0
Charms Industries 201309 4.11 0.64 0.67 0.01 -0.02 0.00 -0.03 -0.03 -0.03 0
Charms Industries 201312 4.11 0.56 0.58 0.04 0.02 0.00 0.01 0.01 0.01 0.03 0
Charms Industries 201403 4.11 0.49 0.62 1.02 -0.02 0.06 0.01 0.05 0.05 0.05 0.13 0
Charms Industries 201406 4.11 0.39 0.41 0.03 0.02 0.00 0.01 0.01 0.01 0.03 0
Chartered Logistics 201309 9.93 42.13 36.02 0.03 6.15 2.58 2.49 1.08 0.12 0.96 0.96 0.10 0
Chartered Logistics 201312 9.93 41.29 35.88 0.05 5.46 2.50 2.51 0.45 0.45 0.45 0.05 0
Chartered Logistics 201403 9.93 34.49 41.06 2.82 -3.75 4.15 3.42 -11.31 -11.31 -11.31 -1.14 0
Chartered Logistics 201406 9.93 34.52 29.23 0.76 6.06 2.20 2.65 1.21 1.21 1.21 0.12 0
Chase Bright Steel 201309 1.68 5.75 0.09 6.10 0.00 -0.26 0.27 0.06 -0.59 -0.02 -0.57 -0.57 -3.38 0
Chase Bright Steel 201312 1.68 7.26 0.01 7.15 0.11 0.28 0.06 -0.23 -0.23 -0.23 -1.37 0
Chase Bright Steel 201403 1.68 8.24 0.04 7.95 0.19 0.52 0.29 0.06 0.17 -0.17 0.33 0.33 2.00 0
Chase Bright Steel 201406 1.68 9.26 8.89 0.00 0.38 0.22 0.05 0.11 0.11 0.11 0.63 0
Chhattisgarh Industries 201309 7.49 0.00 0.04 -0.04 -0.04 -0.04 -0.04 -0.05 0
Chhattisgarh Industries 201312 7.49 0.06 -0.06 0.06 -0.12 -0.12 -0.12 -0.16 0
Chhattisgarh Industries 201403 7.49 0.03 -0.03 0.06 -0.09 -0.09 -0.09 -0.12 0
Chhattisgarh Industries 201406 7.49 0.02 -0.02 0.05 -0.07 -0.07 -0.07 -0.10 0

Co_Name Year Equity N.Sale O.O.I T. Exp O.I PBIDT Int. Dep. PBT T.Tax PAT A.PAT EPS Div (%)
Exp
ecte
d R
esu
lts
on
14
No
vem
ber
201
4
Choice Infra Ventures 201309 15.13 10.99 10.63 0.05 0.40 0.00 0.40 0.14 0.26 0.26 0.17 0
Choice Infra Ventures 201312 15.13 10.89 10.76 0.05 0.18 0.00 0.18 0.06 0.12 0.12 0.08 0
Choice Infra Ventures 201403 15.13 10.86 10.60 0.04 0.30 0.00 0.30 0.09 0.21 0.21 0.14 0
Choice Infra Ventures 201406 15.13 10.74 10.60 0.04 0.18 0.01 0.17 0.05 0.12 0.12 0.08 0
Choice International 201309 10.01 9.83 0.39 7.95 0.63 2.91 1.60 0.31 1.00 0.51 0.49 0.49 0.49 10
Choice International 201312 10.01 17.65 0.13 14.97 0.65 3.46 1.98 0.35 1.13 0.37 0.76 0.76 0.76 10
Choice International 201403 10.01 16.33 0.28 12.44 1.09 5.26 3.43 0.35 1.48 0.68 0.81 0.81 0.81 10
Choice International 201406 10.01 13.27 0.28 9.44 1.00 5.12 3.53 0.59 0.99 0.34 0.66 0.66 0.66 10
Cigniti Technologies 201309 18.85 61.33 53.38 0.64 8.59 0.23 0.57 7.79 2.61 5.18 5.18 2.75 0
Cigniti Technologies 201312 20.82 72.61 0.14 63.29 9.46 0.23 0.67 8.57 3.23 5.34 5.34 2.57 0
Cigniti Technologies 201403 20.82 73.50 0.10 68.59 5.01 0.61 0.67 3.74 1.90 1.84 1.84 0.88 0
Cigniti Technologies 201406 22.92 77.18 -0.19 69.41 0.24 7.82 0.20 0.97 6.65 1.07 5.58 5.58 2.46 0
Cistro Telelink 201309 5.13 0.00 0.00 0.00 0.00 0.00 0
Cistro Telelink 201312 5.13 0.01 -0.01 -0.01 -0.01 -0.01 0
Cistro Telelink 201403 5.13 0.01 -0.01 -0.01 -0.01 -0.01 0
Cistro Telelink 201406 5.13 0.01 -0.01 -0.01 -0.01 -0.01 0
Classic Diamonds (India) 201309 7.84 0.00 0.06 -0.05 9.91 0.57 -10.54 -10.55 -10.54 -2.69 0
Classic Diamonds (India) 201312 7.84 0.00 0.02 -0.02 9.92 0.57 -10.51 -10.51 -10.51 -2.68 0
Classic Diamonds (India) 201403 7.84 0.00 65.75 -65.75 9.49 0.57 -75.81 -78.88 -75.81 -20.11 0
Classic Diamonds (India) 201406 7.84 14.77 -14.77 16.32 0.18 -31.27 -31.27 -31.27 -7.97 0
Classic Electricals 201309 1.49 0.01 0.07 0.07 0.02 0.05 0.05 0.05 0.33 0
Classic Electricals 201312 1.49 0.03 0.06 0.03 0.02 0.01 0.01 0.01 0.09 0
Classic Electricals 201403 1.49 0.22 0.06 -0.16 0.00 -0.17 -0.04 -0.13 -0.13 -0.86 0
Classic Electricals 201406 1.49 0.03 0.10 0.07 0.01 0.05 0.05 0.05 0.35 0
Comfort Fincap 201309 10.85 0.82 0.03 0.60 0.00 0.25 0.12 0.01 0.12 0.00 0.12 0.12 0.11 2
Comfort Fincap 201312 10.85 0.72 0.01 0.00 0.73 0.12 0.01 0.60 0.60 0.60 0.56 2
Comfort Fincap 201403 10.85 0.32 -0.05 0.09 0.00 0.18 0.10 0.00 0.08 0.24 -0.16 -0.16 2
Comfort Fincap 201406 10.85 0.65 0.01 0.11 0.55 0.10 0.01 0.45 0.45 0.45 0.41 2
Commex Technology 201309 31.02 6.27 2.57 0.09 3.79 0.02 0.74 3.03 3.03 3.03 0.20 0
Commex Technology 201312 31.02 6.41 3.65 0.09 2.85 0.74 2.11 0.97 1.15 1.15 0.07 0
Commex Technology 201403 31.02 6.67 0.00 12.12 0.80 -4.66 0.00 0.74 -5.40 0.02 -5.42 -5.42 0
Commex Technology 201406 31.02 2.10 1.14 0.96 0.00 0.46 0.50 0.17 0.33 0.33 0.02 0
Compuage Infocom 201309 6.66 565.47 558.39 4.96 12.04 7.73 0.77 3.55 1.20 2.34 2.34 3.52 14
Compuage Infocom 201312 6.66 578.99 570.24 4.02 12.78 10.08 0.78 1.92 0.20 1.72 1.72 2.58 14
Compuage Infocom 201403 6.66 557.52 538.84 1.49 20.18 10.44 0.88 8.85 3.26 5.59 5.59 8.40 14
Compuage Infocom 201406 6.66 517.11 508.65 2.68 11.14 7.20 1.32 2.62 0.92 1.70 1.70 2.56 14

Co_Name Year Equity N.Sale O.O.I T. Exp O.I PBIDT Int. Dep. PBT T.Tax PAT A.PAT EPS Div (%)
Exp
ecte
d R
esu
lts
on
14
No
vem
ber
201
4
Core Education & Technologies 201309 22.90 330.37 302.10 48.65 76.91 54.81 56.32 -34.21 -4.97 -29.24 -29.56 -2.55 0
Core Education & Technologies 201312 22.90 281.40 265.62 0.42 16.19 51.60 44.17 -79.58 -9.05 -70.53 -70.53 -6.16 0
Core Education & Technologies 201403 22.90 129.96 185.06 0.51 -54.59 44.42 32.75 -365.34 5.13 -370.47 -370.47 -32.36 0
Core Education & Technologies 201406 22.90 100.10 52.49 0.31 47.93 48.75 39.47 -63.35 -63.35 -63.35 -5.53 0
Corporate Courier & Cargo 201309 5.98 0.01 -0.01 -0.01 -0.01 -0.01 -0.01 0
Corporate Courier & Cargo 201403 5.98 0.01 -0.01 -0.01 -0.01 -0.01 -0.01 0
Corporate Courier & Cargo 201406 5.98 0.01 -0.01 -0.01 -0.01 -0.01 -0.02 0
Country Club (India) 201309 32.69 118.54 75.58 42.96 15.12 13.22 14.61 2.76 11.85 11.85 0.72 5
Country Club (India) 201312 32.69 128.41 83.87 44.54 14.08 12.73 17.73 3.47 14.26 14.26 0.87 5
Country Club (India) 201403 32.69 115.81 0.00 122.93 0.00 -7.13 0.54 8.16 -15.83 2.48 -18.31 -18.31 5
Country Club (India) 201406 32.69 124.10 89.87 34.24 15.29 11.69 7.26 2.43 4.84 4.84 0.30 5
Covidh Technologies 201309 10.60 11.94 0.06 10.97 1.03 0.04 0.99 0.31 0.69 0.69 0.65 0
Covidh Technologies 201312 10.60 8.53 0.05 7.90 0.68 0.04 0.64 0.17 0.47 0.47 0.45 0
Covidh Technologies 201403 10.60 0.31 -0.10 2.28 -0.02 -2.09 0.00 0.06 -2.15 -0.64 -1.51 -1.51 0
Covidh Technologies 201406 10.60 2.97 2.88 0.02 0.11 0.06 0.06 0.02 0.04 0.04 0.04 0
Cox & Kings (India) 201309 68.26 818.82 365.93 130.64 583.53 77.81 74.58 422.72 87.59 335.14 263.73 19.32 20
Cox & Kings (India) 201312 68.26 407.67 302.39 63.81 169.09 88.66 29.70 36.65 12.15 24.51 30.92 2.26 20
Cox & Kings (India) 201403 68.26 494.92 442.58 3.67 56.01 76.26 27.44 -69.11 -2.96 -66.15 -46.25 -3.39 20
Cox & Kings (India) 201406 68.26 738.72 387.31 24.77 376.18 91.42 51.28 228.20 69.68 158.53 128.09 9.38 20
Cranex 201309 6.00 2.15 2.06 0.05 0.14 0.07 0.05 0.01 0.01 0.01 0.02 0
Cranex 201312 6.00 3.58 3.18 0.06 0.46 0.06 0.05 0.35 0.11 0.24 0.24 0.40 0
Cranex 201403 6.00 7.95 7.67 0.00 0.27 0.11 0.04 0.12 0.07 0.06 0.06 0.10 0
Cranex 201406 6.00 2.87 2.76 0.06 0.17 0.07 0.05 0.05 0.05 0.05 0.09 0
Creative Merchants 201309 0.05 0.13 0.12 0.01 0.01 0.01 0.01 0
Creative Merchants 201403 5.00 0.27 0.26 0.01 0.01 0.01 0.00 0.00 0
Creative Merchants 201406 5.00 0.21 0.20 0.01 0.01 0.01 0.01 0.02 0
Credit Analysis And Research 201309 29.00 65.28 17.69 5.45 53.03 0.79 52.24 17.19 35.05 35.05 12.27 280
Credit Analysis And Research 201312 29.00 53.84 21.37 6.71 39.18 0.72 38.46 10.44 28.02 28.02 9.66 280
Credit Analysis And Research 201403 29.00 75.67 24.41 7.89 59.15 0.85 58.29 16.99 41.30 41.30 14.24 280
Credit Analysis And Research 201406 29.00 42.68 22.59 14.84 34.92 1.41 33.52 6.93 26.58 26.58 9.17 280
CSS Technergy 201309 6.76 2.73 2.45 0.00 0.28 0.07 0.20 0.02 0.01 0.01 0.01 0.02 0
CSS Technergy 201312 6.96 3.19 2.77 0.42 0.07 0.20 0.15 0.05 0.10 0.10 0.15 0
CSS Technergy 201403 7.42 3.70 2.39 0.03 1.35 0.08 0.21 1.06 0.37 0.69 0.69 1.01 0
CSS Technergy 201406 7.50 3.33 2.72 0.00 0.62 0.08 0.32 0.22 0.07 0.15 0.15 0.20 0
Cura Technologies 201309 9.56 1.37 1.79 0.76 0.34 0.31 0.24 -0.21 1.83 -2.04 -2.04 -2.13 0
Cura Technologies 201312 9.56 1.23 1.65 0.76 0.34 0.31 0.24 -0.21 -0.03 -0.17 -0.17 -0.18 0
Cura Technologies 201403 9.56 1.51 5.98 6.57 2.10 0.24 1.87 -2.02 3.89 3.89 4.07 0
Cura Technologies 201406 9.56 1.46 1.98 0.85 0.33 0.35 0.29 -0.31 -0.08 -0.23 -0.23 -0.24 0

Co_Name Year Equity N.Sale O.O.I T. Exp O.I PBIDT Int. Dep. PBT T.Tax PAT A.PAT EPS Div (%)
Exp
ecte
d R
esu
lts
on
14
No
vem
ber
201
4
Daulat Securities 201309 5.00 0.05 0.09 0.10 0.06 0.01 0.05 0.05 0.05 0.10 0
Daulat Securities 201312 5.00 0.09 0.10 0.08 0.07 0.07 0.07 0.07 0.14 0
Daulat Securities 201403 5.00 -0.14 0.07 0.22 0.01 0.01 0.00 0.03 -0.03 -0.03 0
Daulat Securities 201406 5.00 0.06 0.10 0.12 0.08 0.01 0.07 0.07 0.07 0.14 0
DCM 201309 17.38 112.45 6.99 99.43 1.36 21.37 2.76 2.85 15.76 5.38 10.38 10.38 5.97 30
DCM 201312 17.38 108.68 7.39 104.00 2.31 14.38 2.21 2.95 24.72 8.46 16.26 16.26 9.36 30
DCM 201403 17.38 117.34 6.96 112.97 2.08 13.41 3.20 3.05 7.16 2.74 4.42 4.42 2.54 30
DCM 201406 17.38 227.48 6.51 233.05 1.85 2.79 7.80 9.67 -14.68 -1.47 -13.21 -11.28 -6.49 30
Deccan Cements 201309 7.00 100.75 89.18 0.53 12.10 6.72 6.14 -0.76 0.35 -1.11 -1.11 -1.59 12
Deccan Cements 201312 7.00 101.03 84.70 0.29 16.62 6.92 6.14 3.56 0.33 3.23 3.23 4.61 12
Deccan Cements 201403 7.00 88.72 69.60 1.40 20.52 6.95 6.05 7.53 1.57 5.96 5.96 8.51 12
Deccan Cements 201406 7.00 78.96 73.49 0.95 6.43 6.79 3.72 -4.08 0.58 -4.67 -4.67 -6.66 12
Delma Infrastructure 201309 0.25 0.06 -0.06 -0.06 -0.06 -0.06 -2.34 0
Delma Infrastructure 201312 0.25 0.06 -0.06 -0.06 -0.06 -0.06 -2.59 0
Delma Infrastructure 201403 0.25 0.14 -0.14 -0.14 0.08 -0.22 -0.22 -8.67 0
Delma Infrastructure 201406 0.25 0.10 -0.10 -0.38 -0.38 -0.38 -15.38 0
Delta Leasing & Finance 201309 11.60 0.32 0.28 0.04 0.00 0.04 0.04 0.04 0.03 0
Delta Leasing & Finance 201312 11.60 0.21 0.17 0.04 0.00 0.04 0.04 0.04 0.03 0
Delta Leasing & Finance 201403 11.60 0.19 0.14 0.05 0.00 0.05 0.06 -0.02 -0.02 -0.01 0
Delta Leasing & Finance 201406 11.60 0.30 0.25 0.05 0.05 0.05 0.05 0.03 0
Den Networks 201309 178.20 266.32 5.55 187.39 4.71 89.19 24.28 37.04 27.87 5.37 22.50 11.18 0.77 0
Den Networks 201312 178.20 269.31 4.95 213.10 28.31 89.47 18.63 36.63 24.96 8.88 16.08 16.08 0.45 0
Den Networks 201403 178.20 296.78 5.08 228.68 23.82 97.00 19.03 40.50 35.72 20.51 15.21 10.05 0.62 0
Den Networks 201406 178.20 298.38 0.43 241.65 18.65 75.81 19.82 43.28 12.71 4.29 8.42 1.12 0.04 0
DFM Foods 201309 10.00 70.95 0.08 64.49 1.09 7.63 2.20 1.34 4.09 1.78 2.31 2.31 2.31 25
DFM Foods 201312 10.00 70.10 0.10 65.40 1.17 5.97 2.19 1.80 1.98 0.67 1.31 1.31 1.31 25
DFM Foods 201403 10.00 63.05 0.09 58.66 0.74 5.22 1.93 1.46 -0.60 -1.15 0.55 0.55 0.55 25
DFM Foods 201406 10.00 62.16 0.08 55.09 0.09 7.24 1.63 1.50 4.11 1.40 2.71 2.71 2.71 25
Dhanlaxmi Fabrics 201309 8.58 13.96 0.25 12.08 0.13 2.26 0.33 1.50 0.43 0.43 0.43 0.50 0
Dhanlaxmi Fabrics 201312 8.58 20.23 0.16 17.57 0.16 2.97 0.62 1.50 0.85 0.85 0.85 0.99 0
Dhanlaxmi Fabrics 201403 8.58 34.12 0.14 29.71 0.16 4.72 0.61 1.46 2.65 2.23 0.42 0.42 0
Dhanlaxmi Fabrics 201406 8.58 20.09 0.12 17.42 0.16 2.94 0.76 1.77 0.41 0.41 0.41 0.48 0
Dhoot Industrial Finance 201309 5.42 12.20 0.30 12.06 0.16 0.60 0.25 0.16 0.19 -0.04 0.23 0.23 0.43 0
Dhoot Industrial Finance 201312 5.42 13.75 0.06 10.79 0.23 3.26 0.20 0.16 2.90 -0.04 2.94 2.94 5.42 0
Dhoot Industrial Finance 201403 5.42 19.06 0.43 19.29 -0.06 0.15 0.27 0.17 -0.29 0.51 -0.80 -0.80 -1.48 0
Dhoot Industrial Finance 201406 5.42 40.26 0.49 34.51 0.17 6.39 0.28 0.13 5.98 1.69 4.29 4.29 7.91 0

Co_Name Year Equity N.Sale O.O.I T. Exp O.I PBIDT Int. Dep. PBT T.Tax PAT A.PAT EPS Div (%)
Exp
ecte
d R
esu
lts
on
14
No
vem
ber
201
4
Dhoot Industries 201309 3.73 0.01 0.02 -0.01 -0.01 -0.01 -0.01 -0.01 0
Dhoot Industries 201312 3.73 0.02 0.01 0.01 0.01 0.01 0.01 0.03 0
Dhoot Industries 201403 3.73 0.14 0.00 0.13 0.01 0.01 0.01 0.02 0.02 0.03 0
Dhoot Industries 201406 3.73 0.12 0.10 0.02 0.02 0.00 0.01 0.01 0.03 0
DHP India 201309 3.00 9.33 1.98 9.86 0.16 1.62 0.01 0.34 1.27 0.41 0.85 0.85 2.85 15
DHP India 201312 3.00 11.23 2.12 9.63 0.14 3.87 0.01 0.39 3.47 1.12 2.34 2.34 7.81 15
DHP India 201403 3.00 10.47 2.86 9.04 -0.01 4.29 0.03 0.37 3.89 1.35 2.53 2.53 8.44 15
DHP India 201406 3.00 9.40 1.52 8.45 0.25 2.72 0.03 0.36 2.33 0.76 1.57 1.57 5.23 15
Diana Tea Company 201309 7.50 15.22 0.10 8.95 0.44 6.81 0.60 0.19 4.52 4.52 4.52 3.02 5
Diana Tea Company 201312 7.50 10.69 0.00 8.17 0.54 3.07 0.29 0.29 2.76 1.00 1.76 1.76 1.17 5
Diana Tea Company 201403 7.50 5.68 0.21 12.49 0.37 -6.23 0.16 0.22 -6.61 -6.61 -6.61 -4.41 5
Diana Tea Company 201406 7.50 9.67 0.00 9.16 0.57 1.08 0.27 0.27 0.55 0.55 0.55 0.37 5
DIL 201309 2.29 28.81 1.09 26.06 0.02 3.85 1.32 2.39 0.14 0.08 0.05 -0.09 -0.41 100
DIL 201312 2.29 44.48 0.44 34.51 0.04 10.44 1.30 2.41 6.73 1.64 5.09 3.56 15.51 100
DIL 201403 2.29 39.58 -0.36 30.95 0.03 8.30 1.33 2.17 5.82 1.31 4.51 3.48 15.19 100
DIL 201406 2.29 37.12 0.20 32.42 0.04 4.94 1.16 2.69 1.09 0.21 0.88 0.83 3.63 100
Diligent Industries 201309 4.00 0.00 0.01 -0.01 -0.01 -0.01 -0.01 -0.02 0
Diligent Industries 201312 11.44 1.88 0.44 2.01 0.31 0.49 0.14 -0.33 -0.33 -0.33 -0.29 0
Diligent Industries 201403 11.44 19.73 0.15 18.08 0.01 1.81 0.51 0.40 0.89 -0.32 1.21 1.21 1.06 0
Diligent Industries 201406 11.44 17.79 16.78 0.07 1.08 0.65 0.12 0.31 0.10 0.21 0.21 0.19 0
Divinus Fabrics 201403 4.46 1.41 0.03 1.41 0.00 0.02 0.00 0.02 0.01 0.02 0.02 0.04 0
Divinus Fabrics 201406 4.46 0.86 0.86 0.01 0.01 0.00 0.01 0.01 0.01 0
DMC Education 201309 16.65 0.24 0.21 0.03 0.18 -0.15 0.00 -0.15 -0.15 -0.04 0
DMC Education 201312 16.65 0.17 0.18 -0.01 0.18 -0.19 -0.19 -0.19 -0.06 0
DMC Education 201403 16.65 0.12 1.12 1.48 -0.25 0.18 -0.43 0.10 -0.53 -0.53 -0.16 0
DMC Education 201406 16.65 0.15 0.19 -0.05 0.16 -0.21 -0.21 -0.21 -0.06 0
Dolphin Medical Services 201309 15.10 0.26 0.30 0.00 -0.04 0.01 0.18 -0.23 -0.23 -0.23 -0.15 0
Dolphin Medical Services 201312 15.10 0.18 0.20 -0.01 0.01 0.18 -0.20 -0.20 -0.20 -0.13 0
Dolphin Medical Services 201403 15.10 0.22 0.26 -0.04 0.01 0.18 -0.23 0.00 -0.24 -0.24 -0.16 0
Dolphin Medical Services 201406 15.10 0.12 0.15 0.00 -0.03 0.01 0.17 -0.21 -0.21 -0.21 -0.14 0
Donear Industries 201309 10.40 119.83 1.16 108.82 1.10 13.27 7.38 5.27 0.62 -0.82 1.44 1.44 0.28 10
Donear Industries 201312 10.40 120.56 1.32 109.97 1.93 13.83 8.45 5.66 -0.28 -0.02 -0.27 -0.27 -0.05 10
Donear Industries 201403 10.40 126.23 1.59 114.57 1.65 14.89 6.33 5.76 2.79 0.34 2.45 2.45 0.47 10
Donear Industries 201406 10.40 127.15 1.54 114.87 1.30 15.12 7.64 5.83 3.32 -0.64 3.96 3.96 0.76 10
Dr. Datasons Labs 201309 13.89 132.00 114.99 0.04 17.05 8.31 5.15 3.41 1.67 1.74 1.74 1.25 0
Dr. Datasons Labs 201312 13.89 150.57 129.99 -0.01 20.57 12.67 5.15 2.75 0.89 1.86 1.86 1.34 0
Dr. Datasons Labs 201403 31.66 20.80 22.12 7.83 6.51 10.29 5.04 -8.82 -2.67 -6.16 -6.16 -1.70 0
Dr. Datasons Labs 201406 53.37 201.44 191.41 10.03 8.69 1.25 0.09 0.03 0.06 0.06 0.02 0

Co_Name Year Equity N.Sale O.O.I T. Exp O.I PBIDT Int. Dep. PBT T.Tax PAT A.PAT EPS Div (%)
Exp
ecte
d R
esu
lts
on
14
No
vem
ber
201
4
Dynamatic Technologies 201309 5.42 398.44 4.00 355.06 0.57 47.94 24.42 12.91 10.61 3.58 7.04 7.04 12.99 0
Dynamatic Technologies 201312 5.42 396.00 3.90 356.61 1.31 44.60 26.17 12.70 5.73 1.80 3.92 3.92 7.24 0
Dynamatic Technologies 201403 5.54 426.56 3.88 387.85 12.23 54.82 25.94 12.79 16.09 2.88 13.21 13.21 24.39 0
Dynamatic Technologies 201406 5.76 421.70 3.26 378.66 1.13 47.43 21.36 12.20 -8.68 2.33 -11.01 -11.01 -19.64 0
Dynamic Industries 201309 3.03 25.32 0.13 23.89 0.04 1.60 0.42 0.17 1.01 0.37 0.64 0.64 2.12 10
Dynamic Industries 201312 3.03 28.14 0.06 25.90 0.01 2.31 0.34 0.18 1.79 0.63 1.16 1.16 3.84 10
Dynamic Industries 201403 3.03 35.12 0.05 32.21 0.08 3.04 0.41 0.17 2.46 0.63 1.83 1.83 6.05 10
Dynamic Industries 201406 3.03 38.41 0.05 35.75 0.68 3.40 0.56 0.23 2.61 0.85 1.76 1.76 5.80 10
Dynamic Portfolio Management & Services 201309 11.69 -0.15 0.17 0.03 0.00 0.00 0.00 0.00 0.00 0
Dynamic Portfolio Management & Services 201312 11.69 0.28 0.16 0.43 0.00 0.00 0.00 0.00 0.00 0
Dynamic Portfolio Management & Services 201403 11.69 0.24 0.34 0.58 -0.01 -0.02 0.01 0.01 0.00 0.00 0
Dynamic Portfolio Management & Services 201406 11.69 0.04 0.09 0.12 0.02 0.00 0.02 0.02 0.02 0.02 0
Eastern Silk Industries 201309 15.79 19.28 0.29 23.02 1.61 -1.84 12.16 3.93 -17.95 -17.95 -17.95 -2.27 0
Eastern Silk Industries 201312 15.79 22.35 0.38 21.55 1.61 2.78 12.23 3.91 -13.36 -13.36 -13.36 -1.69 0
Eastern Silk Industries 201403 15.79 17.08 0.59 33.45 21.89 6.10 12.07 3.96 -12.77 -12.77 -12.77 -1.62 0
Eastern Silk Industries 201406 15.79 13.22 0.96 12.86 0.50 1.82 0.79 3.42 -2.39 -2.39 -2.39 -0.30 0
Easun Reyrolle 201309 4.16 51.46 1.03 49.02 3.47 5.86 2.01 -5.32 -5.32 -5.32 -2.55 0
Easun Reyrolle 201312 4.16 53.20 0.53 49.40 0.01 4.34 6.29 2.03 -5.09 -5.09 -5.09 -2.45 0
Easun Reyrolle 201403 4.16 36.36 0.47 39.88 0.03 -3.02 10.01 1.99 -16.08 -16.08 -16.08 -7.73 0
Easun Reyrolle 201406 6.16 23.10 5.68 26.30 2.48 4.75 1.91 -5.09 -5.09 -5.09 -2.44 0
Eco Recycling 201309 17.54 5.79 0.16 6.46 0.92 0.41 0.18 0.07 0.16 0.16 0.16 0.09 0
Eco Recycling 201312 17.54 6.17 0.23 6.87 0.91 0.44 0.21 0.07 0.16 0.16 0.16 0.09 0
Eco Recycling 201403 17.54 11.87 0.13 12.29 0.70 0.40 0.25 0.07 0.09 0.09 0.09 0.05 0
Eco Recycling 201406 17.54 6.96 0.22 6.97 0.17 0.38 0.22 0.07 0.09 0.09 0.09 0.05 0
Educomp Solutions 201309 24.49 161.46 163.97 10.52 8.01 74.95 27.73 -94.69 -11.59 -83.10 -82.67 -6.75 7
Educomp Solutions 201312 24.49 155.33 140.03 9.62 24.93 72.40 28.08 -85.80 1.81 -87.62 -86.02 -7.03 7
Educomp Solutions 201403 24.49 87.72 153.13 22.69 -42.72 42.26 26.72 -252.32 -62.55 -189.76 -168.21 -13.74 7
Educomp Solutions 201406 24.49 143.64 131.90 3.46 15.20 90.49 26.40 -351.99 -4.54 -347.46 -343.86 -28.08 7
Eins Edutech 201309 14.38 0.04 0.03 0.00 0.01 0.01 0.00 0.01 0.01 0.06 0
Eins Edutech 201312 14.38 0.03 0.03 0.00 0.00 0.00 0.00 0.00 0.00 0
Eins Edutech 201403 14.38 0.03 0.05 0.00 -0.02 -0.04 -0.04 -0.04 -0.03 0
Eins Edutech 201406 14.38 0.09 0.04 0.05 0.05 0.02 0.04 0.04 0.02 0
EL Forge 201309 20.32 19.85 7.89 22.84 0.31 5.21 4.33 2.35 -1.47 -1.47 -1.47 -0.72 0
EL Forge 201312 20.32 21.53 22.77 0.37 -0.86 3.98 2.35 -7.20 -7.20 -7.20 -3.54 0
EL Forge 201403 20.32 17.54 18.38 0.22 -0.62 -6.17 2.35 -2.69 -2.69 -2.69 -1.32 0
EL Forge 201406 20.32 17.34 19.15 0.17 -1.64 0.35 2.42 -5.52 -5.52 -5.52 -2.72 0

Co_Name Year Equity N.Sale O.O.I T. Exp O.I PBIDT Int. Dep. PBT T.Tax PAT A.PAT EPS Div (%)
Exp
ecte
d R
esu
lts
on
14
No
vem
ber
201
4
Elpro International 201309 4.61 6.72 3.55 0.01 3.18 3.39 0.35 -0.56 -0.56 -0.56 -1.22 0
Elpro International 201312 4.61 7.68 4.42 0.13 3.39 3.51 0.35 -0.47 -0.47 -0.47 -1.02 0
Elpro International 201403 4.61 8.10 6.73 0.26 1.63 3.67 0.32 -2.45 -2.45 -2.45 -5.31 0
Elpro International 201406 4.61 9.77 6.04 0.15 3.87 3.70 0.12 0.06 0.06 0.06 0.14 0
Emami Infrastructure 201309 4.86 0.14 0.15 0.02 0.02 0.02 0.02 0.01 0
Emami Infrastructure 201312 4.86 0.17 0.07 -0.10 -0.10 -0.10 -0.10 -0.04 0
Emami Infrastructure 201403 4.86 0.19 0.07 -0.13 -0.13 -0.13 -0.13 -0.05 0
Emami Infrastructure 201406 4.86 0.17 0.18 0.01 0.01 0.00 0.01 0.01 0
Emergent Global Edu & Services 201309 4.57 0.22 0.03 -0.19 -0.19 -0.19 -0.19 -0.42 0
Emergent Global Edu & Services 201312 4.57 0.17 0.03 -0.15 -0.15 -0.15 -0.15 -0.32 0
Emergent Global Edu & Services 201403 4.57 0.09 0.26 0.93 0.76 0.00 0.76 0.09 0.67 0.67 1.46 0
Emergent Global Edu & Services 201406 4.57 0.26 0.03 -0.24 -0.24 -0.24 -0.24 -0.51 0
Emmbi Industries 201309 17.69 35.12 0.43 32.60 0.01 2.96 1.06 0.71 1.19 0.36 0.84 0.84 0.47 3
Emmbi Industries 201312 17.69 40.34 0.30 36.67 0.02 3.99 1.76 0.73 1.49 0.38 1.11 1.11 0.63 3
Emmbi Industries 201403 17.69 46.83 0.04 42.02 0.02 4.87 2.00 0.76 2.12 0.70 1.42 1.42 0.80 3
Emmbi Industries 201406 17.69 38.52 0.36 35.30 0.01 3.59 1.54 0.91 1.15 0.36 0.79 0.79 0.45 3
Esaar (India) 201309 8.18 6.80 5.08 1.72 0.00 1.72 0.00 1.72 1.72 0.21 0
Esaar (India) 201312 8.18 1.97 1.70 0.26 0.00 0.26 0.26 0.26 0.03 0
Esaar (India) 201403 8.18 5.43 7.34 -1.90 -1.90 -0.21 -1.69 -1.69 -0.21 0
Esaar (India) 201406 8.18 4.92 2.95 1.96 1.96 1.96 1.96 0.24 0
Eskay KNIt (India) 201309 28.08 139.19 137.42 1.78 11.67 11.05 -20.95 -20.95 -20.95 -0.75 0
Eskay KNIt (India) 201312 28.08 122.53 139.03 -16.50 12.97 9.59 -39.06 -39.06 -39.06 -1.39 0
Eskay KNIt (India) 201403 28.08 130.65 171.87 0.27 -40.96 13.21 10.81 -64.97 0.20 -65.18 -65.18 -2.31 0
Eskay KNIt (India) 201406 28.08 120.23 118.28 1.95 12.74 7.55 -18.34 -18.34 -18.34 -0.65 0
Essar Ports 201309 427.89 685.21 375.91 14.84 324.14 141.62 69.38 113.14 14.80 98.34 97.46 2.28 5
Essar Ports 201312 427.89 376.86 74.64 21.93 324.15 144.59 69.48 110.08 15.12 94.96 94.01 2.20 5
Essar Ports 201403 427.89 663.27 361.51 27.79 329.55 151.59 69.82 108.14 16.44 91.70 90.80 2.12 5
Essar Ports 201406 427.89 407.43 84.82 24.19 346.80 161.38 74.78 110.64 17.76 92.88 92.15 2.15 5
Ester Industries 201309 31.45 249.34 2.77 229.84 1.71 23.97 8.79 7.49 7.69 2.46 5.23 5.23 0.83 10
Ester Industries 201312 31.45 229.10 2.13 212.99 0.69 18.93 9.79 7.77 1.37 0.51 0.85 0.85 0.14 10
Ester Industries 201403 31.45 237.75 2.27 220.12 1.33 21.23 9.88 7.79 3.56 2.26 1.27 1.31 0.20 10
Ester Industries 201406 31.32 231.74 2.01 214.04 0.54 20.25 9.64 7.90 2.71 0.94 1.77 1.77 0.28 10
ETT 201309 10.37 0.87 0.67 0.10 0.30 0.34 0.64 -0.68 0.16 -0.85 -0.85 -0.82 0
ETT 201312 10.37 0.82 0.51 0.05 0.36 0.00 0.64 -0.29 0.18 -0.47 -0.47 -0.45 0
ETT 201403 10.37 0.19 0.61 0.76 0.01 0.05 0.15 0.66 -0.76 -1.13 0.37 0.37 0.36 0
ETT 201406 10.37 0.90 0.56 0.05 0.38 0.31 0.68 -0.61 -0.20 -0.40 -0.40 -0.39 0

Co_Name Year Equity N.Sale O.O.I T. Exp O.I PBIDT Int. Dep. PBT T.Tax PAT A.PAT EPS Div (%)
Exp
ecte
d R
esu
lts
on
14
No
vem
ber
201
4
Eureka Industries 201309 8.75 0.00 0.00 0.00 0.00 0.00 0.00 0
Eureka Industries 201312 8.75 0.00 0.00 0.00 0.00 0.00 0
Eureka Industries 201403 8.75 0.02 0.10 0.08 0.08 0.01 0.07 0.07 0.08 0
Eureka Industries 201406 8.75 0.02 -0.02 -0.02 -0.02 -0.02 -0.02 0
Euro Ceramics 201309 28.58 26.76 28.08 6.10 4.78 0.91 7.53 -3.66 -3.66 -3.66 -1.28 0
Euro Ceramics 201312 28.58 21.02 26.60 0.12 -5.46 0.22 7.43 -13.12 -13.12 -13.12 -4.59 0
Euro Ceramics 201403 33.74 12.57 12.30 0.11 0.38 0.06 7.20 -6.88 -6.88 -6.88 -2.56 0
Euro Ceramics 201406 33.74 10.82 10.85 0.07 0.04 0.19 9.81 -9.96 -9.96 -9.96 -2.95 0
Expo Gas Containers 201309 7.62 13.82 12.28 0.02 1.56 0.78 0.20 0.58 0.58 0.58 0.31 0
Expo Gas Containers 201312 4.92 15.68 13.93 0.02 1.78 0.63 0.20 0.96 0.96 0.96 0.78 0
Expo Gas Containers 201403 7.62 12.65 9.85 0.04 2.85 2.22 0.19 0.43 0.81 -0.38 -0.38 -0.20 0
Expo Gas Containers 201406 7.62 12.70 10.96 0.02 1.76 1.04 0.20 0.53 0.53 0.53 0.28 0
Faze Three 201309 12.19 49.98 3.66 47.18 0.55 7.02 3.62 1.21 -1.71 0.02 -1.73 -1.73 -10.39 0
Faze Three 201312 12.19 65.95 3.57 61.75 0.41 8.19 2.82 1.24 4.13 0.77 3.36 3.36 2.75 0
Faze Three 201403 12.19 50.27 4.72 51.77 0.57 3.79 4.88 1.24 1.06 -0.80 1.86 1.86 1.52 0
Faze Three 201406 12.19 49.84 3.74 46.80 0.40 7.18 3.63 1.29 1.01 0.00 1.01 1.01 0.83 0
FCS Software Solutions 201309 125.96 44.81 47.03 1.29 -0.93 0.31 9.76 -11.02 0.09 -11.11 -11.11 -0.09 0
FCS Software Solutions 201312 125.96 44.86 51.29 0.71 -5.73 0.17 9.98 -15.87 0.09 -15.96 -15.96 -0.13 0
FCS Software Solutions 201403 165.96 16.51 27.65 0.81 -10.33 0.21 10.29 -20.84 -0.35 -20.49 -20.49 -0.12 0
FCS Software Solutions 201406 165.96 20.29 21.35 0.88 -0.18 0.25 10.01 -10.43 0.12 -10.56 -10.56 -0.06 0
FE India 201309 8.20 305.62 0.38 296.87 0.35 9.48 6.77 0.15 2.56 0.87 1.69 1.69 2.06 0
FE India 201312 8.20 269.17 0.02 264.24 0.19 5.15 3.78 0.15 1.22 0.43 0.79 0.79 0.96 0
FE India 201403 8.20 251.61 0.16 246.15 1.04 6.66 4.07 0.14 2.44 0.79 1.65 1.65 2.01 0
FE India 201406 8.20 224.76 0.46 219.02 0.24 6.44 4.48 0.15 2.21 0.72 1.49 1.49 1.82 0
Finaventure Capital 201309 10.57 -4.07 0.06 -4.13 0.59 -4.72 -4.72 -4.72 -4.47 0
Finaventure Capital 201312 10.57 0.05 -0.05 0.65 -0.70 -0.70 -0.70 -0.66 0
Finaventure Capital 201403 10.57 -5.93 0.04 3.83 -2.14 -2.14 -2.14 -2.14 0
Finaventure Capital 201406 10.57 -1.07 0.08 -1.15 0.00 -1.15 -1.15 -1.15 -0.11 0
Fintech Communication 201309 4.82 0
Fintech Communication 201312 4.82 0
Fintech Communication 201403 5.01 0.00 0.00 0.00 -0.01 -0.01 -0.01 -0.01 0
Fintech Communication 201406 4.82 0.02 -0.02 -0.02 -0.02 -0.02 0
First Custodian Fund (India) 201309 1.50 0.06 0.05 0.07 0.04 0.00 0.00 0.03 0.00 0.03 0.03 0.21 0
First Custodian Fund (India) 201312 1.50 0.07 0.05 0.06 0.06 0.00 0.00 0.06 0.06 0.06 0.39 0
First Custodian Fund (India) 201403 1.50 0.03 0.10 0.05 0.08 0.01 0.00 0.07 0.04 0.03 0.03 0.19 0
First Custodian Fund (India) 201406 1.50 0.14 0.07 0.11 0.10 0.01 0.01 0.09 0.09 0.09 0.57 0

Co_Name Year Equity N.Sale O.O.I T. Exp O.I PBIDT Int. Dep. PBT T.Tax PAT A.PAT EPS Div (%)
Exp
ecte
d R
esu
lts
on
14
No
vem
ber
201
4
First Financial Services 201309 8.08 0.15 0.11 0.08 0.18 0.00 0.18 0.18 0.18 0.04 0
First Financial Services 201312 8.08 0.03 0.13 0.23 -0.07 0.00 -0.08 -0.08 -0.08 0
First Financial Services 201403 8.08 0.56 0.37 0.75 0.18 0.01 0.17 0.02 0.15 0.15 0.02 0
First Financial Services 201406 8.08 0.12 0.04 0.08 0.00 0.08 0.08 0.08 0.01 0
First Winner Industries 201309 50.23 8.34 8.07 0.05 0.31 4.50 1.86 -6.04 -6.04 -6.04 0
First Winner Industries 201312 50.23 3.47 4.37 0.15 -0.75 5.09 2.05 -7.89 -7.89 -7.89 0
First Winner Industries 201403 50.23 2.14 2.90 -0.06 -0.82 5.10 1.98 -7.90 -3.04 -4.87 -4.87 0
First Winner Industries 201406 50.23 0.33 6.35 0.12 -5.90 5.09 1.95 -12.94 -12.94 -12.94 0
Firstobject Technologies 201309 10.40 13.93 13.81 0.12 1.23 -1.11 -1.11 -1.11 -1.06 0
Firstobject Technologies 201312 10.40 11.54 12.72 -1.19 1.11 -2.29 -2.29 -2.29 -2.20 0
Firstobject Technologies 201403 10.40 7.25 7.64 0.62 0.23 0.98 -0.75 -0.75 -0.75 -0.72 0
Firstobject Technologies 201406 10.40 8.79 6.67 2.11 1.15 0.07 0.01 0.05 0.05 0.05 0
Firstsource Solutions 201309 658.31 797.90 -7.11 701.26 0.85 90.38 22.86 20.46 47.06 2.27 44.79 44.76 0.68 0
Firstsource Solutions 201312 658.74 799.35 0.41 706.64 0.24 93.37 21.16 18.97 53.24 4.77 48.47 48.31 0.73 0
Firstsource Solutions 201403 659.74 806.34 -10.14 697.30 -1.02 97.89 19.78 18.10 60.01 1.04 58.97 58.05 0.89 0
Firstsource Solutions 201406 661.42 761.93 -6.33 662.56 -1.03 92.02 18.37 17.55 56.10 2.79 53.31 53.25 0.81 0
Fischer Chemic 201309 3.44 0.01 -0.01 -0.01 -0.01 -0.01 0
Fischer Chemic 201312 3.44 0.07 0.03 0.04 0.04 0.04 0.04 0.01 0
Fischer Chemic 201403 3.44 0.03 -0.03 -0.03 -0.03 -0.03 -0.09 0
Fischer Chemic 201406 3.44 0.02 0.02 0.00 0.00 0.00 0.00 0
Focus Industrial Resources 201309 12.19 0.38 0.22 0.16 0.02 0.03 0.12 0.12 0.12 0.09 0
Focus Industrial Resources 201312 12.19 0.26 0.20 0.06 0.02 0.03 0.01 0.01 0.01 0.01 0
Focus Industrial Resources 201403 12.19 0.04 0.03 0.15 0.00 -0.08 0.01 0.02 -0.11 0.04 -0.15 -0.15 -0.13 0
Focus Industrial Resources 201406 12.19 0.30 0.19 0.11 0.01 0.04 0.06 0.06 0.06 0.05 0
Foods & Inns 201309 1.45 67.71 2.70 70.30 0.80 0.91 3.96 1.27 -4.31 -0.03 -4.29 -4.29 -29.54 18
Foods & Inns 201312 1.45 66.31 2.60 59.81 4.58 13.67 5.68 1.12 6.87 -0.23 7.10 7.10 48.94 18
Foods & Inns 201403 1.45 84.41 3.92 76.79 3.89 15.43 5.47 1.12 8.85 0.79 8.06 8.06 55.53 18
Foods & Inns 201406 1.45 89.00 2.73 80.50 1.79 13.02 5.72 2.92 4.38 1.20 3.18 3.18 21.90 18
Foseco India 201309 6.39 55.48 0.82 48.51 1.04 8.83 0.05 1.38 7.40 2.49 4.91 4.91 7.69 245
Foseco India 201312 6.39 55.54 0.72 52.03 0.62 4.85 0.08 1.22 3.55 1.39 2.16 2.16 3.38 245
Foseco India 201403 6.39 62.98 0.86 57.05 1.27 8.06 0.02 1.10 6.94 2.37 4.57 4.57 7.15 245
Foseco India 201406 6.39 64.72 0.94 55.41 0.75 11.00 0.05 1.31 9.65 3.31 6.34 6.34 9.93 245
Freshtrop Fruits 201309 11.95 5.71 1.55 6.89 0.33 0.70 0.29 0.68 -0.26 0.00 -0.26 -0.26 -0.22 10
Freshtrop Fruits 201312 11.95 5.91 0.01 6.76 0.35 -0.49 0.40 0.88 -1.78 -0.63 -1.15 -1.15 -0.98 10
Freshtrop Fruits 201403 12.15 42.19 0.49 38.79 0.16 4.05 0.66 -0.18 3.57 1.02 2.56 2.56 2.15 10
Freshtrop Fruits 201406 12.15 65.46 4.32 58.20 0.50 12.08 0.64 1.21 10.23 3.40 6.83 6.83 5.62 10

Co_Name Year Equity N.Sale O.O.I T. Exp O.I PBIDT Int. Dep. PBT T.Tax PAT A.PAT EPS Div (%)
Exp
ecte
d R
esu
lts
on
14
No
vem
ber
201
4
Frontline Business Solutions 201309 10.66 4.24 4.18 0.06 0.02 0.04 0.04 0.04 0.02 0
Frontline Business Solutions 201312 10.66 4.12 4.61 -0.49 0.02 -0.50 -0.50 -0.50 -0.24 0
Frontline Business Solutions 201403 10.66 0.71 0.50 0.01 0.22 0.02 0.21 0.21 0.21 0.19 0
Frontline Business Solutions 201406 10.66 3.91 3.92 -0.01 0.00 0.02 -0.03 -0.03 -0.03 -0.03 0
Frontline Securities 201309 9.51 1.43 0.11 1.32 0.01 1.31 0.36 0.95 0.95 1.00 10
Frontline Securities 201312 9.51 0.97 0.23 0.74 0.01 0.73 0.28 0.45 0.45 0.47 10
Frontline Securities 201403 7.19 1.58 0.35 1.24 0.01 1.23 0.33 0.90 0.90 1.26 10
Frontline Securities 201406 7.19 2.21 0.12 2.09 0.02 2.07 0.29 1.77 1.77 2.47 10
Future Consumer Enterprise 201309 958.79 139.23 2.10 163.33 7.38 -14.61 0.44 10.76 -25.81 -25.81 -23.44 -0.15 0
Future Consumer Enterprise 201312 958.79 213.93 4.05 236.97 92.62 73.63 1.96 9.84 61.83 0.00 61.83 63.84 0.40 0
Future Consumer Enterprise 201403 958.79 315.64 5.55 348.64 6.79 -20.66 2.40 10.52 -33.58 -0.59 -33.00 -30.83 -0.19 0
Future Consumer Enterprise 201406 958.79 288.19 4.78 306.10 7.74 -5.39 3.00 10.64 -19.03 0.03 -19.06 -17.21 -0.11 0
Future Retail 201309 46.32 356.06 6.26 329.65 4.94 37.61 29.86 23.77 -16.02 -6.16 -9.86 -9.86 -0.43 30
Future Retail 201312 46.32 2276.30 47.01 2096.38 8.02 234.95 149.27 84.31 32.18 10.44 21.74 21.74 0.94 30
Future Retail 201403 46.32 2295.46 49.63 2104.32 5.11 245.88 155.25 88.08 2.40 0.78 1.62 1.62 0.07 30
Future Retail 201406 46.36 2317.15 51.14 2124.73 8.38 251.94 161.75 124.16 66.48 66.48 66.48 2.87 30
Futuristic Securities 201309 1.95 0.01 0.02 0.01 0.01 0.00 0.01 0.01 0.04 0
Futuristic Securities 201312 1.95 0.01 0.02 0.01 0.01 0.00 0.00 0.00 0.02 0
Futuristic Securities 201403 1.95 0.01 0.03 0.02 0.02 0.01 0.01 0.01 0.07 0
Futuristic Securities 201406 1.95 0.02 0.02 0.00 0.00 0.00 0.00 0.00 0.01 0
Gaekwar Mills 201309 2.00 0.03 0.10 0.07 0.67 -0.60 -0.60 -0.60 -30.17 0
Gaekwar Mills 201312 2.00 0.02 0.10 0.08 0.67 -0.59 -0.59 -0.59 -29.72 0
Gaekwar Mills 201403 2.00 0.14 0.43 0.29 0.69 -0.40 -0.40 -0.40 -19.92 0
Gaekwar Mills 201406 2.00 0.02 0.05 0.03 0.67 -0.63 -0.63 -0.63 -31.66 0
Gajra Bevel Gears 201309 9.40 0.05 0.00 -0.05 0.06 -0.11 -0.11 -0.11 -0.11 0
Gajra Bevel Gears 201312 9.40 0.03 -0.03 0.06 -0.09 -0.09 -0.09 -0.10 0
Gajra Bevel Gears 201403 9.40 0.06 0.00 -0.05 1.39 -8.61 -8.61 -8.61 -9.16 0
Gajra Bevel Gears 201406 9.40 0.06 -0.06 0.01 -0.08 -0.08 -0.08 -0.08 0
Galada Power & Telecommunication 201309 7.49 4.60 0.19 5.07 0.19 -0.09 1.50 0.30 -1.89 -1.89 -1.89 -2.52 0
Galada Power & Telecommunication 201312 7.49 1.83 0.37 2.28 0.19 0.11 1.49 0.30 -1.68 -1.68 -1.68 -2.24 0
Galada Power & Telecommunication 201403 7.49 2.97 0.14 3.14 0.17 0.14 1.46 0.31 5.18 5.18 5.18 6.92 0
Galada Power & Telecommunication 201406 7.49 1.50 0.13 1.86 0.19 -0.04 1.26 0.13 16.80 16.80 16.80 22.43 0
Gandhinagar Hotels 201309 6.78 4.07 2.88 0.00 1.19 0.28 0.70 0.21 0.21 0.21 0
Gandhinagar Hotels 201312 6.78 4.56 3.52 0.00 1.04 0.29 0.50 0.25 0.00 0.25 0.25 0
Gandhinagar Hotels 201403 6.78 4.62 3.76 0.00 0.86 0.29 0.31 0.27 0.00 0.27 0.27 0.39 0
Gandhinagar Leasing & Finance 201309 5.96 1.15 1.16 0.00 -0.01 0.00 0.00 -0.01 0.00 -0.01 -0.01 0
Gandhinagar Leasing & Finance 201312 5.96 1.15 1.16 0.00 -0.01 0.00 0.00 -0.01 -0.01 -0.01 0
Gandhinagar Leasing & Finance 201403 5.96 1.15 1.16 0.00 -0.01 0.00 0.00 -0.01 -0.01 -0.01 0

Co_Name Year Equity N.Sale O.O.I T. Exp O.I PBIDT Int. Dep. PBT T.Tax PAT A.PAT EPS Div (%)
Exp
ecte
d R
esu
lts
on
14
No
vem
ber
201
4
Ganga Papers India 201309 10.79 16.54 0.03 14.95 0.07 1.68 1.16 0.11 0.41 0.41 0.41 0.38 0
Ganga Papers India 201312 10.79 16.56 0.03 15.34 0.07 1.31 0.81 0.13 0.38 0.38 0.38 0.38 0
Ganga Papers India 201403 10.79 17.33 0.03 16.52 -0.04 0.80 0.55 0.13 0.12 0.02 0.10 0.10 0.10 0
Ganga Papers India 201406 10.79 17.19 0.02 16.55 0.07 0.74 0.44 0.14 0.16 0.16 0.16 0.15 0
Garnet Construction 201309 13.90 1.74 1.82 0.00 -0.08 0.55 0.11 -0.73 -0.73 -0.73 -0.53 0
Garnet Construction 201312 13.90 7.57 5.29 4.14 6.41 0.52 0.13 5.76 0.20 5.56 5.56 4.00 0
Garnet Construction 201403 13.90 -6.13 -4.86 0.18 -1.09 0.62 0.13 -1.84 0.38 -2.22 -2.22 -1.60 0
Garnet Construction 201406 13.90 4.91 3.17 0.00 1.74 0.62 0.13 1.00 0.15 0.85 0.85 0.61 0
Gayatri Tissue & Papers 201309 1.50 1.22 1.11 0.11 0.09 0.03 0.05 0.05 0.36 0
Gayatri Tissue & Papers 201312 1.50 1.94 1.73 0.21 0.21 0.07 0.15 0.15 0.97 0
Gayatri Tissue & Papers 201403 1.50 0.68 0.66 0.03 0.03 0.01 0.02 0.02 0.12 0
Gayatri Tissue & Papers 201406 1.50 1.15 1.06 0.09 0.09 0.03 0.06 0.06 0.43 0
Gee Gee Granites 201309 4.50 0.01 -0.01 -0.01 -0.01 -0.01 -0.02 0
Gee Gee Granites 201312 4.50 0.01 -0.01 -0.01 -0.01 -0.01 -0.01 0
Gee Gee Granites 201403 4.50 0.01 -0.01 -0.01 -0.01 -0.01 0
Gee Gee Granites 201406 4.50 0.01 -0.01 -0.01 -0.01 -0.01 -0.01 0
Gemstone Investments 201309 7.48 0.26 0.08 0.18 0.03 0.00 0.14 0.14 0.14 0.02 0
Gemstone Investments 201312 7.48 0.26 0.07 0.00 0.19 0.03 0.00 0.16 0.16 0.16 0.02 0
Gemstone Investments 201403 7.48 0.31 0.47 -0.16 0.03 0.00 -0.20 0.09 -0.29 -0.29 -0.04 0
Gemstone Investments 201406 7.48 0.42 0.08 0.34 0.03 0.00 0.31 0.31 0.31 0.04 0
Genesys International Corporation 201309 14.92 23.05 15.28 1.74 9.51 0.49 2.89 6.12 1.55 4.57 4.57 1.53 3
Genesys International Corporation 201312 14.22 16.14 13.01 0.19 3.33 0.51 2.50 0.32 -0.12 0.43 0.43 0.14 3
Genesys International Corporation 201403 14.92 5.75 10.40 -0.40 -5.05 0.34 1.48 -6.87 -1.30 -5.58 -5.58 -1.87 3
Genesys International Corporation 201406 14.92 15.96 12.13 0.59 4.43 0.42 2.10 1.91 0.16 1.75 1.75 0.58 3
Genus Power Infrastructures 201309 15.89 204.86 1.66 170.22 36.30 8.93 2.67 24.70 3.65 21.05 21.05 1.32 10
Genus Power Infrastructures 201312 25.66 175.62 -1.12 144.84 29.65 13.10 2.70 13.84 2.66 11.18 11.18 0.77 10
Genus Power Infrastructures 201403 25.66 212.25 3.87 197.58 0.53 19.06 0.55 2.67 15.85 -5.89 21.74 21.74 1.16 10
Genus Power Infrastructures 201406 25.67 169.42 1.59 148.12 1.21 24.10 5.87 2.64 15.59 3.28 12.32 12.32 0.48 10
GI Engineering Solutions 201309 8.61 0.02 0.03 0.02 0.01 0.00 0.01 0.00 0.00 0.00 0
GI Engineering Solutions 201312 8.61 0.01 0.05 -0.01 -0.05 0.00 -0.05 -0.05 -0.05 -0.06 0
GI Engineering Solutions 201403 8.61 0.01 0.02 -0.01 -0.03 0.00 -0.03 -0.01 -0.02 -0.02 -0.03 0
GI Engineering Solutions 201406 8.61 0.01 0.03 0.00 -0.02 0.00 -0.02 -0.02 -0.02 -0.03 0
Gitanjali Gems 201309 92.07 3003.70 2853.10 88.75 239.35 182.74 8.11 48.50 7.93 40.57 37.82 4.11 0
Gitanjali Gems 201312 92.07 2759.61 2483.98 275.63 220.00 8.30 47.33 -3.22 50.55 50.46 5.48 0
Gitanjali Gems 201403 92.07 2753.50 2650.97 11.84 114.38 198.22 14.59 -99.16 -7.86 -91.30 -89.89 -9.76 0
Gitanjali Gems 201406 98.12 2072.87 1842.94 8.73 238.66 208.09 7.43 12.94 2.20 10.74 10.15 1.08 0

Co_Name Year Equity N.Sale O.O.I T. Exp O.I PBIDT Int. Dep. PBT T.Tax PAT A.PAT EPS Div (%)
Exp
ecte
d R
esu
lts
on
14
No
vem
ber
201
4
GIVO 201309 24.15 5.66 0.96 6.20 0.42 0.11 0.15 0.16 0.16 0.16 0.02 0
GIVO 201312 24.15 6.10 0.14 5.82 0.42 0.14 0.14 0.14 0.14 0.14 0.02 0
GIVO 201403 24.15 6.16 0.20 6.08 0.00 0.29 0.07 0.14 0.08 0.19 -0.11 -0.11 -0.01 0
GIVO 201406 24.15 4.50 0.18 4.26 0.42 0.12 0.15 0.15 0.15 0.15 0.02 0
Globus Power Generation 201309 74.75 0.04 0.09 -0.05 -0.05 -0.05 -0.05 -0.01 0
Globus Power Generation 201312 74.75 0.87 0.28 0.59 0.07 0.52 0.14 0.38 0.38 0.05 0
Globus Power Generation 201403 74.75 0.36 0.30 0.07 -0.04 -1.88 0.12 -1.99 -1.99 -0.27 0
Globus Power Generation 201406 98.95 0.14 0.04 -0.10 0.01 -0.11 -0.10 -0.01 -0.01 0
GMR Infrastructure 201309 389.24 2397.21 21.90 1842.79 81.23 657.55 683.69 333.11 -322.23 58.01 -380.24 -393.05 -1.01 10
GMR Infrastructure 201312 389.24 2625.04 13.31 2006.17 145.19 777.37 759.93 373.27 -355.83 58.05 -413.88 -441.09 -1.13 10
GMR Infrastructure 201403 389.24 2930.00 30.75 2269.45 106.06 797.36 918.51 437.69 1169.31 -15.05 1184.36 1170.18 3.01 10
GMR Infrastructure 201406 389.24 2699.38 32.01 2118.48 64.98 677.89 831.65 453.27 -625.15 26.50 -651.65 -593.20 -1.52 10
Goenka Diamond & Jewels 201309 31.70 144.77 136.83 6.98 14.92 2.94 0.26 11.72 0.64 11.08 11.08 0.35 10
Goenka Diamond & Jewels 201312 31.70 46.10 -0.01 42.81 -1.08 2.20 3.12 0.24 -1.16 -0.83 -0.33 -0.33 -0.01 10
Goenka Diamond & Jewels 201403 31.70 40.10 44.38 -5.74 -10.02 4.05 -14.07 -1.99 -12.08 -12.08 10
Goenka Diamond & Jewels 201406 31.70 13.41 11.32 0.49 2.57 3.69 -1.12 -0.38 -0.74 -0.74 10
Gokaldas Exports 201309 17.19 265.43 13.68 273.02 11.37 17.45 9.42 6.24 1.80 1.80 1.80 0.52 0
Gokaldas Exports 201312 17.19 235.96 16.91 239.55 2.34 15.65 8.31 6.34 1.00 1.00 1.00 0.29 0
Gokaldas Exports 201403 17.19 306.73 15.30 298.07 0.48 24.44 11.63 6.05 6.76 0.40 6.36 6.36 1.85 0
Gokaldas Exports 201406 17.19 258.40 13.39 267.60 13.70 17.87 13.13 7.47 -2.73 -2.73 -2.73 -0.79 0
GOL Offshore 201309 37.24 306.37 140.13 19.70 185.94 60.21 45.37 80.36 29.60 50.76 50.76 13.63 0
GOL Offshore 201312 37.24 227.24 116.10 15.15 126.29 54.90 45.66 25.73 1.25 24.48 24.48 6.57 0
GOL Offshore 201403 37.24 258.49 174.36 13.36 97.49 49.88 44.49 3.12 -9.84 12.96 12.96 3.48 0
GOL Offshore 201406 37.24 228.66 122.23 11.09 117.52 64.86 44.94 7.72 4.20 3.52 3.52 0.95 0
Golechha Global Finance 201309 5.50 0.15 0.09 0.06 0.06 0.02 0.04 0.04 0.07 0
Golechha Global Finance 201312 5.50 0.15 0.11 0.04 0.04 0.01 0.03 0.03 0.05 0
Golechha Global Finance 201403 5.50 0.18 0.13 0.05 0.05 0.02 0.04 0.04 0.07 0
Golechha Global Finance 201406 5.50 0.16 0.10 0.07 0.07 0.02 0.05 0.05 0.08 0
Govind Rubber 201309 21.84 121.67 0.10 117.63 1.70 5.84 4.73 0.75 0.36 0.36 0.36 0.17 0
Govind Rubber 201312 21.84 95.15 89.90 0.42 5.67 4.82 0.67 0.18 0.18 0.18 0.08 0
Govind Rubber 201403 21.84 124.78 117.99 1.48 8.27 5.50 1.07 1.70 -0.15 1.85 1.85 0.85 0
Govind Rubber 201406 21.84 65.62 0.01 61.30 0.11 4.44 5.26 0.84 -1.66 -1.66 -1.66 -0.77 0
Goyal Associates 201309 5.08 0.04 0.04 -0.02 0.11 0.01 0.10 0.10 0.10 0.02 0
Goyal Associates 201312 5.08 0.10 0.03 0.17 -0.03 0.01 -0.04 -0.04 -0.04 -0.01 0
Goyal Associates 201403 5.08 0.03 0.02 0.02 0.01 0.01 0.01 -0.01 -0.01 0.00 0
Goyal Associates 201406 5.08 0.14 0.04 0.12 0.06 0.01 0.05 0.05 0.05 0.01 0

Co_Name Year Equity N.Sale O.O.I T. Exp O.I PBIDT Int. Dep. PBT T.Tax PAT A.PAT EPS Div (%)
Exp
ecte
d R
esu
lts
on
14
No
vem
ber
201
4
GPT Infraprojects 201309 14.34 114.01 0.13 100.04 2.20 16.30 9.33 5.01 1.96 0.96 1.00 1.10 0.76 10
GPT Infraprojects 201312 14.34 87.85 0.26 73.24 1.67 16.55 10.41 4.43 1.71 -0.06 1.77 1.92 1.34 10
GPT Infraprojects 201403 14.34 113.12 0.26 98.12 0.28 15.53 9.89 5.94 -0.30 -0.56 0.26 -0.20 -0.14 10
GPT Infraprojects 201406 14.34 81.48 0.30 65.46 1.62 17.94 10.16 5.19 2.59 0.32 2.27 2.05 1.43 10
Gratex Industries 201309 3.04 2.14 0.10 2.00 0.23 0.01 0.02 0.21 0.21 0.21 0.67 0
Gratex Industries 201312 3.04 0.70 0.10 0.84 -0.03 0.01 0.02 -0.07 -0.07 -0.07 -0.21 0
Gratex Industries 201403 3.04 2.30 0.07 2.10 0.28 0.01 0.02 0.25 -0.11 0.25 -0.36 0
Gratex Industries 201406 3.04 0.24 0.31 -0.08 0.00 0.02 -0.10 -0.10 -0.10 -0.32 0
Grauer & Weil (India) 201309 22.67 84.68 1.94 71.19 1.71 17.14 4.26 2.85 10.03 2.00 8.03 8.03 0.35 16
Grauer & Weil (India) 201312 22.67 94.63 1.18 80.14 -0.27 15.40 4.31 2.85 8.24 1.64 6.60 6.60 0.29 16
Grauer & Weil (India) 201403 22.67 112.50 1.78 99.45 -0.66 14.17 3.62 2.91 7.64 0.27 7.37 7.37 0.33 16
Grauer & Weil (India) 201406 22.67 88.44 1.70 74.07 0.26 16.33 3.66 3.62 9.05 1.71 7.34 7.34 0.32 16
Greenearth Resources and Projects 201309 29.03 4.23 7.00 -2.77 0.00 3.72 -6.49 -6.49 -6.49 -0.22 0
Greenearth Resources and Projects 201312 29.03 6.37 8.08 -1.71 3.72 -5.43 -5.43 -5.43 -0.19 0
Greenearth Resources and Projects 201403 29.03 2.70 42.11 2.43 -36.98 0.00 3.00 -112.24 -112.24 -112.24 -3.87 0
Greenearth Resources and Projects 201406 29.03 4.69 5.00 0.00 -0.31 3.23 -3.54 -3.54 -3.54 -0.12 0
Greycells Education 201309 6.01 1.38 0.04 2.15 0.00 -0.74 0.00 0.04 -0.77 0.01 -0.78 -0.79 -1.32 0
Greycells Education 201312 6.01 2.83 0.10 2.44 0.02 0.51 0.04 0.88 0.01 0.87 0.80 1.33 0
Greycells Education 201403 6.01 2.73 0.03 2.30 0.37 0.83 0.03 0.80 -0.08 0.87 0.82 1.36 0
Greycells Education 201406 7.91 2.12 0.19 2.36 0.12 0.06 0.07 -0.01 -0.02 0.01 0.09 0.02 0
GSL Nova Petrochemicals 201309 13.50 0.02 0.26 0.20 -0.05 2.36 1.06 -3.47 -3.47 -3.47 -1.28 0
GSL Nova Petrochemicals 201312 13.50 0.00 0.18 0.12 -0.05 2.44 0.94 -3.43 -3.43 -3.43 -1.27 0
GSL Nova Petrochemicals 201403 13.50 6.32 4.24 0.43 2.52 2.50 1.00 -0.97 -0.97 -0.97 -4.19 0
GSL Nova Petrochemicals 201406 13.50 0.44 -0.44 2.24 0.89 -3.57 -3.57 -3.57 -1.32 0
Gujarat Apollo Industries 201309 16.58 6.92 0.09 7.70 4.06 3.37 0.24 0.50 2.63 0.40 2.23 2.23 1.35 25
Gujarat Apollo Industries 201312 16.58 10.59 0.14 13.35 2.67 0.04 1.55 0.32 -1.83 -1.83 -1.83 -1.10 25
Gujarat Apollo Industries 201403 15.94 17.50 0.01 24.77 3.35 -3.91 1.39 0.25 -5.54 -2.51 5.62 -3.03 3.53 25
Gujarat Apollo Industries 201406 15.15 11.85 0.20 13.85 3.69 1.89 2.06 0.33 -0.49 -0.49 -0.49 -0.32 25
Gujarat Craft Industries 201309 3.54 23.80 0.88 23.39 0.01 1.30 0.52 0.33 0.45 0.16 0.30 0.30 0.84 0
Gujarat Craft Industries 201312 4.11 23.77 0.63 23.12 0.02 1.29 0.56 0.32 0.41 0.13 0.28 0.28 0.57 0
Gujarat Craft Industries 201403 4.11 24.69 0.84 23.59 0.04 1.98 1.09 0.36 0.52 0.20 0.33 0.33 0.81 0
Gujarat Craft Industries 201406 4.89 18.43 0.59 17.58 0.48 1.92 1.02 0.45 0.45 0.15 0.30 0.30 0.61 0
Gujarat Natural Resources 201309 38.75 3.41 0.04 1.23 0.14 2.37 0.20 0.31 1.85 0.36 1.50 1.50 0.39 3
Gujarat Natural Resources 201312 38.75 3.14 0.08 2.31 0.07 0.99 0.15 0.33 0.51 0.13 0.38 0.38 0.10 3
Gujarat Natural Resources 201403 38.75 3.13 0.46 0.71 3.36 6.24 0.79 1.73 3.72 -0.66 4.38 4.38 1.13 3
Gujarat Natural Resources 201406 38.75 4.46 0.56 2.05 0.92 3.89 1.54 0.71 1.64 0.34 1.30 1.30 0.34 3

Co_Name Year Equity N.Sale O.O.I T. Exp O.I PBIDT Int. Dep. PBT T.Tax PAT A.PAT EPS Div (%)
Exp
ecte
d R
esu
lts
on
14
No
vem
ber
201
4
Gujarat Petrosynthese 201309 5.17 2.19 0.24 2.81 0.03 -0.34 0.10 -0.44 -0.44 -0.44 -0.85 0
Gujarat Petrosynthese 201312 5.64 2.08 0.24 2.47 0.01 -0.14 0.10 -0.24 -0.24 -0.24 -0.43 0
Gujarat Petrosynthese 201403 5.17 2.13 0.24 2.69 0.03 -0.30 0.10 -0.40 -0.40 0.38 0.00 0.67 0
Gujarat Petrosynthese 201406 5.64 2.23 0.24 2.49 0.00 -0.02 0.10 -0.12 -0.12 -0.12 -0.20 0
Gulf Oil Corporation 201309 19.83 222.00 0.04 199.25 11.38 34.18 10.32 3.67 20.19 7.80 12.39 12.39 1.25 125
Gulf Oil Corporation 201312 19.83 231.76 0.09 211.37 14.81 35.29 7.57 3.66 16.18 -1.85 18.03 18.03 1.82 125
Gulf Oil Corporation 201403 19.83 271.36 0.94 246.46 7.88 33.73 1.89 3.47 27.60 9.24 18.36 18.36 1.85 125
Gulf Oil Corporation 201406 9.92 22.79 0.98 21.96 3.19 5.01 0.48 0.33 9.74 1.65 8.09 8.09 1.63 125
Gulshan Polyols 201309 4.22 77.65 0.79 69.32 0.32 9.44 0.83 3.24 5.96 0.84 5.13 5.13 6.07 50
Gulshan Polyols 201312 4.22 82.41 0.20 69.77 0.27 13.10 1.12 3.55 8.45 3.09 5.36 5.36 6.35 50
Gulshan Polyols 201403 4.22 81.30 0.18 69.03 0.47 12.92 0.10 3.53 9.30 -0.61 9.90 9.90 10.59 50
Gulshan Polyols 201406 4.22 84.78 0.43 72.30 0.64 13.54 0.88 5.18 7.48 1.69 5.80 5.80 6.86 50
Gupta Synthetics 201309 7.35 18.10 19.20 -1.09 4.60 1.66 -7.35 -7.35 -7.35 -9.98 0
Gupta Synthetics 201312 7.35 23.08 25.50 0.03 -2.40 4.68 1.66 -8.74 -8.74 -8.74 -11.88 0
Gupta Synthetics 201403 7.35 18.66 22.69 0.03 -4.00 4.73 1.67 -10.39 -10.39 -10.39 -14.13 0
Gupta Synthetics 201406 7.35 15.30 19.37 0.02 -4.06 4.60 1.66 -10.32 -10.32 -10.32 -14.03 0
GV Films 201309 368.63 1.32 2.46 0.04 -1.10 0.10 0.03 -1.23 -1.23 -1.23 0
GV Films 201312 368.63 1.32 2.28 0.03 -0.93 0.10 0.03 -1.06 -1.06 -1.06 0
GV Films 201403 368.63 1.30 2.45 0.15 -0.99 0.10 0.37 -1.46 -1.46 -1.46 0
GV Films 201406 368.63 1.26 2.44 0.05 -1.14 0.02 -1.16 -1.16 -1.16 0
GVK Power & Infrastructure 201309 157.92 691.91 431.26 38.49 299.14 212.61 91.65 -5.12 54.38 -59.50 -57.19 -0.36 0
GVK Power & Infrastructure 201312 157.92 735.09 478.77 34.29 290.61 198.91 91.48 0.22 52.38 -52.16 -45.43 -0.29 0
GVK Power & Infrastructure 201403 157.92 694.41 535.25 21.98 181.14 304.72 164.14 -287.72 -21.88 -265.84 -235.46 -1.49 0
GVK Power & Infrastructure 201406 157.92 712.67 781.41 25.14 -43.60 320.97 176.66 -541.23 -119.52 -421.71 -281.33 -1.78 0
Haldyn Glass 201309 5.38 38.02 0.29 30.58 0.78 8.52 0.18 1.84 6.50 2.67 3.83 3.83 0.71 75
Haldyn Glass 201312 5.38 42.59 0.55 34.71 0.65 9.09 0.18 1.89 7.01 1.95 5.06 5.06 0.94 75
Haldyn Glass 201403 5.38 36.13 0.13 29.84 1.15 7.57 0.17 1.51 5.89 2.16 3.73 3.73 0.69 75
Haldyn Glass 201406 5.38 35.25 0.46 28.65 0.65 7.72 0.13 1.29 6.30 2.07 4.24 4.24 0.79 75
Haria Apparels 201406 15.29 0.00 0.13 0.48 0.35 0.08 0.12 0.15 0.00 0.15 0.15 0.10 0
Haria Exports 201309 11.55 0.49 1.54 0.84 -0.21 0.01 -0.22 -0.22 -0.22 -0.19 0
Haria Exports 201312 11.55 0.58 1.01 0.43 0.00 0.02 -0.02 -0.02 -0.02 -0.02 0
Haria Exports 201403 11.55 0.10 0.98 0.40 -0.48 0.00 -0.48 -0.26 -0.22 -0.22 -0.19 0
Haria Exports 201406 11.55 0.11 0.12 0.02 0.01 0.01 0.01 0.01 0
Hariyana Ship Breakers 201309 6.17 120.89 131.80 4.98 -5.93 3.48 0.47 -9.88 -9.88 -9.88 -16.03 0
Hariyana Ship Breakers 201312 6.17 39.94 38.97 6.97 7.94 0.84 0.46 6.64 6.64 6.64 10.76 0
Hariyana Ship Breakers 201403 6.17 97.56 92.48 14.72 19.81 2.34 0.43 17.04 2.39 14.65 14.65 23.75 0
Hariyana Ship Breakers 201406 6.17 68.37 71.25 6.93 4.06 0.86 0.49 2.71 0.98 1.73 1.73 2.80 0

Co_Name Year Equity N.Sale O.O.I T. Exp O.I PBIDT Int. Dep. PBT T.Tax PAT A.PAT EPS Div (%)
Exp
ecte
d R
esu
lts
on
14
No
vem
ber
201
4
Hasti Finance 201309 10.84 0.54 0.50 0.04 0.02 0.03 0.01 0.02 0.02 0.02 0
Hasti Finance 201312 10.84 0.52 0.48 0.04 0.02 0.03 0.01 0.02 0.02 0.02 0
Hasti Finance 201403 10.84 0.53 0.61 0.23 0.14 0.00 0.00 0.15 0.04 0.10 0.10 0.14 0
Hasti Finance 201406 10.84 0.45 0.42 0.03 0.02 0.01 0.01 0.00 0.00 0
Hathway Bhawani Cabletel & Datacom 201309 8.00 3.86 4.49 0.02 -0.61 0.01 0.19 -0.81 -0.01 -0.81 -0.81 -1.01 0
Hathway Bhawani Cabletel & Datacom 201312 8.00 3.42 4.15 0.02 -0.72 0.01 0.20 -1.03 -0.01 -1.02 -1.02 -1.28 0
Hathway Bhawani Cabletel & Datacom 201403 8.00 4.05 4.87 0.03 -0.79 0.01 0.21 -1.00 -0.01 -1.00 -1.00 -1.25 0
Hathway Bhawani Cabletel & Datacom 201406 8.00 3.89 4.31 0.02 -0.41 0.05 0.20 -0.61 0.05 -0.66 -0.66 -0.82 0
HB Leasing & Finance Company 201309 11.00 0.00 0.16 -0.16 0.00 -0.16 -0.03 -0.14 -0.14 -0.13 0
HB Leasing & Finance Company 201312 11.00 0.13 -0.13 0.00 -0.13 -0.13 -0.13 -0.12 0
HB Leasing & Finance Company 201403 11.00 0.00 0.14 -0.14 -0.14 -0.14 -0.14 -0.13 0
HB Leasing & Finance Company 201406 11.00 0.03 0.14 -0.71 -0.82 0.00 -0.82 0.00 -0.82 -0.82 -0.74 0
HB Portfolio 201309 12.27 4.16 0.38 3.78 0.01 0.01 3.77 0.76 3.01 3.01 2.51 15
HB Portfolio 201312 12.27 0.88 0.30 0.06 0.64 0.01 0.01 0.63 0.10 0.52 0.52 0.44 15
HB Portfolio 201403 12.27 -0.83 0.14 0.30 -0.99 0.21 0.01 -1.21 -0.06 -1.15 -1.15 -0.96 15
HB Portfolio 201406 12.27 0.73 0.29 0.43 0.00 0.01 0.42 0.09 0.33 0.33 0.27 15
HBL Power Systems 201309 25.30 300.68 273.43 1.53 28.78 18.00 10.11 63.22 8.03 55.19 55.19 2.18 15
HBL Power Systems 201312 25.30 345.29 315.00 2.49 32.78 18.87 9.92 4.58 1.58 3.00 3.00 0.12 15
HBL Power Systems 201403 25.30 320.16 316.84 9.31 12.63 18.50 8.47 -20.94 -3.52 -17.42 -17.42 -0.69 15
HBL Power Systems 201406 25.30 285.57 271.76 3.37 17.18 17.76 12.81 -17.94 -0.60 -17.34 -17.34 -0.69 15
High Ground Enterprise 201309 5.50 11.64 11.40 0.51 0.76 0.16 0.00 0.59 0.18 0.41 0.41 0.74 7
High Ground Enterprise 201312 5.50 27.47 26.08 0.00 1.39 0.26 0.00 1.12 0.36 0.76 0.76 1.38 7
High Ground Enterprise 201403 5.50 23.58 20.50 0.02 3.10 0.33 0.01 2.76 0.89 1.88 1.88 3.41 7
High Ground Enterprise 201406 8.60 24.11 21.84 0.01 2.28 0.35 0.15 1.78 0.58 1.21 1.21 1.98 7
High Street Filatex 201309 0.65 0.00 0.01 -0.01 0.02 -0.03 -0.03 -0.03 -0.49 0
High Street Filatex 201312 0.65 0.02 0.02 0.02 -0.02 -0.02 -0.02 -0.29 0
High Street Filatex 201403 0.65 0.09 0.01 0.00 0.08 0.02 0.06 0.06 0.06 0.95 0
High Street Filatex 201406 0.65 0.36 0.34 0.01 0.02 0.02 0.00 0.00 0.00 0.03 0
Himalaya Granites 201309 3.01 0.11 0.16 0.10 0.04 0.05 -0.01 -0.04 0.03 0.03 0.11 0
Himalaya Granites 201312 3.01 0.11 0.19 0.10 0.01 0.05 -0.04 -0.04 0.00 0.00 0
Himalaya Granites 201403 3.01 0.02 0.12 0.20 0.05 -0.01 0.05 -0.06 0.01 -0.07 -0.07 -0.22 0
Himalaya Granites 201406 3.01 0.14 0.20 0.10 0.03 0.05 -0.02 -0.19 0.18 0.18 0.58 0
Himalchuli Food Products 201309 1.90 0.17 0.16 0.00 0.00 0.00 0.00 0
Himalchuli Food Products 201312 1.90 0.04 0.04 0.00 0.00 0.00 0.00 0
Himalchuli Food Products 201403 1.90 0.25 0.25 0.00 0.00 0.00 0.00 0.01 0
Himalchuli Food Products 201406 1.90 0.01 0.00 0.00 0.00 0.00 0.00 0

Co_Name Year Equity N.Sale O.O.I T. Exp O.I PBIDT Int. Dep. PBT T.Tax PAT A.PAT EPS Div (%)
Exp
ecte
d R
esu
lts
on
14
No
vem
ber
201
4
Hind Aluminium Industries 201309 6.30 117.39 1.14 113.88 0.61 5.26 2.38 0.80 2.08 1.45 0.63 0.63 15
Hind Aluminium Industries 201312 6.30 115.73 1.40 113.41 0.61 4.32 1.28 0.97 2.07 0.71 1.37 1.37 15
Hind Aluminium Industries 201403 6.30 82.12 0.57 81.37 1.08 2.39 1.10 0.89 0.40 -0.06 0.46 0.46 15
Hind Aluminium Industries 201406 6.30 79.87 1.31 79.10 0.87 2.95 1.32 0.77 0.87 0.87 0.87 15
Hind Industries 201309 8.64 76.86 73.14 0.16 3.88 2.51 0.72 0.65 0.12 0.53 0.53 0.61 0
Hind Industries 201312 8.64 17.03 13.67 0.27 3.62 2.29 0.72 0.62 0.12 0.50 0.50 0.57 0
Hind Industries 201403 8.64 38.01 35.03 0.95 3.93 2.78 0.57 0.58 0.36 0.22 0.22 0.25 0
Hind Industries 201406 8.64 21.33 18.28 0.38 3.43 2.30 0.68 0.45 0.13 0.32 0.32 0.37 0
Hindustan Adhesives 201309 5.12 18.89 16.88 2.01 0.80 0.55 0.66 0.37 0.29 0.29 0.57 0
Hindustan Adhesives 201312 5.12 20.12 18.37 0.12 1.87 0.90 0.53 0.44 0.11 0.33 0.33 0.64 0
Hindustan Adhesives 201403 5.12 20.35 18.35 0.07 2.07 0.86 0.46 0.75 0.12 0.63 0.63 1.23 0
Hindustan Adhesives 201406 5.12 19.09 17.37 0.07 1.79 0.78 0.52 0.49 0.10 0.39 0.39 0.76 0
Hindustan Appliances 201309 9.99 0.01 0.19 0.18 0.18 0.18 0.18 0.18 0
Hindustan Appliances 201312 9.99 0.00 0.18 0.18 0.18 0.18 0.18 0.18 0
Hindustan Appliances 201403 9.99 0.00 0.20 0.20 0.20 0.23 -0.03 -0.03 -0.03 0
Hindustan Appliances 201406 9.99 0.02 0.18 0.16 0.16 0.16 0.16 0.16 0
Hindustan Everest Tools 201309 1.61 7.24 0.04 8.01 0.00 -0.73 0.27 0.16 -1.15 -1.15 -1.15 -7.17 0
Hindustan Everest Tools 201312 1.61 12.15 0.64 10.94 0.17 2.02 0.34 0.16 1.52 1.52 1.52 9.45 0
Hindustan Everest Tools 201403 1.61 12.68 0.64 11.29 0.00 2.03 0.39 0.16 0.87 -0.15 1.02 1.02 6.34 0
Hindustan Everest Tools 201406 1.61 10.94 0.03 10.54 0.00 0.44 0.34 0.15 -0.05 -0.05 -0.05 -0.31 0
Hindustan Organic Chemicals 201309 67.27 77.62 0.02 103.84 2.05 -24.16 7.75 4.71 -36.62 -36.62 -36.62 -5.45 0
Hindustan Organic Chemicals 201312 67.27 36.29 0.25 70.78 1.58 -32.66 8.77 4.91 -47.54 -47.54 -47.54 -7.08 0
Hindustan Organic Chemicals 201403 67.27 34.44 0.04 63.61 3.78 -25.35 18.93 3.34 -47.65 0.18 -47.83 -47.83 -7.12 0
Hindustan Organic Chemicals 201406 67.27 24.29 0.17 54.24 1.65 -28.13 9.89 2.68 -41.02 -41.02 -41.02 -6.11 0
Hipolin 201309 3.13 6.76 6.47 -0.11 0.18 0.13 0.07 -0.03 -0.03 -0.03 0
Hipolin 201312 3.13 7.13 7.37 0.33 0.10 0.11 0.07 -0.09 -0.09 -0.09 0
Hipolin 201403 3.13 7.16 7.36 0.26 0.06 0.11 0.08 -0.13 0.03 -0.16 -0.16 0
Hipolin 201406 3.13 6.87 7.02 0.25 0.10 0.09 0.08 -0.06 -0.06 -0.06 -0.19 0
Hiran Orgochem 201309 98.66 2.56 2.75 0.27 0.08 0.00 0.62 -0.55 -0.55 -0.55 -0.06 0
Hiran Orgochem 201312 98.66 0.09 0.29 0.27 0.06 0.00 0.62 -0.56 -0.56 -0.56 -0.06 0
Hiran Orgochem 201403 98.66 6.05 0.38 -5.67 0.18 0.27 -6.11 -6.11 -6.11 -0.62 0
Hiran Orgochem 201406 98.66 0.24 0.33 -0.10 0.00 -0.10 -0.10 -0.10 -0.01 0
Housing Development & Infrastructure 201309 419.00 414.45 19.02 166.55 10.43 277.35 183.38 20.08 73.89 31.21 42.68 42.70 1.02 0
Housing Development & Infrastructure 201312 419.00 76.47 2.74 -119.62 10.42 209.25 185.21 18.49 5.55 0.46 5.09 5.10 0.09 0
Housing Development & Infrastructure 201403 419.04 205.30 3.62 -9.40 50.35 268.67 169.36 19.92 79.39 -34.30 113.69 113.52 2.71 0
Housing Development & Infrastructure 201406 419.00 245.22 4.65 10.89 6.26 245.24 164.30 5.03 75.91 19.21 56.70 56.69 1.35 0

Co_Name Year Equity N.Sale O.O.I T. Exp O.I PBIDT Int. Dep. PBT T.Tax PAT A.PAT EPS Div (%)
Exp
ecte
d R
esu
lts
on
14
No
vem
ber
201
4
HS India 201309 16.24 4.59 0.07 3.53 0.07 1.19 0.25 0.38 0.57 0.17 0.40 0.40 0.25 0
HS India 201312 16.24 4.86 0.11 4.02 0.04 0.99 0.23 0.36 0.40 0.11 0.29 0.29 0.18 0
HS India 201403 16.24 5.07 0.07 4.09 0.08 1.14 0.41 0.22 0.51 -0.02 0.53 0.53 0.32 0
HS India 201406 16.24 4.88 0.11 3.79 0.07 1.27 0.55 0.34 0.37 0.10 0.27 0.27 0.17 0
Hubtown 201309 72.74 54.53 0.60 18.82 41.67 77.98 68.15 1.40 8.43 5.29 3.14 3.14 0.43 10
Hubtown 201312 72.74 89.78 0.77 44.88 36.07 81.74 70.81 1.38 9.55 -22.61 32.04 32.16 4.41 10
Hubtown 201403 72.74 94.68 37.43 60.54 28.58 100.15 107.62 -0.01 -7.46 2.79 -10.10 -10.38 -1.42 10
Hubtown 201406 72.74 120.52 0.93 44.91 8.33 84.87 80.02 1.16 3.69 1.54 1.02 2.15 0.14 10
IB Infotech Enterprises 201309 0.61 0.00 0.00 0.00 0.00 0.00 -0.05 0
IB Infotech Enterprises 201312 0.61 0.00 0.00 0.00 0.00 0.00 -0.02 0
IB Infotech Enterprises 201403 0.61 0.02 -0.02 -0.02 -0.02 -0.02 -0.29 0
IB Infotech Enterprises 201406 0.61 0.06 -0.06 -0.06 -0.06 -0.06 -1.04 0
ICDS 201309 13.03 1.74 0.42 0.33 1.65 0.12 0.02 1.52 0.02 1.50 1.50 1.15 0
ICDS 201312 13.03 1.14 1.14 0.20 0.21 0.13 0.02 0.06 0.06 0.06 0.05 0
ICDS 201403 13.03 1.70 1.59 0.34 0.44 0.13 0.02 0.30 0.05 0.25 0.20 0.15 0
ICDS 201406 13.03 1.27 1.35 0.40 0.32 0.13 0.02 0.17 0.01 0.16 0.17 0.13 0
ICVL Steels 201309 3.15 0.01 0.06 0.05 0.05 0.02 0.03 0.03 0.11 0
ICVL Steels 201312 3.15 0.01 0.06 0.05 0.05 0.02 0.03 0.03 0.01 0
ICVL Steels 201403 3.15 2.19 2.36 0.06 -0.12 0.02 -0.13 -0.13 -0.13 -0.04 0
ICVL Steels 201406 3.15 0.03 0.03 0.00 0.00 0.00 0.00 0.00 0
IDream Film Infrastructure Company 201309 0.15 0.01 -0.01 -0.01 -0.01 -0.01 -0.74 0
IDream Film Infrastructure Company 201312 1.50 0.01 -0.01 -0.01 -0.01 -0.01 -0.83 0
IDream Film Infrastructure Company 201403 0.15 0.01 -0.01 -2.55 -2.55 -2.55 -169.64 0
IDream Film Infrastructure Company 201406 0.15 0.02 -0.02 -0.02 -0.02 -0.02 -1.34 0
Impex Ferro Tech 201309 67.47 157.85 3.37 173.61 1.61 -10.78 8.34 2.96 -22.08 -7.69 -14.40 -14.40 -2.11 0
Impex Ferro Tech 201312 81.60 167.97 2.43 173.42 1.25 -1.77 8.81 2.97 -13.55 -3.81 -9.74 -9.74 -1.16 0
Impex Ferro Tech 201403 81.60 199.42 2.06 221.04 0.56 -19.00 9.80 2.90 -31.70 0.04 -31.74 -31.74 -3.89 0
Impex Ferro Tech 201406 81.60 123.58 1.79 131.48 0.50 -5.61 9.25 2.27 -17.13 5.80 -22.93 -22.93 -3.12 0
Inani Marbles & Industries 201309 3.25 16.75 0.06 13.57 0.01 3.24 0.97 2.28 0.84 1.44 1.44 4.42 10
Inani Marbles & Industries 201312 3.25 17.51 0.14 14.15 0.11 3.61 0.82 2.79 1.01 1.79 1.79 5.49 10
Inani Marbles & Industries 201403 3.25 20.37 0.23 18.94 0.42 2.08 0.55 1.53 0.59 0.94 0.94 2.88 10
Inani Marbles & Industries 201406 3.25 21.58 0.03 18.35 0.01 3.27 0.75 2.52 0.82 1.70 1.70 5.24 10
Ind Tra Deco 201309 26.19 0.03 0.03 0.00 0.01 -0.01 -0.01 -0.01 0
Ind Tra Deco 201312 26.19 0.02 0.02 0.00 0.01 -0.01 -0.01 -0.01 0
Ind Tra Deco 201403 26.19 0.02 0.02 0.01 0.01 0.00 0.00 0.00 0
Ind Tra Deco 201406 26.19 0.03 0.02 0.01 0.01 0.01 0.00 0.00 0.00 0

Co_Name Year Equity N.Sale O.O.I T. Exp O.I PBIDT Int. Dep. PBT T.Tax PAT A.PAT EPS Div (%)
Exp
ecte
d R
esu
lts
on
14
No
vem
ber
201
4
India E-Commerce 201309 3.01 0
India E-Commerce 201312 3.01 0
India E-Commerce 201403 3.01 0.00 0.00 0.00 -0.01 -0.01 -0.01 -0.02 0
India E-Commerce 201406 3.01 0.00 0.00 0.00 0.00 0.00 -0.01 0
India Infraspace 201309 10.00 0.01 -0.01 -0.01 -0.01 -0.01 0
India Infraspace 201312 10.00 3.73 3.73 0.00 0.00 0.00 0.00 0
India Infraspace 201403 10.00 0.01 0.01 -0.01 -0.01 -0.01 -0.01 0
India Infraspace 201406 10.00 0.08 0.05 0.03 0.03 0.03 0.03 0.03 0
India Steel Works 201309 39.81 137.60 5.91 143.92 -0.41 5.16 3.90 1.34 1.34 1.34 -0.24 0
India Steel Works 201312 39.81 216.45 0.06 211.92 4.59 1.15 3.33 -1.27 -1.27 -1.27 -0.03 0
India Steel Works 201403 39.81 147.73 0.83 140.86 7.70 1.35 3.73 -0.44 0.02 -0.46 -0.46 -0.01 0
India Steel Works 201406 39.81 116.69 2.68 111.20 8.17 3.91 3.78 0.49 0.49 0.49 0.01 0
Indiabulls Real Estate 201309 84.80 448.64 1.98 281.94 20.14 188.82 52.62 4.64 131.56 45.23 86.34 81.20 1.92 150
Indiabulls Real Estate 201312 84.80 448.27 1.40 337.75 12.89 124.82 66.06 4.95 53.82 23.55 30.27 28.36 0.67 150
Indiabulls Real Estate 201403 84.80 322.95 4.66 214.59 14.24 127.26 53.52 5.92 67.82 24.26 43.56 41.67 0.98 150
Indiabulls Real Estate 201406 84.98 608.27 1.78 466.47 13.43 157.01 73.40 6.23 77.38 23.04 54.35 38.86 0.92 150
Indian Extractions 201309 3.34 0.11 -0.11 0.00 0.01 -0.13 -0.13 -0.13 -0.38 0
Indian Extractions 201312 3.34 0.11 -0.11 0.00 0.01 -0.12 -0.12 -0.12 -0.37 0
Indian Extractions 201403 3.34 1.48 1.76 0.02 -0.26 0.00 0.01 -0.28 -0.28 -0.28 -0.83 0
Indian Extractions 201406 3.34 0.03 0.10 0.10 0.03 0.00 0.01 0.01 0.01 0.01 0.04 0
Indian Infotech & Software 201309 100.34 10.38 10.09 0.29 0.00 0.28 0.09 0.20 0.20 0
Indian Infotech & Software 201312 100.34 3.20 2.90 0.31 0.00 0.31 0.10 0.21 0.21 0
Indian Infotech & Software 201403 100.34 26.03 25.74 0.30 0.03 0.27 0.08 0.19 0.19 0
Indian Infotech & Software 201406 100.34 19.02 18.76 0.26 0.01 0.26 0.08 0.18 0.18 0
Indian Link Chain Manufacturers 201309 0.50 0.04 0.06 0.04 0.02 0.00 0.02 0.01 0.01 0.01 2.40 0
Indian Link Chain Manufacturers 201312 0.50 0.04 0.06 0.03 0.01 0.00 4.75 1.49 3.26 3.26 65.65 0
Indian Link Chain Manufacturers 201403 0.50 0.04 0.06 0.03 0.01 0.02 -0.01 0.00 -0.01 -0.01 -1.58 0
Indian Link Chain Manufacturers 201406 0.50 0.05 0.07 0.03 0.00 0.02 -0.02 -0.01 -0.01 -0.01 -2.10 0
Indianivesh 201309 3.78 0.08 -0.08 0.12 0.01 -0.21 -0.21 -0.21 -0.05 10
Indianivesh 201312 3.78 0.10 0.10 0.01 0.15 0.01 -0.15 -0.15 -0.15 -0.04 10
Indianivesh 201403 3.78 1.72 0.12 0.01 1.61 0.19 0.01 1.42 0.15 1.27 1.27 0.34 10
Indianivesh 201406 3.78 0.10 -0.10 0.07 0.01 -0.18 0.00 -0.17 -0.17 -0.05 10
Indo Borax & Chemicals 201309 3.48 14.87 11.80 0.86 3.93 0.02 0.17 3.74 1.23 2.51 2.51 7.19 15
Indo Borax & Chemicals 201312 3.48 14.18 11.49 0.88 3.57 0.01 0.20 3.36 1.06 2.30 2.30 6.60 15
Indo Borax & Chemicals 201403 3.48 17.71 14.43 0.90 4.17 0.02 0.20 3.95 1.49 2.47 2.47 7.09 15
Indo Borax & Chemicals 201406 3.48 18.39 13.92 1.00 5.47 0.01 0.19 5.27 1.70 3.58 3.58 11.14 15

Co_Name Year Equity N.Sale O.O.I T. Exp O.I PBIDT Int. Dep. PBT T.Tax PAT A.PAT EPS Div (%)
Exp
ecte
d R
esu
lts
on
14
No
vem
ber
201
4
Indokem 201309 24.50 10.03 0.07 9.20 0.01 0.91 0.62 0.13 0.16 0.16 0.16 0.07 0
Indokem 201312 24.50 8.15 0.06 8.52 0.04 -0.27 0.59 0.13 -0.99 -0.99 -0.99 -0.40 0
Indokem 201403 24.50 9.17 0.57 10.07 0.21 -0.12 0.70 0.22 -1.04 -1.04 -1.04 -0.42 0
Indokem 201406 24.50 13.38 0.10 12.70 0.01 0.79 0.66 0.15 -0.02 -0.02 -0.02 -0.01 0
Indosolar 201309 335.14 2.27 0.05 6.92 0.50 -4.11 20.86 7.61 -32.57 -32.57 -32.57 -0.97 0
Indosolar 201312 335.14 2.64 0.15 6.83 0.53 -3.51 20.20 7.61 -31.32 -31.32 -31.32 -0.93 0
Indosolar 201403 335.14 2.88 0.00 18.63 2.72 -13.03 20.55 7.44 -41.02 -41.02 -41.02 -1.22 0
Indosolar 201406 335.14 3.72 5.67 0.63 -1.32 21.71 8.23 -31.27 -31.27 -31.27 -0.93 0
Indsoya 201309 0.20 0.06 0.03 0.07 0.01 0.01 0.00 0.01 0.01 0.27 0
Indsoya 201312 0.20 2.12 0.07 2.11 0.08 0.04 0.04 0.01 0.03 0.03 1.55 0
Indsoya 201403 0.20 1.32 0.12 1.37 0.07 0.09 -0.01 -0.01 -0.01 -0.01 -0.38 0
Indsoya 201406 0.20 0.40 0.11 0.44 0.07 0.07 -0.01 -0.01 -0.01 -0.37 0
Indu Nissan Oxo Chemical Industries 201309 16.50 0.01 0.12 -0.11 0.03 -0.14 -0.14 -0.14 0
Indu Nissan Oxo Chemical Industries 201312 16.50 0.01 0.12 -0.11 0.03 -0.14 -0.14 -0.14 0
Indu Nissan Oxo Chemical Industries 201406 16.50 0.01 0.12 -0.11 0.03 -0.14 -0.14 -0.14 0
Inducto Steel 201309 4.02 120.89 123.93 3.96 0.92 0.76 0.02 0.14 0.02 0.13 0.13 0.31 0
Inducto Steel 201312 4.02 29.13 31.13 6.01 4.01 0.19 0.03 3.79 1.30 2.49 2.49 6.21 0
Inducto Steel 201403 4.02 106.75 109.89 6.31 3.16 2.70 0.04 0.42 0.10 0.32 0.32 0.80 0
Inducto Steel 201406 4.02 15.32 16.71 5.85 4.46 0.02 0.03 4.41 1.40 3.01 3.01 7.49 0
Infra Industries 201309 5.98 2.48 2.20 0.04 0.32 0.16 0.09 0.08 0.08 0.08 0.13 0
Infra Industries 201312 5.98 3.61 3.46 0.05 0.21 0.15 0.11 -0.05 -0.05 -0.05 -0.09 0
Infra Industries 201403 5.98 2.53 2.62 0.43 0.33 0.21 0.10 0.03 0.03 0.03 0.04 0
Infra Industries 201406 5.98 1.12 1.79 0.09 -0.58 0.14 0.11 -0.83 -0.83 -0.83 -1.38 0
Infronics Systems 201309 7.93 2.12 0.02 0.89 0.00 1.25 0.39 0.88 -0.02 0.00 -0.02 -0.02 -0.01 0
Infronics Systems 201312 7.93 1.09 0.02 0.33 0.77 0.37 0.88 -0.47 -0.15 -0.33 -0.33 -0.21 0
Infronics Systems 201403 7.93 3.78 0.16 3.25 0.69 0.36 0.89 -0.56 -0.03 -0.53 -0.53 -0.33 0
Infronics Systems 201406 7.93 1.38 0.02 0.46 0.94 0.45 0.74 -0.25 -0.02 -0.23 -0.23 -0.15 0
Innovative Tech Pack 201309 2.19 15.65 0.41 14.20 1.86 0.68 1.13 0.05 0.05 0.05 0.33 0
Innovative Tech Pack 201312 2.19 20.14 0.03 17.07 3.10 0.86 1.18 1.06 1.06 1.06 0.48 0
Innovative Tech Pack 201403 2.19 22.01 0.67 19.26 3.42 0.63 0.71 0.02 0.02 0.02 0.01 0
Innovative Tech Pack 201406 2.19 16.41 14.69 0.04 1.77 0.65 0.96 0.16 0.16 0.16 0.07 0
Innoventive Industries 201309 59.64 82.59 1.28 101.86 0.08 -17.91 20.16 9.87 -47.94 -47.94 -47.94 -8.04 10
Innoventive Industries 201312 59.64 77.31 -0.83 108.52 2.05 -30.00 33.42 9.78 -73.20 -73.20 -73.20 -12.27 10
Innoventive Industries 201403 59.64 70.15 5.55 326.89 2.19 -249.01 22.85 6.08 -277.93 -5.80 -272.13 -272.13 -45.63 10
Innoventive Industries 201406 59.64 76.39 0.37 86.78 13.27 3.24 23.40 21.63 -41.79 -41.79 -41.79 -7.01 10
Integra Switchgear 201312 3.03 0.00 0.02 0.00 -0.02 0.00 -0.02 0.00 -0.02 -0.02 -0.03 0
Integra Switchgear 201403 3.03 0.00 0.03 -0.03 -0.03 -0.03 -0.03 -0.10 0
Integra Switchgear 201406 3.03 0.01 0.03 -0.02 -0.02 -0.02 -0.02 -0.06 0

Co_Name Year Equity N.Sale O.O.I T. Exp O.I PBIDT Int. Dep. PBT T.Tax PAT A.PAT EPS Div (%)
Exp
ecte
d R
esu
lts
on
14
No
vem
ber
201
4
Integrated Financial Services 201309 6.00 0.22 0.00 0.07 0.15 0.00 0.14 0.02 0.12 0.12 0.20 5
Integrated Financial Services 201312 6.00 0.11 0.52 0.07 0.56 0.00 0.55 0.16 0.40 0.40 0.66 5
Integrated Financial Services 201403 6.00 0.76 0.04 0.08 0.73 0.00 0.73 0.05 0.68 0.68 1.13 5
Integrated Financial Services 201406 6.00 0.28 0.01 0.08 0.21 0.00 0.20 0.04 0.17 0.17 0.28 5
Integrated Thermoplastics 201309 6.29 4.19 4.27 -0.08 0.82 0.12 -1.02 -1.02 -1.02 -1.62 0
Integrated Thermoplastics 201312 6.29 15.19 12.96 2.23 0.96 0.12 1.15 1.15 1.15 1.83 0
Integrated Thermoplastics 201403 6.29 5.13 6.29 0.15 -1.02 0.89 0.12 -2.02 -2.02 -2.02 -3.22 0
Intellivate Capital Advisors 201309 3.11 0.05 0.04 0.00 0.02 0.00 0.02 0.01 0.01 0.01 0.03 0
Intellivate Capital Advisors 201312 3.11 0.03 0.03 0.00 0.00 0.00 0.00 0
Intellivate Capital Advisors 201403 3.11 0.05 0.03 0.03 0.02 0.01 0.00 0.01 0.01 0
Intellivate Capital Advisors 201406 3.11 0.05 0.03 0.03 0.03 0.01 0.02 0.02 0.01 0
Intellivate Capital Ventures 201309 2.91 0.03 0.01 0.02 0.02 0.01 0.01 0.01 0.01 0
Intellivate Capital Ventures 201312 2.91 0.04 0.03 0.01 0.01 0.00 0.01 0.01 0
Intellivate Capital Ventures 201403 2.91 0.01 0.02 -0.01 -0.01 -0.01 -0.01 0
Intellivate Capital Ventures 201406 2.91 0.04 0.02 0.02 0.02 0.01 0.01 0.01 0
Inter State Oil Carrier 201309 4.99 4.02 3.47 0.20 0.76 0.15 0.52 0.09 0.09 0.09 0.19 0
Inter State Oil Carrier 201312 4.99 4.09 3.38 -0.08 0.63 0.14 0.48 0.02 0.02 0.02 0.04 0
Inter State Oil Carrier 201403 4.99 4.27 3.78 0.16 0.64 0.13 0.45 0.06 -0.29 0.35 0.35 0.71 0
Inter State Oil Carrier 201406 4.99 4.60 4.08 0.26 0.79 0.09 0.45 0.25 0.25 0.25 0.49 0
International Conveyors 201309 6.75 38.83 0.08 32.55 0.33 6.69 1.49 1.53 3.67 1.11 2.56 2.56 0.38 25
International Conveyors 201312 6.75 36.79 0.66 31.99 0.71 6.17 0.93 1.54 3.70 1.12 2.58 2.58 0.38 25
International Conveyors 201403 6.75 25.95 0.14 22.70 0.73 4.12 1.11 1.55 1.46 0.88 0.58 0.58 0.09 25
International Conveyors 201406 6.75 20.92 0.04 19.74 1.39 2.61 1.03 1.16 0.42 0.15 0.27 0.27 0.04 25
International Housing Finance Corporation 201309 16.33 0.01 -0.01 -0.01 -0.01 -0.01 0
International Housing Finance Corporation 201312 16.33 0.01 -0.01 -0.01 -0.01 -0.01 0
International Housing Finance Corporation 201403 16.33 0.36 -0.36 -0.36 -0.36 -0.36 0
International Housing Finance Corporation 201406 16.33 0.02 -0.02 -0.02 -0.02 -0.02 -0.01 0
Interworld Digital 201309 17.84 4.16 3.55 0.04 0.64 0.02 0.39 0.24 0.19 0.05 0.05 0
Interworld Digital 201312 47.84 4.34 3.92 0.04 0.46 0.03 0.30 0.13 0.04 0.10 0.10 0
Interworld Digital 201403 47.84 4.37 3.78 0.02 0.61 0.03 0.41 0.17 0.03 0.14 0.14 0
Interworld Digital 201406 47.84 4.03 3.53 0.04 0.54 0.03 0.36 0.14 0.05 0.09 0.09 0
ISL Consulting 201309 12.00 2.20 0.11 4.18 -1.86 0.00 -1.86 0.00 -1.87 -1.87 -1.56 0
ISL Consulting 201312 12.00 57.16 0.11 56.24 1.02 0.00 1.02 1.02 1.02 0.85 0
ISL Consulting 201403 12.00 31.13 0.09 30.35 0.88 0.00 0.87 0.02 0.85 0.85 0.71 0
ISL Consulting 201406 12.00 4.72 0.09 3.90 0.91 0.00 0.91 0.91 0.91 0.76 0

Co_Name Year Equity N.Sale O.O.I T. Exp O.I PBIDT Int. Dep. PBT T.Tax PAT A.PAT EPS Div (%)
Exp
ecte
d R
esu
lts
on
14
No
vem
ber
201
4
ISMT 201309 73.25 410.41 15.36 393.24 4.65 37.18 44.87 25.86 -60.43 -21.64 -38.79 -38.79 -2.65 0
ISMT 201312 73.25 338.96 16.82 348.01 3.27 11.04 48.66 25.58 -89.27 -0.93 -88.34 -88.34 -6.03 0
ISMT 201403 73.25 379.69 14.99 389.61 3.17 8.24 50.33 25.80 -22.02 -22.02 -22.02 -1.50 0
ISMT 201406 73.25 373.93 12.97 369.94 2.86 19.82 52.22 16.36 -57.88 -57.88 -57.88 -3.95 0
IST 201309 5.85 4.26 4.06 1.00 1.20 0.00 0.41 0.78 0.09 0.69 0.69 1.18 0
IST 201312 5.85 5.24 4.90 0.97 1.32 0.01 0.41 0.90 0.08 0.82 0.82 1.40 0
IST 201403 5.85 6.08 5.33 1.34 2.09 0.01 0.42 1.67 0.32 1.34 1.34 2.30 0
IST 201406 5.85 5.14 4.94 1.22 1.42 0.01 0.51 0.90 0.24 0.66 0.66 1.12 0
ITL Industries 201309 3.25 10.55 9.62 0.05 0.98 0.66 0.25 0.07 0.02 0.05 0.05 0.15 5
ITL Industries 201312 3.25 8.72 7.51 0.00 1.21 0.67 0.16 0.38 0.15 0.23 0.23 0.71 5
ITL Industries 201403 3.25 15.35 14.03 0.21 1.53 0.40 0.32 0.82 0.28 0.54 0.54 1.65 5
ITL Industries 201406 3.25 9.49 8.07 0.01 1.44 0.73 0.22 0.49 0.15 0.34 0.34 1.05 5
Ivee Injectaa 201309 3.76 0.00 0.00 0.00 0.00 0.00 0
Ivee Injectaa 201312 3.76 0.00 0.00 0.00 0.00 0.00 -0.01 0
Ivee Injectaa 201403 3.76 0.03 -0.03 -0.03 -0.03 -0.03 -0.08 0
Ivee Injectaa 201406 3.76 0.01 -0.01 -0.01 -0.01 -0.01 -0.04 0
Jagatjit Industries 201309 46.15 229.88 3.93 230.21 0.28 3.88 6.94 4.55 -7.61 -7.61 -7.61 -1.74 0
Jagatjit Industries 201312 46.15 236.06 8.12 246.43 0.30 -1.95 7.15 4.55 -13.65 -13.65 -13.65 -3.13 0
Jagatjit Industries 201403 46.15 215.53 5.44 226.74 0.47 -5.30 7.55 4.55 -17.40 2.57 -19.97 -19.97 -4.58 0
Jagatjit Industries 201406 46.15 234.27 7.44 229.00 0.34 13.05 7.58 4.52 0.95 0.95 0.95 0.22 0
Jagjanani Textiles 201309 15.60 1.11 2.70 -1.58 1.45 0.85 -3.89 -3.89 -3.89 -2.49 0
Jagjanani Textiles 201312 15.60 0.51 14.15 0.77 1.06 14.94 0.85 14.09 14.09 14.09 9.03 0
Jagjanani Textiles 201403 15.60 5.46 4.76 -6.25 -5.54 0.61 0.85 -7.00 -7.00 -7.00 -4.50 0
Jagjanani Textiles 201406 15.60 2.00 1.86 0.00 0.14 0.47 0.85 -1.18 0.00 -1.18 -1.18 -0.80 0
Jagsonpal Pharmaceuticals 201309 13.10 36.79 34.87 1.92 1.12 0.71 0.10 0.09 0.01 0.01 10
Jagsonpal Pharmaceuticals 201312 13.10 37.70 34.71 3.00 1.08 0.74 1.17 0.29 0.89 0.89 0.34 10
Jagsonpal Pharmaceuticals 201403 13.10 31.28 27.57 0.06 3.77 1.83 0.69 1.25 0.03 1.22 1.22 0.47 10
Jagsonpal Pharmaceuticals 201406 13.10 33.91 31.02 0.03 2.93 1.21 0.71 1.01 0.30 0.71 0.71 0.27 10
Jaipan Industries 201309 6.10 10.81 10.42 0.39 0.18 0.11 0.10 0.10 0.10 0.17 0
Jaipan Industries 201312 6.10 8.77 8.42 0.36 0.21 0.11 0.05 0.05 0.05 0.07 0
Jaipan Industries 201403 6.10 10.52 0.00 10.18 0.09 0.44 0.20 0.19 0.04 0.00 0.04 0.04 0.07 0
Jaipan Industries 201406 6.10 10.69 10.37 0.32 0.12 0.10 0.10 0.10 0.10 0.16 0
Jattashankar Industries 201309 4.39 7.05 6.53 0.02 0.54 0.03 0.51 0.51 0.51 1.16 0
Jattashankar Industries 201312 4.39 5.96 4.95 0.05 1.06 0.04 1.03 1.03 1.03 2.34 0
Jattashankar Industries 201403 4.39 6.91 6.49 0.03 0.44 0.01 0.03 0.40 0.40 0.40 0.92 0
Jattashankar Industries 201406 4.39 7.68 6.83 0.00 0.86 0.05 0.81 0.81 0.81 1.84 0

Co_Name Year Equity N.Sale O.O.I T. Exp O.I PBIDT Int. Dep. PBT T.Tax PAT A.PAT EPS Div (%)
Exp
ecte
d R
esu
lts
on
14
No
vem
ber
201
4
Jauss Polymers 201309 4.63 3.01 2.67 0.34 0.13 0.21 0.00 0.00 0.00 0
Jauss Polymers 201312 4.63 3.62 3.18 0.43 0.03 0.22 0.93 0.93 0.93 2.01 0
Jauss Polymers 201403 4.63 5.79 0.00 4.55 0.00 1.24 0.19 0.26 0.79 0.40 0.40 0.40 0.86 0
Jauss Polymers 201406 4.63 3.75 3.11 0.64 0.07 0.25 1.57 0.33 1.24 1.24 2.69 0
Jaybharat Textiles & Real Estate 201309 76.57 132.03 113.98 18.05 7.23 10.08 0.74 0.74 0.74 0.02 0
Jaybharat Textiles & Real Estate 201312 76.57 120.92 103.60 17.31 6.47 9.90 0.95 0.95 0.95 0.02 0
Jaybharat Textiles & Real Estate 201403 76.57 165.62 159.07 6.56 0.10 3.66 2.80 -1.30 4.10 4.10 0.07 0
Jaybharat Textiles & Real Estate 201406 76.57 145.15 132.65 12.50 6.45 7.26 -1.21 -1.21 -1.21 -0.03 0
JBF Industries 201309 65.29 2242.83 1.55 2123.02 17.41 138.77 82.05 58.66 -1.94 1.95 -3.89 -3.89 -0.66 20
JBF Industries 201312 65.31 2132.01 1.55 1983.87 36.78 186.47 78.73 64.53 6.50 3.03 3.47 3.47 0.40 20
JBF Industries 201403 65.32 2091.66 3.09 1897.01 10.18 207.92 93.53 67.82 46.57 18.15 47.19 47.19 7.10 20
JBF Industries 201406 65.44 2085.98 3.01 1886.93 5.31 207.37 93.51 64.90 48.96 21.07 27.89 27.89 4.14 20
JCT 201309 110.21 229.60 10.42 230.13 10.81 20.70 1.55 14.14 4.78 0.00 4.78 4.78 0.09 0
JCT 201312 110.21 213.41 10.03 209.20 2.99 17.23 8.09 8.44 0.61 0.61 0.61 0.01 0
JCT 201403 89.77 237.24 11.58 231.24 1.83 19.41 8.97 8.13 2.73 2.73 2.73 0.05 0
JCT 201406 139.20 218.47 9.16 212.62 1.45 16.46 7.54 6.80 2.04 2.04 2.04 0.04 0
JD Orgochem 201309 1.33 0.33 0.04 -0.29 0.70 -6.68 -6.68 -6.68 -5.04 0
JD Orgochem 201312 1.33 0.07 0.48 0.41 0.01 0.69 -0.29 -0.29 -0.29 -0.22 0
JD Orgochem 201403 1.33 2.15 0.36 -1.79 0.06 -1.27 1.91 1.91 1.91 1.44 0
JD Orgochem 201406 1.33 0.15 0.05 -0.10 0.18 -0.28 -0.28 -0.28 -0.21 0
Jindal Cotex 201309 45.00 86.99 1.05 84.27 3.77 9.19 4.31 -9.73 0.03 -9.76 -12.11 -2.69 0
Jindal Cotex 201312 45.00 85.71 0.04 85.99 -0.24 13.27 4.29 -17.80 -17.80 -10.50 -2.33 0
Jindal Cotex 201403 45.00 91.41 0.95 87.16 5.19 14.89 -0.73 -8.97 -0.03 -8.94 -7.97 -1.77 0
Jindal Cotex 201406 45.00 65.19 0.28 64.54 0.93 11.16 3.17 -13.40 -13.40 -11.36 -2.98 0
Jindal Photo 201309 10.26 85.42 99.04 0.62 -13.00 1.23 0.46 -14.69 -2.30 -12.39 -12.39 -12.08 0
Jindal Photo 201312 10.26 78.52 84.59 0.43 -5.64 1.52 0.47 -7.63 -7.63 -7.63 -7.44 0
Jindal Photo 201403 10.26 83.17 85.47 0.84 -1.46 1.29 0.43 -3.18 -6.89 3.71 3.71 3.62 0
Jindal Photo 201406 10.26 77.88 77.53 0.95 1.30 0.40 0.61 0.29 0.29 0.29 0.28 0
Jindal Poly Films 201309 42.05 706.64 4.04 626.44 0.20 84.44 11.82 23.59 36.16 13.47 22.32 22.68 5.31 10
Jindal Poly Films 201312 42.05 588.09 2.00 549.69 1.22 41.62 11.49 23.60 10.14 4.33 5.42 5.81 1.29 10
Jindal Poly Films 201403 42.05 675.48 0.70 592.13 24.60 108.65 7.64 23.52 84.18 31.76 51.77 52.42 12.31 10
Jindal Poly Films 201406 42.05 666.70 0.53 593.80 9.54 82.96 8.88 23.60 50.23 10.76 39.04 39.47 9.28 10
Jindal Poly Investment and Finance Company 201309 10.51 1.91 0.08 1.83 1.83 0.38 1.46 1.46 1.38 0
Jindal Poly Investment and Finance Company 201312 10.51 1.66 0.08 1.58 1.58 1.58 1.58 1.50 0
Jindal Poly Investment and Finance Company 201403 10.51 2.37 0.17 2.20 2.20 0.01 2.19 2.19 2.08 0
Jindal Poly Investment and Finance Company 201406 10.51 0.15 0.13 0.02 0.02 -0.40 0.42 0.42 0.40 0

Co_Name Year Equity N.Sale O.O.I T. Exp O.I PBIDT Int. Dep. PBT T.Tax PAT A.PAT EPS Div (%)
Exp
ecte
d R
esu
lts
on
14
No
vem
ber
201
4
Jindal Worldwide 201309 20.05 195.95 0.07 175.46 0.50 21.05 7.29 5.22 8.55 1.68 6.86 6.86 3.42 5
Jindal Worldwide 201312 20.05 170.56 0.59 150.27 0.58 21.47 7.06 5.47 8.94 1.75 7.19 7.19 3.59 5
Jindal Worldwide 201403 20.05 227.22 0.02 221.22 7.16 13.17 2.68 3.08 7.41 1.96 5.45 5.45 2.72 5
Jindal Worldwide 201406 20.05 216.83 0.28 192.99 0.47 24.59 8.34 7.85 8.41 1.76 6.65 6.65 3.31 5
JJ Exporters 201309 9.26 8.88 10.14 0.31 -0.94 2.54 0.96 -4.44 -4.22 -4.44 -4.55 0
JJ Exporters 201312 9.26 10.40 10.76 0.03 -0.33 1.40 0.96 -2.74 -2.74 -2.74 -2.96 0
JJ Exporters 201403 9.26 5.04 12.61 2.76 -4.81 1.77 0.80 -10.13 -10.13 -10.13 -10.94 0
JJ Exporters 201406 9.26 5.32 5.60 0.33 0.05 2.53 1.07 -3.55 -3.55 -3.55 -3.83 0
JK Tyre & Industries 201309 41.06 1799.01 7.55 1596.36 4.72 214.92 63.89 44.53 89.59 25.59 64.00 65.78 16.02 50
JK Tyre & Industries 201312 41.06 1703.42 18.12 1535.85 3.76 189.45 68.99 43.14 84.71 27.23 57.48 59.03 14.38 50
JK Tyre & Industries 201403 41.06 1895.62 16.74 1720.34 6.59 198.61 71.66 42.82 70.17 26.56 43.61 44.96 10.95 50
JK Tyre & Industries 201406 41.06 1853.92 10.24 1671.84 3.59 195.91 69.69 39.28 83.37 29.27 54.10 55.44 13.50 50
JMT Auto 201309 14.40 59.53 0.32 51.59 0.67 8.93 4.19 4.65 0.09 -0.59 0.67 0.67 0.46 0
JMT Auto 201312 14.40 56.28 0.28 47.77 0.01 8.80 4.17 4.59 0.03 0.03 0.00 0.00 0.00 0
JMT Auto 201403 14.40 101.89 0.01 89.36 6.18 18.72 8.39 4.51 5.82 -0.47 6.29 6.29 4.37 0
JMT Auto 201406 14.40 121.26 0.33 106.87 0.75 15.46 4.31 5.70 5.46 1.86 3.59 3.59 2.50 0
Joindre Capital Services 201309 13.84 2.86 0.45 3.39 0.93 0.84 0.12 0.06 0.67 0.20 0.47 0.47 0.34 0
Joindre Capital Services 201312 13.84 3.09 0.43 3.60 0.87 0.79 0.13 0.05 0.61 0.20 0.41 0.41 0.30 0
Joindre Capital Services 201403 13.84 2.98 0.46 3.38 1.02 1.09 0.11 0.08 0.90 0.28 0.62 0.62 0.45 0
Joindre Capital Services 201406 13.84 5.62 0.41 5.63 1.02 1.42 0.12 0.06 1.24 0.39 0.85 0.85 0.62 0
Jolly Plastic Industries 201309 6.68 1.33 0.01 1.33 0.00 0.00 0.00 0.00 0.00 0
Jolly Plastic Industries 201312 6.68 0.02 0.01 0.02 0.00 0.00 0.00 0.00 0
Jolly Plastic Industries 201403 6.68 2.18 2.17 0.01 0.02 0.02 0.00 0.02 0.02 0.03 0
Jolly Plastic Industries 201406 6.68 0.21 0.23 0.03 0.01 0.01 0.01 0.01 0
JRI Industries & Infrastructure 201309 5.31 1.03 1.03 0.01 0.00 0.01 0.00 0.01 0.01 0
JRI Industries & Infrastructure 201312 5.31 1.01 1.01 0.01 0.00 0.01 0.00 0.00 0.00 0
JRI Industries & Infrastructure 201403 5.31 1.05 0.73 0.32 0.00 0.32 0.10 0.22 0.22 0.08 0
JRI Industries & Infrastructure 201406 5.31 1.02 1.02 0.01 0.00 0.01 0.00 0.00 0.00 0
Jyothi Infraventures 201309 5.16 0.03 -0.03 0.00 -0.04 -0.04 -0.04 -0.07 0
Jyothi Infraventures 201312 5.16 0.04 -0.04 0.00 -0.05 -0.05 -0.05 -0.09 0
Jyothi Infraventures 201403 5.16 0.04 -0.04 0.00 -0.04 -0.04 -0.04 -0.08 0
Jyothi Infraventures 201406 1.55 0.05 -0.05 0.00 -0.05 -0.05 -0.05 -0.31 0
Kailash Auto Finance 201309 58.71 0.20 0.11 0.09 0.09 0.09 0.09 0
Kailash Auto Finance 201312 58.71 12.41 0.20 12.29 0.31 0.31 0.31 0.31 0.01 0
Kailash Auto Finance 201403 58.71 7.64 -0.19 6.50 0.00 0.95 0.05 0.90 0.00 0.90 0.90 0.02 0
Kailash Auto Finance 201406 58.71 17.62 15.88 0.01 1.75 0.03 1.72 1.72 1.72 0.03 0

Co_Name Year Equity N.Sale O.O.I T. Exp O.I PBIDT Int. Dep. PBT T.Tax PAT A.PAT EPS Div (%)
Exp
ecte
d R
esu
lts
on
14
No
vem
ber
201
4
Kajal Synthetics & Silk Mills 201309 1.99 0.32 0.01 0.31 0.31 0.11 0.20 0.20 1.01 0
Kajal Synthetics & Silk Mills 201312 1.99 0.31 0.01 0.00 0.31 0.31 0.10 0.21 0.21 1.04 0
Kajal Synthetics & Silk Mills 201403 1.99 0.31 0.02 0.00 0.29 0.29 0.10 0.20 0.20 1.00 0
Kajal Synthetics & Silk Mills 201406 1.99 0.10 0.02 0.02 0.10 0.10 0.03 0.07 0.07 0.34 0
Kalpena Industries 201309 18.82 288.21 6.13 272.16 22.18 8.94 4.09 9.16 1.80 7.37 7.37 3.92 12
Kalpena Industries 201312 18.82 311.15 0.61 288.81 22.96 11.34 4.11 7.51 1.50 6.01 6.01 3.19 12
Kalpena Industries 201403 18.82 371.36 5.58 361.14 15.80 5.10 3.29 7.41 4.47 2.94 2.94 1.56 12
Kalpena Industries 201406 18.82 412.82 2.67 389.18 26.32 11.44 4.87 10.01 2.50 7.51 7.51 3.99 12
Kanishk Steel Industries 201309 28.47 71.53 70.04 0.22 1.70 0.67 0.59 0.44 0.16 0.28 0.28 0.10 0
Kanishk Steel Industries 201312 28.47 59.07 57.02 0.04 2.09 1.20 0.71 0.17 0.12 0.06 0.06 0.02 0
Kanishk Steel Industries 201403 28.47 98.16 104.83 10.25 3.58 2.41 0.52 0.64 0.13 0.52 0.52 0.18 0
Kanishk Steel Industries 201406 28.47 65.21 62.89 0.12 2.45 0.93 1.03 0.48 0.16 0.32 0.32 0.11 0
Karuturi Global 201309 80.97 94.86 69.71 2.57 27.72 28.24 7.62 12.25 12.25 12.25 0.15 0
Karuturi Global 201312 80.97 147.31 104.71 11.76 54.35 20.35 7.96 26.04 -6.78 8.05 7.85 0.10 0
Karuturi Global 201403 80.97 4.56 0.81 22.93 26.67 6.91 0.13 19.63 0.94 6.26 18.69 0.08 0
Karuturi Global 201406 80.97 54.27 39.21 5.03 20.09 9.95 6.68 3.47 -1.06 4.56 4.56 0.06 0
Kay Power and Paper 201309 10.64 6.99 0.04 6.90 0.00 0.12 0.11 0.01 0.01 0.01 0
Kay Power and Paper 201312 10.64 7.97 0.02 7.86 0.01 0.14 0.11 0.03 0.03 0.03 0.03 0
Kay Power and Paper 201403 10.64 6.77 0.01 6.67 0.00 0.12 0.10 0.02 0.02 0.02 0.02 0
Kay Power and Paper 201406 10.64 7.65 0.02 7.52 0.00 0.14 0.11 0.04 0.04 0.04 0.03 0
Kaycee Industries 201309 0.64 6.28 0.11 6.13 0.08 0.33 0.06 0.09 0.18 0.09 0.09 0.09 13.90 10
Kaycee Industries 201312 0.64 6.44 0.01 6.32 0.11 0.25 0.05 0.09 0.10 0.02 0.08 0.08 12.32 10
Kaycee Industries 201403 0.64 6.62 0.13 6.48 0.10 0.37 0.11 0.10 0.16 0.02 0.14 0.14 22.17 10
Kaycee Industries 201406 0.64 5.26 0.01 5.15 0.08 0.20 0.10 0.08 0.03 0.01 0.02 0.02 3.01 10
KBS India 201309 8.52 0.18 -0.04 1.01 0.19 -0.68 0.04 0.01 -0.72 -0.05 -0.72 -0.06 0
KBS India 201312 8.52 0.23 -0.01 0.26 0.20 0.16 0.02 0.01 0.12 -0.04 0.12 -0.05 0
KBS India 201403 8.52 0.14 -0.02 0.27 0.25 0.10 0.02 0.01 0.06 -0.22 0.06 -0.26 0
KBS India 201406 8.52 0.14 0.00 0.20 0.22 0.16 0.03 0.02 0.11 0.03 0.08 0.08 0.09 0
Kellton Tech Solutions 201309 17.75 25.22 0.00 22.94 0.12 2.41 0.64 0.45 1.32 0.19 1.13 1.13 0.32 0
Kellton Tech Solutions 201312 17.75 26.42 23.97 0.09 2.55 0.70 0.54 1.30 0.08 1.22 1.22 0.34 0
Kellton Tech Solutions 201403 17.75 40.13 0.10 37.07 0.06 3.21 0.61 0.67 1.93 0.45 1.49 1.49 0.42 0
Kellton Tech Solutions 201406 20.69 41.78 0.03 36.58 -0.10 5.12 1.39 0.67 3.06 0.53 2.52 2.52 0.71 0
Kerala Ayurveda 201309 10.56 6.31 0.11 6.03 0.40 0.20 0.16 0.04 0.25 0.04 0.24 0
Kerala Ayurveda 201312 10.56 6.58 0.07 5.90 0.00 0.76 0.34 0.17 0.25 0.25 0.25 0.24 0
Kerala Ayurveda 201403 10.56 6.71 0.15 5.62 0.00 1.24 0.30 0.10 0.84 0.46 0.38 0.38 0.36 0
Kerala Ayurveda 201406 10.56 6.54 5.82 0.00 0.72 0.28 0.16 0.28 0.28 0.28 0.27 0

Co_Name Year Equity N.Sale O.O.I T. Exp O.I PBIDT Int. Dep. PBT T.Tax PAT A.PAT EPS Div (%)
Exp
ecte
d R
esu
lts
on
14
No
vem
ber
201
4
Kernex Microsystems (India) 201309 12.50 9.47 8.60 0.55 1.42 0.79 1.02 -0.39 -0.01 -0.38 -0.38 -0.30 0
Kernex Microsystems (India) 201312 12.50 9.15 8.55 0.84 1.43 0.77 1.02 -0.36 -0.36 -0.36 -0.28 0
Kernex Microsystems (India) 201403 12.50 8.14 7.60 0.19 0.72 0.69 0.99 -0.96 -0.40 -0.56 -0.56 -0.44 0
Kernex Microsystems (India) 201406 12.50 4.61 4.47 0.32 0.45 0.96 0.88 -1.39 -1.39 -1.39 -1.11 0
Kesar Enterprises 201309 8.62 57.78 0.29 74.24 0.40 -15.78 11.24 4.42 -31.44 -31.44 -31.44 -36.47 0
Kesar Enterprises 201312 8.62 69.31 0.29 89.22 1.59 -18.03 9.95 4.38 -32.37 -32.37 -32.37 -37.55 0
Kesar Enterprises 201403 8.62 114.91 0.41 97.98 0.19 17.53 8.18 4.29 5.06 5.06 5.06 5.86 0
Kesar Enterprises 201406 10.00 78.20 0.22 84.45 0.38 -5.65 9.80 3.56 -19.01 -19.01 -19.01 -20.14 0
Kesoram Industries 201309 109.77 1223.58 3.56 1150.32 20.27 97.09 144.79 81.07 -128.77 -128.77 -128.77 -11.73 0
Kesoram Industries 201312 109.77 1239.04 5.83 1134.15 21.00 131.72 139.81 80.19 -88.28 -88.28 -88.28 -8.04 0
Kesoram Industries 201403 109.77 1323.62 6.02 1309.14 50.03 70.53 153.90 79.98 -163.35 35.25 -198.60 -198.60 -18.09 0
Kesoram Industries 201406 109.77 1262.60 4.09 1229.84 20.94 57.79 179.72 79.99 -201.92 -201.92 -201.92 -18.40 0
KG Petrochem 201309 5.82 35.16 3.10 31.45 0.32 7.12 1.32 1.82 3.99 1.23 2.76 2.76 5.29 0
KG Petrochem 201312 5.82 33.77 2.94 30.95 0.52 6.28 1.44 1.81 3.03 0.97 2.06 2.06 3.95 0
KG Petrochem 201403 5.82 38.66 3.81 39.56 0.74 3.65 1.66 1.83 0.16 0.04 0.12 0.12 0.22 0
KG Petrochem 201406 5.82 32.55 3.02 32.30 0.52 3.79 1.80 1.96 0.03 -0.06 0.09 0.09 0.18 0
KGN Industries 201309 22.25 0.18 0.03 0.14 0.00 0.14 0.04 0.10 0.10 0.01 0
KGN Industries 201312 22.25 4.44 4.34 0.10 0.00 0.10 0.03 0.07 0.07 0
KGN Industries 201403 22.25 0.60 0.90 -0.30 0.07 -0.37 -0.08 -0.29 -0.29 -0.01 0
KGN Industries 201406 22.25 0.34 0.02 0.32 0.04 0.02 0.02 0.01 0.02 0.02 0.00 0
Khaitan Electricals 201309 11.50 104.99 0.56 99.16 4.05 10.45 9.47 0.50 0.47 -0.15 0.62 0.62 0.54 0
Khaitan Electricals 201312 11.50 123.87 0.50 117.39 0.91 7.89 12.26 0.52 -4.90 0.14 -5.04 -5.04 -4.38 0
Khaitan Electricals 201403 11.50 164.29 0.64 171.31 4.26 -2.12 11.06 0.37 -13.55 -0.69 -12.85 -12.85 -11.18 0
Khaitan Electricals 201406 11.50 123.32 0.94 122.60 2.69 4.35 11.55 0.60 -7.80 0.09 -7.89 -7.89 -6.86 0
Khandwala Securities 201309 11.94 0.89 0.95 0.22 0.16 0.11 0.08 -0.04 0.00 -0.03 -0.03 -0.03 0
Khandwala Securities 201312 11.94 0.87 0.98 0.16 0.04 0.13 0.08 -0.17 -0.01 -0.16 -0.16 -0.14 0
Khandwala Securities 201403 11.94 0.91 0.95 0.21 0.18 0.17 0.05 -0.04 0.00 -0.05 -0.05 -0.04 0
Khandwala Securities 201406 11.94 1.55 0.94 0.16 0.77 0.17 0.07 0.53 0.00 0.53 0.53 0.44 0
Khator Fibre & Fabrics 201309 4.21 9.16 8.05 0.01 1.12 0.34 0.34 0.43 0.43 0.43 0
Khator Fibre & Fabrics 201312 4.21 10.40 9.40 0.01 1.01 0.42 0.35 0.24 0.24 0.24 0
Khator Fibre & Fabrics 201403 4.21 16.43 15.52 0.05 0.96 0.17 0.35 0.44 0.44 0.44 0
Khator Fibre & Fabrics 201406 4.21 11.56 10.36 0.01 1.22 0.41 0.42 0.39 0.39 0.39 0
KIC Metaliks 201309 7.10 113.29 113.68 5.05 4.66 1.95 2.54 0.17 0.03 0.13 0.13 0.19 0
KIC Metaliks 201312 7.10 36.33 40.02 4.35 0.65 2.72 2.01 -7.22 -0.35 -6.87 -6.87 -9.67 0
KIC Metaliks 201403 7.10 225.38 220.78 2.54 7.14 3.43 2.58 1.14 0.02 1.12 1.12 1.58 0
KIC Metaliks 201406 7.10 100.79 98.54 4.06 6.31 2.57 2.16 1.58 0.32 1.26 1.26 1.78 0

Co_Name Year Equity N.Sale O.O.I T. Exp O.I PBIDT Int. Dep. PBT T.Tax PAT A.PAT EPS Div (%)
Exp
ecte
d R
esu
lts
on
14
No
vem
ber
201
4
Kilburn Engineering 201309 13.26 22.14 2.70 22.49 0.53 2.88 1.64 0.84 0.40 0.08 0.32 0.32 0.24 0
Kilburn Engineering 201312 13.26 23.19 0.20 21.38 0.84 2.85 1.18 0.84 0.83 0.15 0.68 0.67 0.51 0
Kilburn Engineering 201403 13.26 47.40 0.25 44.77 0.83 3.71 0.95 0.83 1.93 0.62 1.31 1.31 0.99 0
Kilburn Engineering 201406 13.26 14.90 0.29 13.86 1.54 2.87 1.32 1.05 0.50 0.15 0.35 0.35 0.26 0
Kiran Print-Pack 201309 5.00 0.04 0.07 0.01 -0.03 0.03 -0.06 -0.06 -0.06 -0.12 0
Kiran Print-Pack 201312 5.00 0.03 0.08 0.01 -0.04 0.03 -0.08 -0.08 -0.08 -0.15 0
Kiran Print-Pack 201403 5.00 0.07 0.10 0.01 -0.02 0.03 -0.05 -0.66 0.61 0.61 1.22 0
Kiran Print-Pack 201406 5.00 0.07 0.08 0.01 0.00 0.01 -0.01 -0.01 -0.01 -0.02 0
K-Lifestyle Industries 201309 101.78 127.95 124.62 3.33 9.76 16.14 -22.57 -22.57 -22.57 -0.22 0
K-Lifestyle Industries 201312 101.78 130.46 154.90 -24.44 8.72 16.14 -49.29 -49.29 -49.29 -0.48 0
K-Lifestyle Industries 201403 101.78 320.13 449.03 0.01 -128.88 8.75 13.51 -151.14 -9.88 -141.26 -141.26 -1.48 0
K-Lifestyle Industries 201406 101.78 324.15 363.59 -39.44 8.70 15.93 -64.08 -64.08 -64.08 -0.63 0
KM Sugar Mills 201309 18.40 64.83 65.83 1.09 0.09 2.25 2.28 -4.44 0.19 -4.63 -4.63 -0.50 0
KM Sugar Mills 201312 18.40 73.64 80.59 1.56 -5.39 2.28 2.12 -9.79 -9.79 -9.79 -1.06 0
KM Sugar Mills 201403 18.40 113.59 89.87 1.02 24.74 2.66 2.53 19.55 0.52 19.03 19.03 2.07 0
KM Sugar Mills 201406 18.40 127.25 113.45 0.49 14.29 3.51 2.29 8.49 0.46 8.03 8.03 0.87 0
KMF Builders & Developers 201309 6.09 1.76 1.57 0.01 0.20 0.02 0.04 0.14 0.05 0.10 0.10 0.08 0
KMF Builders & Developers 201312 6.09 1.74 1.52 0.06 0.29 0.02 0.02 0.25 0.07 0.18 0.18 0.14 0
KMF Builders & Developers 201403 6.09 1.23 1.16 0.02 0.09 0.01 0.02 0.06 0.03 0.03 0.03 0.02 0
KMF Builders & Developers 201406 6.09 0.91 0.72 0.01 0.20 0.01 0.10 0.09 0.03 0.06 0.06 0.09 0
KNR Construction 201309 28.12 157.00 0.84 132.29 1.24 26.80 4.43 14.44 7.93 -0.48 8.41 8.41 2.99 10
KNR Construction 201312 28.12 207.78 1.09 174.53 1.88 36.21 3.09 14.38 18.75 5.28 13.46 13.46 4.79 10
KNR Construction 201403 28.12 265.56 -5.12 223.21 10.62 47.85 5.92 14.10 27.83 -0.18 28.01 28.01 9.96 10
KNR Construction 201406 28.12 236.44 0.04 205.43 2.85 33.91 2.97 15.36 15.57 -4.22 19.80 19.80 7.04 10
Konark Synthetic 201309 5.81 25.67 0.00 23.98 0.06 1.76 0.92 0.68 0.16 0.16 0.16 0.28 0
Konark Synthetic 201312 5.81 22.44 0.01 21.31 0.01 1.14 0.02 0.68 0.44 0.44 0.44 0.75 0
Konark Synthetic 201403 5.81 30.71 0.09 29.37 1.45 2.89 1.79 0.68 0.42 0.34 0.08 0.08 0.13 0
Konark Synthetic 201406 5.81 26.26 0.01 24.28 0.31 2.29 0.89 1.03 0.38 0.38 0.38 0.65 0
Kothari Fermentation & Biochem 201309 15.00 11.59 11.45 0.04 0.18 0.32 0.48 -0.61 -0.19 -0.43 -0.43 -0.28 0
Kothari Fermentation & Biochem 201312 15.00 13.35 12.88 0.01 0.48 0.32 0.48 -0.32 -0.10 -0.22 -0.22 -0.15 0
Kothari Fermentation & Biochem 201403 15.00 16.13 13.94 0.10 2.27 0.31 0.47 1.49 0.46 1.03 1.03 0.69 0
Kothari Fermentation & Biochem 201406 15.00 13.18 12.64 0.01 0.55 0.49 0.48 -0.42 -0.15 -0.27 -0.27 -0.18 0
Kridhan Infra 201309 11.72 162.69 145.70 2.07 19.06 2.07 4.69 9.53 2.21 7.31 6.38 5.44 0
Kridhan Infra 201312 11.72 172.57 155.58 2.09 19.08 2.36 4.91 11.81 2.40 9.40 8.38 7.15 0
Kridhan Infra 201403 12.32 204.09 0.00 182.49 -7.51 14.09 -4.60 7.53 13.93 -1.38 15.32 13.58 0
Kridhan Infra 201406 12.32 161.69 150.94 1.10 11.85 2.72 3.51 5.61 0.95 4.66 4.11 3.34 0

Co_Name Year Equity N.Sale O.O.I T. Exp O.I PBIDT Int. Dep. PBT T.Tax PAT A.PAT EPS Div (%)
Exp
ecte
d R
esu
lts
on
14
No
vem
ber
201
4
Kriti Industries (India) 201309 4.96 59.13 0.07 53.08 0.23 6.35 3.03 1.11 2.21 0.72 1.49 1.49 0.30 15
Kriti Industries (India) 201312 4.96 103.33 0.02 98.16 0.31 5.49 3.46 1.11 0.92 0.30 0.62 0.62 0.12 15
Kriti Industries (India) 201403 4.96 82.13 0.02 75.36 0.12 6.92 4.20 1.12 1.59 0.75 0.85 0.85 0.17 15
Kriti Industries (India) 201406 4.96 119.18 0.04 111.25 0.32 8.29 3.12 0.90 4.27 1.39 2.89 2.89 0.58 15
Kriti Nutrients 201309 5.01 69.88 0.51 66.44 -0.04 3.92 1.13 0.64 2.14 0.70 1.44 1.44 0.29 10
Kriti Nutrients 201312 5.01 74.88 0.51 71.13 0.31 4.57 1.43 0.64 2.50 0.81 1.69 1.69 0.34 10
Kriti Nutrients 201403 5.01 65.78 0.68 64.49 0.52 2.48 1.11 0.64 0.73 0.45 0.28 0.28 0.06 10
Kriti Nutrients 201406 5.01 81.52 0.81 79.79 0.50 3.04 1.16 0.53 1.35 0.44 0.91 0.91 0.18 10
Krypton Industries 201309 14.70 11.85 10.93 0.92 0.32 0.28 0.32 0.10 0.22 0.22 0.15 0
Krypton Industries 201312 14.70 8.58 7.67 0.01 0.92 0.39 0.28 0.26 0.07 0.19 0.19 0.13 0
Krypton Industries 201403 14.70 11.77 10.71 0.22 1.28 0.54 0.56 0.18 0.23 -0.05 -0.05 -0.03 0
Krypton Industries 201406 14.70 9.13 8.25 0.09 0.97 0.47 0.26 0.24 0.07 0.17 0.17 0.12 0
Kshitij Investments 201309 0.63 0.01 -0.01 -0.01 -0.01 -0.01 -0.11 0
Kshitij Investments 201312 0.63 0.01 -0.01 -0.01 -0.01 -0.01 -0.10 0
Kshitij Investments 201403 0.63 0.02 0.00 0.00 0.02 0.02 0.02 0.25 0
Kshitij Investments 201406 0.63 0.01 -0.01 -0.01 -0.01 -0.01 -0.22 0
KSL & Industries 201309 40.27 228.51 227.73 5.53 6.31 18.98 25.61 -38.28 -38.28 -38.28 -3.80 0
KSL & Industries 201312 40.27 222.44 200.39 6.51 28.56 18.27 25.55 -15.26 -15.26 -15.26 -1.52 0
KSL & Industries 201403 40.27 237.50 196.95 6.74 47.29 16.50 18.19 12.60 -3.44 0.32 16.03 0.03 0
KSL & Industries 201406 40.27 234.60 203.93 7.14 37.81 16.20 22.67 -1.06 -1.06 -1.06 -0.10 0
KSS 201309 207.94 14.77 0.04 14.05 0.35 1.11 0.06 1.10 -0.05 -0.05 -0.05 0.00 0
KSS 201312 207.94 12.16 0.45 12.36 0.12 0.37 0.07 1.09 -0.79 0.00 -0.79 -0.79 -0.04 0
KSS 201403 207.94 18.02 0.59 36.58 7.48 -10.49 3.82 -14.31 -0.59 -13.72 -13.65 -0.66 0
KSS 201406 207.94 14.33 0.25 12.33 0.07 2.31 0.08 1.99 0.24 0.00 0.24 0.22 0.01 0
Kuberkamal Industrial Investment 201309 1.40 0.20 0.07 0.02 0.15 0.00 0.00 0.14 0.04 0.10 0.10 0.73 0
Kuberkamal Industrial Investment 201312 1.40 0.13 0.02 0.11 0.00 0.11 0.04 0.08 0.08 0.54 0
Kuberkamal Industrial Investment 201403 1.40 0.14 0.04 0.10 0.19 1.26 0.25 1.02 1.02 7.25 0
Kuberkamal Industrial Investment 201406 1.40 0.17 0.02 0.11 0.26 0.26 0.05 0.21 0.21 1.51 0
Kumar Wire Cloth Mfg. Company 201309 2.76 0.28 0.26 0.02 0.04 0.03 0.01 0.01 0.01 0.02 0
Kumar Wire Cloth Mfg. Company 201312 2.76 0.20 0.20 0.02 0.01 0.03 -0.02 -0.02 -0.02 -0.08 0
Kumar Wire Cloth Mfg. Company 201403 2.76 0.25 0.21 0.04 0.08 0.03 0.05 -0.08 0.13 0.13 0.47 0
Kumar Wire Cloth Mfg. Company 201406 2.76 0.21 0.20 0.02 0.03 0.03 0.00 0.00 0.00 0.01 0
Kwality Credit & Leasing 201309 4.22 0.37 0.16 0.20 0.00 0.20 0.06 0.14 0.14 0.33 0
Kwality Credit & Leasing 201312 4.22 1.60 1.60 0.00 0.00 0.00 0.00 0.00 0.00 0
Kwality Credit & Leasing 201403 4.22 0.22 0.40 -0.19 0.00 -0.19 -0.06 -0.13 -0.13 -0.32 0
Kwality Credit & Leasing 201406 4.22 0.26 0.56 -0.30 0.10 0.00 -0.40 -0.40 -0.40 -0.94 0

Co_Name Year Equity N.Sale O.O.I T. Exp O.I PBIDT Int. Dep. PBT T.Tax PAT A.PAT EPS Div (%)
Exp
ecte
d R
esu
lts
on
14
No
vem
ber
201
4
Ladderup Finance 201309 12.85 1.89 0.12 1.86 0.02 0.18 0.01 0.05 0.12 0.07 0.05 0.06 0.05 5
Ladderup Finance 201312 12.85 2.52 0.05 2.27 0.01 0.30 0.02 0.05 0.24 0.08 0.16 0.25 0.20 5
Ladderup Finance 201403 12.85 2.92 0.03 2.15 0.01 0.81 0.01 0.05 0.75 -0.28 1.03 1.00 0.77 5
Ladderup Finance 201406 12.85 2.36 0.03 2.25 0.01 0.15 0.06 0.05 0.04 0.03 0.01 0.04 0.03 5
Laffans Petrochemicals 201309 8.00 23.67 0.18 23.63 0.04 0.26 0.02 0.24 0.04 0.20 0.20 0.25 0
Laffans Petrochemicals 201312 8.00 0.19 0.31 0.04 -0.08 0.02 -0.11 0.04 -0.15 -0.15 -0.18 0
Laffans Petrochemicals 201403 8.00 0.19 4.79 0.06 -4.54 0.02 -4.56 -0.58 -3.98 -3.98 -4.98 0
Laffans Petrochemicals 201406 8.00 0.27 0.62 0.19 -0.15 0.02 -0.18 -0.05 -0.12 -0.12 -0.15 0
Lakshmi Energy & Foods 201309 13.30 310.96 0.09 276.33 0.19 34.91 16.91 11.62 6.38 -6.21 12.59 12.59 1.97 0
Lakshmi Energy & Foods 201312 13.30 192.78 0.25 155.82 0.51 37.72 17.92 11.32 8.48 -2.51 10.98 10.98 1.65 0
Lakshmi Energy & Foods 201403 13.30 127.46 0.50 131.51 0.25 -3.30 24.23 11.14 -68.97 -7.11 -61.87 -61.87 -9.48 0
Lakshmi Energy & Foods 201406 13.30 254.77 0.13 212.25 0.24 42.88 28.95 11.16 2.76 -2.57 5.33 5.33 0.82 0
Lakshmi Precision Screws 201309 10.94 84.21 0.36 70.48 0.75 14.84 9.58 4.56 0.70 0.10 0.60 0.60 0.55 0
Lakshmi Precision Screws 201312 10.94 88.91 1.44 74.09 0.04 16.30 9.95 4.02 2.33 0.14 0.95 2.19 0.87 0
Lakshmi Precision Screws 201403 10.94 95.01 115.39 0.36 -20.02 8.09 3.15 -31.26 -0.29 -30.97 -30.97 -28.30 0
Lakshmi Precision Screws 201406 10.94 90.30 0.86 78.26 1.27 14.16 8.98 4.02 1.16 0.76 0.41 0.41 0.37 0
Lanco Infratech 201309 239.24 2451.90 14.50 2068.29 44.75 442.86 719.15 294.32 -570.61 46.68 -599.64 -581.08 -2.48 0
Lanco Infratech 201312 239.24 2384.31 13.08 2018.17 75.74 454.96 678.26 286.41 -501.24 50.51 -551.75 -529.68 -2.25 0
Lanco Infratech 201403 239.24 2738.18 24.09 2525.10 70.24 307.41 655.96 299.17 -835.45 -269.21 -627.39 -584.29 -2.48 0
Lanco Infratech 201406 239.24 2589.72 14.80 1915.32 56.55 745.75 727.93 287.84 -269.70 28.05 -341.81 -306.35 -1.30 0
Landmarc Leisure Corporation 201309 80.00 0.47 1.31 0.20 -0.64 0.01 0.41 -1.06 -0.12 -0.94 -0.94 -0.01 0
Landmarc Leisure Corporation 201312 80.00 0.43 0.98 0.01 -0.54 0.00 0.34 -0.89 -0.06 -0.83 -0.83 -0.01 0
Landmarc Leisure Corporation 201403 80.00 0.42 0.87 -0.02 -0.47 0.01 0.33 -0.81 -0.04 -0.77 -0.77 -0.01 0
Landmarc Leisure Corporation 201406 80.00 0.28 0.62 0.00 -0.33 0.02 0.41 -0.76 0.08 -0.85 -0.85 -0.01 0
LCC Infotech 201309 25.32 1.93 1.91 0.00 0.02 0.00 0.03 -0.01 -0.01 -0.01 0
LCC Infotech 201312 25.32 3.07 3.10 -0.03 0.00 0.03 -0.06 -0.06 -0.06 -0.01 0
LCC Infotech 201403 25.32 3.22 3.26 0.02 -0.03 0.00 0.03 -0.06 -0.06 -0.06 0
LCC Infotech 201406 25.32 3.15 3.13 0.02 0.01 0.03 -0.02 -0.02 -0.02 0
Lesha Industries 201309 17.47 15.47 15.42 0.00 0.05 0.02 0.04 0.04 0.04 0
Lesha Industries 201312 17.47 4.60 4.60 0.00 0.00 0.02 -0.02 -0.02 -0.02 -0.01 0
Lesha Industries 201403 17.47 0.84 0.91 0.00 -0.07 0.17 -0.24 -0.24 -0.24 -0.14 0
Lesha Industries 201406 17.47 0.04 0.10 -0.05 0.05 -0.11 -0.11 -0.11 -0.06 0
Linc Pen & Plastics 201309 14.79 79.99 0.95 75.28 0.01 5.67 0.38 1.21 4.09 0.92 3.17 3.17 2.15 20
Linc Pen & Plastics 201312 14.79 70.06 1.35 66.02 0.03 5.42 0.53 1.22 3.67 1.14 2.54 2.54 1.71 20
Linc Pen & Plastics 201403 14.79 90.56 1.70 84.85 0.00 7.41 1.03 1.45 4.94 1.17 3.77 3.77 2.55 20
Linc Pen & Plastics 201406 14.79 71.36 1.68 67.23 0.03 5.84 0.42 1.40 4.02 0.73 3.29 3.29 2.23 20

Co_Name Year Equity N.Sale O.O.I T. Exp O.I PBIDT Int. Dep. PBT T.Tax PAT A.PAT EPS Div (%)
Exp
ecte
d R
esu
lts
on
14
No
vem
ber
201
4
Lincoln Pharmaceuticals 201309 16.31 54.35 1.21 50.26 5.30 0.48 0.88 3.94 0.59 3.35 3.42 2.09 6
Lincoln Pharmaceuticals 201312 16.31 51.99 0.95 46.00 6.94 1.99 0.92 4.04 1.06 2.98 3.30 2.02 6
Lincoln Pharmaceuticals 201403 16.31 64.79 1.97 61.40 5.36 3.12 0.88 1.36 0.59 0.77 0.70 0.43 6
Lincoln Pharmaceuticals 201406 16.31 46.95 2.16 41.94 7.17 1.85 1.11 4.21 1.17 3.04 3.23 1.98 6
Lohia Securities 201309 4.98 6.46 0.01 5.25 0.46 1.68 0.52 0.11 1.05 1.05 1.05 2.10 2
Lohia Securities 201312 4.98 7.85 0.00 7.80 0.35 0.40 0.30 0.12 -0.02 -0.02 -0.02 -0.05 2
Lohia Securities 201403 4.98 7.19 0.00 5.61 0.36 1.95 0.30 0.12 1.52 0.16 1.37 1.37 2.74 2
Lohia Securities 201406 4.98 11.46 0.00 8.60 0.31 3.17 0.25 0.11 2.81 2.81 2.81 5.64 2
Lok Housing & Constructions 201309 46.75 8.35 6.51 1.26 3.10 2.55 0.03 0.51 0.10 0.41 0.41 0.09 0
Lok Housing & Constructions 201312 46.75 5.63 4.17 1.24 2.70 2.10 0.03 0.57 0.19 0.38 0.38 0.08 0
Lok Housing & Constructions 201403 46.75 7.78 0.06 8.38 1.56 1.02 2.03 0.03 -1.04 -0.19 -0.85 -0.85 -0.18 0
Lok Housing & Constructions 201406 46.75 1.72 1.60 1.55 1.67 1.51 0.03 0.13 0.03 0.11 0.11 0.02 0
Lokesh Machines 201309 11.78 21.34 17.33 0.10 4.12 4.53 2.59 -3.00 -0.90 -2.10 -2.10 -1.78 5
Lokesh Machines 201312 11.78 32.56 22.40 0.07 10.23 5.19 2.37 2.67 0.80 1.87 1.87 1.59 5
Lokesh Machines 201403 11.78 30.26 23.78 0.39 6.87 4.76 1.46 0.65 0.48 0.18 0.18 0.15 5
Lokesh Machines 201406 11.78 31.97 24.25 0.10 7.82 4.58 2.17 1.07 0.35 0.72 0.72 0.61 5
Longview Tea Company 201309 3.00 0.48 0.54 0.18 0.11 0.02 0.10 0.01 0.08 0.08 0.28 0
Longview Tea Company 201312 3.00 0.19 0.24 0.17 0.12 0.02 0.11 0.02 0.09 0.09 0.30 0
Longview Tea Company 201403 3.00 0.24 0.33 0.20 0.11 0.02 0.09 0.03 0.07 0.07 0.22 0
Longview Tea Company 201406 3.00 0.08 0.16 0.08 0.02 0.07 0.01 0.05 0.05 0.18 0
Lords Chloro Alkali 201309 25.15 0.59 0.71 0.12 0.00 0.58 -0.46 -0.46 -0.46 -0.18 0
Lords Chloro Alkali 201312 25.15 0.85 0.02 -0.83 0.00 0.59 -1.42 -1.42 -1.42 -0.57 0
Lords Chloro Alkali 201403 25.15 0.70 -0.68 -1.38 0.00 0.58 -1.96 -0.43 -1.53 -1.53 -0.61 0
Lords Chloro Alkali 201406 25.15 0.64 0.06 -0.59 0.00 0.56 -1.15 -1.15 -1.15 -0.46 0
Lotus Eye Hospital And Institute 201309 20.80 7.12 6.05 0.10 1.16 0.00 0.84 0.32 0.05 0.27 0.27 0.13 0
Lotus Eye Hospital And Institute 201312 20.80 7.09 6.27 0.09 0.92 0.00 0.87 0.06 0.01 0.04 0.04 0.02 0
Lotus Eye Hospital And Institute 201403 20.80 6.87 6.47 0.12 0.52 0.00 1.02 -0.50 -0.04 -0.46 -0.46 -0.22 0
Lotus Eye Hospital And Institute 201406 20.80 7.81 6.66 0.08 1.23 0.00 0.93 0.30 0.09 0.20 0.20 0.10 0
Luminaire Technologies 201309 29.39 0.01 -0.01 -0.01 -0.01 -0.01 0
Luminaire Technologies 201312 29.39 0.00 0.01 0.00 -0.01 0.00 -0.01 0.00 -0.01 -0.01 0
Luminaire Technologies 201403 29.39 0.04 -0.04 -0.04 -0.04 -0.04 0
Luminaire Technologies 201406 29.39 0.03 -0.03 0.14 -0.17 -0.17 -0.17 0
Lykis 201309 18.96 34.11 2.50 35.13 -0.18 1.30 0.43 0.06 0.81 0.29 0.51 0.51 0.28 0
Lykis 201312 18.96 38.31 2.01 40.57 0.11 -0.13 0.31 0.05 -0.49 -0.49 -0.49 -0.27 0
Lykis 201403 18.96 23.36 1.66 25.41 1.66 1.27 0.23 0.07 0.97 0.12 0.85 0.85 0.46 0
Lykis 201406 18.96 29.23 1.60 30.56 0.23 0.51 0.36 0.07 0.08 0.08 0.08 0.04 0

Co_Name Year Equity N.Sale O.O.I T. Exp O.I PBIDT Int. Dep. PBT T.Tax PAT A.PAT EPS Div (%)
Exp
ecte
d R
esu
lts
on
14
No
vem
ber
201
4
Madhucon Projects 201309 7.38 225.11 4.74 181.95 9.56 57.46 33.20 13.05 11.22 2.29 8.93 8.93 1.21 10
Madhucon Projects 201312 7.38 168.22 9.52 132.35 7.26 52.65 34.36 13.04 5.24 3.50 1.74 1.74 0.24 10
Madhucon Projects 201403 7.38 340.77 8.12 288.97 8.29 68.21 31.05 8.14 29.01 10.31 18.71 18.71 2.54 10
Madhucon Projects 201406 7.38 146.12 4.39 117.95 17.78 50.33 29.75 11.18 9.40 2.91 6.49 6.49 0.88 10
Magna Colors 201309 11.50 0.00 0.00 0.00 0.00 0.00 0
Magna Colors 201312 11.50 0.00 0.00 0.00 0.00 0.00 0
Magna Colors 201403 11.50 0.00 0.00 0.00 0.00 0.00 0
Magna Colors 201406 11.50 0.00 0.00 0.00 0.00 0.00 0
Mahaan Foods 201309 3.50 0.62 0.94 0.59 0.00 0.97 0.57 0.11 0.29 0.00 0.29 0.29 0.84 0
Mahaan Foods 201312 3.50 0.01 1.67 1.29 0.39 0.40 0.11 -0.11 -0.11 -0.11 -0.32 0
Mahaan Foods 201403 3.50 1.11 0.03 1.90 0.04 -0.72 0.07 1.48 1.48 1.48 4.23 0
Mahaan Foods 201406 3.50 8.76 9.04 -0.28 0.03 -0.31 -0.31 -0.31 -0.88 0
Mahalaxmi Seamless 201309 5.29 3.00 4.54 0.08 -1.46 0.28 0.29 -2.03 0.03 -2.06 -2.06 -3.88 0
Mahalaxmi Seamless 201312 5.29 4.16 4.43 0.04 -0.23 0.20 0.29 -0.72 -0.72 -0.72 -1.36 0
Mahalaxmi Seamless 201403 5.29 4.33 4.99 0.02 -0.64 0.27 -0.21 -0.70 -0.70 -0.70 -1.32 0
Mahalaxmi Seamless 201406 5.29 4.74 4.22 0.01 0.52 0.13 0.16 0.23 0.23 0.23 0.43 0
Mahamaya Steel Industries 201309 13.57 55.52 50.70 0.19 5.01 1.55 1.25 2.31 0.36 1.95 1.95 1.44 0
Mahamaya Steel Industries 201312 13.57 70.49 67.70 0.19 2.98 1.69 1.35 0.23 0.52 -0.29 -0.29 -0.21 0
Mahamaya Steel Industries 201403 13.57 90.20 87.72 0.24 2.72 0.69 1.33 1.88 0.57 1.32 1.32 0.97 0
Mahamaya Steel Industries 201406 13.57 85.77 82.01 0.20 3.97 1.53 1.35 1.08 0.37 0.71 0.71 0.53 0
Maharashtra Corporation 201309 13.53 0.87 0.85 0.02 0.00 0.02 0.02 0.02 0
Maharashtra Corporation 201312 13.53 0.51 0.51 0.00 0.00 0.00 0.00 0
Maharashtra Corporation 201403 13.53 0.64 0.73 -0.09 0.00 -0.09 0.01 -0.10 -0.10 0
Maharashtra Corporation 201406 13.53 0.84 0.02 0.80 0.06 0.06 0.06 0.06 0
Mahavir Advanced Remedies 201309 11.36 0.03 0.01 0.02 -0.02 -0.02 -0.02 -0.02 0
Mahavir Advanced Remedies 201312 11.36 0.03 0.01 0.02 0.02 0.02 0.02 0.02 0
Mahavir Advanced Remedies 201403 11.36 0.02 0.15 0.22 0.09 0.13 0.00 0.13 0.13 0.11 0
Mahavir Advanced Remedies 201406 11.36 0.02 0.02 0.01 0.01 0.01 0.01 0.01 0
Man Industries (India) 201309 28.55 148.71 12.02 150.92 9.15 18.96 8.71 8.25 2.00 0.72 1.28 1.28 0.22 20
Man Industries (India) 201312 28.55 299.62 15.74 300.62 8.63 23.37 11.69 8.27 3.41 1.00 2.41 2.41 0.42 20
Man Industries (India) 201403 28.55 345.82 18.40 350.69 12.00 25.53 12.76 8.03 4.74 0.95 3.79 3.79 0.66 20
Man Industries (India) 201406 28.55 211.66 19.33 224.56 15.35 21.78 9.27 8.95 3.56 0.40 3.16 3.16 0.55 20
Mangal Credit and Fincorp 201309 1.41 2.64 0.48 0.06 2.22 1.83 0.04 0.36 0.36 0.36 2.53 20
Mangal Credit and Fincorp 201312 1.41 3.35 0.97 0.30 2.67 2.23 0.14 0.30 0.30 0.30 2.14 20
Mangal Credit and Fincorp 201403 1.41 3.63 1.47 0.60 2.75 2.43 0.19 0.14 0.21 -0.07 -0.07 -0.53 20
Mangal Credit and Fincorp 201406 1.41 3.42 0.55 0.53 3.41 2.67 0.13 0.61 0.12 0.49 0.49 3.48 20

Co_Name Year Equity N.Sale O.O.I T. Exp O.I PBIDT Int. Dep. PBT T.Tax PAT A.PAT EPS Div (%)
Exp
ecte
d R
esu
lts
on
14
No
vem
ber
201
4
Mangalam Drugs & Organics 201309 13.18 28.13 0.09 25.69 2.52 2.50 0.99 -0.97 -0.97 -0.97 -0.74 0
Mangalam Drugs & Organics 201312 13.18 38.06 0.03 34.31 0.04 3.83 2.90 1.02 -0.10 -0.10 -0.10 -0.07 0
Mangalam Drugs & Organics 201403 13.18 37.78 0.15 31.84 0.03 6.11 2.07 1.01 3.03 -0.87 3.90 3.90 2.96 0
Mangalam Drugs & Organics 201406 13.18 38.56 0.08 35.08 0.02 3.58 2.71 1.07 -0.20 -0.20 -0.20 -0.15 0
Mangalore Chemicals & Fertilizers 201309 118.55 1221.07 1172.96 1.31 49.42 28.23 7.29 13.91 4.47 9.43 9.43 0.80 12
Mangalore Chemicals & Fertilizers 201312 118.55 840.51 765.11 2.07 77.47 28.06 7.15 42.27 14.31 27.96 27.96 2.36 12
Mangalore Chemicals & Fertilizers 201403 118.55 641.57 553.85 0.41 88.13 25.26 7.04 55.83 10.24 45.59 45.59 3.85 12
Mangalore Chemicals & Fertilizers 201406 118.55 430.99 422.50 1.09 9.58 28.07 5.95 -24.45 -14.69 -9.76 -9.76 -0.82 12
Manipal Finance Corporation 201309 8.38 0.04 0.06 0.01 0.02 0.13 0.13 0.13 0.15 0
Manipal Finance Corporation 201312 8.38 0.03 0.02 -0.02 0.00 0.03 0.04 0.06 0.04 0.07 0
Manipal Finance Corporation 201403 8.38 0.07 0.04 -0.03 0.03 -0.02 0.03 -0.05 -0.05 -0.06 0
Manipal Finance Corporation 201406 8.38 0.07 0.04 -0.04 0.03 0.13 0.14 0.13 0.17 0
Manjeera Constructions 201309 12.51 12.40 13.58 3.36 2.18 1.49 0.18 0.51 0.34 0.17 0.52 0.41 0
Manjeera Constructions 201312 12.51 14.41 14.30 2.98 3.09 3.19 0.65 -0.75 0.19 -0.93 0.14 0.11 0
Manjeera Constructions 201403 12.51 40.99 34.58 2.24 8.65 3.53 1.96 3.16 -1.18 4.34 3.02 2.42 0
Manjeera Constructions 201406 12.51 20.76 0.10 14.42 0.27 6.70 5.58 0.90 1.51 1.04 0.47 0.35 0.28 0
Mansoon Trading Company 201309 2.46 0.04 0.00 0.03 0.06 0.06 0.01 0.05 0.05 0.21 0
Mansoon Trading Company 201312 2.46 0.04 0.00 0.00 0.04 0.04 0.01 0.03 0.03 0.11 0
Mansoon Trading Company 201403 2.46 0.05 0.01 0.01 0.04 0.04 0.01 0.03 0.03 0.12 0
Mansoon Trading Company 201406 2.46 0.05 0.01 0.00 0.04 0.04 0.01 0.03 0.03 0.11 0
Marsons 201309 25.00 14.90 12.13 0.11 2.89 2.05 0.40 0.43 0.08 0.35 0.35 0.14 0
Marsons 201312 25.00 15.85 13.04 0.04 2.84 1.71 0.42 0.72 0.26 0.46 0.46 0.18 0
Marsons 201403 25.00 23.93 22.10 0.42 2.25 2.07 0.14 0.04 0.04 0.04 0.02 0
Marsons 201406 25.00 12.14 9.21 0.14 3.06 2.40 0.59 0.08 0.08 0.08 0.03 0
Mathew Easow Research Securities 201309 6.65 0.21 0.12 0.09 0.00 0.01 0.08 0.02 0.07 0.07 0.10 0
Mathew Easow Research Securities 201312 6.65 0.30 0.00 0.15 0.14 0.00 0.01 0.14 0.02 0.12 0.12 0.17 0
Mathew Easow Research Securities 201403 6.65 0.68 0.96 -0.28 0.00 0.01 -0.29 0.00 -0.28 -0.28 -0.43 0
Mathew Easow Research Securities 201406 6.65 3.44 3.45 0.00 0.00 0.01 -0.01 -0.01 -0.01 -0.02 0
Matra Realty 201309 6.14 0.00 0.01 0.00 -0.01 0.00 -0.01 0.00 -0.01 -0.01 -0.01 0
Matra Realty 201312 6.14 0.01 -0.01 0.00 -0.01 -0.01 -0.01 -0.01 0
Matra Realty 201403 6.14 0.01 -0.01 0.00 -0.01 -0.01 -0.01 -0.01 0
Matra Realty 201406 6.14 0.01 -0.01 0.00 -0.01 -0.01 -0.01 -0.01 0
Maximaa Systems 201309 10.05 6.23 5.43 0.03 0.82 0.31 0.42 0.10 0.10 0.10 0.02 0
Maximaa Systems 201312 10.05 7.03 6.92 0.01 0.13 0.28 0.42 -0.57 -0.57 -0.57 -0.11 0
Maximaa Systems 201403 10.05 9.89 8.92 0.30 1.28 0.33 0.42 0.53 0.05 0.48 0.48 0.09 0
Maximaa Systems 201406 10.05 3.38 2.85 0.54 0.38 0.14 0.02 0.02 0.02 0.02 0

Co_Name Year Equity N.Sale O.O.I T. Exp O.I PBIDT Int. Dep. PBT T.Tax PAT A.PAT EPS Div (%)
Exp
ecte
d R
esu
lts
on
14
No
vem
ber
201
4
Maxwell Industries 201309 12.62 67.51 0.38 61.63 0.34 6.60 3.03 0.87 2.69 0.89 1.80 1.80 0.29 10
Maxwell Industries 201312 12.62 60.06 0.35 54.83 0.17 5.75 3.27 0.89 1.59 0.58 1.01 1.01 0.16 10
Maxwell Industries 201403 12.62 59.84 0.39 55.99 0.51 4.74 3.15 0.89 0.70 0.24 0.46 0.46 0.07 10
Maxwell Industries 201406 12.62 66.05 0.49 59.55 0.08 7.07 3.07 0.87 3.13 1.01 2.12 2.12 10
Meenakshi Steel Industries 201309 1.99 0.10 0.00 0.10 0.10 0.03 0.07 0.07 0.35 0
Meenakshi Steel Industries 201312 1.99 0.09 0.00 0.00 0.09 0.09 0.03 0.06 0.06 0.30 0
Meenakshi Steel Industries 201403 1.99 0.09 0.00 0.00 0.08 0.08 -0.05 0.13 0.13 0.64 0
Meenakshi Steel Industries 201406 1.99 0.09 0.02 0.00 0.08 0.08 0.02 0.06 0.06 0.28 0
Megasoft 201309 44.27 24.34 18.73 0.15 5.76 2.31 3.19 0.26 0.26 0.26 0.06 0
Megasoft 201312 44.27 28.85 22.49 2.78 9.14 1.99 2.92 0.43 0.19 0.24 0.24 0.05 0
Megasoft 201403 44.27 24.05 18.49 -0.25 5.31 2.25 2.86 0.20 0.09 0.11 0.11 0.02 0
Megasoft 201406 44.27 20.79 14.96 -0.06 5.77 2.41 3.14 0.22 -0.10 0.32 0.32 0.07 0
Meglon Infra-Real (India) 201309 5.00 0.04 0.05 0.00 0.00 0.00 0.00 0
Meglon Infra-Real (India) 201312 5.00 0.02 0.03 -0.01 -0.01 -0.01 -0.01 0
Meglon Infra-Real (India) 201403 5.00 0.02 0.04 -0.03 -0.03 -0.03 -0.03 0
Meglon Infra-Real (India) 201406 5.00 0.02 0.03 0.00 -0.01 0.00 -0.01 0.00 -0.01 -0.01 0
Melstar Information Technologies 201309 14.28 4.53 0.25 4.68 0.36 0.45 0.22 0.21 0.03 0.07 -0.05 -0.05 -0.03 0
Melstar Information Technologies 201312 14.28 4.20 0.03 5.33 0.03 -1.07 0.24 0.21 -1.52 -1.52 -1.52 -1.06 0
Melstar Information Technologies 201403 14.28 4.48 0.05 4.59 0.01 -0.04 0.26 0.20 -0.50 -0.50 -0.50 -0.35 0
Melstar Information Technologies 201406 14.28 4.81 0.03 4.66 0.01 0.19 0.31 0.20 -0.32 -0.32 -0.32 -0.23 0
Mercury Trade Links 201309 0.25 0.07 0.06 0.08 0.05 0.05 0.05 0.05 1.84 0
Mercury Trade Links 201312 0.25 0.04 0.01 0.04 0.02 0.02 0.00 0.02 0.02 0.85 0
Mercury Trade Links 201403 0.25 0.02 0.01 0.02 0.01 0.01 0.01 -0.01 -0.01 -0.20 0
Mercury Trade Links 201406 0.25 0.05 0.01 0.05 0.01 0.01 0.01 0.01 0.49 0
Metal Coatings (India) 201309 7.33 22.19 1.43 22.46 0.10 1.26 0.39 0.19 0.68 0.22 0.46 0.46 0.63 10
Metal Coatings (India) 201312 7.33 28.65 1.05 28.47 0.14 1.36 0.44 0.20 0.72 0.24 0.49 0.49 0.67 10
Metal Coatings (India) 201403 7.33 27.77 0.77 27.73 0.25 1.06 0.52 0.17 0.37 0.04 0.33 0.33 0.45 10
Metal Coatings (India) 201406 7.33 31.02 0.71 30.64 0.08 1.16 0.53 0.18 0.44 0.14 0.30 0.30 0.41 10
Metropoli Overseas 201309 11.93 4.13 4.26 -0.13 0.03 0.14 -0.31 -0.31 -0.31 -0.26 0
Metropoli Overseas 201312 11.93 4.49 4.48 0.01 0.03 0.14 -0.16 -0.16 -0.16 -0.13 0
Metropoli Overseas 201403 11.93 4.46 4.79 -0.33 0.09 0.21 -0.66 -0.66 -0.66 -0.95 0
Metropoli Overseas 201406 11.93 3.87 4.24 -0.37 0.02 0.15 -0.54 -0.54 -0.54 -0.45 0
MIC Electronics 201309 20.50 29.30 0.50 25.86 1.95 5.89 3.89 1.55 0.45 0.12 0.33 0.33 0.03 0
MIC Electronics 201312 20.50 34.49 0.16 39.66 0.28 -4.73 0.64 1.55 -31.71 -0.02 -31.69 -31.69 -3.09 0
MIC Electronics 201403 20.50 31.09 0.34 32.88 0.31 -1.14 4.74 1.50 -30.21 -11.34 -18.87 -18.87 -1.84 0
MIC Electronics 201406 20.50 36.99 0.79 39.34 0.09 -1.47 3.09 1.97 -3.38 -0.18 -3.20 -3.20 -0.31 0

Co_Name Year Equity N.Sale O.O.I T. Exp O.I PBIDT Int. Dep. PBT T.Tax PAT A.PAT EPS Div (%)
Exp
ecte
d R
esu
lts
on
14
No
vem
ber
201
4
Mid India Industries 201309 16.30 7.88 7.71 0.01 0.18 0.01 0.07 0.09 0.02 0.07 0.07 0
Mid India Industries 201312 16.30 8.06 7.94 0.00 0.12 0.01 0.07 0.04 0.01 0.03 0.03 0
Mid India Industries 201403 16.30 10.68 10.33 0.05 0.41 0.29 0.06 0.06 0.01 0.05 0.05 0.03 0
Mid India Industries 201406 16.30 8.60 8.45 0.00 0.15 0.03 0.07 0.05 0.01 0.04 0.04 0.03 0
Midas Infra Trade 201309 5.03 56.49 56.58 -0.08 -0.08 -0.08 -0.08 -0.16 0
Midas Infra Trade 201312 12.20 116.76 116.88 -0.12 -0.12 -0.12 -0.12 -0.10 0
Midas Infra Trade 201403 12.20 1.24 1.25 0.03 0.02 0.00 0.02 0.02 0.02 0.02 0
Midas Infra Trade 201406 12.20 0.74 0.74 0.02 0.01 0.00 0.01 0.00 0.01 0.01 0
Milkfood 201309 4.89 69.72 2.04 69.47 2.29 2.69 1.16 -3.76 -1.26 -3.76 -2.58 0
Milkfood 201312 4.89 108.94 1.51 101.46 0.02 9.01 2.70 1.50 4.81 5.02 4.81 10.26 0
Milkfood 201403 4.89 158.83 0.75 153.73 2.59 8.44 3.26 1.94 4.88 1.57 0.94 3.31 1.93 0
Milkfood 201406 4.89 101.19 1.08 99.72 2.55 2.49 1.46 -1.40 -1.40 -1.40 -2.86 0
Millenium Online Solution (India) 201309 3.00 0.01 -0.01 -0.01 -0.01 -0.01 0
Millenium Online Solution (India) 201312 3.00 0.01 -0.01 -0.01 -0.01 -0.01 0
Millenium Online Solution (India) 201403 3.00 0.05 -0.05 -0.05 -0.05 -0.05 0
Millenium Online Solution (India) 201406 3.00 0.01 -0.01 -0.01 -0.01 -0.01 0
Mini Diamonds (India) 201309 3.45 24.52 24.45 0.08 0.15 0.11 0.01 0.03 0.03 0.03 0.01 0
Mini Diamonds (India) 201312 3.45 12.95 13.06 0.24 0.13 0.08 0.01 0.04 0.04 0.04 0.01 0
Mini Diamonds (India) 201403 3.45 21.04 20.84 0.25 0.45 0.14 0.04 0.28 0.17 0.11 0.11 0.05 0
Mini Diamonds (India) 201406 3.45 28.12 28.34 0.40 0.18 0.10 0.02 0.06 0.06 0.06 0.02 0
Minolta Finance 201309 10.00 0.04 0.02 0.02 0.00 0.01 0.01 0.01 0.01 0
Minolta Finance 201312 10.00 0.04 0.03 0.01 0.00 0.01 0.01 0.01 0.01 0
Minolta Finance 201403 10.00 -0.01 0.01 -0.03 0.00 -0.03 -0.03 -0.03 -0.03 0
Minolta Finance 201406 10.00 0.03 0.03 0.00 0.01 -0.01 -0.01 -0.01 -0.01 0
Mirch Technologies 201309 0.89 0.00 0.06 -0.06 0.08 -0.13 -0.13 -0.13 -0.15 0
Mirch Technologies 201312 0.89 0.05 0.00 -0.05 0.07 -0.12 -0.12 -0.12 -0.13 0
Mirch Technologies 201403 0.89 0.07 0.03 -0.04 0.07 -0.10 -0.10 -0.10 -0.12 0
Mirch Technologies 201406 0.89 0.09 0.02 -0.07 0.06 -0.13 -0.13 -0.13 -0.14 0
Mobile Tele Communications 201309 11.90 22.90 22.26 0.64 0.16 0.18 0.31 0.31 0.31 0.03 0
Mobile Tele Communications 201312 11.90 21.81 0.03 21.39 0.44 0.18 0.18 0.08 0.08 0.08 0.01 0
Mobile Tele Communications 201403 11.90 34.55 2.30 37.06 0.05 -0.16 0.18 0.18 -0.52 -0.07 -0.45 -0.45 -0.04 0
Mobile Tele Communications 201406 11.90 25.12 0.00 24.50 0.01 0.64 0.22 0.18 0.25 0.25 0.25 0.02 0
Modern Steels 201309 13.23 64.71 64.93 1.05 0.83 4.27 1.17 -4.61 -1.58 -3.03 -3.03 -2.41 0
Modern Steels 201312 13.23 66.40 64.85 1.00 2.55 5.25 1.17 -3.87 -1.20 -2.67 -2.67 -2.12 0
Modern Steels 201403 13.23 65.54 0.09 64.20 0.48 1.91 5.38 1.17 -4.64 -1.48 -3.16 -3.16 -2.51 0
Modern Steels 201406 14.40 75.19 0.27 73.07 0.93 3.32 5.29 1.15 -3.12 -0.98 -2.14 -2.14 -1.55 0

Co_Name Year Equity N.Sale O.O.I T. Exp O.I PBIDT Int. Dep. PBT T.Tax PAT A.PAT EPS Div (%)
Exp
ecte
d R
esu
lts
on
14
No
vem
ber
201
4
Modi Naturals 201309 11.12 36.45 35.56 0.90 0.34 0.35 0.20 0.20 0.20 0.18 0
Modi Naturals 201312 11.12 70.32 69.51 0.81 0.23 0.38 0.20 0.20 0.20 0.18 0
Modi Naturals 201403 11.12 69.01 67.11 1.90 0.52 0.33 1.05 0.82 0.23 0.23 0.74 0
Modi Naturals 201406 11.12 39.99 38.85 1.14 0.58 0.48 0.08 0.08 0.08 0.07 0
Mohit Industries 201309 14.16 54.53 51.67 0.76 3.62 2.23 1.31 0.08 0.02 0.06 0.06 0.04 0
Mohit Industries 201312 14.16 55.29 51.64 0.32 3.98 2.67 1.24 0.07 0.01 0.06 0.06 0.04 0
Mohit Industries 201403 14.16 62.85 60.37 0.76 3.23 1.81 0.79 2.27 1.15 1.13 1.13 0.79 0
Mohit Industries 201406 14.16 65.09 60.23 0.03 4.89 2.21 1.43 1.25 0.25 1.00 1.00 0.70 0
Mohit Paper Mills 201309 14.00 21.88 20.12 0.08 1.84 0.72 0.83 0.29 0.06 0.17 0.23 0.12 0
Mohit Paper Mills 201312 14.00 20.51 18.59 0.06 1.98 0.73 0.94 0.31 0.06 0.25 0.25 0.18 0
Mohit Paper Mills 201403 14.00 24.67 22.57 -0.28 1.83 0.66 0.92 0.25 -0.09 0.34 0.34 0.24 0
Mohit Paper Mills 201406 14.00 22.48 20.54 0.01 1.95 0.68 0.90 0.37 -0.06 0.43 0.43 0.31 0
Monnet Ispat & Energy 201309 63.73 501.37 4.81 382.22 12.42 136.38 34.28 22.30 79.80 19.61 60.19 60.19 9.44 10
Monnet Ispat & Energy 201312 65.83 640.03 23.53 523.62 12.06 152.00 65.85 34.46 51.69 4.78 46.91 46.91 7.31 10
Monnet Ispat & Energy 201403 65.83 656.65 3.22 614.32 2.96 48.51 99.77 55.57 -106.83 -13.86 -92.97 -92.97 -14.39 10
Monnet Ispat & Energy 201406 65.83 884.16 9.58 704.55 9.37 198.56 115.41 58.10 25.05 7.64 17.41 17.41 2.64 10
Morarka Finance 201309 4.50 0.01 0.20 0.03 -0.17 0.01 0.00 -0.18 -0.18 -0.18 -0.39 0
Morarka Finance 201312 4.50 0.04 0.04 0.00 0.00 0.00 0.00 0
Morarka Finance 201403 4.50 0.04 0.05 -0.01 0.00 -0.01 -0.02 0.01 0.01 0.01 0
Morarka Finance 201406 4.50 0.09 0.06 0.03 0.00 0.03 0.03 0.03 0.05 0
Morgan Ventures 201309 9.90 0.52 0.22 0.30 0.26 0.05 0.05 0.05 0.04 0
Morgan Ventures 201312 9.90 0.19 0.24 -0.05 0.26 -0.31 -0.31 -0.31 -0.31 0
Morgan Ventures 201403 9.90 0.18 0.44 -0.27 0.25 -0.52 -0.52 -0.52 -0.52 0
Morgan Ventures 201406 9.90 3.25 0.37 2.89 0.29 2.59 2.59 2.59 2.62 0
Mudra Lifestyle 201309 47.99 93.72 2.63 111.75 1.05 -14.35 10.20 6.40 -30.94 -31.78 -30.94 -6.62 0
Mudra Lifestyle 201312 47.99 83.18 2.01 112.59 16.57 -10.83 8.71 6.32 -25.86 -2.94 -20.26 -22.92 -4.78 0
Mudra Lifestyle 201403 47.99 68.48 1.98 88.47 -5.31 -23.33 6.44 5.87 44.50 -18.55 63.06 63.06 13.14 0
Mudra Lifestyle 201406 47.99 43.00 1.41 47.74 1.04 -2.29 0.70 0.58 10.73 10.73 10.73 2.24 0
Mudunuru 201309 4.79 1.66 1.39 0.27 0.12 0.15 0.09 0.06 0.06 0.12 0
Mudunuru 201312 4.79 0.69 0.56 0.13 0.11 0.02 0.01 0.01 0.01 0.03 0
Mudunuru 201403 4.79 3.23 3.04 0.18 0.13 0.05 -0.16 0.21 0.21 0.44 0
Mudunuru 201406 4.79 1.34 1.11 0.22 0.15 0.08 0.00 0.07 0.07 0.15 0
Mukesh Babu Financial Services 201309 6.97 3.82 0.10 3.71 0.32 0.02 3.38 0.86 2.52 2.52 3.61 10
Mukesh Babu Financial Services 201312 6.97 2.42 0.11 2.32 0.43 0.02 1.87 0.55 1.31 1.31 1.88 10
Mukesh Babu Financial Services 201403 6.97 0.95 0.12 0.84 0.47 0.02 0.34 0.20 0.14 0.14 0.20 10
Mukesh Babu Financial Services 201406 6.97 2.09 0.13 1.95 0.42 0.02 1.51 0.47 1.04 1.04 1.49 10

Co_Name Year Equity N.Sale O.O.I T. Exp O.I PBIDT Int. Dep. PBT T.Tax PAT A.PAT EPS Div (%)
Exp
ecte
d R
esu
lts
on
14
No
vem
ber
201
4
Mukesh Steels 201309 6.48 14.28 14.01 0.03 0.30 0.22 0.07 0.01 -0.01 0.02 0.02 0.03 0
Mukesh Steels 201312 6.48 13.00 12.52 0.00 0.48 0.33 0.06 0.08 0.02 0.07 0.07 0.10 0
Mukesh Steels 201403 6.48 26.03 27.23 1.42 0.23 0.38 0.05 -0.21 -0.08 -0.13 -0.13 -0.19 0
Mukesh Steels 201406 6.48 10.66 10.62 0.10 0.15 0.33 0.06 -0.24 -0.24 -0.24 -0.36 0
Mukesh Strips 201309 3.36 11.74 11.27 0.02 0.49 0.36 0.06 0.07 0.03 0.04 0.04 0.11 0
Mukesh Strips 201312 3.36 10.35 9.94 0.03 0.44 0.31 0.06 0.08 0.03 0.05 0.05 0.14 0
Mukesh Strips 201403 3.36 28.18 28.62 0.26 -0.19 0.30 0.05 -0.54 -0.10 -0.44 -0.44 -1.20 0
Mukesh Strips 201406 3.36 10.77 10.60 0.03 0.20 0.38 0.06 -0.24 -0.24 -0.24 -0.64 0
Muller & Phipps (India) 201309 0.63 1.11 1.04 0.07 0.15 0.08 0.01 0.06 0.06 0.06 0.98 0
Muller & Phipps (India) 201312 0.63 1.00 1.00 0.00 0.01 0.08 0.01 -0.08 -0.08 -0.08 -1.30 0
Muller & Phipps (India) 201403 0.63 1.00 1.00 0.11 0.11 0.07 0.01 0.03 0.03 0.03 0.42 0
Muller & Phipps (India) 201406 0.63 0.96 0.98 0.01 -0.01 0.08 0.01 0.64 0.14 0.50 0.50 7.97 0
Multi Commodity Exchange Of India 201309 51.00 81.23 6.80 69.33 23.98 42.68 0.00 7.86 34.81 7.76 27.05 27.05 5.30 100
Multi Commodity Exchange Of India 201312 51.00 55.85 5.56 43.76 18.18 35.83 0.00 7.38 28.45 6.62 21.84 21.84 4.31 100
Multi Commodity Exchange Of India 201403 51.00 59.81 4.15 22.22 33.03 74.77 1.06 10.70 63.01 19.26 43.75 43.75 8.63 100
Multi Commodity Exchange Of India 201406 51.00 47.38 4.21 40.15 24.30 35.73 0.00 6.75 28.98 5.57 23.41 23.41 4.62 100
Murli Industries 201309 14.42 87.10 90.58 -3.47 31.72 15.09 -50.29 -50.29 -50.29 -6.97 0
Murli Industries 201312 14.42 110.39 116.73 0.05 -6.29 32.13 15.11 -53.53 -53.53 -53.53 -7.42 0
Murli Industries 201403 14.42 84.41 158.46 0.41 -73.65 35.35 14.96 -123.96 0.53 -124.49 -124.49 -17.26 0
Murli Industries 201406 14.42 53.37 51.52 0.13 1.98 31.63 14.58 -44.24 -50.63 -44.24 -7.02 0
MVL 201312 60.12 9.60 0.53 7.76 2.36 1.75 0.10 0.51 0.15 0.36 0.36 0.01 0
MVL 201403 60.12 36.38 0.20 27.59 8.99 9.32 0.23 5.08 -0.03 5.11 5.11 0.09 0
MVL 201406 60.12 16.10 0.62 12.92 3.80 3.31 0.16 0.74 0.17 0.58 0.58 0.01 0
Nahar Industrial Enterprises 201309 39.84 446.22 0.08 358.19 1.33 89.44 26.56 28.17 34.72 11.50 23.22 23.22 5.83 10
Nahar Industrial Enterprises 201312 39.84 463.16 3.21 383.70 1.41 84.08 22.47 30.95 30.66 9.70 20.96 20.96 5.26 10
Nahar Industrial Enterprises 201403 39.84 472.11 13.64 422.20 2.17 65.71 25.48 33.29 6.94 4.83 2.12 2.12 0.53 10
Nahar Industrial Enterprises 201406 39.84 485.57 4.58 435.17 2.27 57.25 27.86 35.81 -6.41 -1.01 -5.40 -5.40 -1.36 10
Nakoda 201309 150.00 782.04 1.29 738.63 1.21 45.91 14.58 7.27 24.06 4.81 19.24 19.24 0.64 6
Nakoda 201312 150.00 812.58 1.31 765.86 6.22 54.26 20.49 9.23 24.55 4.91 19.63 19.63 0.65 6
Nakoda 201403 150.00 792.72 0.72 804.54 1.55 -9.55 36.86 8.84 -55.24 -55.24 -55.24 -1.84 6
Nakoda 201406 150.00 414.36 7.96 437.40 5.50 -9.59 47.75 9.10 -66.43 -66.43 -66.43 -2.21 6
NAM Securities 201312 3.05 0.16 0.13 0.00 0.04 0.00 0.02 0.02 0.00 0.02 0.02 0.22 0
NAM Securities 201406 3.05 0.17 0.10 0.07 0.02 0.04 0.04 0.04 0.60 0
Narbada Gems And Jewellery 201309 5.39 1.47 1.44 0.03 0.00 0.02 0.02 0.02 0.04 0
Narbada Gems And Jewellery 201312 5.39 9.79 9.34 0.45 0.01 0.44 0.05 0.39 0.39 0.73 0
Narbada Gems And Jewellery 201403 5.39 1.93 1.76 0.17 0.01 0.17 0.05 0.11 0.11 0
Narbada Gems And Jewellery 201406 5.39 3.61 3.58 0.03 0.00 0.02 0.01 0.02 0.02 0.03 0

Co_Name Year Equity N.Sale O.O.I T. Exp O.I PBIDT Int. Dep. PBT T.Tax PAT A.PAT EPS Div (%)
Exp
ecte
d R
esu
lts
on
14
No
vem
ber
201
4
Narendra Properties 201309 7.11 0.18 0.15 -0.03 0.01 -0.04 -0.04 -0.04 -0.05 0
Narendra Properties 201312 7.11 0.01 0.20 0.14 -0.05 0.01 -0.06 -0.06 -0.06 -0.08 0
Narendra Properties 201403 7.11 0.01 0.17 1.26 1.09 0.00 0.01 1.08 0.30 0.78 0.78 1.10 0
Narendra Properties 201406 7.11 0.33 0.16 0.02 0.20 0.01 0.19 0.05 0.14 0.14 0.19 0
National Aluminium Company 201309 1288.62 1710.09 28.14 1470.60 122.84 390.47 128.57 261.90 82.73 179.17 179.17 0.70 30
National Aluminium Company 201312 1288.62 1620.96 22.91 1439.56 120.77 325.08 130.75 194.33 63.30 131.03 131.03 0.51 30
National Aluminium Company 201403 1268.62 1781.21 56.99 1528.97 135.39 444.62 140.94 254.31 81.86 172.45 172.45 0.67 30
National Aluminium Company 201406 1288.62 1651.29 28.75 1403.55 190.36 466.85 0.00 95.51 371.34 100.35 270.99 270.99 1.05 30
National Fittings 201309 8.32 8.85 7.31 0.22 1.76 0.16 0.18 1.43 0.74 0.69 0.69 0.83 10
National Fittings 201312 8.32 9.10 7.65 0.04 1.50 0.19 0.18 1.13 0.53 0.61 0.61 0.73 10
National Fittings 201403 8.32 12.13 9.61 0.10 2.62 0.13 0.18 2.31 0.79 1.52 1.52 1.82 10
National Fittings 201406 8.32 9.49 7.66 0.20 2.03 0.19 0.29 1.54 0.56 0.99 0.99 1.19 10
Natraj Proteins 201309 3.75 96.24 0.09 94.90 0.18 1.60 0.29 0.21 1.10 0.63 0.47 0.47 1.26 0
Natraj Proteins 201312 3.75 90.95 0.04 87.27 0.01 3.74 0.56 0.22 2.96 0.93 2.02 2.02 5.40 0
Natraj Proteins 201403 3.75 109.05 0.05 101.86 0.31 7.55 1.38 0.17 6.00 2.22 3.78 3.78 10.09 0
Natraj Proteins 201406 3.75 72.64 0.07 69.94 0.02 2.79 1.52 0.20 1.07 0.25 0.82 0.82 2.18 0
NB Footwear 201309 13.50 0.06 -0.06 -0.06 -0.06 -0.06 -0.04 0
NB Footwear 201312 13.50 0.04 -0.04 -0.04 -0.04 -0.04 -0.03 0
NB Footwear 201403 13.50 0.04 -0.04 -0.04 -0.04 -0.04 -0.03 0
NB Footwear 201406 13.50 0.05 -0.05 -0.05 -0.05 -0.05 -0.04 0
NCL Industries 201309 34.94 93.13 0.25 83.99 0.02 9.40 11.04 7.22 -8.86 1.04 -9.90 -9.90 -2.83 0
NCL Industries 201312 34.94 113.76 0.09 101.89 -0.15 11.81 10.41 7.79 -6.39 0.36 -6.75 -6.75 -1.93 0
NCL Industries 201403 34.94 121.07 -0.81 118.62 0.81 2.45 10.11 7.77 -10.71 1.15 -11.86 -11.86 -3.39 0
NCL Industries 201406 34.94 95.83 -0.10 99.67 0.04 -3.89 7.81 7.44 -19.14 0.10 -19.24 -19.24 -5.51 0
NCL Research & Financial Services 201309 5.82 1.15 0.19 0.02 0.98 0.02 0.95 0.95 0.95 1.64 0
NCL Research & Financial Services 201312 5.82 1.39 0.14 -0.01 1.24 0.02 1.22 1.22 1.22 2.09 0
NCL Research & Financial Services 201403 5.82 29.39 30.81 -1.41 0.02 -1.44 0.42 -1.86 -1.86 -3.19 0
NCL Research & Financial Services 201406 5.82 1.33 0.25 1.08 0.01 1.06 1.06 1.06 1.82 0
Neha International 201309 28.38 22.97 0.67 22.38 1.25 1.23 0.35 -0.32 0.14 -0.46 -0.35 -0.12 0
Neha International 201312 28.38 20.42 0.12 18.67 1.87 1.05 0.50 0.32 0.05 0.27 0.38 0.13 0
Neha International 201403 28.38 52.76 0.15 50.78 2.12 1.22 0.41 0.49 0.28 0.21 0.33 0.12 0
Neha International 201406 28.38 79.57 0.15 78.90 0.83 1.01 0.68 -0.87 0.08 -0.94 -0.80 -0.28 0
Nelcast 201309 17.40 125.24 112.04 0.20 13.40 1.05 2.93 9.42 4.10 5.33 5.33 0.61 35
Nelcast 201312 17.40 127.44 115.49 0.77 12.72 0.86 3.52 8.34 2.87 5.48 5.48 0.63 35
Nelcast 201403 17.40 126.24 116.26 1.16 11.15 3.50 7.65 2.67 4.99 4.99 0.57 35
Nelcast 201406 17.40 132.38 121.89 0.27 10.76 1.36 3.11 6.29 2.18 4.11 4.11 0.47 35

Co_Name Year Equity N.Sale O.O.I T. Exp O.I PBIDT Int. Dep. PBT T.Tax PAT A.PAT EPS Div (%)
Exp
ecte
d R
esu
lts
on
14
No
vem
ber
201
4
Neogem India 201309 7.88 10.81 0.32 10.70 0.04 0.47 0.26 0.03 0.18 0.07 0.12 0.12 0.15 0
Neogem India 201312 7.88 26.12 0.05 25.96 -0.01 0.20 0.36 0.03 -0.19 -0.06 -0.13 -0.13 0
Neogem India 201403 7.88 33.89 0.26 34.06 0.00 0.10 0.27 0.03 -0.22 -0.12 -0.10 -0.10 0
Neogem India 201406 7.88 20.46 19.98 0.48 0.35 0.03 0.10 0.03 0.07 0.07 0.09 0
Net 4 India 201309 20.06 45.76 -10.79 64.59 0.28 -29.34 3.16 8.67 -78.18 -0.63 -77.55 -74.36 -45.32 0
Net 4 India 201312 20.06 20.97 -1.34 123.89 9.87 -94.40 1.92 8.21 -128.91 -1.13 -127.78 -124.34 -61.99 0
Net 4 India 201403 20.06 24.22 151.24 -1.47 -128.49 18.14 8.08 -154.70 -17.84 -136.85 -136.38 -63.71 0
Net 4 India 201406 20.06 13.34 37.22 0.34 -23.54 1.38 5.06 -29.97 -8.62 -21.36 -20.16 -10.05 0
Networth Stock Broking 201309 11.23 3.92 3.36 0.27 0.83 0.71 0.35 -0.35 -0.04 -0.30 -0.30 -0.27 0
Networth Stock Broking 201312 11.23 3.85 3.97 0.52 0.40 0.52 0.36 -0.48 -0.05 -0.43 -0.43 -0.38 0
Networth Stock Broking 201403 11.23 4.83 3.81 0.00 1.02 0.67 0.35 -0.01 0.16 -0.17 -0.17 -0.15 0
Networth Stock Broking 201406 11.23 5.45 4.72 0.19 0.91 0.54 0.27 0.15 0.01 0.14 0.14 0.12 0
New Markets Advisory 201309 1.24 0.00 0.01 0.02 0.01 0.01 0.00 0.01 0.01 0
New Markets Advisory 201312 1.24 0.02 0.02 0.00 0.00 0.00 0.00 0
New Markets Advisory 201403 1.24 0.04 0.02 -0.02 0.00 -0.02 -0.02 -0.02 0
New Markets Advisory 201406 1.24 0.02 0.05 0.03 0.03 0.01 0.02 0.02 0.18 0
NHC Foods 201309 5.79 29.73 0.67 29.52 0.23 1.11 0.58 0.25 0.28 0.04 0.24 0.24 0.42 0
NHC Foods 201312 5.79 34.91 0.70 34.80 0.34 1.16 0.43 0.25 0.48 0.20 0.27 0.27 0.98 0
NHC Foods 201403 7.70 44.79 0.51 43.86 0.19 1.63 0.53 0.25 0.85 0.20 0.65 0.65 1.08 0
NHC Foods 201406 7.70 34.84 1.06 35.20 0.61 1.31 0.40 0.30 0.61 0.10 0.51 0.51 0.66 0
Nikhil Adhesives 201309 3.91 57.78 0.37 55.60 0.00 2.56 1.34 0.60 -1.56 -1.56 -1.56 -3.99 0
Nikhil Adhesives 201312 3.91 62.50 0.26 58.68 0.02 4.10 1.56 0.61 0.66 0.66 0.66 1.67 0
Nikhil Adhesives 201403 3.91 64.46 0.24 61.92 0.16 2.94 1.42 0.62 0.96 0.11 0.85 0.85 2.18 0
Nikhil Adhesives 201406 3.91 64.47 0.21 62.53 0.25 2.40 1.54 0.51 0.36 0.04 0.32 0.32 0.81 0
Nila Infrastructures 201309 29.52 21.16 15.92 0.84 6.07 2.10 0.23 3.74 1.20 2.54 2.54 0.09 10
Nila Infrastructures 201312 29.52 21.18 16.20 0.90 5.88 2.58 0.24 3.06 1.13 1.93 1.93 0.07 10
Nila Infrastructures 201403 29.52 32.99 0.00 24.28 0.65 9.36 1.21 0.23 7.92 2.92 5.00 5.00 0.17 10
Nila Infrastructures 201406 29.52 27.59 22.68 0.99 5.91 2.39 0.35 3.17 1.13 2.05 2.05 0.07 10
Nilkanth Engineering 201309 1.25 0.04 0.06 0.02 0.02 0.10 0.00 0.10 0.01 0.09 0.09 0.71 0
Nilkanth Engineering 201312 1.25 0.04 0.01 0.01 0.03 0.06 0.00 0.06 0.01 0.05 0.05 0.39 0
Nilkanth Engineering 201403 1.25 0.04 0.01 0.03 0.03 0.05 0.00 0.05 0.01 0.03 0.03 0.26 0
Nilkanth Engineering 201406 1.25 0.06 0.02 0.03 0.04 0.09 0.00 0.09 0.02 0.07 0.07 0.57 0
Nimbus Foods Industries 201309 7.31 3.31 3.05 0.01 0.28 0.05 0.23 0.23 0.23 0.03 0
Nimbus Foods Industries 201312 7.31 4.60 4.39 0.01 0.22 0.00 0.05 0.17 0.17 0.17 0.02 0
Nimbus Foods Industries 201403 7.31 4.32 0.03 4.36 0.24 0.23 0.10 0.07 0.06 0.22 -0.15 -0.15 -0.02 0
Nimbus Foods Industries 201406 7.31 2.74 2.52 0.01 0.22 0.07 0.05 0.10 0.10 0.10 0

Co_Name Year Equity N.Sale O.O.I T. Exp O.I PBIDT Int. Dep. PBT T.Tax PAT A.PAT EPS Div (%)
Exp
ecte
d R
esu
lts
on
14
No
vem
ber
201
4
Nirav Commercials 201309 0.39 1.97 1.92 0.13 0.19 0.01 0.02 0.16 0.05 0.11 0.11 0
Nirav Commercials 201312 0.39 1.65 1.71 0.16 0.10 0.01 0.02 0.08 0.03 0.05 0.05 0
Nirav Commercials 201403 0.39 2.53 2.40 0.07 0.19 0.00 0.02 0.17 0.05 0.12 0.12 0
Nirav Commercials 201406 0.39 2.90 2.74 0.06 0.22 0.01 0.02 0.19 0.19 0.19 0
Nissan Copper 201309 62.86 1.77 9.88 0.00 -8.11 5.23 3.37 -16.70 -1.13 -15.57 -15.57 -2.48 0
Nissan Copper 201312 62.86 0.57 2.00 0.69 -0.74 3.36 -4.10 1.09 -5.19 -5.19 -0.83 0
Nissan Copper 201403 62.86 0.01 183.85 3.74 -180.10 3.29 -183.39 0.00 -183.39 -183.39 -29.18 0
Nissan Copper 201406 62.86 0.29 1.50 -1.21 0.05 2.84 -4.10 0.00 -4.10 -4.10 -0.65 0
Nivedita Mercantile & Financing 201309 7.30 4.33 3.90 0.43 0.43 0.24 0.19 0.19 0.37 5
Nivedita Mercantile & Financing 201312 7.30 3.69 2.64 1.05 1.05 0.40 0.65 0.65 0.89 5
Nivedita Mercantile & Financing 201403 9.91 3.32 2.74 0.54 1.13 1.13 0.39 0.74 0.74 1.40 5
Nivedita Mercantile & Financing 201406 9.91 3.34 2.46 1.94 2.82 2.82 0.65 2.16 2.16 2.18 5
Northward Technologies 201309 3.55 0.16 0.17 -0.01 -0.01 -0.01 -0.01 -0.03 0
Northward Technologies 201312 3.55 0.08 0.10 -0.02 0.01 -0.03 -0.03 -0.03 -0.08 0
Northward Technologies 201403 3.55 0.06 0.22 -0.17 0.01 -0.17 -0.17 -0.17 -0.49 0
Northward Technologies 201406 3.55 0.00 0.10 0.00 -0.10 0.00 0.01 -0.11 0.00 -0.11 -0.11 -0.30 0
Nouveau Global Ventures 201309 18.55 0.53 0.09 0.38 0.01 0.25 0.01 0.03 0.21 0.06 0.14 0.14 0.08 0
Nouveau Global Ventures 201312 18.55 1.63 0.09 1.65 0.01 0.07 0.01 0.03 0.03 0.01 0.02 0.02 0.01 0
Nouveau Global Ventures 201403 18.55 5.13 0.15 5.34 -0.05 0.08 0.03 -0.17 -0.07 -0.10 -0.10 -0.06 0
Nouveau Global Ventures 201406 18.55 0.24 0.12 0.41 0.01 -0.06 0.01 0.03 -0.09 -0.09 -0.09 -0.05 0
NTC Industries 201309 10.75 5.64 0.00 3.80 0.53 2.37 0.26 0.30 1.81 -0.32 2.13 2.13 1.98 0
NTC Industries 201312 10.75 3.93 0.00 3.36 0.18 0.76 0.31 0.32 0.12 0.12 0.12 0.11 0
NTC Industries 201403 10.75 9.10 0.00 9.46 0.25 -0.11 0.21 0.37 -0.69 0.91 -1.59 -1.59 -1.48 0
NTC Industries 201406 10.75 8.00 0.01 7.01 0.18 1.18 0.17 0.32 0.69 0.69 0.69 0.64 0
Nu Tek India 201309 77.26 37.93 35.77 0.05 2.21 0.99 1.89 -0.67 -0.67 -0.67 -0.04 0
Nu Tek India 201312 77.26 29.49 30.05 1.22 0.66 0.98 1.75 -2.07 0.01 -2.08 -2.08 -0.13 0
Nu Tek India 201403 77.26 37.55 48.49 0.37 -10.57 1.04 1.89 -13.53 -0.31 -13.21 -13.21 -0.86 0
Nu Tek India 201406 77.26 24.07 20.92 0.09 3.24 0.88 1.78 0.58 0.17 0.41 0.41 0.03 0
Nutraplus India 201309 5.90 13.02 10.71 0.02 2.33 0.35 0.40 1.58 0.40 1.18 1.18 2.01 0
Nutraplus India 201312 5.90 15.83 14.14 0.02 1.71 0.35 0.41 0.95 0.34 0.61 0.61 1.04 0
Nutraplus India 201403 5.90 19.57 14.63 0.03 4.97 2.36 0.41 2.20 1.03 1.17 1.17 1.99 0
Nutraplus India 201406 5.90 17.46 14.94 0.04 2.56 0.74 0.52 1.31 0.28 1.03 1.03 1.74 0
OCL Iron and Steel 201309 13.41 95.00 1.30 91.39 4.91 2.01 2.55 0.35 0.05 0.30 0.30 0.02 0
OCL Iron and Steel 201312 13.41 134.38 128.75 5.97 11.59 2.94 3.49 5.16 1.70 3.46 3.46 0.26 0
OCL Iron and Steel 201403 13.41 269.87 238.22 0.93 32.58 25.37 10.00 -2.79 -0.97 -1.82 -1.82 -0.23 0
OCL Iron and Steel 201406 13.41 346.42 306.72 2.05 41.76 28.24 13.43 0.09 0.06 0.04 0.04 0

Co_Name Year Equity N.Sale O.O.I T. Exp O.I PBIDT Int. Dep. PBT T.Tax PAT A.PAT EPS Div (%)
Exp
ecte
d R
esu
lts
on
14
No
vem
ber
201
4
Odyssey Corporation 201309 19.70 0.01 0.28 2.37 2.10 0.00 0.02 2.08 2.08 2.08 0.53 0
Odyssey Corporation 201312 19.70 0.14 0.84 0.25 -0.45 0.00 0.02 -0.47 -0.47 -0.47 -0.12 0
Odyssey Corporation 201403 19.70 0.12 2.21 0.97 -1.12 0.00 0.02 -1.14 -0.94 -0.20 -0.20 -0.05 0
Odyssey Corporation 201406 19.70 0.05 0.12 0.60 0.53 0.00 0.02 0.51 0.51 0.51 0.13 0
Oil & Natural Gas Corporation 201309 4277.76 22311.98 102.69 12381.82 1482.97 11515.82 0.09 2426.50 9089.23 3025.37 6063.86 6063.86 7.09 190
Oil & Natural Gas Corporation 201312 4277.76 20744.66 107.58 10344.44 2662.33 13170.13 0.02 2588.36 10581.75 3455.78 7125.97 7125.97 8.33 190
Oil & Natural Gas Corporation 201403 4277.76 20880.93 432.16 12127.22 1371.83 10557.70 0.04 3580.35 6977.31 2088.31 4889.00 4889.00 5.71 190
Oil & Natural Gas Corporation 201406 4277.76 21747.00 104.27 12987.00 895.18 9759.45 0.13 2562.31 7197.01 2415.22 4781.79 4781.79 5.59 190
Ojas Asset Reconstruction Company 201406 21.25 0.06 0.06 0.00 0.00 0.00 0.00 0.00 0.00 0.00 0.02 0
OK Play India 201309 16.98 29.73 0.18 23.08 6.83 2.20 1.55 1.07 1.07 1.07 0.63 0
OK Play India 201312 16.98 28.49 21.94 6.55 2.38 1.58 3.82 3.82 3.82 1.93 0
OK Play India 201403 17.08 25.04 0.04 24.95 0.13 1.69 1.29 -1.58 4.78 -6.36 -6.36 -3.72 0
OK Play India 201406 17.08 18.46 15.61 2.85 1.71 1.64 -0.55 -0.55 -0.55 -3.19 0
Olympia Capitals 201309 7.20 0.21 0.00 0.21 0.01 0.20 0.20 0.20 0.28 0
Olympia Capitals 201312 7.20 0.00 0.00 0.00 0.00 0.00 0
Olympia Capitals 201403 7.20 0.01 -0.01 -0.01 -0.01 -0.01 -0.01 0
Olympia Capitals 201406 7.20 0.00 0.00 0.00 0.00 0.00 0
Olympia Industries 201309 2.10 0.06 0.06 0.16 0.06 0.03 0.05 -0.02 -0.02 -0.02 -0.04 0
Olympia Industries 201312 2.10 1.78 0.06 1.92 0.05 -0.03 0.05 -0.08 -0.08 -0.08 -0.43 0
Olympia Industries 201403 3.06 4.45 0.08 4.05 0.05 0.53 0.06 0.48 0.48 0.48 1.57 0
Olympia Industries 201406 3.06 12.79 0.06 12.14 0.05 0.76 0.06 0.05 0.64 0.64 0.64 2.13 0
Olympic Oil Industries 201309 2.85 893.88 891.53 2.16 4.51 2.49 0.04 1.99 0.67 1.32 1.32 4.62 0
Olympic Oil Industries 201312 2.85 444.54 441.88 0.55 3.20 1.56 0.06 1.59 0.48 1.11 1.11 3.89 0
Olympic Oil Industries 201403 2.85 360.39 349.95 0.42 10.86 4.96 0.06 5.85 2.29 3.55 3.55 12.44 0
Olympic Oil Industries 201406 2.85 431.27 426.50 0.06 4.82 1.65 0.15 3.02 1.00 2.02 2.02 7.08 0
Om Metals Infraprojects 201309 9.63 42.90 0.44 38.83 5.25 9.76 2.20 1.97 5.58 0.65 4.93 4.93 0.51 20
Om Metals Infraprojects 201312 9.63 97.43 0.69 82.34 4.04 19.83 2.14 1.99 15.70 4.57 11.13 11.13 1.16 20
Om Metals Infraprojects 201403 9.63 64.05 7.46 64.24 13.60 20.88 1.71 1.82 17.36 1.05 16.31 16.31 1.69 20
Om Metals Infraprojects 201406 9.63 71.80 0.57 68.58 11.41 15.20 3.74 1.65 9.81 9.81 9.81 1.02 20
Omega Ag-Seeds (Punjab) 201309 7.90 0.10 0.12 0.04 0.02 0.00 0.02 0.01 0.01 0.01 0.02 0
Omega Ag-Seeds (Punjab) 201312 7.90 0.11 0.13 0.06 0.04 0.00 0.04 0.01 0.03 0.03 0.03 0
Omega Ag-Seeds (Punjab) 201403 7.90 0.12 0.24 0.05 -0.06 0.00 -0.06 -0.01 -0.05 -0.05 -0.07 0
Omega Ag-Seeds (Punjab) 201406 7.90 0.13 0.17 0.05 0.01 0.00 0.01 0.00 0.01 0.01 0.01 0
Omnitech Infosolutions 201309 15.01 89.58 0.04 97.14 1.82 -5.70 8.89 15.02 -50.64 3.11 -53.74 -50.85 -33.89 15
Omnitech Infosolutions 201312 15.01 49.93 0.08 51.11 2.16 1.06 10.96 17.12 -27.02 1.95 -28.97 -27.66 -18.43 15
Omnitech Infosolutions 201403 15.01 28.73 0.99 67.40 0.58 -37.09 5.57 16.69 -75.48 4.20 -79.68 -79.44 -52.94 15
Omnitech Infosolutions 201406 15.01 21.11 24.38 4.21 0.94 8.69 17.48 -25.23 1.65 -26.73 -26.64 -17.97 15

Co_Name Year Equity N.Sale O.O.I T. Exp O.I PBIDT Int. Dep. PBT T.Tax PAT A.PAT EPS Div (%)
Exp
ecte
d R
esu
lts
on
14
No
vem
ber
201
4
Omnitex Industries (India) 201309 4.23 0.03 0.08 0.05 0.02 0.04 0.01 0.03 0.03 0.06 0
Omnitex Industries (India) 201312 4.23 0.02 0.08 0.06 0.02 0.04 0.01 0.03 0.03 0.07 0
Omnitex Industries (India) 201403 4.23 0.02 0.08 0.06 0.02 0.02 -0.06 0.08 0.08 0.19 0
Omnitex Industries (India) 201406 4.23 0.02 0.06 0.04 0.04 0.01 0.00 0.00 0.00 0.01 0
Onelife Capital Advisors 201309 13.36 0.27 0.25 -0.01 0.00 -0.02 -0.02 -0.02 -0.01 0
Onelife Capital Advisors 201312 13.36 0.13 0.25 0.12 0.00 0.12 0.02 0.10 0.10 0.07 0
Onelife Capital Advisors 201403 13.36 0.30 0.20 -0.10 0.00 -0.10 -0.02 -0.08 -0.08 -0.06 0
Onelife Capital Advisors 201406 13.36 0.15 0.62 0.47 0.01 0.46 0.09 0.38 0.38 0.28 0
Optiemus Infracom 201309 85.81 1127.05 4.57 1101.21 0.30 30.71 6.37 1.84 22.50 7.65 14.85 14.85 1.73 0
Optiemus Infracom 201312 85.81 1048.67 4.02 1026.18 9.66 36.17 11.54 4.94 19.69 6.74 12.95 12.95 1.51 0
Optiemus Infracom 201403 85.81 916.35 2.65 903.12 14.81 30.69 13.57 4.45 16.00 4.73 11.27 11.27 1.31 0
Optiemus Infracom 201406 85.81 578.69 4.97 557.99 0.46 26.13 9.28 7.88 8.97 3.12 5.85 5.85 0.65 0
Opto Circuits (India) 201309 242.32 369.97 0.15 276.55 8.11 101.68 33.06 22.33 52.91 9.53 43.38 44.00 1.82 0
Opto Circuits (India) 201312 242.32 354.33 0.08 301.34 6.17 59.24 37.66 16.96 5.87 10.16 -4.29 -6.79 -0.28 0
Opto Circuits (India) 201403 242.32 278.33 0.07 239.75 27.66 66.31 42.80 13.27 0.05 -1.60 1.65 2.65 0.11 0
Opto Circuits (India) 201406 242.32 313.34 0.15 247.45 3.20 69.24 36.02 23.09 10.13 1.77 8.35 9.39 0.39 0
Oricon Enterprises 201309 20.50 206.23 0.39 189.80 6.24 23.06 3.13 9.91 10.02 3.82 6.20 2.87 0.25 22
Oricon Enterprises 201312 20.51 225.01 0.30 208.77 6.67 23.20 3.67 10.23 9.30 3.97 5.33 2.22 0.18 22
Oricon Enterprises 201403 20.51 216.35 0.29 187.78 7.89 36.75 4.63 10.29 20.70 8.00 12.71 6.92 0.64 22
Oricon Enterprises 201406 20.51 243.04 0.35 220.52 7.02 29.88 3.62 8.95 17.31 6.34 10.97 6.06 0.56 22
Oriental Veneer Products 201309 5.39 16.79 16.76 0.50 0.53 0.13 0.19 0.20 0.08 0.12 0.12 0.22 0
Oriental Veneer Products 201312 5.39 20.64 20.80 0.70 0.54 0.05 0.21 0.28 0.08 0.19 0.19 0.36 0
Oriental Veneer Products 201403 5.39 17.57 16.20 1.11 2.49 2.16 0.18 0.15 0.10 0.05 0.05 0.10 0
Oriental Veneer Products 201406 5.39 17.68 17.40 0.37 0.65 0.12 0.20 0.34 0.12 0.22 0.22 0.40 0
Ortin Laboratories 201309 16.94 19.12 2.22 19.30 0.09 2.12 0.93 0.38 0.82 0.27 0.55 0.55 0.32 0
Ortin Laboratories 201312 16.94 9.41 3.46 11.56 0.04 1.36 0.87 0.38 0.11 0.05 0.07 0.07 0.04 0
Ortin Laboratories 201403 16.94 14.00 2.85 16.02 0.31 1.15 0.94 0.38 0.04 -0.06 0.10 0.10 0.06 0
Pacific Industries 201309 1.35 22.28 0.32 19.00 0.93 4.52 0.17 0.80 3.56 0.72 2.83 2.83 20.96 0
Pacific Industries 201312 1.35 18.50 0.40 15.98 0.25 3.16 0.25 0.99 1.93 0.39 1.54 1.54 11.38 0
Pacific Industries 201403 1.35 18.95 0.08 17.22 -0.05 1.75 0.15 0.78 0.83 0.20 0.60 0.63 4.46 0
Pacific Industries 201406 1.35 18.74 0.14 16.63 1.49 3.75 0.32 1.48 1.95 0.39 1.53 1.56 11.35 0
Padmalaya Telefilms 201309 17.00 0.60 0.01 0.46 0.15 0.00 0.50 -0.36 -0.36 -0.36 -0.21 0
Padmalaya Telefilms 201312 17.00 0.62 0.54 0.08 0.50 -0.42 -0.42 -0.42 -0.25 0
Padmalaya Telefilms 201403 17.00 0.65 0.01 0.49 0.17 0.50 -0.33 -0.53 0.20 0.20 0.12 0
Padmalaya Telefilms 201406 17.00 0.54 0.01 0.43 0.12 0.50 -0.39 -0.39 -0.39 -0.23 0

Co_Name Year Equity N.Sale O.O.I T. Exp O.I PBIDT Int. Dep. PBT T.Tax PAT A.PAT EPS Div (%)
Exp
ecte
d R
esu
lts
on
14
No
vem
ber
201
4
Palred Technologies 201309 19.52 35.71 31.80 1.13 5.04 0.50 0.43 4.11 1.66 2.45 2.45 0.63 580
Palred Technologies 201312 19.52 5.95 1.79 -4.16 0.01 0.01 162.41 33.77 128.63 128.63 32.95 580
Palred Technologies 201403 19.48 0.37 1.55 2.02 0.83 0.01 0.03 -0.19 0.00 -0.19 -0.19 -0.05 580
Palred Technologies 201406 19.52 0.64 1.39 1.58 0.84 0.00 0.05 0.78 0.78 0.78 0.20 580
Pan India Corporation 201309 214.26 0.00 0.00 0.08 -0.08 0.02 -0.10 -0.10 -0.10 0
Pan India Corporation 201312 214.26 0.04 -0.04 0.02 -0.06 -0.06 -0.06 0.00 0
Pan India Corporation 201403 214.26 2.30 -2.30 0.02 -2.32 -0.02 -2.30 -2.30 -0.11 0
Pan India Corporation 201406 214.26 0.13 -0.13 0.00 -0.14 -0.14 -0.14 -0.01 0
Panama Petrochem 201309 8.45 135.88 128.58 0.26 7.57 1.75 0.63 5.19 0.04 5.15 5.15 6.06 60
Panama Petrochem 201312 8.40 140.58 132.10 0.96 9.44 1.55 0.61 7.29 2.59 4.70 4.70 5.57 60
Panama Petrochem 201403 8.07 180.63 176.43 4.32 8.53 1.23 0.65 6.66 2.31 4.34 4.34 5.42 60
Panama Petrochem 201406 8.07 196.97 185.77 0.22 11.41 1.60 0.70 9.11 2.43 6.69 6.69 8.29 60
Panchmahal Steel 201309 19.08 74.43 2.78 78.16 0.21 -0.74 2.40 1.68 -3.22 -1.22 -1.99 -1.99 -1.03 0
Panchmahal Steel 201312 19.08 82.86 1.90 80.71 0.98 5.03 2.58 1.85 0.61 0.20 0.42 0.42 0.22 0
Panchmahal Steel 201403 19.08 95.36 2.09 92.30 2.24 7.38 2.41 1.89 3.08 1.01 2.07 2.07 1.08 0
Panchmahal Steel 201406 19.08 103.88 1.43 97.38 0.20 8.13 2.47 1.72 3.94 1.28 2.66 2.66 1.39 0
Parabolic Drugs 201309 61.89 113.91 3.21 112.85 4.27 19.59 16.99 -32.31 -9.99 -22.32 -22.32 -3.61 0
Parabolic Drugs 201312 61.89 108.07 6.35 112.86 1.56 19.93 17.03 -35.40 -10.94 -24.46 -24.46 -3.95 0
Parabolic Drugs 201403 61.89 112.05 7.51 196.65 -77.09 23.55 17.02 -117.66 -29.67 -61.01 -87.99 -9.86 0
Parabolic Drugs 201406 61.89 109.64 0.84 109.15 1.33 18.14 17.23 -34.04 -10.52 -23.52 -23.52 -3.80 0
Paragon Finance 201309 4.25 1.57 0.59 -0.09 0.89 0.55 0.05 0.28 0.08 0.20 0.20 0.48 0
Paragon Finance 201312 4.25 1.25 0.65 0.14 0.74 0.26 0.05 0.42 0.11 0.32 0.32 0.75 0
Paragon Finance 201403 4.25 0.95 0.68 0.21 0.48 0.39 0.05 0.03 0.01 0.03 0.03 0.06 0
Paragon Finance 201406 4.25 1.23 0.04 0.69 0.37 0.94 0.50 0.03 0.41 0.01 0.40 0.40 0.93 0
Paramount Cosmetics (India) 201309 4.86 12.19 11.19 0.04 1.04 0.51 0.14 0.39 0.14 0.25 0.25 0.52 6
Paramount Cosmetics (India) 201312 4.86 10.49 9.49 0.04 1.04 0.47 0.15 0.42 0.13 0.29 0.29 0.59 6
Paramount Cosmetics (India) 201403 4.86 12.96 11.54 0.06 1.48 0.43 0.18 0.87 0.22 0.65 0.65 1.33 6
Paramount Cosmetics (India) 201406 4.86 12.00 10.93 0.04 1.11 0.51 0.12 0.48 0.17 0.31 0.31 0.64 6
Parenteral Drugs (India) 201309 25.87 73.98 1.92 69.21 6.69 15.46 4.55 -13.32 0.41 -13.73 -13.73 -5.31 0
Parenteral Drugs (India) 201312 29.82 60.29 1.66 61.05 0.90 15.59 4.57 -19.26 0.52 -19.78 -19.78 -6.63 0
Parenteral Drugs (India) 201403 29.82 58.72 0.48 94.14 -34.94 14.98 4.95 -52.50 9.97 -62.46 -62.46 -20.95 0
Parenteral Drugs (India) 201406 29.82 77.11 0.05 74.45 2.71 16.52 5.75 -19.57 0.92 -20.49 -20.49 -6.87 0
Parnax Lab 201309 8.51 16.54 0.37 13.99 2.92 0.90 0.52 1.51 1.51 1.50 1.77 0
Parnax Lab 201312 8.51 18.37 0.12 16.32 2.16 0.88 0.54 0.74 0.74 0.74 0.87 0
Parnax Lab 201403 8.51 21.67 0.28 20.16 1.79 1.09 0.54 -0.07 -0.07 -0.08 -0.09 0
Parnax Lab 201406 8.51 21.19 0.11 18.74 2.56 1.08 0.58 0.90 0.90 0.89 1.05 0

Co_Name Year Equity N.Sale O.O.I T. Exp O.I PBIDT Int. Dep. PBT T.Tax PAT A.PAT EPS Div (%)
Exp
ecte
d R
esu
lts
on
14
No
vem
ber
201
4
Parsvnath Developers 201309 217.59 161.03 1.43 53.18 5.07 114.36 81.07 4.04 29.25 14.99 14.26 12.51 0.29 0
Parsvnath Developers 201312 217.59 118.64 0.67 54.35 1.42 66.39 40.77 3.10 22.51 10.98 11.53 11.00 0.25 0
Parsvnath Developers 201403 217.59 89.38 0.79 90.31 7.77 7.63 47.54 2.93 -42.84 -16.12 -26.73 -22.84 -0.52 0
Parsvnath Developers 201406 217.59 95.56 0.78 42.57 4.59 58.36 44.41 2.36 11.59 5.47 6.12 6.15 0.14 0
Pasupati Spinning & Weaving Mills 201309 9.34 50.64 0.59 47.42 3.81 1.78 0.82 1.21 1.21 1.21 1.30 0
Pasupati Spinning & Weaving Mills 201312 9.34 58.68 2.19 56.96 3.91 1.57 0.88 1.46 1.46 1.46 1.56 0
Pasupati Spinning & Weaving Mills 201403 9.34 54.46 0.19 52.37 2.28 2.22 0.88 -0.82 0.05 -1.86 -0.87 -1.98 0
Pasupati Spinning & Weaving Mills 201406 9.34 49.86 1.07 47.50 3.43 1.65 1.01 0.77 0.29 0.48 0.48 0.51 0
Patel Engineering 201309 6.98 725.44 0.26 593.82 33.64 165.52 142.24 14.08 9.20 2.98 6.22 6.22 0.89 0
Patel Engineering 201312 6.98 516.07 451.26 48.05 112.86 96.19 13.03 3.64 1.18 2.46 2.46 0.35 0
Patel Engineering 201403 7.62 876.76 9.57 795.51 39.40 130.22 94.15 13.13 22.94 6.93 16.01 16.01 2.10 0
Patel Engineering 201406 7.68 518.01 5.21 421.55 33.77 135.44 120.90 13.50 1.04 0.33 0.71 0.71 0.09 0
Pearl Agriculture 201309 21.68 3.31 3.12 0.01 0.21 0.21 0.00 0.21 0.21 0.14 0
Pearl Agriculture 201312 21.68 0.02 0.06 -0.04 -0.04 -0.04 -0.04 -0.03 0
Pearl Agriculture 201403 21.68 6.84 0.06 7.11 -0.21 0.01 0.00 -0.22 0.04 -0.26 -0.26 -0.13 0
Pearl Agriculture 201406 21.68 0.20 0.06 0.14 0.14 0.04 0.10 0.10 0.04 0
Pearl Electronics 201309 19.77 0.08 0.08 0.04 0.04 0.04 0.01 0.03 0.03 0.02 0
Pearl Electronics 201312 19.77 0.11 0.08 0.03 0.03 0.01 0.02 0.02 0.01 0
Pearl Electronics 201403 19.77 0.08 0.23 0.10 0.21 0.21 0.07 0.14 0.14 0.07 0
Pearl Electronics 201406 19.77 0.28 0.06 0.22 0.22 0.07 0.15 0.15 0.08 0
Pearl Global Industries 201309 21.66 1240.06 14.69 1225.16 5.17 34.76 9.66 7.39 17.71 4.77 12.94 10.30 4.75 20
Pearl Global Industries 201312 21.66 1059.14 18.98 1078.74 15.25 14.63 10.07 7.72 -3.15 3.26 -6.41 -4.83 -2.23 20
Pearl Global Industries 201403 21.66 1285.34 25.87 1283.18 19.22 47.24 11.32 7.44 23.68 -5.92 29.60 26.74 12.34 20
Pearl Global Industries 201406 21.66 227.54 9.95 227.45 5.57 15.61 6.35 4.06 5.28 -0.10 5.37 5.38 2.49 20
Pee Cee Cosma Sope 201309 2.65 18.77 17.69 0.01 1.09 0.08 0.19 0.83 0.26 0.57 0.57 2.10 12
Pee Cee Cosma Sope 201312 2.65 19.33 18.67 0.00 0.66 0.13 0.16 0.38 0.12 0.25 0.25 1.00 12
Pee Cee Cosma Sope 201403 2.65 16.21 15.96 0.06 0.31 0.20 0.18 -0.07 0.03 -0.10 -0.10 -0.40 12
Pee Cee Cosma Sope 201406 2.65 23.08 22.15 0.03 0.96 0.18 0.15 0.63 0.19 0.44 0.44 1.70 12
Perfect-Octave Media Projects 201309 34.01 3.41 3.37 0.03 0.06 0.00 0.06 0.06 0.06 0.02 0
Perfect-Octave Media Projects 201312 34.01 3.07 3.04 0.03 0.03 0.03 0.03 0.01 0
Perfect-Octave Media Projects 201403 34.01 4.13 5.15 -1.02 2.72 -3.73 -0.88 -2.86 -2.86 -0.08 0
Perfect-Octave Media Projects 201406 34.01 3.05 3.06 0.00 0.66 -0.67 -0.67 -0.67 0
PG Electroplast 201309 16.41 47.62 0.33 47.92 1.99 2.02 2.87 2.67 -3.52 -3.52 -3.52 -2.15 0
PG Electroplast 201312 16.41 45.91 0.63 48.45 1.00 -0.91 2.92 2.71 -6.82 -6.82 -6.82 -4.16 0
PG Electroplast 201403 16.41 66.36 0.11 69.42 1.38 -1.58 3.06 3.23 -7.87 -7.87 -7.87 -4.79 0
PG Electroplast 201406 16.41 62.94 0.41 59.75 1.21 4.81 2.69 3.22 -1.22 -1.22 -1.22 -0.75 0

Co_Name Year Equity N.Sale O.O.I T. Exp O.I PBIDT Int. Dep. PBT T.Tax PAT A.PAT EPS Div (%)
Exp
ecte
d R
esu
lts
on
14
No
vem
ber
201
4
Phaarmasia 201309 6.83 4.87 4.56 0.31 0.00 0.20 0.10 0.03 0.07 0.07 0.11 0
Phaarmasia 201312 6.83 2.36 2.26 0.10 0.20 -0.11 -0.11 -0.11 0
Phaarmasia 201403 6.83 2.97 0.00 2.83 0.14 0.02 0.10 0.03 0.02 0.01 0.01 0.01 0
Phaarmasia 201406 6.83 2.94 2.76 0.18 0.00 0.08 0.10 0.03 0.07 0.07 0.09 0
Photoquip (India) 201309 4.80 18.93 16.75 0.15 2.33 0.51 0.43 1.39 0.52 0.88 0.88 1.82 0
Photoquip (India) 201312 4.80 23.48 22.17 0.01 1.33 0.58 0.46 0.29 0.06 0.24 0.24 0.49 0
Photoquip (India) 201403 4.80 26.43 29.89 0.33 -3.13 0.72 0.41 -4.27 -0.87 -3.40 -3.40 -7.08 0
Photoquip (India) 201406 4.80 25.74 0.17 25.64 0.04 0.30 0.47 0.48 -0.65 -0.17 -0.49 -0.49 -1.02 0
Piccadily Agro Industries 201309 23.59 81.00 1.48 74.05 0.68 9.11 1.66 2.42 5.02 2.03 2.99 2.99 1.27 0
Piccadily Agro Industries 201312 23.59 70.36 -0.23 61.18 0.83 9.77 1.46 2.47 5.85 1.90 3.95 3.95 1.67 0
Piccadily Agro Industries 201403 23.59 98.12 -1.72 81.11 0.87 16.15 2.16 2.48 11.51 5.07 6.44 6.44 2.73 0
Piccadily Agro Industries 201406 23.59 103.16 2.09 89.41 1.06 16.90 3.04 2.59 11.27 3.97 7.30 7.30 3.10 0
Piccadily Sugar & Allied Industries 201309 23.22 3.23 0.05 3.03 0.00 0.25 0.08 0.59 -0.43 -0.24 -0.19 -0.19 -0.08 0
Piccadily Sugar & Allied Industries 201312 23.22 3.61 0.16 2.82 0.00 0.95 0.07 0.41 0.46 0.14 0.32 0.32 0.14 0
Piccadily Sugar & Allied Industries 201403 23.22 3.64 0.62 3.78 0.00 0.48 0.07 0.40 0.05 -0.07 0.11 0.11 0.05 0
Piccadily Sugar & Allied Industries 201406 23.22 2.61 0.15 2.58 0.00 0.18 0.07 0.41 -0.30 -0.12 -0.18 -0.18 -0.08 0
Pine Animation 201309 27.70 19.65 19.60 0.09 0.14 0.00 0.14 0.04 0.10 0.10 0.01 0
Pine Animation 201312 27.70 7.01 7.55 0.71 0.18 0.00 0.18 0.05 0.12 0.12 0.01 0
Pine Animation 201403 27.70 34.32 34.47 0.53 0.37 0.00 0.37 0.12 0.26 0.26 0.01 0
Pine Animation 201406 27.70 2.93 3.19 0.41 0.16 0.16 0.05 0.11 0.11 0.04 0
Pipavav Defence and Offshore Engineering Company 201309 736.21 804.78 2.69 660.45 8.19 155.20 107.93 39.98 7.29 2.75 4.54 4.54 0.06 0
Pipavav Defence and Offshore Engineering Company 201312 736.21 314.03 4.05 204.71 21.67 135.05 101.99 40.02 -6.96 -2.20 -4.77 -4.77 -0.06 0
Pipavav Defence and Offshore Engineering Company 201403 736.21 449.10 1.59 310.56 13.93 154.06 95.88 42.20 15.99 14.68 1.31 1.31 0.02 0
Pipavav Defence and Offshore Engineering Company 201406 736.21 315.53 0.94 175.97 12.00 152.50 94.70 50.38 7.42 1.86 5.56 5.56 0.08 0
PlanterS Polysacks 201309 1.40 1.32 1.35 0.04 0.01 0.01 0.00 0.00 0.00 0.04 0
PlanterS Polysacks 201312 1.40 0.04 0.05 0.01 0.01 0.00 0.01 0.01 0.04 0
PlanterS Polysacks 201403 1.40 0.00 0.00 0
PlanterS Polysacks 201406 1.40 0.02 -0.02 -0.02 -0.02 -0.02 -0.12 0
Poddar Developers 201309 5.21 10.38 0.64 7.16 -1.03 2.84 0.01 0.13 2.68 0.95 1.72 1.73 3.31 15
Poddar Developers 201312 5.21 25.07 3.22 25.24 0.21 3.26 0.01 0.12 3.26 1.11 2.15 2.15 4.13 15
Poddar Developers 201403 5.21 5.27 -0.05 3.27 0.25 2.22 0.02 0.16 2.02 0.97 1.05 1.07 2.05 15
Poddar Developers 201406 5.21 51.33 4.63 41.12 0.33 15.17 0.01 0.32 15.23 5.03 10.20 10.20 19.61 15
Polson 201309 0.61 31.34 1.19 27.87 4.66 1.67 0.67 2.32 0.59 1.73 1.73 142.98 0
Polson 201312 0.60 22.11 0.99 19.55 3.56 1.95 0.75 0.86 0.28 0.58 0.58 47.92 0
Polson 201403 0.60 22.19 0.54 18.76 3.97 1.96 0.53 1.48 0.87 0.61 0.61 50.73 0
Polson 201406 0.60 23.64 0.51 20.54 0.50 4.11 1.57 0.63 1.91 0.63 1.28 1.28 106.67 0

Co_Name Year Equity N.Sale O.O.I T. Exp O.I PBIDT Int. Dep. PBT T.Tax PAT A.PAT EPS Div (%)
Exp
ecte
d R
esu
lts
on
14
No
vem
ber
201
4
Polytex India 201309 13.50 0.06 -0.06 0.01 -0.07 -0.07 -0.07 -0.05 0
Polytex India 201312 13.50 0.12 0.00 -0.12 0.01 -0.13 -0.13 -0.13 -0.09 0
Polytex India 201403 13.50 0.60 0.14 0.46 0.01 0.46 0.28 0.18 0.18 0.13 0
Polytex India 201406 13.50 0.22 0.13 0.09 0.00 0.08 0.08 0.08 0.06 0
Pooja Entertainment & Films 201309 3.60 0.00 0.41 0.05 -0.36 0.45 0.00 -0.82 -0.82 -0.82 -2.27 0
Pooja Entertainment & Films 201312 3.60 0.57 0.00 -0.57 0.79 0.00 -1.37 -1.37 -1.37 -3.79 0
Pradip Overseas 201309 48.44 282.23 280.72 1.88 3.38 70.78 4.19 -71.58 -16.83 -54.75 -54.75 0
Pradip Overseas 201312 48.44 167.99 185.99 1.28 -16.72 34.68 2.14 -53.54 49.57 -103.11 -103.11 0
Pradip Overseas 201403 48.44 148.35 138.33 2.27 12.29 25.18 2.07 -14.96 -3.17 -11.79 -11.79 0
Pradip Overseas 201406 48.44 147.82 151.18 1.64 -1.72 28.94 2.12 -32.78 -1.56 -31.22 -31.22 0
Prag Bosimi Synthetics 201309 74.19 0.41 0.09 2.55 -2.05 2.99 1.36 -6.40 -6.40 -6.40 -0.86 0
Prag Bosimi Synthetics 201312 74.19 0.38 0.01 1.75 -1.37 2.71 1.37 -5.44 -5.44 -5.44 -0.73 0
Prag Bosimi Synthetics 201403 74.19 0.22 1.46 -1.24 3.61 1.34 -6.18 -6.18 -6.18 -0.83 0
Prag Bosimi Synthetics 201406 74.19 0.24 0.01 1.19 -0.95 2.53 1.35 -4.82 -4.82 -4.82 -0.65 0
Prajay Engineers Syndicate 201309 69.94 15.88 17.22 1.96 0.61 0.35 0.83 -0.57 0.05 -0.62 -0.62 -0.09 0
Prajay Engineers Syndicate 201312 69.94 18.98 22.41 1.38 -2.06 0.14 0.73 -3.71 0.09 -3.79 -3.79 -0.54 0
Prajay Engineers Syndicate 201403 69.94 21.75 23.11 1.73 0.38 0.24 1.18 -1.47 -2.92 1.45 1.45 0.21 0
Prajay Engineers Syndicate 201406 69.94 11.40 12.37 0.57 -0.40 0.14 1.30 -1.59 -1.18 -0.42 -0.42 -0.06 0
Prakash Industries 201309 134.49 568.56 488.07 0.58 81.07 14.68 29.66 36.73 3.52 33.21 33.21 2.47 10
Prakash Industries 201312 134.49 670.58 589.79 0.45 81.24 15.13 30.10 36.01 1.48 34.53 34.53 2.57 10
Prakash Industries 201403 134.49 717.02 591.74 2.08 127.36 13.87 29.76 83.73 21.37 62.36 62.36 4.64 10
Prakash Industries 201406 134.49 811.01 695.21 1.13 116.93 13.87 24.02 79.04 12.73 66.31 66.31 4.93 10
Pratibha Industries 201309 20.21 555.65 3.84 484.15 7.90 83.24 67.04 10.03 6.18 5.34 0.85 0.85 0.08 10
Pratibha Industries 201312 20.21 555.50 4.60 480.58 5.42 84.93 58.59 12.26 14.08 5.79 8.28 8.28 0.82 10
Pratibha Industries 201403 20.21 620.19 5.63 537.64 7.35 95.53 69.11 12.69 13.72 7.63 6.09 6.09 0.60 10
Pratibha Industries 201406 20.21 690.71 6.18 597.43 4.05 103.51 73.31 13.03 17.18 6.15 11.03 11.03 1.09 10
Pratiksha Chemicals 201309 5.57 1.71 1.58 0.00 0.14 0.05 0.08 0.01 0.01 0.01 0.02 0
Pratiksha Chemicals 201312 5.57 1.59 1.47 0.00 0.13 0.04 0.08 0.01 0.01 0.01 0.01 0
Pratiksha Chemicals 201403 5.57 1.58 0.02 1.42 0.17 0.06 0.12 -0.01 -0.01 -0.01 -0.03 0
Pratiksha Chemicals 201406 5.57 2.65 2.48 0.00 0.18 0.07 0.08 0.03 0.03 0.03 0.05 0
Premier Pipes 201309 3.55 6.18 5.82 0.00 0.36 0.15 0.11 0.11 0.03 0.07 0.07 0.21 0
Premier Pipes 201312 3.55 7.07 6.70 0.00 0.37 0.16 0.11 0.10 0.03 0.07 0.07 0.19 0
Premier Pipes 201403 3.55 8.55 9.19 1.16 0.51 0.33 0.12 0.05 -0.03 0.08 0.08 0.24 0
Premier Pipes 201406 3.55 8.04 7.71 0.04 0.37 0.17 0.11 0.08 0.03 0.06 0.06 0.16 0
Pressman Advertising 201309 4.70 10.15 8.86 0.14 1.43 0.04 2.00 2.00 2.00 0.60 50
Pressman Advertising 201312 4.70 9.13 8.66 0.58 1.05 0.04 1.01 1.01 1.01 0.43 50
Pressman Advertising 201403 4.70 8.91 8.29 0.34 0.96 0.04 0.92 -0.57 1.49 1.49 0.63 50
Pressman Advertising 201406 4.70 8.77 8.03 0.53 1.28 0.03 1.25 1.25 1.25 0.53 50

Co_Name Year Equity N.Sale O.O.I T. Exp O.I PBIDT Int. Dep. PBT T.Tax PAT A.PAT EPS Div (%)
Exp
ecte
d R
esu
lts
on
14
No
vem
ber
201
4
Prime Capital Market 201309 10.00 0.16 0.03 0.13 0.13 0.13 0.13 0.13 0
Prime Capital Market 201312 10.00 0.08 0.04 0.04 0.04 0.04 0.04 0.04 0
Prime Capital Market 201403 10.00 -0.04 0.02 -0.07 -0.07 0.13 -0.19 -0.19 -0.19 0
Prime Capital Market 201406 10.00 0.15 0.03 0.00 0.12 0.00 0.12 0.00 0.12 0.12 0.12 0
Prime Focus 201309 18.54 196.06 149.03 24.43 71.46 13.05 28.44 29.56 5.51 24.05 21.34 1.15 0
Prime Focus 201312 18.54 213.68 168.88 5.72 50.51 16.28 25.17 8.94 0.93 8.01 10.33 0.56 0
Prime Focus 201403 18.54 235.51 1.09 194.24 -2.17 40.19 10.76 27.68 0.92 9.30 -8.38 -7.16 -0.39 0
Prime Focus 201406 18.54 199.01 0.29 185.09 10.31 24.52 17.50 29.44 -31.24 -16.15 -15.09 -8.78 -0.47 0
Prime Property Development Corporation 201309 10.00 0.45 0.61 0.17 0.07 0.10 0.10 0.10 0.05 0
Prime Property Development Corporation 201312 10.00 0.51 0.54 0.03 0.05 0.07 -0.09 -0.15 0.06 0.06 0.03 0
Prime Property Development Corporation 201403 10.00 5.01 2.21 0.85 3.65 0.11 0.07 3.47 -1.21 4.68 4.68 2.34 0
Prime Property Development Corporation 201406 10.00 22.59 11.12 0.70 12.17 0.04 12.13 5.40 6.73 6.73 3.36 0
Provogue (India) 201309 11.44 153.24 6.64 143.55 2.36 18.69 8.90 2.10 7.69 1.65 6.03 6.03 0.53 0
Provogue (India) 201312 11.44 158.05 3.59 144.37 1.71 18.97 9.07 2.15 9.48 2.85 6.63 6.63 0.58 0
Provogue (India) 201403 11.44 172.40 3.96 171.48 0.12 4.99 9.69 1.88 -22.08 -5.80 -16.28 -16.28 -1.42 0
Provogue (India) 201406 11.44 114.50 3.09 125.54 0.74 -7.21 10.29 2.17 -19.67 -0.16 -19.52 -19.52 -1.71 0
PS IT Infrastructure & Services 201309 53.76 10.34 10.40 0.89 0.83 0.00 0.83 0.83 0.83 0.15 0
PS IT Infrastructure & Services 201312 53.76 9.80 9.79 -0.25 -0.24 -0.24 -0.24 -0.24 -0.05 0
PS IT Infrastructure & Services 201403 53.76 17.76 17.66 -0.51 -0.40 -0.40 0.33 -0.73 -0.73 -0.14 0
PS IT Infrastructure & Services 201406 53.76 16.39 16.41 0.27 0.25 0.25 0.25 0.25 0.05 0
PSL 201309 53.33 115.55 4.11 535.86 131.16 -285.04 23.25 -308.29 -308.29 -308.29 -57.81 0
PSL 201312 53.33 69.69 8.05 123.74 -46.00 2.55 44.68 -93.23 -93.23 -93.23 -17.48 0
PSL 201403 53.33 109.93 20.99 118.64 9.56 21.84 15.65 44.76 -48.91 -48.91 -48.91 -9.17 0
PSL 201406 53.33 37.63 5.78 61.18 -17.77 5.00 43.44 -66.21 -66.21 -66.21 -12.42 0
PTC India 201309 296.01 3140.16 3072.30 18.91 86.77 0.33 1.09 85.34 23.50 61.84 61.84 2.09 20
PTC India 201312 296.01 2613.22 138.25 2635.86 15.36 130.97 0.23 1.01 133.94 43.16 90.78 90.78 3.06 20
PTC India 201403 296.01 2795.19 53.43 2753.97 11.96 106.61 1.83 1.05 103.84 34.93 68.91 68.91 2.33 20
PTC India 201406 296.01 3689.05 0.49 3631.98 9.29 66.85 0.07 0.97 65.81 22.07 43.74 43.76 1.48 20
Punj Lloyd 201309 66.42 2860.59 271.03 2821.08 3.17 313.71 215.06 92.07 6.58 4.34 2.24 -67.08 -2.02 0
Punj Lloyd 201312 66.42 2710.76 63.33 2629.78 15.28 159.59 203.41 100.38 -144.20 -3.98 -140.22 -139.48 -4.20 0
Punj Lloyd 201403 66.42 2359.39 39.28 2532.92 6.75 -127.50 267.83 113.16 -508.49 -10.49 -498.00 -382.08 -11.50 0
Punj Lloyd 201406 66.42 1107.47 6.36 1365.99 8.74 -243.42 215.39 79.79 -538.60 -174.68 -363.92 -363.92 -10.96 0
Punjab Chemicals & Crop Protection 201309 12.26 116.51 1.50 105.99 7.40 19.42 8.36 3.90 7.16 7.16 7.16 5.84 0
Punjab Chemicals & Crop Protection 201312 12.26 129.74 2.75 114.92 0.86 18.43 8.41 3.61 6.41 0.07 6.34 6.34 5.17 0
Punjab Chemicals & Crop Protection 201403 12.26 74.12 1.88 72.17 1.64 5.47 7.70 3.56 -9.17 -0.07 -9.10 -9.10 -7.42 0
Punjab Chemicals & Crop Protection 201406 12.26 96.88 3.51 89.38 2.11 13.12 8.46 4.58 0.08 0.08 0.08 0.07 0

Co_Name Year Equity N.Sale O.O.I T. Exp O.I PBIDT Int. Dep. PBT T.Tax PAT A.PAT EPS Div (%)
Exp
ecte
d R
esu
lts
on
14
No
vem
ber
201
4
Qpro Infotech 201309 6.50 0.00 0.00 0.00 0.00 0.00 0.00 0.00 0.00 0.00 0
Qpro Infotech 201312 6.50 0.00 0.00 0.00 0.00 0.00 0.00 0.00 0.00 0.00 0
Qpro Infotech 201403 6.50 0.01 -0.01 -0.01 -0.01 -0.01 -0.01 0
Qpro Infotech 201406 6.50 0.01 -0.01 -0.01 -0.01 -0.01 0
Quadrant Televentures 201309 612.26 99.76 155.99 0.63 -55.60 6.83 32.77 -95.20 -95.20 -95.20 -1.55 0
Quadrant Televentures 201312 612.26 107.67 133.08 0.61 -24.80 6.81 31.38 -62.99 -62.99 -62.99 -1.03 0
Quadrant Televentures 201403 612.26 106.47 133.95 0.62 -26.86 6.70 31.64 -65.20 -65.20 -65.20 -1.07 0
Quadrant Televentures 201406 612.26 117.73 138.79 0.79 -20.27 6.76 34.39 -61.43 -61.43 -61.43 -1.01 0
Quantum Digital Vision (India) 201309 3.04 0.26 -0.26 0.10 -0.36 -0.36 -0.36 -2.48 0
Quantum Digital Vision (India) 201312 3.04 0.20 -0.20 0.11 -0.30 -0.30 -0.30 -2.08 0
Quantum Digital Vision (India) 201403 3.04 0.00 0.00 0.69 1.23 0.54 0.00 0.11 0.43 0.43 0.43 1.42 0
Quantum Digital Vision (India) 201406 3.04 0.18 0.50 0.33 0.10 0.23 0.23 0.23 0.74 0
Quest Softech (India) 201309 10.00 0.00 0.03 0.00 -0.03 0.00 0.08 -0.11 -0.01 -0.10 -0.10 -0.10 0
Quest Softech (India) 201312 10.00 0.00 0.00 0.08 -0.08 -0.01 -0.07 -0.07 -0.07 0
Quest Softech (India) 201403 10.00 0.10 0.01 0.09 0.08 0.01 0.01 -0.03 0
Quest Softech (India) 201406 10.00 0.02 -0.02 0.08 -0.09 -0.02 -0.08 -0.08 -0.07 0
Raaj Medisafe India 201309 5.00 0.03 -0.03 0.05 -0.08 -0.08 -0.08 -0.15 0
Raaj Medisafe India 201312 5.00 0.04 0.06 -0.02 0.00 0.05 -0.13 -0.13 -0.13 -0.26 0
Raaj Medisafe India 201403 5.00 0.02 0.12 -0.09 0.05 0.05 -0.19 -0.19 -0.19 -0.38 0
Raaj Medisafe India 201406 5.00 0.14 -0.14 0.00 0.04 -0.17 -0.19 -0.17 -0.38 0
Radaan Mediaworks India 201309 10.83 7.11 0.28 6.73 0.66 0.31 0.15 0.20 0.20 0.20 0.04 0
Radaan Mediaworks India 201312 10.83 6.69 0.43 6.57 0.55 0.27 0.15 0.13 0.13 0.13 0.02 0
Radaan Mediaworks India 201403 10.83 7.89 0.07 7.12 0.85 0.28 0.17 0.39 -0.13 0.52 0.52 0.10 0
Radaan Mediaworks India 201406 10.83 8.60 0.01 7.98 0.64 0.22 0.17 0.24 0.24 0.24 0.04 0
Radha Madhav Corporation 201309 32.54 4.65 29.19 0.35 -24.19 0.02 3.68 -27.89 0.00 -27.89 -27.89 -8.57 0
Radha Madhav Corporation 201312 32.54 3.88 12.52 0.02 -8.62 0.01 3.68 -12.31 -12.31 -12.31 -3.78 0
Radha Madhav Corporation 201403 32.54 3.97 18.17 0.09 -14.11 0.01 3.60 -32.10 -32.10 -32.10 -9.87 0
Radha Madhav Corporation 201406 55.04 3.97 6.81 0.13 -2.71 0.01 1.32 -4.72 -4.72 -4.72 -1.14 0
Radhe Developers (India) 201309 25.18 0.21 0.00 -0.21 0.05 0.04 -0.29 -0.29 -0.29 -0.12 0
Radhe Developers (India) 201312 25.18 0.15 0.38 0.01 -0.23 0.05 0.04 -0.32 -0.32 -0.32 -0.13 0
Radhe Developers (India) 201403 25.18 -0.17 0.00 0.18 0.06 0.04 0.08 -0.01 -0.01 0.10 0
Radhe Developers (India) 201406 25.18 0.31 0.00 -0.30 0.05 0.09 -0.44 -0.44 -0.44 -0.18 0
Raghunath International 201309 5.00 0.13 0.10 -0.03 0.02 0.02 -0.07 -0.03 -0.03 -0.04 -0.05 0
Raghunath International 201312 5.00 0.70 0.55 0.10 0.25 0.02 0.02 0.21 0.06 0.16 0.16 0.31 0
Raghunath International 201403 5.00 0.24 0.11 -0.14 0.03 0.01 -0.18 -0.06 -0.12 -0.12 -0.23 0
Raghunath International 201406 5.00 0.12 0.10 -0.02 0.02 0.01 -0.05 -0.02 -0.04 -0.04 0.07 0

Co_Name Year Equity N.Sale O.O.I T. Exp O.I PBIDT Int. Dep. PBT T.Tax PAT A.PAT EPS Div (%)
Exp
ecte
d R
esu
lts
on
14
No
vem
ber
201
4
Rainbow Papers 201309 19.74 268.36 0.92 229.85 4.32 43.75 16.53 11.37 15.85 15.85 15.85 1.61 20
Rainbow Papers 201312 19.79 288.90 2.56 241.70 0.06 49.82 17.59 12.60 19.63 19.63 19.63 1.98 20
Rainbow Papers 201403 19.79 322.51 2.26 273.60 1.12 52.29 17.90 13.09 21.30 9.70 11.60 11.60 1.17 20
Rainbow Papers 201406 21.24 287.38 1.14 240.85 2.27 49.94 19.47 9.71 20.92 20.92 20.92 2.10 20
Raj Irrigation Pipes & Fittings 201309 3.10 0.03 0.02 0.00 0.00 0.00 0.00 0.01 0
Raj Irrigation Pipes & Fittings 201312 3.10 0.00 0.00 0.00 0.00 0.00 -0.01 0
Raj Irrigation Pipes & Fittings 201403 3.10 0.08 -0.08 -0.08 -0.08 -0.08 -0.24 0
Raj Irrigation Pipes & Fittings 201406 3.10 0.01 0.01 0.00 0.00 0.00 0.00 0.01 0
Raj Oil Mills 201309 71.01 17.07 22.69 -0.20 -5.82 1.50 1.07 -8.38 -2.92 -5.46 -5.46 -0.08 0
Raj Oil Mills 201312 71.01 15.35 19.60 0.21 -4.04 0.90 1.11 -6.05 -2.36 -3.69 -3.69 -0.52 0
Raj Oil Mills 201403 71.01 17.39 19.28 0.44 -1.44 0.76 1.08 -268.42 7.94 -276.37 -276.37 -38.92 0
Raj Oil Mills 201406 71.01 13.99 17.82 -3.83 0.17 1.09 -5.09 -5.09 -5.09 -0.72 0
Raj Rayon Industries 201309 26.65 154.66 1.03 193.19 0.81 -36.69 13.99 11.33 -62.01 -20.20 -41.81 -41.81 -1.57 0
Raj Rayon Industries 201312 26.65 87.57 0.83 103.00 0.53 -14.07 14.63 11.19 -39.89 -13.04 -26.86 -26.86 -1.01 0
Raj Rayon Industries 201403 26.65 40.06 0.49 47.72 0.87 -6.31 11.54 3.00 -20.85 -5.02 -15.83 -15.83 -0.59 0
Raj Rayon Industries 201406 26.65 10.67 0.01 14.06 6.12 2.74 15.84 9.30 -22.40 -7.09 -15.32 -15.32 -0.57 0
Rajesh Exports 201309 29.53 6440.57 6211.77 0.07 228.87 127.86 0.55 100.46 100.46 100.46 3.40 100
Rajesh Exports 201312 29.53 5022.99 4850.13 0.05 172.92 80.71 0.54 91.67 91.67 91.67 3.10 100
Rajesh Exports 201403 29.53 12230.47 12008.34 0.51 222.64 103.57 14.78 104.29 44.40 59.34 59.90 2.00 100
Rajesh Exports 201406 29.53 7905.05 7655.13 2.14 252.06 119.24 14.47 118.35 118.35 118.35 4.00 100
Rajesh Solvex 201309 5.50 0.00 1.28 1.26 0.00 0.02 0.18 0.04 -0.19 -0.19 -0.19 -0.35 0
Rajesh Solvex 201312 5.50 0.08 1.57 1.40 0.25 0.17 0.04 0.05 0.05 0.05 0.16 0
Rajesh Solvex 201403 5.50 1.30 1.65 2.38 0.00 0.57 0.10 0.05 0.42 0.00 0.42 0.42 0.76 0
Rajesh Solvex 201406 5.50 0.03 1.96 1.52 0.01 0.48 0.19 0.04 0.25 0.25 0.25 0.44 0
Rajkamal Synthetics 201309 6.50 0.02 -0.02 -0.02 -0.02 -0.02 -0.02 0
Rajkamal Synthetics 201312 6.50 0.04 0.01 0.03 0.03 0.03 0.03 0
Rajkamal Synthetics 201403 6.50 0.02 0.01 0.01 0.01 0.00 0.01 0.01 0.01 0
Rajkamal Synthetics 201406 6.50 0.03 -0.03 -0.03 -0.03 -0.03 -0.04 0
Rajvir Industries 201309 3.04 67.08 0.68 59.36 0.71 9.11 5.49 2.99 0.63 0.09 0.54 0.54 1.78 0
Rajvir Industries 201312 3.04 45.43 0.31 44.20 0.27 1.80 5.74 3.00 -6.94 -1.62 -5.33 -5.33 -17.56 0
Rajvir Industries 201403 3.04 17.03 0.38 43.39 12.55 -13.43 6.54 3.00 -22.97 -7.98 -14.99 -14.99 -49.40 0
Rajvir Industries 201406 3.04 27.27 0.43 22.77 0.30 5.22 5.68 2.64 -3.10 -1.03 -2.07 -2.07 -6.82 0
Ram Informatics 201309 6.28 2.75 2.54 0.00 0.21 0.03 0.08 0.09 0.09 0.09 0.15 0
Ram Informatics 201312 6.28 2.62 2.48 0.04 0.18 0.01 0.08 0.08 0.08 0.08 0.13 0
Ram Informatics 201403 6.28 2.24 1.66 0.02 0.60 0.02 0.09 0.49 0.49 0.49 0.79 0
Ram Informatics 201406 6.28 2.42 2.07 0.01 0.36 0.01 0.09 0.25 0.25 0.25 0.40 0

Co_Name Year Equity N.Sale O.O.I T. Exp O.I PBIDT Int. Dep. PBT T.Tax PAT A.PAT EPS Div (%)
Exp
ecte
d R
esu
lts
on
14
No
vem
ber
201
4
Rama Phosphates 201309 17.69 184.09 181.89 0.14 2.33 2.93 1.19 -1.80 -1.80 -1.80 -1.02 5
Rama Phosphates 201312 17.69 138.50 140.90 0.13 -2.27 2.14 1.17 -5.58 2.09 -5.58 1.18 5
Rama Phosphates 201403 17.69 123.72 0.07 123.37 1.23 1.65 1.93 0.65 -0.93 -1.16 0.23 0.23 0.13 5
Rama Phosphates 201406 17.69 90.64 0.15 89.95 0.84 2.40 0.79 -2.35 -2.35 -2.35 -1.33 5
Rama Vision 201309 10.03 8.53 0.00 8.32 0.00 0.21 0.07 0.10 0.04 0.02 0.02 0.02 0.02 0
Rama Vision 201312 10.03 8.82 8.28 0.00 0.54 0.07 0.10 0.37 0.12 0.26 0.26 0.26 0
Rama Vision 201403 10.03 8.39 0.01 8.03 0.00 0.38 0.05 0.10 0.23 0.09 0.14 0.14 0.14 0
Rama Vision 201406 10.03 9.78 9.33 0.01 0.46 0.07 0.11 0.28 0.09 0.19 0.19 0.19 0
Ramgopal Polytex 201309 14.40 2.59 2.98 0.81 0.41 0.17 0.01 0.23 0.07 0.16 0.16 0.11 0
Ramgopal Polytex 201312 14.40 3.60 3.55 0.67 0.73 0.16 0.01 0.56 0.11 0.45 0.45 0.31 0
Ramgopal Polytex 201403 14.40 2.49 2.58 0.64 0.55 0.13 0.01 0.41 0.11 0.29 0.29 0.20 0
Ramgopal Polytex 201406 14.40 10.30 10.43 0.51 0.38 0.07 0.01 0.30 0.06 0.24 0.24 0.17 0
Rana Sugars 201309 153.54 65.94 0.51 72.98 -6.54 15.82 0.60 -22.95 -22.97 -22.95 -1.50 0
Rana Sugars 201312 153.54 117.37 0.43 83.64 34.16 26.23 16.36 -8.43 -8.45 -8.43 -0.55 0
Rana Sugars 201403 153.54 320.41 8.04 268.91 59.54 20.95 15.60 22.99 -5.56 28.46 28.54 1.85 0
Rana Sugars 201406 153.54 77.24 0.35 68.78 8.81 18.87 0.62 -10.68 -10.68 -10.68 -0.70 0
Rap Media 201309 5.88 0.46 0.28 0.00 0.18 0.09 0.09 0.09 0.09 0.15 0
Rap Media 201312 5.88 0.46 0.33 0.00 0.13 0.09 0.05 0.05 0.05 0.08 0
Rap Media 201403 5.88 0.46 0.75 0.00 -0.29 0.09 -0.38 0.00 -0.38 -0.38 -0.65 0
Rap Media 201406 5.88 0.46 0.27 0.00 0.19 0.09 0.10 0.10 0.10 0.18 0
Rasandik Engineering Industries India 201309 4.73 49.12 0.02 40.86 0.09 8.38 4.58 3.57 0.24 0.04 0.19 0.19 0.41 0
Rasandik Engineering Industries India 201312 4.73 45.57 0.01 43.03 0.09 2.63 3.81 3.53 -4.71 -0.11 -4.60 -4.60 -9.74 0
Rasandik Engineering Industries India 201403 4.73 51.14 -0.09 47.39 0.30 3.96 3.55 3.79 -3.38 -2.04 -1.33 -1.33 -2.82 0
Rasandik Engineering Industries India 201406 4.73 52.31 0.00 46.39 0.23 6.14 3.19 3.61 -0.65 -0.65 -0.65 -1.38 0
Rasi Electrodes 201309 4.76 5.22 0.05 4.86 0.08 0.48 0.14 0.09 0.26 0.10 0.16 0.16 0.33 0
Rasi Electrodes 201312 4.76 5.17 0.04 4.97 0.10 0.34 0.14 0.09 0.11 0.02 0.09 0.09 0.19 0
Rasi Electrodes 201403 4.76 5.26 0.05 4.87 -0.03 0.40 0.13 0.14 0.13 0.06 0.08 0.08 0.16 0
Rasi Electrodes 201406 4.97 5.07 0.02 4.64 0.08 0.53 0.10 0.08 0.35 0.10 0.25 0.25 0.51 0
Rasoya Proteins 201309 170.89 290.46 3.04 273.61 0.46 20.35 9.55 2.53 8.27 1.43 6.84 6.84 0.33 0
Rasoya Proteins 201312 170.89 668.64 4.05 636.43 0.87 37.13 11.53 2.94 22.67 4.43 18.23 18.23 0.11 0
Rasoya Proteins 201403 170.89 413.99 8.43 401.94 5.67 26.15 11.22 2.67 12.27 -5.29 17.55 17.55 0.10 0
Rasoya Proteins 201406 170.89 373.09 1.90 339.73 0.07 35.32 10.11 2.55 22.66 2.83 19.83 19.83 0.12 0
Rathi Graphic Technologies 201309 16.44 103.66 95.22 0.06 8.50 3.67 1.04 3.79 0.76 3.03 1.79 1.09 0
Rathi Graphic Technologies 201312 16.44 115.10 106.05 0.10 9.15 3.82 1.13 4.20 0.93 3.27 1.86 1.13 0
Rathi Graphic Technologies 201403 16.44 100.00 91.41 0.53 9.12 3.59 0.95 4.59 1.86 2.73 1.02 0.62 0
Rathi Graphic Technologies 201406 16.44 127.99 118.01 0.08 10.05 3.73 1.45 4.88 1.02 3.86 2.41 1.47 0

Co_Name Year Equity N.Sale O.O.I T. Exp O.I PBIDT Int. Dep. PBT T.Tax PAT A.PAT EPS Div (%)
Exp
ecte
d R
esu
lts
on
14
No
vem
ber
201
4
Rathi Steel & Power 201309 31.31 95.53 105.95 0.88 -9.55 10.65 5.61 -25.80 -25.80 -25.80 0
Rathi Steel & Power 201312 31.31 104.78 117.12 0.21 -12.14 14.22 -4.47 -21.89 -21.89 -21.89 0
Rathi Steel & Power 201403 31.31 151.91 166.90 0.44 -14.56 12.76 2.25 -29.58 -27.63 -1.94 -1.94 -4.06 0
Rathi Steel & Power 201406 31.31 101.78 102.73 0.12 -0.84 12.52 2.66 -16.01 -16.01 -16.01 -5.11 0
Redex Protech 201309 6.72 0.01 0.07 0.01 0.07 0.01 0.06 0.02 0.05 0.05 0.07 0
Redex Protech 201312 6.72 0.01 0.07 0.01 0.07 0.01 0.06 0.01 0.05 0.05 0.07 0
Redex Protech 201403 6.72 0.01 0.07 0.03 0.05 0.01 0.04 0.01 0.03 0.03 0.04 0
Redex Protech 201406 6.72 0.01 0.07 0.02 0.06 0.01 0.05 0.01 0.04 0.04 0.05 0
Refnol Resins & Chemicals 201309 3.09 3.89 0.00 3.82 0.00 0.09 0.31 0.04 -0.27 -0.27 -0.27 -0.86 0
Refnol Resins & Chemicals 201312 3.09 4.16 0.02 4.12 0.00 0.06 0.25 0.04 -0.23 -0.23 -0.23 -0.73 0
Refnol Resins & Chemicals 201403 3.09 3.85 0.02 4.04 0.02 -0.14 0.25 0.05 -0.99 -0.99 -0.99 -3.21 0
Refnol Resins & Chemicals 201406 3.09 4.76 0.01 4.55 0.00 0.22 0.22 0.04 -0.04 -0.04 -0.04 -0.14 0
Regal Entertainment & Consultants 201309 3.07 0.03 0.00 0.04 -0.02 0.00 -0.02 -0.02 -0.02 -0.06 0
Regal Entertainment & Consultants 201312 3.07 0.02 0.03 -0.02 0.00 -0.02 -0.02 -0.02 -0.06 0
Regal Entertainment & Consultants 201403 3.07 0.04 0.00 0.05 -0.02 -0.02 0.00 -0.02 -0.02 -0.05 0
Regal Entertainment & Consultants 201406 3.07 0.04 0.07 -0.03 0.00 -0.03 -0.03 -0.03 -0.11 0
Regency Ceramics 201309 26.44 0.95 2.02 1.07 0.67 2.25 -1.85 -1.85 -1.85 -0.70 0
Regency Ceramics 201312 26.44 0.66 0.25 -0.41 0.44 2.34 -3.18 -3.18 -3.18 -1.20 0
Regency Ceramics 201403 26.44 0.72 1.51 0.79 0.97 2.39 -2.56 -2.56 -2.56 -0.97 0
Regency Ceramics 201406 26.44 0.39 0.02 -0.36 0.40 2.32 -3.08 -3.08 -3.08 -1.16 0
Reliance Capital 201309 246.00 1836.00 18.00 1063.00 15.00 806.00 627.00 15.00 164.00 29.00 135.00 181.00 7.36 85
Reliance Capital 201312 246.00 1855.00 28.00 1035.00 6.00 854.00 628.00 15.00 211.00 29.00 182.00 166.00 6.76 85
Reliance Capital 201403 244.00 1774.00 14.00 881.00 60.00 967.00 628.00 18.00 321.00 82.00 239.00 267.00 10.86 85
Reliance Capital 201406 244.00 2115.00 23.00 1287.00 6.00 857.00 684.00 14.00 159.00 28.00 131.00 164.00 6.66 85
Reliance Communications 201309 1032.00 5266.00 95.00 3507.00 474.00 2328.00 676.00 937.00 715.00 1.00 714.00 675.00 3.27 0
Reliance Communications 201312 1032.00 5057.00 100.00 3558.00 246.00 1845.00 749.00 948.00 148.00 3.00 145.00 108.00 0.52 0
Reliance Communications 201403 1021.00 5371.00 34.00 3819.00 266.00 1852.00 907.00 1767.00 -878.00 -1026.00 148.00 156.00 0.75 0
Reliance Communications 201406 1021.00 5290.00 64.00 3660.00 169.00 1863.00 767.00 931.00 165.00 1.00 164.00 132.00 0.64 0
Remi Edelstahl Tubulars 201309 9.58 25.67 0.02 24.39 0.86 2.16 1.62 0.88 -0.34 -0.12 -0.23 -0.23 -0.24 0
Remi Edelstahl Tubulars 201312 9.58 28.99 0.81 27.02 0.01 2.79 1.35 0.77 0.67 0.24 0.43 0.43 0.45 0
Remi Edelstahl Tubulars 201403 9.58 39.82 0.59 36.65 3.77 2.14 0.80 0.83 0.23 0.60 0.60 0.63 0
Remi Edelstahl Tubulars 201406 9.58 34.03 0.20 31.47 0.08 2.85 2.62 1.13 -0.90 -0.30 -0.61 -0.61 -0.64 0
Remi Elektrotechnik 201309 4.87 18.86 0.12 17.33 0.04 1.70 0.79 0.28 0.63 0.17 0.46 0.46 0.95 0
Remi Elektrotechnik 201312 4.87 19.06 0.09 16.99 0.07 2.23 0.92 0.37 0.93 0.30 0.63 0.63 1.30 0
Remi Elektrotechnik 201403 4.87 29.35 0.15 26.04 0.11 3.57 0.12 0.40 3.05 1.04 2.01 2.01 4.14 0
Remi Elektrotechnik 201406 4.87 27.03 0.08 23.45 0.03 3.69 1.02 0.39 2.28 0.74 1.54 1.54 3.16 0

Co_Name Year Equity N.Sale O.O.I T. Exp O.I PBIDT Int. Dep. PBT T.Tax PAT A.PAT EPS Div (%)
Exp
ecte
d R
esu
lts
on
14
No
vem
ber
201
4
Remi Process Plant & Machinery 201309 1.76 8.37 0.03 7.55 0.18 1.03 0.15 0.13 0.00 0.00 0.01 0.01 0.03 6
Remi Process Plant & Machinery 201312 1.76 3.12 0.03 3.11 0.18 0.22 -0.11 0.13 0.20 0.08 0.12 0.12 0.70 6
Remi Process Plant & Machinery 201403 1.76 2.64 0.07 2.77 0.29 0.22 -0.30 0.13 0.39 0.04 0.35 0.35 1.97 6
Remi Process Plant & Machinery 201406 1.76 3.72 0.25 3.79 0.37 0.55 0.14 0.42 0.12 0.30 0.30 1.68 6
Remi Sales & Engg. 201309 0.57 27.39 26.53 0.01 0.87 0.06 0.09 -1.51 -0.47 -1.04 -1.04 -18.22 0
Remi Sales & Engg. 201312 0.57 24.27 23.91 0.01 0.37 0.00 0.10 0.26 0.07 0.19 0.19 3.39 0
Remi Sales & Engg. 201403 0.57 32.84 31.90 0.13 1.07 0.02 0.08 0.98 0.33 0.64 0.64 11.30 0
Remi Sales & Engg. 201406 0.57 44.64 43.06 0.19 1.77 0.14 0.10 1.53 0.50 1.03 1.03 18.13 0
Remi Securities 201309 1.75 8.71 8.33 0.05 0.43 0.39 -1.95 -0.65 -1.30 -1.30 -7.41 0
Remi Securities 201312 1.75 0.16 0.04 0.00 0.12 0.26 -0.14 -0.04 -0.10 -0.10 -0.55 0
Remi Securities 201403 1.75 0.17 0.01 0.05 0.22 0.24 -0.02 -0.02 0.00 0.00 0.01 0
Remi Securities 201406 1.75 0.14 0.02 0.12 0.25 -0.13 -0.04 -0.09 -0.09 -0.52 0
Repro India 201309 10.90 108.25 3.04 92.47 0.58 19.41 3.41 4.13 11.87 2.32 9.55 9.55 8.76 100
Repro India 201312 10.90 111.97 2.56 97.79 1.15 17.89 4.45 4.38 9.06 2.61 6.45 6.45 5.92 100
Repro India 201403 10.90 104.08 1.71 95.86 5.04 14.96 3.99 4.50 6.47 1.80 4.67 4.67 4.28 100
Repro India 201406 10.90 92.32 2.63 87.36 7.07 14.65 2.05 4.64 7.97 2.15 5.82 5.82 5.34 100
Resonance Specialties 201309 11.54 13.21 0.06 12.18 1.10 0.16 0.28 0.66 -0.08 0.73 0.73 0.63 5
Resonance Specialties 201312 11.54 9.76 0.07 8.98 0.85 0.11 0.28 0.46 0.11 0.35 0.35 0.30 5
Resonance Specialties 201403 11.54 11.87 -0.42 11.17 0.28 0.15 0.27 -0.30 -0.06 -0.24 -0.24 -0.21 5
Resonance Specialties 201406 11.54 8.20 0.10 7.50 0.79 0.13 0.28 0.38 -0.03 0.41 0.41 0.36 5
Responsive Industries 201309 26.25 625.18 6.07 556.17 9.94 85.03 7.83 36.47 40.73 10.88 29.85 27.88 1.14 10
Responsive Industries 201312 26.25 690.56 2.35 614.98 4.38 82.31 7.72 37.05 37.54 12.60 24.94 21.34 0.95 10
Responsive Industries 201403 26.25 605.38 6.95 583.25 8.54 37.62 7.97 36.83 -7.18 -13.21 6.02 5.70 0.23 10
Responsive Industries 201406 26.25 501.20 11.15 442.07 10.31 80.59 6.86 40.76 32.97 9.05 23.93 19.10 0.91 10
Rexnord Electronics & Controls 201309 6.48 9.02 0.07 7.82 0.03 1.29 0.40 0.24 0.65 0.23 0.42 0.42 0.65 0
Rexnord Electronics & Controls 201312 6.48 9.79 0.04 8.59 0.04 1.28 0.34 0.24 0.70 0.23 0.47 0.47 0.72 0
Rexnord Electronics & Controls 201403 6.48 10.60 0.12 9.96 0.04 0.80 0.29 0.24 0.82 0.25 0.57 0.57 0.88 0
Rexnord Electronics & Controls 201406 6.48 13.67 0.01 11.93 0.04 1.80 0.36 0.31 1.13 0.36 0.77 0.77 1.18 0
Ritesh International 201309 8.55 5.93 0.30 5.72 0.25 0.75 0.18 0.18 0.38 0.96 0.38 1.12 0
Ritesh International 201312 8.55 6.42 1.17 6.58 0.14 1.16 0.17 0.18 0.78 0.78 0.78 0.91 0
Ritesh International 201403 8.55 7.74 0.43 8.18 0.27 0.26 0.13 0.20 0.02 0.01 0.02 0.03 0
Ritesh International 201406 8.55 7.27 0.18 8.37 0.02 -0.90 0.15 0.19 -1.22 -1.22 -1.22 -1.43 0
Ritesh Properties & Industries 201309 11.59 2.51 2.35 0.08 0.25 0.10 0.05 0.10 0.02 1.85 0.08 1.60 0
Ritesh Properties & Industries 201312 11.59 1.65 1.44 0.07 0.28 -0.08 0.07 0.29 0.05 0.24 0.24 0.20 0
Ritesh Properties & Industries 201403 11.59 2.85 0.03 3.53 0.80 0.14 0.02 0.04 0.08 0.03 -0.52 0.05 -0.44 0
Ritesh Properties & Industries 201406 11.59 1.67 1.26 0.04 0.45 0.01 0.07 0.37 0.07 0.30 0.30 0.26 0

Co_Name Year Equity N.Sale O.O.I T. Exp O.I PBIDT Int. Dep. PBT T.Tax PAT A.PAT EPS Div (%)
Exp
ecte
d R
esu
lts
on
14
No
vem
ber
201
4
RLF 201309 9.65 0.79 0.24 0.32 0.00 0.71 0.31 0.18 0.23 0.23 0.23 0.02 0
RLF 201312 9.65 0.98 0.29 0.00 0.69 0.27 0.17 0.25 0.25 0.25 0.25 0
RLF 201403 9.80 1.52 1.33 0.10 0.29 0.15 0.17 -0.03 0.14 -0.18 -0.18 -0.18 0
RLF 201406 9.80 0.50 0.12 0.01 0.38 0.17 0.18 0.04 0.01 0.03 0.03 0.03 0
RM Mohite Industries 201309 20.10 58.78 52.35 6.43 2.47 2.22 1.74 1.74 1.74 0.86 0
RM Mohite Industries 201312 20.10 41.26 35.76 0.00 5.49 2.49 2.28 0.72 0.72 0.72 0.36 0
RM Mohite Industries 201403 20.10 58.23 50.55 0.35 8.03 4.04 2.41 1.59 0.31 1.28 1.28 0.64 0
RM Mohite Industries 201406 20.10 54.49 49.56 0.99 5.92 1.59 2.20 2.12 2.12 2.12 1.06 0
Rockon Fintech 201309 16.52 0.05 0.07 0.24 0.23 0.23 0.23 0.23 0.14 0
Rockon Fintech 201312 16.52 0.24 0.69 -0.46 -0.46 -0.46 -0.46 -0.28 0
Rockon Fintech 201403 16.52 5.09 0.26 5.06 0.28 0.28 0.28 0.28 0.17 0
Rockon Fintech 201406 16.52 1.08 0.21 1.33 0.00 -0.04 -0.04 -0.04 -0.04 -0.02 0
Rodium Realty 201309 3.25 1.26 0.52 0.30 1.04 0.44 0.04 0.55 0.13 0.43 0.43 0.74 5
Rodium Realty 201312 3.25 7.22 5.60 0.32 1.93 0.35 0.04 1.55 0.50 1.05 1.05 2.65 5
Rodium Realty 201403 3.25 4.96 0.25 4.47 0.53 1.27 0.35 0.04 0.88 0.27 0.61 0.61 1.31 5
Rodium Realty 201406 3.25 2.01 0.20 0.90 0.32 1.62 0.17 0.06 1.38 0.45 0.93 0.93 2.28 5
Rohit Ferro-Tech 201309 113.78 708.92 12.47 761.47 2.05 -38.03 41.79 7.60 -87.42 -27.00 -60.42 -60.42 -5.31 0
Rohit Ferro-Tech 201312 113.78 505.39 7.32 548.18 2.42 -33.05 45.72 7.58 -86.35 -29.52 -56.83 -56.83 -5.00 0
Rohit Ferro-Tech 201403 113.78 656.66 10.78 723.54 0.82 -55.29 37.83 7.42 -100.54 17.00 -117.54 -117.54 -10.33 0
Rohit Ferro-Tech 201406 113.78 428.56 5.39 479.63 4.37 -41.31 48.71 6.54 -96.56 -96.56 -96.56 -8.49 0
Roopa Industries 201309 7.87 5.99 0.01 6.15 -0.15 0.20 0.15 -0.50 -0.50 -0.50 -0.63 0
Roopa Industries 201312 7.87 7.08 0.01 7.55 0.03 -0.44 0.37 0.15 -0.96 -0.96 -0.96 -1.22 0
Roopa Industries 201403 7.87 9.46 0.01 9.18 0.01 0.30 0.32 0.15 -0.17 0.06 -0.23 -0.23 -0.29 0
Roopa Industries 201406 7.87 8.58 0.00 8.16 0.02 0.44 0.28 0.14 0.02 0.00 0.01 0.01 0.02 0
Rossell India 201309 7.34 44.09 0.93 23.54 1.08 22.56 1.43 0.90 20.23 4.24 15.99 15.99 4.36 25
Rossell India 201312 7.34 50.85 1.25 34.40 1.31 19.01 1.29 0.96 16.76 3.60 13.16 13.16 3.59 25
Rossell India 201403 7.34 26.75 1.04 36.00 1.60 -6.61 0.95 1.46 -9.01 0.33 -9.34 -9.34 -2.54 25
Rossell India 201406 7.34 13.98 0.47 15.32 0.48 -0.39 1.20 1.61 -3.20 -3.20 -3.20 -0.87 25
Roto Pumps 201309 3.09 22.67 0.09 17.62 -0.05 5.08 0.31 0.69 4.09 1.61 2.48 2.48 8.03 30
Roto Pumps 201312 3.09 23.54 0.10 18.42 0.19 5.41 0.39 0.70 4.33 1.21 3.12 3.12 10.09 30
Roto Pumps 201403 3.09 24.93 0.10 19.63 0.12 5.52 0.36 0.74 4.42 1.63 2.79 2.79 9.03 30
Roto Pumps 201406 3.09 18.84 0.10 15.63 0.27 3.58 0.44 0.63 2.51 0.85 1.67 1.67 5.40 30
Royale Manor Hotels & Industries 201309 16.93 4.15 3.25 0.05 0.95 0.50 0.33 0.13 0.09 0.04 0.04 0
Royale Manor Hotels & Industries 201312 16.93 5.92 4.37 0.08 1.63 0.50 0.36 0.77 0.17 0.60 0.60 0.34 0
Royale Manor Hotels & Industries 201403 16.93 6.04 4.86 0.24 1.43 0.50 0.32 0.60 0.12 0.48 0.48 0.27 0
Royale Manor Hotels & Industries 201406 16.93 4.44 3.30 0.16 1.30 0.47 0.34 0.48 0.10 0.38 0.38 0.21 0

Co_Name Year Equity N.Sale O.O.I T. Exp O.I PBIDT Int. Dep. PBT T.Tax PAT A.PAT EPS Div (%)
Exp
ecte
d R
esu
lts
on
14
No
vem
ber
201
4
RPP Infra Projects 201309 22.60 58.76 48.02 1.94 12.68 4.25 2.12 6.32 1.47 4.85 4.85 2.14 5
RPP Infra Projects 201312 22.60 65.67 57.60 2.79 10.86 4.12 1.97 4.77 0.64 4.13 4.13 1.83 5
RPP Infra Projects 201403 22.60 52.76 44.87 1.23 9.13 4.02 1.93 3.18 1.60 1.57 1.57 0.70 5
RPP Infra Projects 201406 22.60 47.10 39.29 1.96 9.77 3.87 2.04 3.85 0.87 2.99 2.99 1.32 5
RR Financial Consultants 201309 11.07 12.61 0.02 13.58 -0.95 0.37 0.21 -1.53 0.48 -2.00 -1.94 -1.75 0
RR Financial Consultants 201312 11.06 18.16 0.02 16.75 1.42 0.34 0.20 0.89 -4.08 -3.29 1.52 0
RR Financial Consultants 201403 11.07 26.84 0.02 26.02 0.83 0.43 0.18 0.22 -0.07 0.29 0.33 0.30 0
RR Financial Consultants 201406 11.07 13.93 0.03 13.25 0.71 0.36 0.15 0.20 0.00 0.19 0.28 0.25 0
RTCL 201309 12.00 0.25 0.26 0.07 0.06 0.06 0.04 -0.04 -0.01 -0.02 -0.02 -0.02 0
RTCL 201312 12.00 0.36 0.17 0.05 0.24 0.16 0.05 0.02 0.01 0.02 0.02 0.01 0
RTCL 201403 12.00 1.45 1.70 0.68 0.43 0.20 0.04 0.19 0.06 0.11 0.13 0.09 0
RTCL 201406 12.00 0.11 0.06 -0.05 0.17 0.04 -0.26 -0.08 -0.18 -0.19 -0.15 0
RTS Power Corporation 201309 8.17 35.82 0.77 35.69 0.17 1.07 2.43 0.37 -1.73 -1.73 -1.73 -2.12 0
RTS Power Corporation 201312 8.17 32.79 0.56 30.54 0.17 2.97 2.37 0.37 0.22 0.22 0.22 0.27 0
RTS Power Corporation 201403 8.17 48.15 1.19 43.13 0.40 6.60 2.58 0.37 3.65 0.03 3.62 3.62 4.43 0
RTS Power Corporation 201406 8.17 35.71 0.83 34.10 0.17 2.61 2.81 0.34 -0.53 -0.53 -0.53 -0.06 0
Ruby Mills 201309 4.18 47.73 0.12 35.26 3.75 16.34 4.10 5.79 6.45 1.20 5.25 5.25 6.28 40
Ruby Mills 201312 4.18 36.94 0.10 29.00 3.00 11.04 4.79 5.74 0.51 0.07 0.44 0.44 -0.53 40
Ruby Mills 201403 4.18 62.25 0.74 41.52 26.78 48.25 5.86 5.54 36.85 3.18 33.67 33.67 40.27 40
Ruby Mills 201406 4.18 51.17 0.21 37.69 29.24 42.93 3.36 5.18 34.39 8.07 26.32 26.32 31.48 40
Ruchira Papers 201309 22.42 83.73 73.24 0.33 10.82 3.35 2.83 4.64 1.32 3.33 3.33 1.48 12
Ruchira Papers 201312 22.42 67.20 56.88 0.17 10.49 3.27 2.98 4.24 2.22 2.02 2.02 0.90 12
Ruchira Papers 201403 22.42 85.55 74.86 1.09 11.78 3.09 3.01 5.72 2.05 3.67 3.67 1.64 12
Ruchira Papers 201406 22.42 82.95 72.98 0.18 10.15 3.03 2.36 4.76 1.50 3.26 3.26 1.45 12
Rudraksh Cap-Tech 201309 5.25 0.01 0.00 0.01 0.01 0.01 0.01 0.01 0
Rudraksh Cap-Tech 201312 5.25 0.01 0.00 0.01 0.01 0.01 0.01 0.01 0
Rudraksh Cap-Tech 201403 5.25 0.00 0.03 0.03 0.00 0.00 0.00 0.00 0
Rudraksh Cap-Tech 201406 5.25 0.00 0.02 0.02 0.00 0.00 0.00 0.00 0.00 0
Rupa & Company 201309 7.95 229.21 0.91 199.18 0.33 31.27 7.02 1.79 24.19 9.09 15.10 15.10 1.90 250
Rupa & Company 201312 7.95 189.44 1.07 159.95 0.29 30.85 5.15 1.87 23.82 8.08 15.74 15.74 1.98 250
Rupa & Company 201403 7.95 286.48 1.63 247.63 6.36 46.84 7.28 5.71 32.12 11.16 20.96 20.96 250
Rupa & Company 201406 7.95 200.71 1.34 170.90 0.33 31.48 5.34 3.92 22.22 7.18 15.04 15.04 1.89 250
Rutron International 201309 17.61 0.22 0.02 0.20 0.20 0.20 0.20 0.20 0
Rutron International 201312 17.61 0.29 0.04 0.25 0.25 0.25 0.25 0.01 0
Rutron International 201403 17.61 0.23 0.95 2.37 -1.19 -1.19 -1.19 -1.19 -0.07 0
Rutron International 201406 17.61 0.17 0.02 0.15 0.00 0.15 0.15 0.15 0.01 0

Co_Name Year Equity N.Sale O.O.I T. Exp O.I PBIDT Int. Dep. PBT T.Tax PAT A.PAT EPS Div (%)
Exp
ecte
d R
esu
lts
on
14
No
vem
ber
201
4
S Kumars Online 201309 28.63 0.20 0.25 0.00 -0.05 0.00 0.03 -0.08 -0.02 -0.07 -0.07 -0.02 0
S Kumars Online 201312 28.63 0.17 0.18 0.00 0.00 0.00 0.03 -0.03 0.01 -0.04 -0.04 -0.01 0
S Kumars Online 201403 28.63 0.18 0.29 0.00 -0.10 0.01 0.03 -0.14 0.01 -0.15 -0.15 -0.05 0
S Kumars Online 201406 28.63 0.15 0.13 0.00 0.02 0.00 0.03 -0.01 0.02 -0.03 -0.03 -0.01 0
Saamya Biotech (India) 201309 24.88 0.10 -0.10 0.00 0.02 -0.12 0.00 -0.12 -0.12 -0.05 0
Saamya Biotech (India) 201312 24.88 0.07 -0.07 0.00 0.02 -0.09 -0.09 -0.09 -0.03 0
Saamya Biotech (India) 201403 24.88 13.36 12.80 0.00 0.56 0.01 0.07 0.49 0.06 0.43 0.43 0.17 0
Saamya Biotech (India) 201406 24.88 0.03 -0.03 0.01 0.06 -0.10 -0.10 -0.10 -0.04 0
Sadbhav Engineering 201309 15.14 375.41 336.57 1.87 40.71 21.06 11.44 8.21 -19.86 28.07 28.07 1.86 70
Sadbhav Engineering 201312 15.14 620.79 556.21 5.99 70.57 22.42 12.82 35.32 9.38 25.94 25.94 1.71 70
Sadbhav Engineering 201403 15.17 798.69 710.48 1.96 90.17 24.88 13.41 13.54 -22.49 36.02 36.02 2.38 70
Sadbhav Engineering 201406 15.18 685.51 614.00 29.12 100.63 49.67 21.95 29.00 2.01 26.99 26.99 1.78 70
Sadhana Nitro Chem 201309 9.20 14.09 0.24 14.22 0.13 0.24 2.07 0.69 -2.52 -2.52 -2.52 -0.73 0
Sadhana Nitro Chem 201312 9.20 9.63 0.15 10.09 -0.06 -0.37 1.74 0.69 -2.80 -2.80 -2.80 -3.04 0
Sadhana Nitro Chem 201403 9.20 8.94 0.38 10.28 0.16 -0.80 2.36 0.69 6.82 2.06 4.76 4.76 5.03 0
Sadhana Nitro Chem 201406 9.20 14.42 0.12 14.80 0.05 -0.21 1.15 0.50 -1.86 -3.78 -1.86 -4.11 0
Sagar Soya Products 201309 6.03 0.13 0.02 0.11 0.01 0.10 0.10 0.10 0.15 0
Sagar Soya Products 201312 6.03 0.08 0.02 0.06 0.01 0.05 0.05 0.05 0.08 0
Sagar Soya Products 201403 5.85 0.41 1.15 -0.75 0.06 -0.80 -0.80 -0.80 -0.73 0
Sagar Soya Products 201406 5.85 0.00 0.06 -0.06 -0.06 -0.06 -0.06 -0.09 0
Sagar Systech 201309 0.32 0.00 0.01 0.01 0.01 0.01 0.01 0.35 0
Sagar Systech 201312 0.32 0.00 0.06 0.06 0.06 0.06 0.06 1.81 0
Sagar Systech 201403 0.32 0.01 0.00 0.00 0.00 0.01 -0.01 -0.01 -0.31 0
Sagar Systech 201406 0.32 0.01 -0.01 -0.01 -0.01 -0.01 -0.18 0
Sai Baba Investment And Commercial Enterprises 201403 11.27 0.28 0.09 0.00 0.18 0.00 0.18 0.07 0.11 0.11 0.10 0
Sai Baba Investment And Commercial Enterprises 201406 11.27 0.13 0.01 0.12 0.12 0.04 0.08 0.08 0.07 0
Sai Capital 201309 3.63 0.00 0.02 -0.02 -0.02 -0.02 -0.02 -0.04 0
Sai Capital 201312 3.63 -0.01 0.01 -0.02 -0.02 -0.02 -0.02 -0.04 0
Sai Capital 201403 3.63 -0.01 0.01 -0.02 -0.02 -0.02 -0.02 -0.04 0
Sai Capital 201406 3.63 -0.05 0.02 -0.08 -0.08 -0.08 -0.08 -0.21 0
Sai Industries 201309 2.97 0.01 0.01 0.00 0.00 0.00 0.00 -0.01 0
Sai Industries 201312 2.97 -0.01 0.01 -0.02 -0.02 -0.02 -0.02 -0.07 0
Sai Industries 201403 2.97 0.00 0.00 -0.01 -0.01 0.00 -0.01 -0.01 0
Sai Industries 201406 2.97 0.02 -0.02 -0.02 -0.02 -0.02 -0.08 0
Samrat Pharmachem 201309 3.09 16.99 0.16 16.73 0.08 0.49 0.30 0.08 0.11 0.04 0.07 0.07 0.23 0
Samrat Pharmachem 201312 3.09 17.25 0.02 16.85 0.05 0.47 0.15 0.08 0.23 0.07 0.16 0.16 0.53 0
Samrat Pharmachem 201403 3.09 12.16 0.05 11.70 0.07 0.58 0.09 0.08 0.40 0.05 0.35 0.35 1.13 0
Samrat Pharmachem 201406 3.09 14.14 0.04 13.59 0.03 0.61 0.12 0.09 0.40 0.17 0.24 0.24 0.77 0
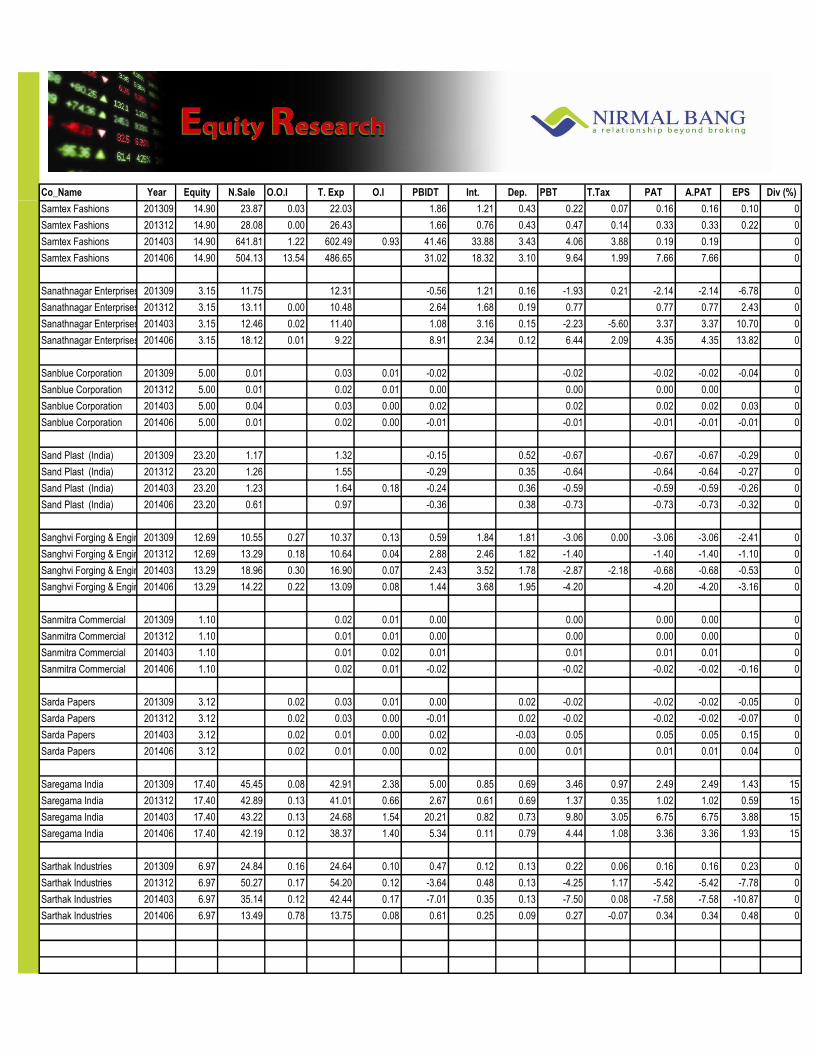
Co_Name Year Equity N.Sale O.O.I T. Exp O.I PBIDT Int. Dep. PBT T.Tax PAT A.PAT EPS Div (%)
Exp
ecte
d R
esu
lts
on
14
No
vem
ber
201
4
Samtex Fashions 201309 14.90 23.87 0.03 22.03 1.86 1.21 0.43 0.22 0.07 0.16 0.16 0.10 0
Samtex Fashions 201312 14.90 28.08 0.00 26.43 1.66 0.76 0.43 0.47 0.14 0.33 0.33 0.22 0
Samtex Fashions 201403 14.90 641.81 1.22 602.49 0.93 41.46 33.88 3.43 4.06 3.88 0.19 0.19 0
Samtex Fashions 201406 14.90 504.13 13.54 486.65 31.02 18.32 3.10 9.64 1.99 7.66 7.66 0
Sanathnagar Enterprises 201309 3.15 11.75 12.31 -0.56 1.21 0.16 -1.93 0.21 -2.14 -2.14 -6.78 0
Sanathnagar Enterprises 201312 3.15 13.11 0.00 10.48 2.64 1.68 0.19 0.77 0.77 0.77 2.43 0
Sanathnagar Enterprises 201403 3.15 12.46 0.02 11.40 1.08 3.16 0.15 -2.23 -5.60 3.37 3.37 10.70 0
Sanathnagar Enterprises 201406 3.15 18.12 0.01 9.22 8.91 2.34 0.12 6.44 2.09 4.35 4.35 13.82 0
Sanblue Corporation 201309 5.00 0.01 0.03 0.01 -0.02 -0.02 -0.02 -0.02 -0.04 0
Sanblue Corporation 201312 5.00 0.01 0.02 0.01 0.00 0.00 0.00 0.00 0
Sanblue Corporation 201403 5.00 0.04 0.03 0.00 0.02 0.02 0.02 0.02 0.03 0
Sanblue Corporation 201406 5.00 0.01 0.02 0.00 -0.01 -0.01 -0.01 -0.01 -0.01 0
Sand Plast (India) 201309 23.20 1.17 1.32 -0.15 0.52 -0.67 -0.67 -0.67 -0.29 0
Sand Plast (India) 201312 23.20 1.26 1.55 -0.29 0.35 -0.64 -0.64 -0.64 -0.27 0
Sand Plast (India) 201403 23.20 1.23 1.64 0.18 -0.24 0.36 -0.59 -0.59 -0.59 -0.26 0
Sand Plast (India) 201406 23.20 0.61 0.97 -0.36 0.38 -0.73 -0.73 -0.73 -0.32 0
Sanghvi Forging & Engineering 201309 12.69 10.55 0.27 10.37 0.13 0.59 1.84 1.81 -3.06 0.00 -3.06 -3.06 -2.41 0
Sanghvi Forging & Engineering 201312 12.69 13.29 0.18 10.64 0.04 2.88 2.46 1.82 -1.40 -1.40 -1.40 -1.10 0
Sanghvi Forging & Engineering 201403 13.29 18.96 0.30 16.90 0.07 2.43 3.52 1.78 -2.87 -2.18 -0.68 -0.68 -0.53 0
Sanghvi Forging & Engineering 201406 13.29 14.22 0.22 13.09 0.08 1.44 3.68 1.95 -4.20 -4.20 -4.20 -3.16 0
Sanmitra Commercial 201309 1.10 0.02 0.01 0.00 0.00 0.00 0.00 0
Sanmitra Commercial 201312 1.10 0.01 0.01 0.00 0.00 0.00 0.00 0
Sanmitra Commercial 201403 1.10 0.01 0.02 0.01 0.01 0.01 0.01 0
Sanmitra Commercial 201406 1.10 0.02 0.01 -0.02 -0.02 -0.02 -0.02 -0.16 0
Sarda Papers 201309 3.12 0.02 0.03 0.01 0.00 0.02 -0.02 -0.02 -0.02 -0.05 0
Sarda Papers 201312 3.12 0.02 0.03 0.00 -0.01 0.02 -0.02 -0.02 -0.02 -0.07 0
Sarda Papers 201403 3.12 0.02 0.01 0.00 0.02 -0.03 0.05 0.05 0.05 0.15 0
Sarda Papers 201406 3.12 0.02 0.01 0.00 0.02 0.00 0.01 0.01 0.01 0.04 0
Saregama India 201309 17.40 45.45 0.08 42.91 2.38 5.00 0.85 0.69 3.46 0.97 2.49 2.49 1.43 15
Saregama India 201312 17.40 42.89 0.13 41.01 0.66 2.67 0.61 0.69 1.37 0.35 1.02 1.02 0.59 15
Saregama India 201403 17.40 43.22 0.13 24.68 1.54 20.21 0.82 0.73 9.80 3.05 6.75 6.75 3.88 15
Saregama India 201406 17.40 42.19 0.12 38.37 1.40 5.34 0.11 0.79 4.44 1.08 3.36 3.36 1.93 15
Sarthak Industries 201309 6.97 24.84 0.16 24.64 0.10 0.47 0.12 0.13 0.22 0.06 0.16 0.16 0.23 0
Sarthak Industries 201312 6.97 50.27 0.17 54.20 0.12 -3.64 0.48 0.13 -4.25 1.17 -5.42 -5.42 -7.78 0
Sarthak Industries 201403 6.97 35.14 0.12 42.44 0.17 -7.01 0.35 0.13 -7.50 0.08 -7.58 -7.58 -10.87 0
Sarthak Industries 201406 6.97 13.49 0.78 13.75 0.08 0.61 0.25 0.09 0.27 -0.07 0.34 0.34 0.48 0
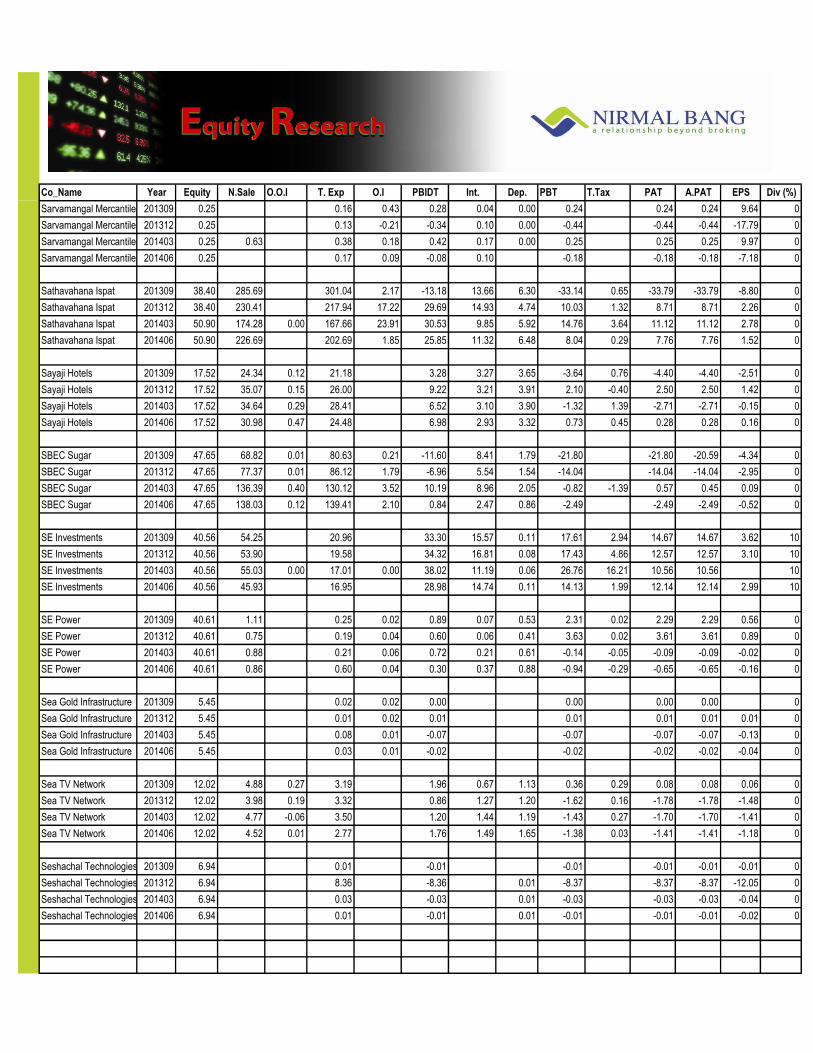
Co_Name Year Equity N.Sale O.O.I T. Exp O.I PBIDT Int. Dep. PBT T.Tax PAT A.PAT EPS Div (%)
Exp
ecte
d R
esu
lts
on
14
No
vem
ber
201
4
Sarvamangal Mercantile Company 201309 0.25 0.16 0.43 0.28 0.04 0.00 0.24 0.24 0.24 9.64 0
Sarvamangal Mercantile Company 201312 0.25 0.13 -0.21 -0.34 0.10 0.00 -0.44 -0.44 -0.44 -17.79 0
Sarvamangal Mercantile Company 201403 0.25 0.63 0.38 0.18 0.42 0.17 0.00 0.25 0.25 0.25 9.97 0
Sarvamangal Mercantile Company 201406 0.25 0.17 0.09 -0.08 0.10 -0.18 -0.18 -0.18 -7.18 0
Sathavahana Ispat 201309 38.40 285.69 301.04 2.17 -13.18 13.66 6.30 -33.14 0.65 -33.79 -33.79 -8.80 0
Sathavahana Ispat 201312 38.40 230.41 217.94 17.22 29.69 14.93 4.74 10.03 1.32 8.71 8.71 2.26 0
Sathavahana Ispat 201403 50.90 174.28 0.00 167.66 23.91 30.53 9.85 5.92 14.76 3.64 11.12 11.12 2.78 0
Sathavahana Ispat 201406 50.90 226.69 202.69 1.85 25.85 11.32 6.48 8.04 0.29 7.76 7.76 1.52 0
Sayaji Hotels 201309 17.52 24.34 0.12 21.18 3.28 3.27 3.65 -3.64 0.76 -4.40 -4.40 -2.51 0
Sayaji Hotels 201312 17.52 35.07 0.15 26.00 9.22 3.21 3.91 2.10 -0.40 2.50 2.50 1.42 0
Sayaji Hotels 201403 17.52 34.64 0.29 28.41 6.52 3.10 3.90 -1.32 1.39 -2.71 -2.71 -0.15 0
Sayaji Hotels 201406 17.52 30.98 0.47 24.48 6.98 2.93 3.32 0.73 0.45 0.28 0.28 0.16 0
SBEC Sugar 201309 47.65 68.82 0.01 80.63 0.21 -11.60 8.41 1.79 -21.80 -21.80 -20.59 -4.34 0
SBEC Sugar 201312 47.65 77.37 0.01 86.12 1.79 -6.96 5.54 1.54 -14.04 -14.04 -14.04 -2.95 0
SBEC Sugar 201403 47.65 136.39 0.40 130.12 3.52 10.19 8.96 2.05 -0.82 -1.39 0.57 0.45 0.09 0
SBEC Sugar 201406 47.65 138.03 0.12 139.41 2.10 0.84 2.47 0.86 -2.49 -2.49 -2.49 -0.52 0
SE Investments 201309 40.56 54.25 20.96 33.30 15.57 0.11 17.61 2.94 14.67 14.67 3.62 10
SE Investments 201312 40.56 53.90 19.58 34.32 16.81 0.08 17.43 4.86 12.57 12.57 3.10 10
SE Investments 201403 40.56 55.03 0.00 17.01 0.00 38.02 11.19 0.06 26.76 16.21 10.56 10.56 10
SE Investments 201406 40.56 45.93 16.95 28.98 14.74 0.11 14.13 1.99 12.14 12.14 2.99 10
SE Power 201309 40.61 1.11 0.25 0.02 0.89 0.07 0.53 2.31 0.02 2.29 2.29 0.56 0
SE Power 201312 40.61 0.75 0.19 0.04 0.60 0.06 0.41 3.63 0.02 3.61 3.61 0.89 0
SE Power 201403 40.61 0.88 0.21 0.06 0.72 0.21 0.61 -0.14 -0.05 -0.09 -0.09 -0.02 0
SE Power 201406 40.61 0.86 0.60 0.04 0.30 0.37 0.88 -0.94 -0.29 -0.65 -0.65 -0.16 0
Sea Gold Infrastructure 201309 5.45 0.02 0.02 0.00 0.00 0.00 0.00 0
Sea Gold Infrastructure 201312 5.45 0.01 0.02 0.01 0.01 0.01 0.01 0.01 0
Sea Gold Infrastructure 201403 5.45 0.08 0.01 -0.07 -0.07 -0.07 -0.07 -0.13 0
Sea Gold Infrastructure 201406 5.45 0.03 0.01 -0.02 -0.02 -0.02 -0.02 -0.04 0
Sea TV Network 201309 12.02 4.88 0.27 3.19 1.96 0.67 1.13 0.36 0.29 0.08 0.08 0.06 0
Sea TV Network 201312 12.02 3.98 0.19 3.32 0.86 1.27 1.20 -1.62 0.16 -1.78 -1.78 -1.48 0
Sea TV Network 201403 12.02 4.77 -0.06 3.50 1.20 1.44 1.19 -1.43 0.27 -1.70 -1.70 -1.41 0
Sea TV Network 201406 12.02 4.52 0.01 2.77 1.76 1.49 1.65 -1.38 0.03 -1.41 -1.41 -1.18 0
Seshachal Technologies 201309 6.94 0.01 -0.01 -0.01 -0.01 -0.01 -0.01 0
Seshachal Technologies 201312 6.94 8.36 -8.36 0.01 -8.37 -8.37 -8.37 -12.05 0
Seshachal Technologies 201403 6.94 0.03 -0.03 0.01 -0.03 -0.03 -0.03 -0.04 0
Seshachal Technologies 201406 6.94 0.01 -0.01 0.01 -0.01 -0.01 -0.01 -0.02 0

Co_Name Year Equity N.Sale O.O.I T. Exp O.I PBIDT Int. Dep. PBT T.Tax PAT A.PAT EPS Div (%)
Exp
ecte
d R
esu
lts
on
14
No
vem
ber
201
4
Seya Industries 201309 11.00 32.07 0.06 29.57 0.26 2.82 0.03 1.32 1.47 0.29 1.17 1.17 0
Seya Industries 201312 11.00 41.48 0.05 38.05 0.65 4.13 0.02 1.48 2.63 0.53 2.11 2.11 1.92 0
Seya Industries 201403 11.00 41.62 0.46 35.50 0.37 6.96 0.51 3.68 2.77 0.55 2.21 2.21 0
Seya Industries 201406 11.00 51.39 45.19 0.14 6.34 1.00 2.58 2.76 -0.01 2.76 2.76 2.51 0
Shah Construction Company 201309 1.61 0.28 0.31 0.02 -0.01 0.00 0.03 -0.04 -0.04 -0.04 -2.26 0
Shah Construction Company 201312 1.61 0.28 0.14 0.15 0.13 0.03 -0.01 -0.01 -0.01 -0.39 0
Shah Construction Company 201403 1.61 0.03 0.28 0.15 0.02 0.18 0.26 0.03 -0.11 -0.11 -0.11 -6.78 0
Shah Construction Company 201406 1.61 0.05 0.15 0.20 0.00 0.18 0.02 -0.20 -0.20 -0.20 -12.32 0
Shakti Pumps (India) 201309 15.24 75.30 1.36 64.31 12.35 2.83 1.66 7.86 1.83 6.03 6.03 3.96 20
Shakti Pumps (India) 201312 15.24 79.45 1.31 67.17 13.59 3.27 1.74 8.58 2.18 6.40 6.40 4.20 20
Shakti Pumps (India) 201403 15.24 98.14 78.42 19.72 3.81 1.79 14.11 4.40 9.71 9.71 6.37 20
Shakti Pumps (India) 201406 15.24 69.70 55.66 14.04 3.61 1.93 8.49 1.70 6.79 6.79 4.46 20
Shalimar Productions 201309 98.43 0.21 0.26 0.15 0.31 0.05 0.27 0.27 0.27 0
Shalimar Productions 201312 98.43 0.32 0.09 0.20 0.00 0.20 0.20 0.20 0.20 0
Shalimar Productions 201403 98.43 0.26 0.28 0.00 -0.02 0.12 -0.14 -0.14 -0.14 0
Shalimar Productions 201406 98.43 0.63 0.46 0.18 0.18 0.18 0.18 0
Sharad Fibres & Yarn Processors 201309 4.01 1.79 0.00 1.74 0.05 0.05 0.05 0.05 0.13 0
Sharad Fibres & Yarn Processors 201312 4.01 0.99 0.00 0.98 0.02 0.02 0.02 0.02 0.05 0
Sharad Fibres & Yarn Processors 201403 4.01 1.20 0.03 1.16 0.07 0.05 0.03 0.03 0.03 0.07 0
Sharad Fibres & Yarn Processors 201406 4.01 0.65 0.00 0.64 0.01 0.01 0.01 0.01 0.01 0
Shikhar Leasing & Trading 201309 1.00 0.08 0.03 0.05 0.03 0.00 0.01 0.01 0.01 0.14 0
Shikhar Leasing & Trading 201312 1.00 0.02 0.05 0.01 -0.02 0.03 0.00 -0.05 -0.05 -0.05 -0.54 0
Shikhar Leasing & Trading 201403 1.00 0.05 0.06 0.01 0.01 0.03 0.00 -0.03 -0.03 -0.03 -0.27 0
Shikhar Leasing & Trading 201406 1.00 0.07 0.04 0.03 0.03 0.00 -0.01 -0.01 -0.01 -0.05 0
Shilp Gravures 201309 6.15 13.39 0.00 10.02 0.07 3.45 0.53 1.59 1.33 0.44 0.90 0.90 1.46 12
Shilp Gravures 201312 6.15 12.94 0.01 9.99 0.26 3.22 0.62 1.64 0.96 0.45 0.51 0.51 0.83 12
Shilp Gravures 201403 6.15 16.02 -0.01 12.03 0.05 4.03 0.72 1.72 1.60 1.45 0.15 0.21 0.34 12
Shilp Gravures 201406 6.15 14.02 10.16 0.10 3.96 0.57 1.58 1.81 0.44 1.37 1.37 2.23 12
Shirpur Gold Refinery 201309 29.14 188.87 179.71 5.88 15.03 10.86 4.09 0.09 0.09 0.09 0.03 0
Shirpur Gold Refinery 201312 29.14 188.90 177.68 3.27 14.49 8.69 4.10 1.70 1.70 1.70 0.58 0
Shirpur Gold Refinery 201403 29.14 545.33 523.31 -4.97 17.05 8.61 4.15 4.28 0.51 3.77 3.77 1.29 0
Shirpur Gold Refinery 201406 29.14 639.04 623.60 3.53 18.97 11.33 2.01 5.63 0.67 4.95 4.95 1.70 0
Shiva Texyarn 201309 21.61 132.65 3.63 116.13 0.51 20.67 5.11 4.96 10.60 3.41 7.18 7.18 3.33 12
Shiva Texyarn 201312 21.61 113.57 1.94 99.73 0.38 16.16 5.33 4.97 5.86 1.83 4.03 4.03 1.87 12
Shiva Texyarn 201403 21.61 141.93 3.74 129.85 0.10 15.92 7.76 5.20 2.96 0.58 2.39 2.39 1.11 12
Shiva Texyarn 201406 21.61 113.42 1.91 95.05 0.23 20.50 7.29 3.76 9.45 4.55 4.90 4.90 2.27 12

Co_Name Year Equity N.Sale O.O.I T. Exp O.I PBIDT Int. Dep. PBT T.Tax PAT A.PAT EPS Div (%)
Exp
ecte
d R
esu
lts
on
14
No
vem
ber
201
4
Shiv-Vani Oil & Gas Exploration Services 201309 46.36 72.51 95.81 15.24 -8.05 132.59 59.62 -200.26 -0.16 -200.10 -200.10 -43.16 0
Shiv-Vani Oil & Gas Exploration Services 201312 46.36 59.43 75.85 0.35 -16.08 102.14 74.10 -192.31 -192.31 -192.31 -41.48 0
Shiv-Vani Oil & Gas Exploration Services 201403 46.36 49.46 259.63 23.29 -186.88 82.28 43.29 -312.45 -158.08 -154.37 -154.37 33.30 0
Shiv-Vani Oil & Gas Exploration Services 201406 46.36 48.66 78.38 0.09 -29.64 102.21 61.56 -193.40 -193.40 -193.40 -41.72 0
Shree Ajit Pulp & Paper 201309 5.36 54.08 46.30 0.02 7.81 0.79 1.08 5.95 1.85 4.10 4.10 7.66 5
Shree Ajit Pulp & Paper 201312 5.36 47.16 41.51 0.03 5.69 1.00 1.26 3.44 1.37 2.06 2.06 3.85 5
Shree Ajit Pulp & Paper 201403 5.36 52.26 46.95 0.02 5.33 1.14 1.32 2.87 1.77 1.10 1.10 2.04 5
Shree Ajit Pulp & Paper 201406 5.36 49.85 0.02 46.01 0.02 3.88 1.41 1.28 1.19 0.64 0.54 0.54 1.01 5
Shree Bhawani Paper Mills 201309 34.83 28.88 29.52 0.22 -0.42 6.56 2.32 -9.30 -9.30 -9.30 -2.67 0
Shree Bhawani Paper Mills 201312 34.83 23.23 30.34 1.35 -5.76 -1.38 1.98 -6.36 -6.36 -6.36 -1.83 0
Shree Bhawani Paper Mills 201403 34.83 28.10 40.35 0.06 -12.19 7.67 1.92 -26.54 -26.54 -26.54 -7.62 0
Shree Bhawani Paper Mills 201406 34.83 17.66 23.36 0.12 -5.58 4.93 1.94 -12.45 -12.45 -12.45 -3.58 0
Shree Ganesh Elastoplast 201309 5.50 1.66 0.01 1.64 0.02 0.00 0.02 0.00 0.02 0.02 0.33 0
Shree Ganesh Elastoplast 201312 5.50 1.35 -0.20 1.03 0.11 0.00 0.00 0.11 0.02 0.09 0.09 0.17 0
Shree Ganesh Elastoplast 201403 5.50 1.55 0.22 1.80 -0.04 0.06 0.00 -0.10 -0.02 -0.09 -0.09 -0.16 0
Shree Ganesh Elastoplast 201406 5.50 0.79 0.00 0.93 -0.13 0.08 0.00 -0.21 -0.21 -0.21 -0.38 0
Shree Hari Chemicals Export 201309 4.45 5.34 0.00 5.50 0.01 -0.15 0.14 0.37 -0.66 -0.66 -0.66 -1.49 10
Shree Hari Chemicals Export 201312 4.45 20.97 0.01 15.38 0.03 5.63 0.16 0.38 5.09 5.09 5.09 11.45 10
Shree Hari Chemicals Export 201403 4.45 30.33 0.04 17.50 0.08 12.95 0.05 0.38 12.52 2.79 9.73 9.73 21.88 10
Shree Hari Chemicals Export 201406 4.45 64.31 0.03 25.98 0.13 38.49 0.05 0.38 38.06 12.29 25.77 25.77 57.95 10
Shree Manufacturing Company 201309 5.50 0.01 -0.01 -0.01 -0.01 -0.01 0
Shree Manufacturing Company 201312 5.50 0.00 0.00 0.00 0.00 0.00 0
Shree Manufacturing Company 201403 5.50 0.02 -0.02 0.03 -0.04 -0.04 -0.04 0
Shree Manufacturing Company 201406 5.50 0.02 -0.02 -0.02 -0.02 -0.02 0
Shree Nath Commercial & Finance 201309 12.65 0.01 0.25 0.24 0.04 0.20 0.20 0.20 0.02 0
Shree Nath Commercial & Finance 201312 12.65 0.24 0.04 0.20 0.04 0.16 0.16 0.16 0.13 0
Shree Nath Commercial & Finance 201403 12.65 5.77 0.18 6.63 -0.69 0.00 -0.69 -0.14 -0.62 -0.55 -0.49 0
Shree Nath Commercial & Finance 201406 12.65 0.96 0.24 0.20 0.00 1.00 1.00 1.00 1.00 0.79 0
Shree Precoated Steels 201309 82.80 0.05 0.25 -0.20 0.02 -0.22 -0.22 -0.22 -0.03 0
Shree Precoated Steels 201312 82.80 0.59 0.72 -0.13 0.02 -0.15 -0.15 -0.15 -0.02 0
Shree Precoated Steels 201403 82.80 1.93 1.76 0.17 0.17 30.52 0.17 0.02 0
Shree Precoated Steels 201406 82.80 16.38 12.68 3.70 3.70 3.70 3.70 0.45 0
Shree Salasar Investments 201309 0.20 0.03 -0.03 -0.03 -0.03 -0.03 -1.68 0
Shree Salasar Investments 201312 0.20 0.01 0.08 -0.07 0.00 -0.07 -0.07 -0.07 -3.40 0
Shree Salasar Investments 201403 0.20 0.24 0.10 0.14 0.00 0.14 0.01 0.13 0.13 6.64 0
Shree Salasar Investments 201406 0.20 0.04 0.11 0.06 -0.01 0.00 -0.01 -0.01 -0.01 -0.55 0

Co_Name Year Equity N.Sale O.O.I T. Exp O.I PBIDT Int. Dep. PBT T.Tax PAT A.PAT EPS Div (%)
Exp
ecte
d R
esu
lts
on
14
No
vem
ber
201
4
Shree Shaleen Textiles 201309 16.64 1.38 0.18 1.27 0.07 0.36 0.00 0.36 0.00 0.36 0.36 0.04 0
Shree Shaleen Textiles 201312 16.64 0.09 0.17 0.27 0.00 -0.01 0.00 -0.01 0.00 -0.01 -0.01 0
Shree Shaleen Textiles 201403 16.64 0.12 0.32 0.36 -0.07 0.01 0.01 0.03 -0.02 -0.02 0
Shree Shaleen Textiles 201406 16.64 0.26 0.18 0.29 0.17 0.17 0.17 0.17 0.02 0
Shreejal Info Hubs 201309 7.50 0.05 0.03 0.02 0.02 0.00 0.00 0.00 0.01 0
Shreejal Info Hubs 201312 7.50 0.10 0.07 0.03 0.03 0.00 0.00 0.00 0
Shreejal Info Hubs 201403 7.50 0.03 0.01 0.01 0.00 0.02 0.00 0.00 0.00 0.00 0
Shreejal Info Hubs 201406 7.50 0.05 0.03 0.02 0.01 0.00 0.00 0.00 0
Shreeyash Industries 201309 5.44 0.17 0.19 -0.02 -0.02 -0.02 -0.02 -0.03 0
Shreeyash Industries 201312 5.44 0.17 0.20 -0.03 -0.03 -0.03 -0.03 -0.06 0
Shreeyash Industries 201403 5.44 0.18 0.20 -0.02 -0.02 -0.02 -0.02 -0.04 0
Shreeyash Industries 201406 5.44 0.01 0.13 -0.12 -0.12 -0.09 -0.12 -0.23 0
Shri Bajrang Alloys 201309 9.00 29.63 28.36 0.00 1.27 0.63 0.22 0.43 0.14 0.29 0.29 0.32 0
Shri Bajrang Alloys 201312 9.00 29.50 27.58 0.00 1.93 1.16 0.24 0.52 0.17 0.35 0.35 0.39 0
Shri Bajrang Alloys 201403 9.00 26.50 24.52 0.02 1.99 1.29 0.16 0.54 0.17 0.37 0.37 0.41 0
Shri Bajrang Alloys 201406 9.00 20.30 18.65 1.64 1.14 0.16 0.34 0.09 0.25 0.25 0.28 0
Shri Jagdamba Polymers 201309 0.88 20.63 16.57 4.06 1.84 0.51 1.72 0.17 1.55 1.55 17.64 10
Shri Jagdamba Polymers 201312 0.88 20.26 0.10 18.51 1.85 0.28 0.66 0.91 0.16 0.75 0.75 8.58 10
Shri Jagdamba Polymers 201403 0.88 25.02 0.61 24.06 1.57 0.47 0.58 0.53 0.29 0.24 0.24 2.68 10
Shri Jagdamba Polymers 201406 0.88 30.98 0.57 29.15 2.40 0.68 0.66 1.07 0.42 0.65 0.65 7.41 10
Shri Krishna Devcon 201309 28.00 0.27 0.36 0.27 0.18 0.11 0.04 0.03 0.04 -0.01 -0.01 0
Shri Krishna Devcon 201312 28.00 0.30 0.28 0.15 0.17 0.01 0.04 0.12 0.04 0.09 0.09 0.03 0
Shri Krishna Devcon 201403 28.00 28.36 27.10 0.41 1.66 0.01 0.04 1.62 0.51 1.12 1.12 0.40 0
Shri Krishna Devcon 201406 28.00 0.30 0.43 0.22 0.09 0.01 0.05 0.03 0.01 0.02 0.02 0.01 0
Shri Lakshmi Cotsyn 201309 28.47 322.54 309.68 3.84 16.70 84.32 25.00 -92.62 10.00 -102.62 -102.62 -36.04 0
Shri Lakshmi Cotsyn 201312 28.47 219.58 299.56 13.08 -66.90 65.02 27.31 -159.23 0.00 -159.23 -159.23 0
Shri Lakshmi Cotsyn 201403 28.47 188.62 321.80 6.09 -127.09 47.37 26.16 -200.62 -372.30 -200.62 0
Shri Lakshmi Cotsyn 201406 28.47 178.34 232.91 6.91 -47.66 75.77 26.25 -149.68 -234.31 -149.68 0
Shristi Infrastructure Development Corporation 201309 22.20 35.84 24.85 1.08 12.07 12.20 0.17 -0.29 0.66 -0.94 -1.00 -0.45 3
Shristi Infrastructure Development Corporation 201312 22.20 23.16 11.08 1.16 13.25 11.32 0.17 1.75 0.54 1.21 1.24 0.56 3
Shristi Infrastructure Development Corporation 201403 22.20 55.90 45.54 1.74 12.10 10.46 0.18 1.46 -0.65 2.10 2.14 0.96 3
Shristi Infrastructure Development Corporation 201406 22.20 35.27 24.14 0.40 11.52 10.63 0.16 0.73 0.33 0.40 0.40 0.18 3
Shyamal Holdings & Trading 201309 0.24 0.01 0.01 0.00 0.00 0.00 0.00 -0.01 0
Shyamal Holdings & Trading 201312 0.24 0.01 0.01 0.01 0
Shyamal Holdings & Trading 201403 0.24 0.01 0.01 0.00 0.00 0.00 0.00 0.06 0
Shyamal Holdings & Trading 201406 0.24 0.01 0.02 -0.01 -0.01 -0.01 -0.01 -0.20 0

Co_Name Year Equity N.Sale O.O.I T. Exp O.I PBIDT Int. Dep. PBT T.Tax PAT A.PAT EPS Div (%)
Exp
ecte
d R
esu
lts
on
14
No
vem
ber
201
4
Sikozy Realtors 201309 4.46 0.03 -0.03 0.00 -0.03 -0.03 -0.03 -0.01 0
Sikozy Realtors 201312 4.46 0.03 -0.03 0.00 -0.03 -0.03 -0.03 -0.01 0
Sikozy Realtors 201403 4.46 0.03 -0.03 0.00 -0.03 0.03 -0.06 -0.06 -0.13 0
Sikozy Realtors 201406 4.46 0.07 -0.07 0.00 -0.07 -0.07 -0.07 -0.02 0
Silveroak Commercials 201309 2.75 0.00 0.00 0.00 0.00 0.00 -0.01 0
Silveroak Commercials 201312 2.75 0.00 0.00 0.00 0.00 0.00 -0.01 0
Silveroak Commercials 201406 2.75 1.37 0.01 1.36 0.02 0.01 0.02 0.02 0.02 0.06 0
Silverton Spinners 201309 38.86 33.38 30.19 0.04 3.22 2.70 1.63 -1.11 -1.11 -1.11 -0.29 0
Silverton Spinners 201312 38.86 28.97 33.62 0.46 -4.19 2.20 1.43 -7.82 5.13 -12.95 -12.95 -3.33 0
Silverton Spinners 201403 38.86 50.95 51.45 0.07 -0.43 3.15 1.63 -5.21 -5.21 -5.21 -1.34 0
Silverton Spinners 201406 38.86 21.46 25.37 0.03 -3.87 3.21 1.63 -8.72 -8.72 -8.72 -2.24 0
Simbhaoli Sugars 201309 28.36 224.36 0.01 242.47 1.28 -16.82 44.03 10.43 -71.28 -4.40 -66.88 -60.11 -21.56 0
Simbhaoli Sugars 201312 28.36 150.58 0.60 183.47 1.49 -30.80 33.97 10.47 -75.24 -4.82 -70.42 -65.48 -23.46 0
Simbhaoli Sugars 201403 28.36 299.57 1.43 255.48 0.78 46.30 31.49 10.31 -6.08 2.40 -8.48 -10.91 -4.13 0
Simbhaoli Sugars 201406 28.36 218.67 0.51 216.00 0.82 4.00 34.45 7.47 -37.92 -1.60 -36.32 -34.59 -12.52 0
Simplex Castings 201309 5.98 43.97 40.19 0.06 3.84 1.51 1.58 0.75 0.30 0.45 0.45 0.74 5
Simplex Castings 201312 5.98 37.82 33.35 0.21 4.69 2.85 1.37 0.47 0.20 0.27 0.27 0.45 5
Simplex Castings 201403 5.98 39.07 30.38 0.18 8.87 6.57 1.67 0.63 0.52 0.11 0.11 0.18 5
Simplex Castings 201406 5.98 35.73 32.08 0.96 4.62 2.86 1.44 0.32 0.11 0.21 0.21 0.34 5
Simplex Infrastructures 201309 9.93 1282.16 2.42 1157.87 11.01 137.72 81.87 33.98 21.87 10.60 11.27 11.27 2.28 25
Simplex Infrastructures 201312 9.93 1389.55 2.46 1263.90 12.32 140.43 86.38 34.13 19.92 4.75 15.17 15.17 3.07 25
Simplex Infrastructures 201403 9.93 1434.66 6.44 1305.68 10.47 145.89 89.87 34.38 21.64 0.27 21.37 21.37 4.32 25
Simplex Infrastructures 201406 9.93 1340.41 6.99 1212.28 11.13 146.25 90.99 35.23 20.03 7.33 12.70 12.70 2.57 25
Simplex Projects 201309 12.60 94.34 0.21 81.82 0.86 13.59 9.77 3.29 -0.07 0.23 -0.30 -0.30 -0.24 0
Simplex Projects 201312 12.60 104.05 0.50 88.23 1.15 17.47 10.94 3.44 -0.20 0.22 -0.42 -0.42 -0.33 0
Simplex Projects 201403 12.60 266.00 0.96 250.84 2.42 18.55 12.56 3.27 1.77 -0.11 1.88 1.88 0
Simplex Projects 201406 12.60 163.16 0.85 153.07 2.52 13.46 12.70 5.34 -6.12 -6.12 -6.12 1.84 0
Simran Farms 201309 3.79 89.62 0.01 87.97 1.66 0.41 0.34 0.91 0.18 0.73 0.73 1.91 0
Simran Farms 201312 3.79 93.63 0.00 103.45 -9.82 0.26 0.34 -10.43 -0.22 -10.21 -10.21 -26.92 0
Simran Farms 201403 3.79 101.96 0.00 91.09 10.88 0.38 0.32 10.18 0.22 9.95 9.95 26.25 0
Simran Farms 201406 3.79 98.29 0.00 97.02 1.27 0.70 0.45 0.12 0.02 0.10 0.10 0.25 0
Sinclairs Hotels 201309 6.07 3.79 0.25 3.55 0.24 0.73 0.58 2.92 0.19 2.73 2.73 4.50 40
Sinclairs Hotels 201312 5.57 5.90 0.42 4.39 0.79 2.72 0.81 3.38 0.97 2.41 2.41 3.98 40
Sinclairs Hotels 201403 5.57 5.56 0.61 4.53 0.42 2.05 0.72 1.33 0.63 0.70 0.70 1.39 40
Sinclairs Hotels 201406 5.57 7.44 0.55 4.49 0.10 3.59 0.92 2.68 2.68 2.68 4.80 40
Sky Industries 201406 3.98 15.10 0.24 14.01 0.55 1.88 0.67 0.41 0.02 0.02 -0.19 -0.47 7

Co_Name Year Equity N.Sale O.O.I T. Exp O.I PBIDT Int. Dep. PBT T.Tax PAT A.PAT EPS Div (%)
Exp
ecte
d R
esu
lts
on
14
No
vem
ber
201
4
SMC Credits 201309 10.02 0.73 0.03 0.21 0.92 0.01 0.91 0.04 0.86 0.86 0.86 0
SMC Credits 201312 10.02 0.04 0.03 0.21 0.23 0.01 0.22 0.04 0.18 0.18 0.17 0
SMC Credits 201403 10.02 0.06 0.06 0.19 0.19 0.01 0.18 0.05 0.14 0.14 0.14 0
SMC Credits 201406 10.02 0.04 0.04 0.22 0.22 0.02 0.21 0.05 0.16 0.16 0.16 0
Smiths & Founders (India) 201309 4.32 0.03 0.01 -0.02 0.04 -0.06 -0.06 -0.06 -0.01 0
Smiths & Founders (India) 201312 4.32 0.02 0.01 -0.01 0.04 -0.05 -0.05 -0.05 -0.01 0
Smiths & Founders (India) 201403 0.43 6.76 6.97 0.08 -0.13 0.65 0.24 -1.02 -0.23 -0.79 -0.79 -1.83 0
Smiths & Founders (India) 201406 4.32 1.37 1.53 0.02 -0.13 0.17 0.11 -0.41 -0.41 -0.41 -0.94 0
Smruthi Organics 201309 3.82 22.19 0.22 20.82 1.59 1.02 1.50 -0.93 0.06 -0.99 -0.99 -2.59 0
Smruthi Organics 201312 3.82 19.52 0.15 20.14 -0.47 1.31 1.54 -3.32 -3.32 -3.32 -8.71 0
Smruthi Organics 201403 3.82 26.98 0.16 28.23 0.06 -1.03 1.80 1.56 -4.40 -3.20 -1.19 -1.19 -3.13 0
Smruthi Organics 201406 3.82 25.94 0.14 24.50 1.59 1.29 1.43 -1.13 -1.13 -1.13 -2.97 0
Softsol India 201309 17.24 1.90 0.00 2.21 2.90 2.58 0.00 0.74 1.85 0.56 1.29 1.29 0.76 0
Softsol India 201312 17.24 0.65 0.00 2.06 2.69 1.28 0.78 0.50 -0.10 0.60 0.60 0.36 0
Softsol India 201403 17.24 3.09 0.14 4.83 2.67 1.06 0.76 0.30 0.91 -0.61 -0.61 -0.36 0
Softsol India 201406 17.24 0.52 0.01 1.91 2.43 1.05 1.11 -0.06 -0.06 -0.06 -0.03 0
Solid Carbide Tools 201309 6.52 0.01 -0.01 0.04 -0.05 -0.05 -0.05 -0.06 0
Solid Carbide Tools 201312 8.86 0.01 -0.01 0.04 -0.05 -0.05 -0.05 -0.06 0
Solid Carbide Tools 201406 0.89 0.24 -0.24 0.04 -0.28 -0.28 -0.28 -0.31 0
Som Distilleries & Breweries 201309 27.52 34.40 0.20 29.28 5.33 0.00 1.16 4.17 0.71 3.46 3.46 1.26 15
Som Distilleries & Breweries 201312 27.52 37.52 0.27 31.94 5.86 0.01 1.16 4.69 0.93 3.76 3.76 1.36 15
Som Distilleries & Breweries 201403 27.52 39.69 1.03 33.51 7.21 0.14 1.33 5.74 0.06 5.68 5.68 2.06 15
Som Distilleries & Breweries 201406 27.52 70.18 0.36 59.74 10.81 0.34 1.22 9.25 3.08 6.17 6.17 2.24 15
Soma Textiles & Industries 201309 33.23 71.78 0.34 69.13 1.05 4.04 5.73 3.14 0.22 0.22 0.22 0.07 0
Soma Textiles & Industries 201312 33.23 58.56 0.03 64.04 0.73 -4.72 5.46 3.10 -14.55 -14.55 -14.55 -4.40 0
Soma Textiles & Industries 201403 33.23 69.87 0.02 67.03 0.89 3.75 6.09 2.99 -8.33 -4.35 -3.98 -3.98 -1.20 0
Soma Textiles & Industries 201406 33.23 71.24 74.12 1.03 -1.85 6.04 7.74 -15.21 -15.21 -15.21 -4.61 0
Southern Online Bio Technologies 201309 51.28 63.02 61.25 0.14 1.91 4.63 1.73 -4.45 -4.45 -4.45 -0.87 0
Southern Online Bio Technologies 201312 51.28 40.71 42.44 0.07 -1.67 4.74 1.62 -8.02 -8.02 -8.02 -1.56 0
Southern Online Bio Technologies 201403 34.61 42.69 42.54 -0.12 0.04 4.04 2.38 -6.37 -8.20 1.83 1.83 0.53 0
Southern Online Bio Technologies 201406 58.99 74.07 69.21 0.08 4.94 4.07 3.78 -2.92 -2.30 -0.62 -0.62 -0.11 0
Sovereign Diamonds 201309 5.79 6.86 0.02 6.34 0.55 0.41 0.07 0.07 0.02 0.05 0.05 0.08 0
Sovereign Diamonds 201312 5.79 11.71 0.00 10.41 1.30 0.42 0.11 0.77 0.24 0.53 0.53 0.92 0
Sovereign Diamonds 201403 5.79 14.76 0.17 13.69 0.00 1.24 0.44 0.12 0.67 0.27 0.40 0.40 1.76 0
Sovereign Diamonds 201406 5.79 11.87 0.01 10.78 1.10 0.48 0.11 0.52 0.16 0.36 0.36 0.62 0

Co_Name Year Equity N.Sale O.O.I T. Exp O.I PBIDT Int. Dep. PBT T.Tax PAT A.PAT EPS Div (%)
Exp
ecte
d R
esu
lts
on
14
No
vem
ber
201
4
Sparc Systems 201309 4.96 0.06 0.05 0.00 0.01 0.02 0.00 0.00 0.00 0
Sparc Systems 201312 4.97 0.01 0.03 0.00 -0.02 0.01 -0.03 -0.03 -0.03 -0.06 0
Sparc Systems 201403 4.97 0.03 0.21 0.01 -0.18 0.02 -0.19 -0.01 -0.19 -0.18 -0.38 0
Sparc Systems 201406 4.97 0.02 0.05 0.00 -0.02 0.00 -0.02 -0.02 -0.02 -0.04 0
Spectra Industries 201309 7.08 18.99 0.10 19.60 0.03 -0.48 0.20 0.16 -0.84 -0.84 -0.84 -1.18 0
Spectra Industries 201312 7.08 16.07 0.11 16.29 0.10 -0.01 0.14 0.16 -0.31 -0.31 -0.31 -0.44 0
Spectra Industries 201403 7.08 17.60 0.12 17.24 0.13 0.61 0.57 0.05 -0.01 -0.01 -0.01 -0.01 0
Spectra Industries 201406 7.08 18.89 0.12 18.59 0.04 0.47 0.27 0.15 0.05 0.05 0.05 0.06 0
Spentex Industries 201309 89.77 307.66 2.43 288.00 3.08 25.17 19.39 4.57 1.21 1.21 1.21 0.14 0
Spentex Industries 201312 89.77 281.62 1.10 266.87 0.79 16.64 20.67 4.46 -8.49 -8.49 -8.49 -0.95 0
Spentex Industries 201403 89.77 276.65 0.68 260.53 2.39 19.19 20.33 4.41 -6.12 -6.12 -6.12 -0.68 0
Spentex Industries 201406 89.77 265.85 0.33 257.87 3.14 11.44 19.55 4.18 -12.29 -10.92 -12.29 -1.22 0
Spice Islands Apparels 201309 4.30 4.16 4.24 0.14 0.05 0.08 0.04 -0.07 -0.01 -0.06 -0.06 -0.13 10
Spice Islands Apparels 201312 4.30 4.38 4.11 0.22 0.48 0.05 0.05 0.38 0.03 0.36 0.36 0.83 10
Spice Islands Apparels 201403 4.30 4.76 5.40 0.65 0.01 0.03 0.08 -0.10 -0.05 -0.05 -0.05 -0.11 10
Spice Islands Apparels 201406 4.30 4.50 4.52 0.14 0.13 0.02 0.06 0.05 0.02 0.03 0.03 0.01 10
Spice Mobility 201309 70.27 534.02 0.76 517.54 3.77 21.01 0.46 8.79 9.12 1.01 8.11 8.13 0.34 50
Spice Mobility 201312 68.36 567.04 1.12 558.34 5.20 15.02 0.21 9.77 2.12 1.04 1.08 1.02 0.04 50
Spice Mobility 201403 68.36 468.41 0.58 479.21 2.53 -7.69 0.20 9.70 -17.69 0.52 -18.21 -18.67 -0.81 50
Spice Mobility 201406 68.36 541.17 0.09 540.14 3.73 4.85 0.31 6.71 -16.84 1.74 -18.58 -18.62 -0.82 50
Spicejet 201309 520.28 1246.08 11.14 1748.46 7.64 -483.60 32.73 43.17 -559.49 -559.49 -559.49 -10.75 0
Spicejet 201312 535.28 1796.27 11.47 1929.91 12.03 -110.15 30.25 32.39 -172.80 0.00 -172.80 -172.80 -3.29 0
Spicejet 201403 535.28 1573.41 16.21 1866.14 41.76 -234.77 45.06 41.69 -321.51 -321.51 -321.51 -6.01 0
Spicejet 201406 535.28 1678.59 12.45 1750.67 16.50 -43.13 48.70 32.28 -124.10 -124.10 -124.10 -2.32 0
SPL Industries 201309 29.00 12.91 0.20 9.87 3.25 0.03 0.93 2.28 2.28 2.28 0.79 0
SPL Industries 201312 29.00 9.03 0.06 6.97 2.12 0.01 0.86 1.22 1.22 1.22 0.42 0
SPL Industries 201403 29.00 10.44 0.42 11.26 0.53 0.12 0.04 0.79 -0.58 0.30 -0.88 -0.88 -0.30 0
SPL Industries 201406 29.00 11.27 0.16 11.16 0.04 0.31 0.01 0.73 -0.42 -0.42 -0.42 -0.15 0
Splash Media & Infra 201309 9.37 0.09 0.07 0.10 0.05 0.00 0.05 0.05 0.05 0.02 0
Splash Media & Infra 201312 9.37 0.09 0.08 0.01 0.00 0.01 0.01 0.01 0.01 0
Splash Media & Infra 201403 9.37 0.21 0.19 0.23 0.17 0.02 0.00 0.15 0.06 0.09 0.09 0.01 0
Splash Media & Infra 201406 9.37 0.16 0.05 0.11 0.02 0.00 0.09 0.09 0.09 0.01 0
Springform Technology 201309 0.05 0.02 0.02 0.00 0.00 0.00 0.00 0.32 0
Springform Technology 201312 0.05 0.02 0.02 0.00 0.00 0.00 0.00 0.68 0
Springform Technology 201403 0.05 0.03 0.03 -0.01 -0.01 0.00 -0.01 -0.01 0
Springform Technology 201406 0.05 0.04 0.04 0.01 0.01 0.01 0.01 0.98 0

Co_Name Year Equity N.Sale O.O.I T. Exp O.I PBIDT Int. Dep. PBT T.Tax PAT A.PAT EPS Div (%)
Exp
ecte
d R
esu
lts
on
14
No
vem
ber
201
4
SPS International 201309 3.23 3.02 2.57 0.03 0.48 0.03 0.15 0.30 0.09 0.20 0.21 0.63 0
SPS International 201312 3.23 4.88 4.28 0.09 0.69 0.03 0.16 0.50 0.15 0.35 0.35 1.09 0
SPS International 201403 3.23 4.33 4.53 0.04 -0.17 0.04 0.31 -0.52 -0.19 -0.33 -0.33 -1.02 0
SPS International 201406 3.23 4.23 3.72 0.50 0.04 0.12 0.35 0.11 0.24 0.24 0.74 0
Square Four Projects India 201309 9.81 0.02 -0.02 -0.02 -0.02 -0.02 0
Square Four Projects India 201312 9.81 0.02 -0.02 -0.02 -0.02 -0.02 -0.02 0
Square Four Projects India 201403 9.81 0.05 0.18 0.14 0.14 0.14 0.14 0.14 0
Square Four Projects India 201406 9.81 0.02 0.00 -0.02 -0.02 -0.02 -0.02 -0.02 0
Sree Rayalaseema Hi-Strength Hypo 201309 14.72 72.56 62.67 2.37 12.26 1.91 3.58 4.58 1.49 3.09 3.09 2.71 0
Sree Rayalaseema Hi-Strength Hypo 201312 14.72 74.85 69.28 3.71 9.27 2.56 3.97 3.36 1.09 2.27 2.27 4.26 0
Sree Rayalaseema Hi-Strength Hypo 201403 14.72 83.74 77.32 1.62 8.05 2.72 3.98 2.38 1.21 1.17 1.17 5.05 0
Sree Rayalaseema Hi-Strength Hypo 201406 14.72 255.91 216.20 1.18 40.89 10.44 12.04 19.90 2.52 17.39 4.54 3.08 0
Sreeleathers 201309 25.16 18.44 14.67 0.42 4.18 0.13 0.23 3.82 1.29 2.53 2.53 1.01 3
Sreeleathers 201312 25.16 13.55 10.94 0.43 3.03 0.36 0.23 2.45 0.70 1.74 1.74 0.69 3
Sreeleathers 201403 25.16 12.66 10.66 0.33 2.33 0.32 0.23 1.78 0.73 1.05 1.05 0.42 3
Sreeleathers 201406 25.16 15.59 12.44 0.13 3.28 0.35 0.29 2.65 0.97 1.68 1.68 0.67 3
Sri Adhikari Brothers Television Network 201309 24.95 18.13 13.09 0.01 5.04 0.44 2.32 2.28 2.28 2.28 0.91 6
Sri Adhikari Brothers Television Network 201312 24.95 19.13 13.14 0.17 6.17 0.74 2.33 3.10 3.10 3.10 1.24 6
Sri Adhikari Brothers Television Network 201403 27.77 16.71 15.44 0.02 1.29 0.80 2.28 -1.80 1.81 -3.60 -3.60 -1.44 6
Sri Adhikari Brothers Television Network 201406 24.95 19.81 14.64 0.02 5.19 0.38 2.19 2.63 2.63 2.63 0.82 6
Sri Ganapathy Mills Company 201309 6.67 4.33 0.31 4.06 0.02 0.60 0.41 0.42 -0.23 -0.23 -0.23 -0.35 0
Sri Ganapathy Mills Company 201312 6.67 4.14 0.18 4.16 0.02 0.18 0.53 0.42 -0.77 -0.77 -0.77 -1.15 0
Sri Ganapathy Mills Company 201403 6.67 4.05 0.09 4.55 0.01 -0.39 0.32 0.30 -1.77 -1.77 -1.77 -2.65 0
Sri Ganapathy Mills Company 201406 6.67 4.35 0.10 4.47 0.02 0.00 0.33 0.38 -0.75 -0.75 -0.75 -1.12 0
SRK Industries 201309 39.23 3.90 3.27 0.63 0.01 0.62 0.19 0.43 0.43 0.16 1
SRK Industries 201312 39.23 7.93 0.37 7.82 0.48 0.01 0.47 0.15 0.32 0.32 0.06 1
SRK Industries 201403 39.23 2.66 0.35 2.68 0.33 0.01 0.32 0.13 0.19 0.19 0.04 1
SRK Industries 201406 39.23 1.54 0.36 1.58 0.32 0.01 0.31 0.07 0.24 0.24 0.04 1
SRM Energy 201309 9.06 0.03 -0.03 -0.03 -0.03 -0.03 -0.03 0
SRM Energy 201312 9.06 0.00 0.07 0.00 -0.07 0.00 -0.07 0.00 -0.07 -0.07 -0.08 0
SRM Energy 201403 9.06 0.29 -0.29 -0.29 -0.29 -0.29 -0.32 0
SRM Energy 201406 9.06 0.01 -0.01 -0.01 -0.01 -0.01 -0.14 0
SS Forgings & Engineering 201309 7.80 0.02 0.01 0.01 0.02 -0.01 -0.01 0.00 0.00 0.00 0
SS Forgings & Engineering 201312 7.80 0.03 0.01 0.02 -0.01 0.00 0.00 0.00 0
SS Forgings & Engineering 201403 7.80 0.40 0.42 -0.02 0.02 -0.03 -0.03 -0.03 -0.04 0
SS Forgings & Engineering 201406 7.80 0.06 0.04 0.02 0.02 0.00 0.00 0.00 0

Co_Name Year Equity N.Sale O.O.I T. Exp O.I PBIDT Int. Dep. PBT T.Tax PAT A.PAT EPS Div (%)
Exp
ecte
d R
esu
lts
on
14
No
vem
ber
201
4
SS Organics 201309 10.20 0.23 1.33 0.00 -1.10 0.00 0.28 -1.38 0.00 -1.38 -1.38 -1.35 0
SS Organics 201312 10.20 0.87 1.78 -0.91 0.29 -1.20 -1.20 -1.20 -1.18 0
SS Organics 201403 10.20 1.51 2.18 0.10 -0.57 0.01 0.29 -0.87 -0.87 -0.87 -0.85 0
SS Organics 201406 10.20 1.36 2.08 -0.72 0.04 0.30 -1.06 -1.06 -1.06 -1.04 0
SSK Lifestyles 201309 3.02 0.06 0.11 -0.04 0.09 -0.13 -0.13 -0.13 -0.44 0
SSK Lifestyles 201312 3.02 0.09 0.18 -0.09 0.09 -0.18 -0.18 -0.18 -0.58 0
SSK Lifestyles 201403 3.02 0.13 0.01 0.12 0.02 0.05 -0.02 -0.02 -0.02 -1.07 0
SSK Lifestyles 201406 3.02 0.16 0.17 -0.01 0.04 -0.05 -0.05 -0.05 -0.15 0
Stampede Capital 201309 21.00 6.06 4.52 0.59 2.12 0.78 1.34 -0.08 1.42 1.42 0.68 0
Stampede Capital 201312 21.00 6.17 3.71 -0.14 2.32 0.81 1.51 0.17 1.34 1.34 0.64 0
Stampede Capital 201403 21.00 6.33 4.06 -0.50 1.77 0.85 0.92 -1.31 -3.63 -3.63 -1.74 0
Stampede Capital 201406 21.27 10.13 7.44 0.02 2.72 0.97 1.74 0.67 1.07 1.07 0.50 0
Standard Batteries 201309 0.52 0.15 0.20 0.05 0.00 0.05 0.05 0.05 0.09 0
Standard Batteries 201312 0.52 0.12 0.20 0.08 0.00 0.08 0.08 0.08 0.15 0
Standard Batteries 201403 0.52 0.15 0.27 0.20 0.08 0.00 0.08 2.03 -1.95 -1.95 -3.78 0
Standard Batteries 201406 0.52 0.14 0.18 0.04 0.00 0.04 0.05 -0.02 -0.02 -0.03 0
Standard Capital Markets 201309 4.00 0.08 0.03 0.04 0.00 0.04 0.01 0.03 0.03 0.07 0
Standard Capital Markets 201312 4.00 0.07 0.03 0.04 0.00 0.04 0.01 0.03 0.03 0.07 0
Standard Capital Markets 201403 4.00 -0.05 0.03 -0.08 -0.08 0.01 -0.08 -0.08 -0.21 0
Standard Capital Markets 201406 4.00 0.08 0.06 0.02 0.00 0.02 0.01 0.01 0.01 0.03 0
State Bank Of India 201309 684.03 46946.76 14313.54 6171.87 8618.58 30186.51 4214.75 1025.49 3189.26 3072.77 44.92 300
State Bank Of India 201312 684.00 48367.49 17592.62 10274.67 9878.86 31170.68 4635.84 1753.68 2882.16 2838.62 41.50 300
State Bank Of India 201403 746.57 49439.33 17617.30 13242.15 13270.34 31793.84 0.00 6218.81 2196.71 4022.10 3963.82 300
State Bank Of India 201406 746.57 50041.75 17056.50 10579.18 11544.62 32019.81 0.00 6989.98 2402.27 4587.71 4448.15 59.58 300
Steel Exchange India 201309 51.95 312.30 305.32 2.08 9.06 18.87 3.90 -13.72 -13.72 -13.72 -2.64 0
Steel Exchange India 201312 51.95 289.84 245.59 1.41 45.66 18.24 3.70 23.72 23.72 23.72 4.57 0
Steel Exchange India 201403 51.95 342.79 290.43 2.88 55.24 25.17 3.69 26.39 3.28 23.11 23.11 4.45 0
Steel Exchange India 201406 51.95 296.76 266.03 2.07 32.80 19.44 4.30 9.05 9.05 9.05 1.74 0
Steelco Gujarat 201309 42.55 127.14 3.70 123.56 0.41 7.68 4.63 1.16 1.89 1.89 1.89 0.20 0
Steelco Gujarat 201312 42.55 133.08 2.81 133.68 0.88 3.09 5.03 1.18 -3.13 0.00 -3.13 -3.13 -0.98 0
Steelco Gujarat 201403 42.56 139.01 5.69 139.87 2.88 7.72 5.81 0.96 0.94 0.00 0.94 0.94 -0.03 0
Steelco Gujarat 201406 42.56 117.56 3.66 120.82 0.80 1.19 4.94 2.51 -6.25 -6.25 -6.25 -1.72 0
Stellant Securities (India) 201309 3.70 0.02 0.00 -0.01 -0.01 -0.01 -0.01 -0.04 0
Stellant Securities (India) 201312 3.70 0.01 0.00 -0.01 -0.01 -0.01 -0.01 -0.04 0
Stellant Securities (India) 201403 3.70 0.36 -0.36 -0.36 -0.36 -0.36 -0.96 0
Stellant Securities (India) 201406 3.70 0.01 -0.01 -0.01 -0.01 -0.01 0

Co_Name Year Equity N.Sale O.O.I T. Exp O.I PBIDT Int. Dep. PBT T.Tax PAT A.PAT EPS Div (%)
Exp
ecte
d R
esu
lts
on
14
No
vem
ber
201
4
Sterling Biotech 201309 26.79 161.35 1.11 135.24 27.22 110.99 63.35 -147.11 -47.73 -99.38 -99.38 -3.71 0
Sterling Biotech 201312 26.79 150.75 0.53 128.40 0.00 22.88 115.33 64.44 -156.89 -50.90 -105.99 -105.99 -3.96 0
Sterling Biotech 201403 26.79 188.21 0.62 152.09 36.74 125.81 63.89 -152.96 -49.63 -103.33 -103.33 -3.86 0
Sterling Biotech 201406 26.80 184.36 1.30 147.70 37.96 127.52 64.06 -153.61 -49.84 -110.27 -103.77 -4.11 0
Sterling Green Woods 201309 4.24 0.39 0.54 0.55 0.40 0.12 0.15 0.14 0.04 0.10 0.10 0.23 0
Sterling Green Woods 201312 4.24 0.52 0.38 0.49 0.63 0.12 0.15 0.36 0.07 0.29 0.29 -0.69 0
Sterling Green Woods 201403 4.24 0.76 0.93 0.83 0.65 0.15 0.12 0.39 0.13 0.25 0.25 0.59 0
Sterling Green Woods 201406 4.24 0.57 0.42 0.52 0.67 0.16 0.15 0.37 0.11 0.26 0.26 0.61 0
Stone India 201309 7.60 27.22 0.03 26.18 0.06 1.13 1.34 0.67 -0.88 -0.02 -0.86 -0.86 -1.13 0
Stone India 201312 7.60 26.23 0.04 23.39 0.02 2.90 1.44 0.67 0.52 0.52 0.52 0.68 0
Stone India 201403 8.18 25.83 0.16 25.72 0.09 0.36 1.47 0.67 -2.46 -1.27 -1.19 -1.19 -1.56 0
Stone India 201406 8.18 22.71 0.04 21.32 0.06 1.49 1.30 0.63 -0.43 0.10 -0.53 -0.53 -0.65 0
Sudal Industries 201309 6.51 18.02 16.31 0.01 1.72 1.17 0.41 0.14 0.01 0.13 0.13 0.20 0
Sudal Industries 201312 6.51 17.73 16.01 1.72 1.23 0.44 0.05 0.00 0.06 0.06 0.09 0
Sudal Industries 201403 6.51 22.16 19.64 0.02 2.54 1.59 0.42 0.53 0.51 0.02 0.02 0.03 0
Sudal Industries 201406 6.51 22.65 20.67 1.99 1.80 0.40 -0.22 -0.22 -0.22 -0.33 0
Sudarshan Chemical Industries 201309 6.92 270.13 0.98 238.92 -0.89 31.31 8.85 8.78 13.68 3.42 10.27 10.27 14.83 150
Sudarshan Chemical Industries 201312 6.92 241.57 1.50 209.48 0.38 33.98 10.53 9.02 14.43 6.37 8.06 8.06 11.64 150
Sudarshan Chemical Industries 201403 6.92 266.12 0.87 240.45 3.25 29.79 8.35 8.93 12.52 7.34 5.18 5.18 7.48 150
Sudarshan Chemical Industries 201406 6.92 267.25 238.76 8.83 37.32 11.44 9.70 16.18 4.60 11.58 11.58 16.73 150
Sudev Industries 201309 3.50 0.01 -0.01 -0.01 -0.01 -0.01 0
Sudev Industries 201312 3.50 0.01 -0.01 -0.01 -0.01 -0.01 0
Sudev Industries 201403 3.50 0.01 -0.01 -0.01 -0.01 -0.01 0
Sudev Industries 201406 3.50 0.01 -0.01 -0.01 -0.01 -0.01 0
Sundaram Multi Pap 201309 21.56 38.67 34.47 0.36 4.57 3.33 1.01 0.24 0.18 0.06 0.06 1
Sundaram Multi Pap 201312 21.56 30.95 28.06 0.05 2.93 3.00 1.01 -1.07 -0.21 -0.86 -0.86 -0.04 1
Sundaram Multi Pap 201403 21.56 34.74 31.29 -0.14 3.31 3.56 1.02 -1.28 -0.47 -0.80 -0.80 -0.04 1
Sundaram Multi Pap 201406 21.56 27.73 30.30 3.17 0.60 3.49 0.74 -3.63 -3.63 -3.63 -0.17 1
Sunil Hitech Engineers 201309 12.28 273.04 1.00 244.93 3.20 32.31 20.37 6.28 5.66 3.77 1.89 1.89 1.54 12
Sunil Hitech Engineers 201312 12.28 362.09 0.63 329.21 2.06 35.57 19.51 6.21 9.84 3.58 6.26 6.26 0.51 12
Sunil Hitech Engineers 201403 13.63 494.74 0.77 454.74 2.71 43.48 20.20 6.18 17.10 6.42 10.69 10.69 8.63 12
Sunil Hitech Engineers 201406 13.63 384.06 0.39 346.60 2.99 40.85 20.32 6.15 14.38 5.35 9.03 9.03 6.63 12
Sunil Industries 201309 4.20 46.46 45.23 0.22 1.45 0.55 0.17 0.74 0.26 0.48 0.48 1.14 0
Sunil Industries 201312 4.20 26.76 26.02 0.21 0.95 0.34 0.15 0.46 0.15 0.30 0.30 0.72 0
Sunil Industries 201403 4.20 30.08 28.70 0.28 1.66 0.84 0.32 0.50 0.19 0.31 0.31 0.74 0
Sunil Industries 201406 4.20 30.21 28.95 0.14 1.39 0.70 0.20 0.49 0.15 0.34 0.34 0.80 0

Co_Name Year Equity N.Sale O.O.I T. Exp O.I PBIDT Int. Dep. PBT T.Tax PAT A.PAT EPS Div (%)
Exp
ecte
d R
esu
lts
on
14
No
vem
ber
201
4
Sunitee Chemicals 201309 5.19 0.03 0.02 0.01 0.00 0.01 0.01 0.01 0
Sunitee Chemicals 201312 5.19 0.01 0.01 0.00 0.00 0.00 0.00 0.00 0
Sunitee Chemicals 201403 5.19 -0.04 0.06 0.01 0.00 0.00 0.00 0.00 0.00 0.00 0
Sunitee Chemicals 201406 5.19 0.03 0.03 0.00 0.00 0.00 0.00 0
Sunlake Resorts and Hotels 201309 8.02 0.00 0.00 0.00 0.00 0.00 0
Sunlake Resorts and Hotels 201312 8.02 0.00 0.00 0.00 0.00 0.00 0
Sunlake Resorts and Hotels 201403 8.02 0.01 -0.01 -0.01 -0.01 -0.01 0
Sunlake Resorts and Hotels 201406 8.02 0.00 0.00 0.00 0.00 0.00 -0.01 0
Sunraj Diamond Exports 201309 5.33 7.54 7.42 0.04 0.16 0.15 0.03 -0.02 -0.01 -0.02 -0.02 -0.03 0
Sunraj Diamond Exports 201312 5.33 11.86 11.10 0.02 0.78 0.28 0.03 0.47 0.16 0.31 0.31 0.58 0
Sunraj Diamond Exports 201403 5.33 9.87 9.83 0.04 0.08 0.54 0.03 -0.50 -0.01 -0.49 -0.49 -0.91 0
Sunraj Diamond Exports 201406 5.33 10.53 9.90 0.04 0.67 0.29 0.04 0.34 0.12 0.22 0.22 0.41 0
Sunrise Soaps & Chemicals 201309 45.66 22.42 22.19 0.00 0.22 0.00 0.02 0.21 0.00 0.21 0.21 0.05 0
Sunrise Soaps & Chemicals 201312 45.66 25.45 25.17 0.28 0.02 0.26 0.26 0.26 0.06 0
Sunrise Soaps & Chemicals 201403 45.66 28.29 28.05 0.24 0.00 0.01 0.23 0.34 -0.11 -0.11 -0.02 0
Sunrise Soaps & Chemicals 201406 45.66 38.28 37.89 0.39 0.01 0.38 0.12 0.26 0.26 0.06 0
Sunshield Chemicals 201309 7.35 34.18 0.05 31.35 0.22 3.10 1.00 0.71 1.39 0.27 1.12 1.12 1.52 0
Sunshield Chemicals 201312 7.35 34.81 0.11 32.35 4.53 7.10 3.42 0.72 2.96 1.34 1.62 1.62 2.21 0
Sunshield Chemicals 201403 7.35 36.39 1.05 34.68 -1.15 1.61 0.17 0.16 1.28 4.18 -2.91 -2.91 -3.95 0
Sunshield Chemicals 201406 7.35 30.71 0.06 29.14 0.04 1.67 0.89 0.66 0.12 0.09 0.03 0.03 0.04 0
Sunteck Realty 201309 11.99 3.63 4.41 2.71 1.93 2.33 0.35 -0.76 -0.14 -0.61 -0.62 -0.10 50
Sunteck Realty 201312 11.99 15.65 8.67 2.11 9.09 3.23 0.36 5.50 2.98 2.53 2.53 0.42 50
Sunteck Realty 201403 11.99 890.68 626.30 3.73 268.11 8.71 0.35 259.06 83.72 175.34 143.67 23.96 50
Sunteck Realty 201406 11.99 18.48 18.87 8.35 7.95 2.97 0.47 4.51 2.80 1.71 0.84 0.14 50
Superhouse 201309 11.42 193.38 1.03 168.77 0.60 26.23 4.34 3.26 16.28 5.27 11.00 11.00 9.98 15
Superhouse 201312 11.42 161.97 0.54 142.57 0.41 20.37 4.63 3.31 12.31 4.35 7.97 7.97 7.23 15
Superhouse 201403 11.42 182.94 1.32 162.87 0.33 21.72 4.98 3.34 14.11 4.87 9.24 9.24 8.38 15
Superhouse 201406 11.42 174.53 0.93 154.25 0.24 21.45 5.28 2.87 13.23 4.61 8.63 8.63 7.82 15
Supra Trends 201309 5.00 0.02 0.02 0.00 0.00 0.00 0.00 0
Supra Trends 201312 5.00 0.09 0.08 0.01 0.01 0.01 0.02 0
Supra Trends 201403 5.00 0.03 0.03 -0.01 -0.01 -0.01 -0.01 -0.01 0
Supra Trends 201406 5.00 0.03 0.03 0.00 0.00 0.00 0.00 -0.01 0
Supreme Infrastructure India 201309 16.74 311.55 262.41 2.99 52.12 30.03 9.08 13.01 4.22 8.79 8.79 5.25 15
Supreme Infrastructure India 201312 20.09 606.26 520.16 0.92 87.02 30.65 8.86 47.51 15.42 32.10 32.10 18.64 15
Supreme Infrastructure India 201403 20.09 799.37 695.36 1.10 105.10 42.69 9.87 52.54 25.52 27.02 27.02 13.45 15
Supreme Infrastructure India 201406 20.09 381.11 317.20 1.19 65.10 37.96 10.27 16.86 5.47 11.39 11.39 5.67 15

Co_Name Year Equity N.Sale O.O.I T. Exp O.I PBIDT Int. Dep. PBT T.Tax PAT A.PAT EPS Div (%)
Exp
ecte
d R
esu
lts
on
14
No
vem
ber
201
4
Supreme Tex Mart 201309 34.12 221.79 0.03 197.76 24.06 11.91 5.48 6.68 1.55 5.13 5.13 0.78 0
Supreme Tex Mart 201312 34.12 217.76 0.01 192.23 25.54 12.47 8.44 4.63 1.78 2.85 2.85 0.42 0
Supreme Tex Mart 201403 34.12 167.50 0.17 162.80 4.86 13.73 8.27 -17.13 -5.33 -11.80 -11.80 -1.77 0
Supreme Tex Mart 201406 34.12 107.25 0.00 91.43 15.82 11.93 11.14 -7.24 -1.91 -5.33 -5.33 -0.78 0
Surabhi Chemicals & Investment 201309 21.63 0.42 0.12 0.30 0.01 0.29 0.29 0.29 0.01 0
Surabhi Chemicals & Investment 201312 21.36 0.42 0.14 0.28 0.28 0.28 0.28 0.01 0
Surabhi Chemicals & Investment 201403 21.63 0.49 0.14 0.35 0.00 0.00 0.35 0.35 0.35 0.02 0
Surabhi Chemicals & Investment 201406 21.63 0.33 0.12 0.21 0.00 0.21 0.21 0.21 0.01 0
Suraj Industries 201309 7.33 0.00 0.00 0.00 0.00 0.00 0.00 0
Suraj Industries 201312 7.33 0.00 0.00 0.00 0.00 0.00 0.00 0
Surana Industries 201309 44.52 170.10 179.43 0.66 -8.66 26.04 9.44 -44.14 -15.47 -28.67 -28.67 -6.44 0
Surana Industries 201312 44.52 105.69 111.34 0.64 -5.01 42.36 10.12 -57.49 -21.26 -36.22 -36.22 -8.14 0
Surana Industries 201403 44.52 124.51 167.92 0.90 -42.51 53.31 2.62 -98.43 -34.03 -64.41 -64.41 -14.47 0
Surana Industries 201406 44.52 90.75 96.81 5.85 -0.21 17.05 0.87 -18.14 -7.33 -10.81 -10.81 -2.43 0
Surya Roshni 201309 43.83 778.00 723.32 0.30 54.98 24.60 13.85 16.53 2.08 14.45 14.45 3.30 10
Surya Roshni 201312 43.83 766.93 703.92 0.24 63.25 27.43 13.90 21.92 7.38 14.54 14.54 3.32 10
Surya Roshni 201403 43.83 777.51 715.83 2.81 64.49 37.75 14.11 12.63 2.45 10.18 10.18 2.31 10
Surya Roshni 201406 43.83 672.11 616.42 0.20 55.89 28.89 13.66 13.34 2.14 11.20 11.20 2.56 10
Suryachakra Power Corporation 201309 149.63 39.80 0.01 37.90 0.00 1.91 1.20 1.71 -1.00 -1.00 -1.00 -0.07 0
Suryachakra Power Corporation 201312 149.63 38.40 0.04 36.18 2.26 0.93 1.71 -0.37 -0.37 -0.37 -0.02 0
Suryachakra Power Corporation 201403 149.63 39.91 0.06 37.76 2.21 0.59 1.07 0.55 0.92 -0.37 -0.37 -0.02 0
Suryachakra Power Corporation 201406 149.63 39.50 0.05 36.97 2.57 0.81 1.29 0.47 0.47 0.47 0.03 0
Suryakrupa Finance 201309 1.00 0.01 0.01 0.00 0.00 0.00 0.00 0
Suryakrupa Finance 201312 1.00 0.01 0.01 0.00 0.00 0.00 0.00 0
Suryakrupa Finance 201403 1.00 0.01 0.01 0.00 0.00 0.00 0.00 0
Suryakrupa Finance 201406 1.00 0.02 0.02 0.00 -0.06 -0.06 -0.06 -0.06 0
Suryalakshmi Cotton Mills 201309 14.52 169.63 1.18 148.32 0.18 22.68 8.45 7.54 6.69 2.44 4.25 4.25 2.93 12
Suryalakshmi Cotton Mills 201312 14.52 151.31 1.41 138.07 0.23 14.87 9.34 6.56 2.04 0.45 1.59 1.59 1.09 12
Suryalakshmi Cotton Mills 201403 14.52 218.91 6.37 203.81 0.32 21.80 10.86 9.91 3.12 2.29 0.83 0.83 0.57 12
Suryalakshmi Cotton Mills 201406 14.52 179.81 1.93 157.06 0.16 24.85 8.83 7.86 8.15 2.21 5.94 5.94 4.09 12
Suryanagri Fin-Lease 201312 3.37 0.00 0.00 0.00 0.00 0.00 -0.01 0
Suryanagri Fin-Lease 201403 3.37 1.50 0.58 1.48 -0.54 0.05 0.00 0.05 0.00 0.05 0.05 -0.01 0
Suryanagri Fin-Lease 201406 3.37 0.16 0.18 -0.02 -0.02 -0.02 -0.02 -0.01 0
Suryavanshi Spinning Mills 201309 13.27 86.66 82.77 1.73 5.62 2.69 2.13 0.81 0.81 0.81 0.61 0
Suryavanshi Spinning Mills 201312 13.27 94.59 93.73 4.18 5.04 2.65 2.30 0.10 0.10 0.10 0.07 0
Suryavanshi Spinning Mills 201403 13.27 102.13 101.30 3.96 4.79 3.39 1.36 0.05 0.05 0.05 0.04 0
Suryavanshi Spinning Mills 201406 13.27 71.09 68.86 2.95 5.18 3.28 1.70 0.20 0.20 0.20 0.15 0

Co_Name Year Equity N.Sale O.O.I T. Exp O.I PBIDT Int. Dep. PBT T.Tax PAT A.PAT EPS Div (%)
Exp
ecte
d R
esu
lts
on
14
No
vem
ber
201
4
Suven Life Sciences 201309 11.68 151.41 80.00 0.11 71.53 3.41 2.22 65.89 20.35 45.55 45.55 3.90 250
Suven Life Sciences 201312 11.68 119.43 64.54 0.85 55.74 2.21 2.25 51.27 14.84 36.43 36.43 3.12 250
Suven Life Sciences 201403 11.68 130.80 83.37 1.20 48.64 1.70 2.28 44.67 12.26 32.41 32.41 2.77 250
Suven Life Sciences 201406 11.68 141.53 83.65 1.08 58.96 1.16 2.39 51.35 16.61 34.74 34.74 2.97 250
Svam Softwares 201309 16.89 1.68 1.83 0.14 -0.01 -0.01 -0.01 -0.01 -0.01 0
Svam Softwares 201312 16.89 1.12 1.26 0.16 0.01 0.01 0.00 0.01 0.01 -0.01 0
Svam Softwares 201403 16.89 2.55 0.24 2.61 0.18 0.08 0.10 0.03 0.07 0.07 0.04 0
Svam Softwares 201406 16.89 0.10 0.12 0.03 0.02 0.01 0.00 0.01 0.01 0
SVC Resources 201309 8.04 2.39 2.43 -0.04 0.00 0.03 -0.07 0.00 -0.07 -0.07 0
SVC Resources 201312 6.95 0.00 0.00 0.00 0.00 0.00 0.00 0.00 0.00 0
SVC Resources 201403 6.95 0
SVC Resources 201406 6.95 0.03 -0.03 -0.03 -0.03 -0.03 0
SW Investments 201309 0.90 0.09 0.04 0.00 0.06 0.06 0.02 0.04 0.04 0.45 5
SW Investments 201312 0.90 0.11 0.04 0.07 0.07 0.02 0.05 0.05 0.51 5
SW Investments 201403 0.90 0.20 0.03 0.17 0.17 0.05 0.11 0.11 1.25 5
SW Investments 201406 0.90 0.16 0.05 0.11 0.11 0.03 0.07 0.07 0.82 5
Swagruha Infrastructure 201309 6.86 0.04 0.03 0.01 0.01 0.01 0.01 0.02 0
Swagruha Infrastructure 201312 6.86 0.04 0.03 0.01 0.01 0.01 0.01 0.01 0
Swagruha Infrastructure 201403 6.86 0.04 2.45 2.44 0.06 0.06 0.06 0.06 0.01 0
Swagruha Infrastructure 201406 6.86 0.04 0.03 0.01 0.01 0.01 0.01 0.02 0
Swan Energy 201309 22.12 81.73 0.73 70.48 11.98 6.89 1.09 4.00 4.00 4.00 0.36 15
Swan Energy 201312 22.12 59.19 1.36 55.21 0.00 5.34 2.08 1.09 2.17 0.00 2.17 2.17 0.20 15
Swan Energy 201403 22.12 98.99 11.30 94.10 16.19 14.41 1.06 0.72 2.95 -2.23 -2.23 -0.10 15
Swan Energy 201406 22.12 62.56 0.68 54.18 9.05 6.26 1.08 1.71 1.71 1.71 0.08 15
Swarnasarita Gems 201403 20.84 43.93 0.61 42.98 1.57 0.77 0.03 0.77 0.00 0.77 0.77 0.37 0
Swarnasarita Gems 201406 20.84 40.64 0.60 39.91 1.33 0.75 0.02 0.56 0.17 0.39 0.39 0.19 0
Swastik Safe Deposit & Investments 201309 0.24 0.00 0.07 0.07 0.07 0.07 0.07 2.96 10
Swastik Safe Deposit & Investments 201312 0.24 0.00 0.00 0.00 0.00 0.00 -0.08 10
Swastik Safe Deposit & Investments 201403 0.24 0.01 -0.01 -0.01 0.00 -0.02 -0.02 -0.61 10
Swastik Safe Deposit & Investments 201406 0.24 0.02 -0.02 -0.02 -0.02 -0.02 -0.62 10
Swiss Glascoat Equipments 201309 5.00 16.17 13.78 0.09 2.48 0.81 0.49 1.19 0.39 0.79 0.79 1.58 25
Swiss Glascoat Equipments 201312 5.00 24.05 21.22 0.04 2.87 0.77 0.49 1.60 0.52 1.09 1.09 2.17 25
Swiss Glascoat Equipments 201403 5.00 20.30 17.55 0.05 2.79 0.55 0.50 1.75 0.64 1.11 1.11 2.22 25
Swiss Glascoat Equipments 201406 5.00 20.81 18.23 0.05 2.62 0.73 0.51 1.39 0.45 0.94 0.94 1.88 25
Syncom Healthcare 201309 40.00 19.13 17.97 1.14 2.30 0.99 0.82 0.49 0.49 0.49 0.12 0
Syncom Healthcare 201312 40.00 14.67 17.49 0.68 -2.14 1.12 0.99 -4.25 -4.25 -4.25 -1.06 0
Syncom Healthcare 201403 40.00 12.86 12.68 0.63 0.80 1.04 1.13 -1.36 -3.22 1.85 1.85 0.46 0
Syncom Healthcare 201406 40.00 14.39 15.34 0.64 -0.31 1.03 0.92 -2.26 -2.26 -2.26 -0.57 0

Co_Name Year Equity N.Sale O.O.I T. Exp O.I PBIDT Int. Dep. PBT T.Tax PAT A.PAT EPS Div (%)
Exp
ecte
d R
esu
lts
on
14
No
vem
ber
201
4
T&I Global 201309 5.07 18.22 0.33 17.35 0.08 1.28 0.01 0.17 1.10 1.10 1.10 2.18 5
T&I Global 201312 5.07 13.07 0.78 13.32 0.33 0.85 0.04 0.03 0.78 0.78 0.78 1.54 5
T&I Global 201403 5.07 23.08 -0.37 23.14 0.25 -0.18 0.12 0.37 -0.67 0.84 -1.50 -1.50 -2.97 5
T&I Global 201406 5.07 15.96 0.28 15.73 0.16 0.66 0.00 0.18 0.48 0.48 0.48 0.94 5
Tai Industries 201309 6.00 10.07 11.40 1.54 0.21 0.00 0.06 0.15 0.15 0.15 0.25 7
Tai Industries 201312 6.00 12.23 13.04 1.05 0.23 0.00 0.06 0.17 0.17 0.17 0.28 7
Tai Industries 201403 6.00 17.97 18.30 0.93 0.60 0.00 0.06 0.54 0.27 0.27 0.27 0.45 7
Tai Industries 201406 6.00 14.11 14.91 1.08 0.29 0.08 0.21 0.04 0.17 0.17 0.28 7
Tamilnadu Jai Bharath Mills 201309 23.59 25.36 22.13 0.05 3.28 3.09 0.94 -0.75 -0.75 -0.75 -0.31 0
Tamilnadu Jai Bharath Mills 201312 29.59 20.81 17.87 0.07 3.01 2.48 0.97 -0.44 -0.44 -0.44 -0.15 0
Tamilnadu Jai Bharath Mills 201403 39.79 25.42 22.01 0.17 3.59 2.63 0.91 0.05 -0.96 1.01 1.01 0.25 0
Tamilnadu Jai Bharath Mills 201406 39.79 27.93 25.43 0.19 2.69 2.66 0.75 -0.73 -0.73 -0.73 -0.18 0
Tarai Foods 201309 14.34 0.37 0.40 -0.03 0.14 -0.17 -0.17 -0.17 -0.12 0
Tarai Foods 201312 14.34 0.54 0.01 0.57 -0.03 0.14 -0.17 -0.17 -0.17 -0.12 0
Tarai Foods 201403 14.34 0.53 0.00 0.51 0.02 0.00 0.10 -0.08 -0.08 -0.08 -0.06 0
Tarai Foods 201406 14.34 0.55 0.01 0.51 0.04 0.00 0.13 -0.08 -0.08 -0.08 -0.06 0
Tarrif Cine & Finance 201309 0.25 0.00 0.01 0.00 0.01 0.01 0.01 0.01 -0.32 0
Tarrif Cine & Finance 201312 0.25 0.00 0.01 0.00 0.00 0.00 0.00 0.00 -0.15 0
Tarrif Cine & Finance 201403 0.25 0.02 0.00 0.02 0.01 0.01 0.00 0.01 0.00 0.01 0.01 0.46 0
Tarrif Cine & Finance 201406 0.25 0.00 0.01 0.00 0.00 0.00 0.00 0.00 -0.13 0
Tata Motors 201309 643.78 55701.22 1181.06 48247.15 232.09 8867.22 1111.74 2729.25 4752.39 1193.43 3558.96 3541.86 10.99 100
Tata Motors 201312 643.78 63536.06 340.77 53928.34 157.47 10105.96 1001.21 2852.69 6127.72 1308.58 4819.14 4804.80 14.91 100
Tata Motors 201403 643.78 64715.81 601.33 55317.36 254.84 10254.62 1667.55 3125.48 5053.03 1096.93 3956.10 3918.29 12.16 100
Tata Motors 201406 643.78 64150.74 532.09 53540.45 213.20 11355.58 941.58 2979.57 7528.45 2115.05 5413.40 5398.21 16.76 100
Terai Tea Company 201309 6.90 30.64 27.24 0.06 3.47 1.31 0.45 1.71 1.71 1.71 2.47 0
Terai Tea Company 201312 6.90 28.31 28.16 0.14 0.28 1.08 0.45 -1.25 -1.25 -1.25 0
Terai Tea Company 201403 6.90 16.69 17.56 0.39 -0.48 0.22 0.69 -1.39 0.40 -1.79 -1.79 0
Terai Tea Company 201406 6.90 13.34 10.24 0.09 3.20 1.04 0.44 1.72 1.72 1.72 0
Terraform Magnum 201309 0.24 0.01 0.00 0.01 0.01 0.01 0.01 0.33 0
Terraform Magnum 201312 0.24 0.00 0.00 0.00 0.00 0.00 0.00 0
Terraform Magnum 201403 0.24 0.00 0.00 0.00 0.00 0.00 -0.08 0
Terraform Magnum 201406 0.24 0.01 -0.01 -0.01 -0.01 -0.01 -0.52 0
Terraform Realstate 201309 0.50 0.01 0.00 0.01 0.01 0.01 0.01 0.19 0
Terraform Realstate 201312 0.50 0.00 0.00 0.00 0.00 0.00 0
Terraform Realstate 201403 0.50 0.00 0.00 0.00 0.00 0.00 -0.07 0
Terraform Realstate 201406 0.50 0.01 -0.01 -0.01 -0.01 -0.01 -0.52 0

Co_Name Year Equity N.Sale O.O.I T. Exp O.I PBIDT Int. Dep. PBT T.Tax PAT A.PAT EPS Div (%)
Exp
ecte
d R
esu
lts
on
14
No
vem
ber
201
4
Thacker & Company 201309 0.08 3.05 2.93 0.31 0.43 0.18 0.00 0.24 0.02 0.22 0.22 28.21 0
Thacker & Company 201312 0.08 0.21 0.14 0.04 0.12 0.07 0.00 0.05 0.01 0.04 0.04 4.76 0
Thacker & Company 201403 0.08 0.21 0.00 0.16 0.06 0.04 0.00 0.02 0.03 0.00 0.00 -0.28 0
Thacker & Company 201406 0.08 0.21 0.13 0.06 0.14 0.09 0.00 0.05 0.00 0.04 0.04 0.52 0
Thambbi Modern Spinning Mills 201309 5.76 0.58 0.30 0.72 0.16 0.28 0.21 -0.33 -0.33 -0.33 0
Thambbi Modern Spinning Mills 201312 5.76 0.75 0.20 1.11 -0.16 0.20 -0.36 -0.36 -0.36 0
Thambbi Modern Spinning Mills 201403 5.76 0.75 0.20 1.11 -0.16 0.20 -0.36 -0.36 -0.36 0
Thambbi Modern Spinning Mills 201406 5.76 0.30 0.23 0.07 0.10 0.05 -0.08 -0.08 -0.08 0
The Great Eastern Shipping Company 201309 150.95 770.42 3.41 382.24 65.34 456.93 99.50 167.21 190.22 29.59 160.63 160.63 10.55 90
The Great Eastern Shipping Company 201312 150.81 752.64 30.20 462.93 40.71 360.62 92.29 169.55 98.78 -2.72 101.50 101.50 6.73 90
The Great Eastern Shipping Company 201403 150.78 793.71 5.06 508.86 45.81 335.72 95.48 170.51 69.73 2.89 66.84 66.84 4.43 90
The Great Eastern Shipping Company 201406 150.78 803.82 4.38 437.48 97.85 468.57 75.36 146.98 250.61 27.68 222.93 222.93 14.79 90
The Indian Hotels Company 201309 80.75 895.92 857.66 28.48 66.74 46.06 80.35 -433.78 -9.55 -424.23 -433.48 -5.37 0
The Indian Hotels Company 201312 80.75 564.24 406.10 7.14 165.28 24.94 29.96 104.17 38.66 65.51 65.51 0.81 0
The Indian Hotels Company 201403 80.75 577.72 425.23 3.62 156.11 23.16 31.97 -331.52 33.94 -365.46 -365.46 -4.53 0
The Indian Hotels Company 201406 80.75 937.46 857.80 17.49 97.15 44.54 69.76 -23.24 1.09 -24.33 -34.82 -0.43 0
Thomas Scott (India) 201309 3.39 17.34 17.36 -0.02 0.00 0.02 -0.04 -0.04 -0.04 -0.11 0
Thomas Scott (India) 201312 3.39 5.57 7.74 -2.18 0.00 0.02 -2.20 -2.20 -2.20 -6.49 0
Thomas Scott (India) 201403 3.39 17.35 0.01 16.87 0.49 0.02 0.02 0.45 0.45 0.45 1.33 0
Thomas Scott (India) 201406 3.39 7.09 0.01 6.87 0.23 0.00 0.01 0.21 0.21 0.21 0.63 0
Tilaknagar Industries 201309 122.72 198.50 1.31 155.81 0.56 44.57 14.78 5.92 23.87 7.83 16.04 16.04 1.30 8
Tilaknagar Industries 201312 121.32 223.32 1.36 175.90 1.49 50.27 18.14 6.36 25.78 8.37 17.41 17.41 1.42 8
Tilaknagar Industries 201403 123.77 218.02 1.52 182.57 1.40 38.37 16.78 7.17 14.42 6.90 7.52 7.53 0.61 8
Tilaknagar Industries 201406 124.27 163.78 50.19 146.34 0.56 68.19 20.34 8.51 39.34 8.45 30.89 30.89 2.49 8
Tirupati Industries (India) 201309 5.43 9.65 0.04 8.19 0.06 1.55 0.11 0.05 1.39 0.03 0.45 1.36 0.83 0
Tirupati Industries (India) 201312 5.43 6.93 0.02 6.41 0.01 0.54 0.09 0.07 0.39 0.02 0.37 0.37 0.67 0
Tirupati Industries (India) 201403 5.43 15.39 0.01 14.30 0.01 1.11 0.82 -0.02 0.96 0.73 0.23 0.23 0.43 0
Tirupati Industries (India) 201406 5.43 9.76 0.02 9.03 0.01 0.76 0.31 0.04 0.42 0.08 0.34 0.34 0.63 0
Tirupati Inks 201309 15.15 77.13 71.19 0.18 6.12 3.17 0.44 2.51 0.82 1.69 1.69 1.11 0
Tirupati Inks 201312 15.15 88.71 82.20 0.08 6.59 3.21 0.44 2.94 0.96 1.98 1.98 1.30 0
Tirupati Inks 201403 25.10 98.48 91.62 0.22 7.08 3.38 0.44 3.26 1.09 2.17 2.17 1.43 0
Tirupati Inks 201406 25.10 104.61 97.26 0.16 7.51 3.56 0.45 3.50 1.14 2.37 2.37 0.94 0
Tobu Enterprises 201309 4.73 0.11 -0.11 -0.11 -0.11 -0.11 -0.22 0
Tobu Enterprises 201312 4.73 0.01 -0.01 -0.01 -0.01 -0.01 -0.03 0
Tobu Enterprises 201403 4.73 0.04 -0.04 -0.04 -0.04 -0.04 -0.08 0
Tobu Enterprises 201406 4.73 0.03 -0.03 -0.03 -0.03 -0.03 -0.05 0

Co_Name Year Equity N.Sale O.O.I T. Exp O.I PBIDT Int. Dep. PBT T.Tax PAT A.PAT EPS Div (%)
Exp
ecte
d R
esu
lts
on
14
No
vem
ber
201
4
Tokyo Finance 201309 6.94 0.41 0.70 -0.29 0.22 0.00 -0.52 0.03 -0.55 -0.55 -0.79 0
Tokyo Finance 201312 6.94 0.40 0.10 0.30 0.21 0.00 0.09 0.09 0.09 0.13 0
Tokyo Finance 201403 6.94 0.39 0.09 0.30 0.20 0.00 0.10 0.03 0.07 0.07 0.10 0
Tokyo Finance 201406 6.94 0.42 0.38 0.04 0.22 0.00 -0.18 0.04 -0.22 -0.22 -0.31 0
Tokyo Plast International 201309 9.50 18.32 14.01 -0.46 3.86 0.65 0.62 2.58 0.20 2.39 2.39 2.51 0
Tokyo Plast International 201312 9.50 13.38 12.35 0.06 1.10 0.62 0.59 -0.11 -0.14 0.03 0.03 0.03 0
Tokyo Plast International 201403 9.50 14.45 13.85 -0.19 0.41 0.61 0.53 -0.72 -0.98 0.25 0.25 0.27 0
Tokyo Plast International 201406 9.50 15.02 12.42 0.50 3.10 0.69 0.50 1.91 0.35 1.56 1.56 1.64 0
Total Hospitality 201309 6.66 0.68 2.52 0.01 -1.83 0.04 0.06 -1.92 -1.92 -1.92 -2.88 0
Total Hospitality 201312 6.66 0.29 0.51 -0.23 0.05 -0.28 -0.28 -0.28 -0.42 0
Total Hospitality 201403 6.66 0.25 0.94 -0.69 0.02 -0.72 -0.72 -0.72 -1.08 0
Total Hospitality 201406 8.06 0.00 0.09 0.00 -0.09 0.00 -0.09 0.00 -0.09 -0.09 -0.11 0
Transchem 201309 12.24 0.21 0.17 -0.03 0.04 0.38 -0.45 -0.45 -0.45 -0.37 0
Transchem 201312 12.24 0.22 0.60 0.38 0.01 0.38 -0.01 -0.01 -0.01 -0.01 0
Transchem 201403 12.24 0.14 0.47 0.33 0.37 -0.04 0.03 -0.08 -0.07 -0.06 0
Transchem 201406 12.24 0.17 0.58 0.41 0.38 0.03 0.03 0.03 0.02 0
Transglobe Foods 201309 3.17 0.05 0.07 -0.02 -0.02 -0.02 -0.02 -0.01 0
Transglobe Foods 201312 3.17 0.04 0.06 0.00 -0.01 -0.09 -0.09 -0.09 -0.03 0
Transglobe Foods 201403 3.17 0.11 0.10 0.00 0.02 0.02 0.02 0.02 0.01 0
Transglobe Foods 201406 3.17 0.05 0.05 0.00 0.00 0.00 0.00 0
Tree House Education & Accessories 201309 36.72 41.29 18.36 0.21 23.14 1.47 4.27 17.40 5.93 11.47 11.47 3.15 15
Tree House Education & Accessories 201312 37.12 39.73 15.20 0.01 24.54 1.96 4.45 18.13 6.03 12.10 12.10 3.32 15
Tree House Education & Accessories 201403 37.17 35.75 16.77 18.98 2.52 4.42 12.04 4.00 8.04 8.04 2.20 15
Tree House Education & Accessories 201406 37.77 53.91 20.63 0.15 33.43 3.20 5.99 24.24 8.18 16.06 16.06 4.26 15
Trend Electronics 201309 7.50 359.26 0.05 349.08 0.07 10.30 19.57 5.21 -14.48 -3.00 -11.48 -11.48 -15.31 0
Trend Electronics 201312 7.50 360.02 0.13 349.33 0.02 10.84 19.33 5.37 -13.86 -2.31 -11.55 -11.55 -15.40 0
Trend Electronics 201403 7.50 362.55 0.08 353.81 0.01 8.83 17.08 5.57 -13.82 -3.38 -10.44 -10.44 -13.92 0
Trend Electronics 201406 7.50 368.14 0.10 359.21 2.03 11.06 17.16 5.60 -11.70 -3.03 -8.67 -8.67 -11.56 0
Tricom Fruit Products 201309 15.94 0.12 0.01 3.29 0.08 -3.08 2.59 0.41 -6.08 0.00 -6.08 -6.08 -3.82 0
Tricom Fruit Products 201312 15.94 0.01 1.79 -1.78 1.78 0.41 -3.97 -3.97 -3.97 -2.49 0
Tricom Fruit Products 201403 15.94 0.02 0.14 19.37 7.27 -11.94 0.40 -25.06 -25.06 -25.06 -15.72 0
Tricom Fruit Products 201406 15.94 0.08 0.27 -0.19 1.37 0.64 -2.77 -2.77 -2.77 -1.74 0
Tricom India 201309 15.84 14.80 18.10 9.86 6.55 3.42 22.09 -3.46 0.53 -3.99 -3.99 -0.50 0
Tricom India 201312 15.84 18.86 11.63 0.15 7.39 5.66 4.35 -2.63 1.50 -4.12 -4.12 -0.52 0
Tricom India 201403 15.84 8.90 17.62 0.06 -8.67 6.18 3.53 -34.02 0.73 -34.75 -34.75 -4.39 0
Tricom India 201406 15.84 13.14 12.03 0.08 1.19 2.33 5.08 -6.21 0.14 -6.36 -6.36 -0.80 0

Co_Name Year Equity N.Sale O.O.I T. Exp O.I PBIDT Int. Dep. PBT T.Tax PAT A.PAT EPS Div (%)
Exp
ecte
d R
esu
lts
on
14
No
vem
ber
201
4
Trident 201309 310.84 999.56 0.64 788.75 0.26 211.71 51.79 68.72 91.20 18.54 72.66 72.66 2.34 3
Trident 201312 310.84 1016.92 4.02 837.35 0.25 183.84 51.26 67.61 64.97 14.04 50.93 50.93 1.64 3
Trident 201403 311.09 983.11 7.04 836.46 0.30 153.99 47.93 64.01 42.05 12.78 29.27 29.27 0.94 3
Trident 201406 447.44 900.43 12.83 730.82 1.59 184.03 58.14 80.85 45.04 12.75 32.29 32.29 0.72 3
Tridev InfraEstates 201309 6.53 0.26 0.27 -0.01 -0.01 -0.01 -0.01 -0.02 0
Tridev InfraEstates 201312 6.53 0.26 0.25 0.00 0.00 0.00 0.00 0.01 0
Tridev InfraEstates 201403 6.53 0.25 0.26 -0.01 -0.01 -0.01 -0.01 -0.01 0
Tridev InfraEstates 201406 6.53 0.25 0.26 0.04 0.03 0.03 0.01 0.02 0.02 0
Trilogic Digital Media 201309 11.26 14.03 9.68 4.35 0.13 4.22 1.29 2.93 2.90 2.76 10
Trilogic Digital Media 201312 11.84 33.12 29.04 0.15 4.23 0.11 4.13 1.63 2.50 2.49 2.10 10
Trilogic Digital Media 201403 11.84 16.71 0.16 13.66 -0.15 3.06 0.21 0.11 2.74 0.34 2.40 2.40 10
Trilogic Digital Media 201406 11.84 20.59 0.42 20.52 0.49 0.01 0.03 0.45 0.04 0.42 0.42 0.35 10
Triton Corp 201309 19.99 0.08 1.40 1.33 0.32 1.00 1.00 1.00 0.05 0
Triton Corp 201312 19.99 0.06 0.00 -0.06 0.32 -0.39 -0.39 -0.39 -0.02 0
Triton Corp 201403 19.99 0.45 0.00 -0.45 0.00 0.32 -3.43 -3.43 -3.43 -0.17 0
Triton Corp 201406 19.99 0.06 0.22 0.16 0.15 -13.39 -13.39 -13.39 -0.67 0
Triveni Engineering & Industries 201309 25.79 564.75 0.07 571.68 4.07 -2.79 37.56 19.92 -55.65 -4.82 -50.83 -48.26 -1.87 0
Triveni Engineering & Industries 201312 25.79 590.25 0.29 591.53 2.85 1.86 24.75 19.68 -42.57 -8.84 -33.73 -29.74 -1.15 0
Triveni Engineering & Industries 201403 25.79 455.05 1.90 463.67 6.42 -0.30 26.98 19.66 -47.22 15.33 -62.55 -59.52 -2.31 0
Triveni Engineering & Industries 201406 25.79 575.41 0.48 542.68 3.07 36.28 33.36 14.65 -11.73 -3.21 -8.52 -5.89 -0.23 0
TTI Enterprise 201406 25.40 0.57 0.28 0.29 0.29 0.29 0.29 0.02 0
Tulsi Extrusions 201309 27.50 16.29 0.19 47.34 -30.86 5.40 1.18 -37.44 0.09 -37.52 -37.52 -13.65 0
Tulsi Extrusions 201312 27.50 22.99 0.03 20.90 2.11 4.97 2.17 -5.03 -0.04 -5.00 -5.00 -1.82 0
Tulsi Extrusions 201403 27.50 19.28 0.82 53.52 -33.42 4.82 1.64 -39.88 0.78 -47.43 -40.66 -17.25 0
Tulsi Extrusions 201406 27.50 45.97 0.03 48.30 -2.30 7.37 1.73 -30.70 0.14 -30.85 -30.85 -11.22 0
Tuni Textile Mills 201309 13.06 7.21 0.39 7.24 0.04 0.40 0.23 0.14 0.03 0.15 -0.12 -0.12 -0.01 0
Tuni Textile Mills 201312 13.06 5.91 0.08 5.65 0.05 0.40 0.22 0.14 0.04 0.01 0.03 0.03 0
Tuni Textile Mills 201403 13.06 6.34 0.22 6.11 0.08 0.52 0.27 0.14 0.11 0.02 0.09 0.09 0.01 0
Tuni Textile Mills 201406 13.06 4.21 0.29 4.09 0.05 0.45 0.26 0.13 0.07 0.05 0.02 0.02 0
TVS Motor Company 201309 47.51 1962.03 26.34 1871.26 7.70 124.81 5.21 31.43 118.45 29.61 88.84 88.84 1.87 140
TVS Motor Company 201312 47.51 2034.71 22.89 1934.18 7.76 131.18 5.32 32.70 93.16 24.36 68.80 68.80 1.45 140
TVS Motor Company 201403 47.51 2120.77 34.93 2017.02 6.62 145.30 8.34 36.08 67.79 18.70 52.12 49.09 1.10 140
TVS Motor Company 201406 47.51 2263.21 32.79 2174.24 18.27 140.03 5.95 33.57 100.51 28.19 72.32 72.32 1.52 140
Twinstar Industries 201309 22.50 16.56 16.21 0.35 0.08 0.11 0.17 0.04 0.13 0.13 0.06 0
Twinstar Industries 201312 22.50 11.14 10.63 0.51 0.12 0.16 0.23 0.07 0.16 0.16 0.71 0
Twinstar Industries 201403 22.50 26.88 26.68 0.06 0.25 0.14 0.08 0.04 0.04 0.04 0.02 0
Twinstar Industries 201406 22.50 27.50 27.10 0.02 0.42 0.15 0.12 0.15 0.15 0.15 0.01 0

Co_Name Year Equity N.Sale O.O.I T. Exp O.I PBIDT Int. Dep. PBT T.Tax PAT A.PAT EPS Div (%)
Exp
ecte
d R
esu
lts
on
14
No
vem
ber
201
4
Tyroon Tea Company 201309 3.51 11.74 7.37 0.43 4.80 0.03 0.08 4.68 4.68 4.68 13.77 10
Tyroon Tea Company 201312 3.51 7.24 5.92 0.16 1.47 0.03 0.08 1.37 1.37 1.37 4.02 10
Tyroon Tea Company 201403 3.51 3.21 5.63 0.39 -2.02 0.05 0.08 -2.15 0.36 -2.51 -2.51 -7.38 10
Tyroon Tea Company 201406 3.51 0.97 1.04 0.38 0.31 0.04 0.10 0.17 0.17 0.17 0.49 10
Unimin India 201309 20.18 0.10 0.06 0.04 0.45 -0.41 -0.41 -0.41 -0.20 0
Unimin India 201312 20.18 0.35 0.12 0.23 0.45 -0.22 -0.22 -0.22 -0.11 0
Unimin India 201403 20.18 0.30 0.17 0.13 0.45 -0.32 -0.32 -0.32 -0.16 0
Unimin India 201406 20.18 0.15 0.08 0.08 0.45 -0.38 -0.38 -0.38 -0.19 0
Unison Metals 201403 3.20 9.88 -0.01 9.29 0.05 0.62 0.25 0.16 0.13 0.05 0.09 0.09 0.27 0
Unison Metals 201406 3.20 10.20 0.14 9.90 0.05 0.49 0.24 0.19 0.10 0.02 0.09 0.09 0.29 0
Unisys Softwares & Holding Industries 201309 23.00 77.36 77.15 0.56 0.77 0.17 0.60 0.60 0.60 0.26 0
Unisys Softwares & Holding Industries 201312 23.00 58.78 58.76 0.45 0.48 0.17 0.31 0.31 0.31 0.13 0
Unisys Softwares & Holding Industries 201403 23.00 187.74 0.38 187.33 -0.07 0.72 1.15 0.17 -0.60 0.32 -0.92 -0.92 -0.40 0
Unisys Softwares & Holding Industries 201406 23.00 141.88 0.45 141.66 0.68 0.11 0.57 0.57 0.57 0.25 0
United Breweries (Holdings) 201309 66.82 114.34 4.45 83.03 0.62 36.38 102.80 1.99 1350.23 325.89 1024.34 1024.34 153.30 0
United Breweries (Holdings) 201312 66.82 135.02 5.87 116.94 0.10 24.05 78.21 2.06 19.38 22.93 -3.55 -3.55 -0.53 0
United Breweries (Holdings) 201403 66.82 132.51 3.90 3832.74 25.42 -3670.91 81.79 2.08 -3694.33 -348.82 -3345.51 -3345.51 -500.68 0
United Breweries (Holdings) 201406 66.82 111.03 4.48 88.37 1.03 28.17 60.37 3.21 802.10 802.10 802.10 120.04 0
United Interactive 201309 1.83 0.02 -0.02 0.01 -0.02 -0.02 -0.02 -0.11 0
United Interactive 201312 1.83 0.01 -0.01 0.01 -0.02 -0.02 -0.02 -0.09 0
United Interactive 201403 1.83 0.02 0.10 0.08 0.00 0.07 0.07 0.07 0.39 0
United Interactive 201406 1.83 0.02 -0.02 0.00 -0.03 -0.03 -0.03 -0.15 0
Universal Office Automation 201309 14.65 0.07 0.09 0.02 0.00 0.02 0.02 0.02 0.01 0
Universal Office Automation 201312 14.65 0.01 0.09 0.08 0.00 0.08 0.08 0.08 0.05 0
Universal Office Automation 201403 14.65 0.08 -0.08 -0.16 0.00 -0.17 -0.01 -0.16 -0.16 -0.11 0
Universal Office Automation 201406 14.65 0.01 0.02 0.01 0.00 0.01 0.01 0.01 0
Ushakiran Finance 201309 2.55 0.05 0.03 0.01 0.03 0.00 0.03 0.03 0.03 0.10 0
Ushakiran Finance 201312 2.55 0.03 0.02 0.01 0.02 0.00 0.02 0.02 0.02 0.06 0
Ushakiran Finance 201403 2.55 0.05 0.15 0.00 -0.10 0.00 -0.10 0.00 -0.10 -0.10 -0.40 0
Ushakiran Finance 201406 2.55 0.05 0.03 0.01 0.03 0.00 0.02 0.02 0.02 0.09 0
Vadilal Dairy International 201309 3.19 3.28 3.29 0.09 0.08 0.01 0.10 -0.04 -0.04 -0.04 -0.12 0
Vadilal Dairy International 201312 3.19 4.94 5.16 0.06 -0.17 0.01 0.11 -0.29 -0.29 -0.29 -0.91 0
Vadilal Dairy International 201403 3.19 8.03 7.22 0.18 0.99 0.04 0.11 0.84 -0.28 1.12 1.12 3.51 0
Vadilal Dairy International 201406 3.19 18.15 15.10 0.16 3.21 0.01 0.13 3.07 3.04 3.07 9.51 0
Vaghani Techno-Build 201309 5.22 0.00 0.01 0.15 0.14 0.00 0.14 0.14 0.14 0.24 0
Vaghani Techno-Build 201312 5.22 0.03 0.09 0.06 0.00 0.06 0.06 0.06 0.11 0
Vaghani Techno-Build 201403 5.22 0.03 0.03 0.00 0.00 -0.01 -0.01 -0.01 0
Vaghani Techno-Build 201406 5.22 0.00 0.05 0.01 -0.03 0.04 -0.07 0.00 -0.07 -0.07 -0.14 0

Co_Name Year Equity N.Sale O.O.I T. Exp O.I PBIDT Int. Dep. PBT T.Tax PAT A.PAT EPS Div (%)
Exp
ecte
d R
esu
lts
on
14
No
vem
ber
201
4
Vaishno Cement Company 201309 8.95 0.03 0.02 0.01 0.01 0.01 0.01 0.01 0
Vaishno Cement Company 201312 8.95 0.03 0.02 0.01 0.01 0.01 0.01 0.01 0
Vaishno Cement Company 201403 8.95 0.01 -0.01 -0.01 0.00 -0.01 -0.01 -0.01 0
Vaishno Cement Company 201406 8.95 0.01 0.03 -0.02 -0.02 -0.02 -0.02 -0.02 0
Vakrangee 201309 50.30 426.38 0.00 308.91 5.00 122.47 19.81 43.47 59.19 15.43 43.76 43.76 0.87 25
Vakrangee 201312 50.35 489.21 348.83 0.33 140.71 19.52 43.02 78.17 27.07 51.10 51.10 1.02 25
Vakrangee 201403 50.35 647.85 0.00 459.92 -1.93 186.01 16.69 52.50 116.82 45.76 71.05 71.05 1.41 25
Vakrangee 201406 50.35 681.23 0.01 524.98 0.67 156.92 20.48 40.72 95.72 19.54 76.19 76.19 1.51 25
Valecha Engineering 201309 19.53 158.76 145.36 2.96 16.36 8.38 2.80 5.19 1.73 3.46 3.46 1.77 8
Valecha Engineering 201312 19.53 162.49 142.53 2.34 22.30 10.32 2.80 9.19 3.02 6.17 6.17 3.16 8
Valecha Engineering 201403 19.53 194.75 176.18 5.20 23.77 12.62 2.77 8.39 2.74 5.65 5.65 2.89 8
Valecha Engineering 201406 19.53 149.19 134.76 2.82 17.25 10.81 7.16 -0.72 -0.29 -0.43 -0.43 -0.22 8
Vallabh Poly-Plast International 201309 4.20 0.01 0.01 0.00 0.00 0.01 0.00 0.01 0
Vallabh Poly-Plast International 201312 4.20 0.24 0.01 -0.24 -0.24 -0.24 -0.24 -0.56 0
Vallabh Poly-Plast International 201403 4.20 0.08 0.03 -0.05 0.20 0.20 0.20 0.46 0
Vallabh Poly-Plast International 201406 4.20 0.02 0.00 -0.02 -0.02 -0.02 -0.02 -0.04 0
Vallabh Steels 201309 4.95 43.99 41.48 2.51 1.93 0.32 0.25 0.05 0.20 0.20 0.41 0
Vallabh Steels 201312 4.95 36.86 34.91 1.96 1.49 0.32 0.15 0.03 0.12 0.12 0.23 0
Vallabh Steels 201403 4.95 47.28 47.79 2.31 1.80 0.14 1.66 -0.47 2.12 2.12 4.29 0
Vallabh Steels 201406 4.95 27.59 25.47 2.12 1.67 0.23 0.22 0.03 0.18 0.18 0.37 0
Valson Industries 201309 7.66 30.86 0.32 29.49 1.68 0.52 0.58 0.59 0.20 0.39 0.39 0.51 8
Valson Industries 201312 7.66 25.44 0.23 24.29 1.39 0.47 0.58 0.33 0.12 0.22 0.22 0.29 8
Valson Industries 201403 7.66 25.72 0.36 24.32 1.76 0.39 0.69 0.69 0.07 0.62 0.62 0.81 8
Valson Industries 201406 7.66 27.16 0.23 25.74 1.66 0.35 0.77 0.54 0.15 0.39 0.39 0.51 8
Value Industries 201309 39.19 371.25 0.26 345.27 0.21 26.45 26.51 20.57 -20.63 -4.00 -16.63 -16.63 -4.24 0
Value Industries 201312 39.19 383.60 0.14 357.95 2.14 27.93 26.01 19.62 -17.70 -2.25 -15.45 -15.45 -3.94 0
Value Industries 201403 39.19 369.99 2.07 345.71 0.10 26.45 22.92 20.31 -16.78 -3.92 -12.86 -12.86 -3.28 0
Value Industries 201406 39.19 378.27 0.44 350.37 0.17 28.51 23.13 19.06 -13.68 -2.65 -11.03 -11.03 -2.81 0
Vama Industries 201309 7.04 2.55 2.67 0.00 -0.12 0.10 0.08 -0.30 -0.30 -0.30 -0.43 1
Vama Industries 201312 7.04 10.09 9.65 0.01 0.46 0.10 0.08 0.29 0.29 0.29 0.41 1
Vama Industries 201403 7.04 4.94 4.41 0.03 0.56 0.10 0.08 0.38 0.02 0.36 0.36 0.51 1
Vama Industries 201406 7.04 4.15 3.97 0.03 0.22 0.12 0.08 0.02 0.02 0.02 0.03 1
Vardhman Concrete 201309 7.16 0.06 0.01 -0.05 0.05 0.06 -0.16 -0.02 -0.14 -0.14 -0.02 0
Vardhman Concrete 201312 7.16 0.05 -0.05 0.03 0.06 -0.15 -0.02 -0.13 -0.13 -0.18 0
Vardhman Concrete 201403 7.16 4.18 1.42 0.02 2.79 0.24 0.01 1.81 -0.33 2.14 2.14 2.99 0
Vardhman Concrete 201406 7.16 0.04 0.07 -0.03 0.05 0.01 -0.10 0.00 -0.09 -0.09 -0.13 0

Co_Name Year Equity N.Sale O.O.I T. Exp O.I PBIDT Int. Dep. PBT T.Tax PAT A.PAT EPS Div (%)
Exp
ecte
d R
esu
lts
on
14
No
vem
ber
201
4
Vardhman Industries 201309 7.90 96.92 0.03 91.20 5.75 1.67 1.81 2.27 0.47 1.79 1.79 2.27 10
Vardhman Industries 201312 7.90 88.99 0.02 83.27 0.00 5.75 2.41 1.84 1.49 0.30 1.20 1.20 1.51 10
Vardhman Industries 201403 7.90 109.16 -0.07 104.24 4.85 1.46 1.18 2.85 0.79 2.06 2.06 2.61 10
Vardhman Industries 201406 7.90 69.27 63.66 5.61 2.42 1.55 1.64 0.30 1.34 1.34 1.70 10
Vaswani Industries 201309 28.66 51.10 46.88 0.09 4.31 2.71 1.40 0.20 0.07 0.13 0.13 0.05 0
Vaswani Industries 201312 28.66 54.65 50.29 0.04 4.39 2.86 1.40 0.13 0.13 0.00 0.00 0
Vaswani Industries 201403 28.66 71.88 68.51 1.78 5.15 2.74 1.37 1.04 0.34 0.70 0.70 -0.11 0
Vaswani Industries 201406 28.66 63.46 58.63 0.02 4.85 2.72 1.39 0.75 0.23 0.51 0.51 0.66 0
VCCL 201309 4.80 0.05 -0.05 0.05 -0.11 -0.11 -0.11 -0.22 0
VCCL 201312 4.80 0.05 -0.05 0.05 -0.10 -0.10 -0.10 -0.20 0
VCCL 201403 4.80 0.03 0.03 0.00 0.05 -0.06 -0.06 -0.06 -0.12 0
VCCL 201406 4.80 0.04 0.05 0.01 0.78 -0.77 -0.77 -0.77 -1.61 0
Vedavaag Systems 201309 9.35 6.18 4.41 1.76 0.05 1.43 0.28 0.03 0.25 0.25 2.98 0
Vedavaag Systems 201312 9.35 23.79 20.18 3.61 0.01 1.44 2.15 0.65 1.50 1.50 0
Vedavaag Systems 201403 9.35 27.91 24.80 3.11 0.10 2.62 0.39 0.12 0.27 0.27 0
Vedavaag Systems 201406 9.35 5.61 4.13 1.49 1.04 0.45 0.45 0.45 0
Veena Textiles 201309 8.04 0.03 0.05 -0.02 0.02 -0.05 -0.05 -0.05 -0.06 0
Veena Textiles 201312 8.04 0.04 0.04 -0.01 0.02 -0.03 -0.03 -0.03 -0.04 0
Veena Textiles 201403 8.04 0.03 0.05 -0.02 0.02 -0.03 -0.03 -0.03 -0.04 0
Veena Textiles 201406 8.04 0.05 0.05 -0.01 0.02 -0.03 -0.03 -0.03 -0.03 0
Ventura Guaranty 201309 3.20 0.01 0.00 0.00 0.00 0.00 0.00 0.00 24
Ventura Guaranty 201312 3.20 0.02 0.12 0.49 0.39 0.39 0.00 0.39 0.39 1.22 24
Ventura Guaranty 201403 3.20 0.01 0.00 0.01 0.01 0.01 0.01 0.02 24
Ventura Guaranty 201406 3.20 0.00 0.00 0.00 0.00 0.00 0.00 -0.01 24
Ventura Textiles 201309 2.47 0.29 -0.29 0.81 -1.10 -1.10 -1.10 -4.47 0
Ventura Textiles 201312 16.45 0.21 -0.21 0.81 -1.02 -1.02 -1.02 -0.62 0
Ventura Textiles 201403 16.45 0.07 1.41 3.97 2.63 3.12 -0.47 -0.02 -0.02 -0.02 -0.01 0
Ventura Textiles 201406 16.45 0.16 -0.16 0.08 -0.24 -0.24 -0.24 -0.15 0
Veritas (India) 201309 2.42 273.98 264.69 9.30 1.18 0.14 7.98 0.13 7.85 7.85 3.24 5
Veritas (India) 201312 2.42 294.19 284.75 0.01 9.44 2.99 0.14 6.32 0.54 5.78 5.78 2.39 5
Veritas (India) 201403 2.42 360.17 0.00 352.00 3.38 11.55 1.19 0.15 10.21 0.86 9.35 9.35 3.86 5
Veritas (India) 201406 2.42 316.28 305.26 11.02 1.03 0.32 9.67 0.16 9.51 9.51 3.93 5
Vertex Spinning 201309 19.91 0.05 0.01 0.03 0.86 -0.83 -0.83 -0.83 -0.41 0
Vertex Spinning 201312 19.91 0.10 0.03 0.07 0.86 -0.79 -0.79 -0.79 -0.40 0
Vertex Spinning 201403 19.91 0.06 0.15 -0.09 0.86 -0.95 -0.95 -0.95 -0.47 0
Vertex Spinning 201406 19.91 0.06 0.01 0.05 0.83 -0.78 -0.78 -0.78 -0.39 0

Co_Name Year Equity N.Sale O.O.I T. Exp O.I PBIDT Int. Dep. PBT T.Tax PAT A.PAT EPS Div (%)
Exp
ecte
d R
esu
lts
on
14
No
vem
ber
201
4
Videocon Industries 201309 318.76 3176.20 7.12 2624.71 176.27 734.88 581.06 128.64 25.18 5.00 20.18 20.18 0.63 20
Videocon Industries 201312 318.76 3207.40 18.33 2679.11 206.44 753.06 597.74 132.46 22.86 5.23 17.63 17.63 0.55 20
Videocon Industries 201403 318.76 3073.47 13.08 2535.35 139.36 690.56 579.62 191.72 -80.78 -15.84 -64.94 -64.94 -2.04 20
Videocon Industries 201406 318.76 3124.83 10.74 2571.91 216.48 780.14 584.83 182.34 12.97 2.75 10.22 10.22 0.32 20
Vidhi Dyestuffs Manufacturing 201309 5.00 36.16 0.54 33.28 0.07 3.49 1.13 0.50 1.86 0.64 1.22 1.22 0.24 20
Vidhi Dyestuffs Manufacturing 201312 5.00 29.54 0.44 26.15 0.20 4.02 1.36 0.50 2.16 0.98 1.19 1.19 0.24 20
Vidhi Dyestuffs Manufacturing 201403 5.00 36.13 0.49 31.38 0.03 5.28 1.54 0.49 3.25 0.93 2.32 2.32 0.47 20
Vidhi Dyestuffs Manufacturing 201406 5.00 40.26 0.50 35.70 0.25 5.31 1.32 0.35 3.65 1.21 2.44 2.44 0.49 20
Vippy Spinpro 201309 5.87 27.71 25.98 0.18 1.90 0.34 0.66 0.91 0.35 0.56 0.56 0.95 0
Vippy Spinpro 201312 5.87 24.30 22.28 0.17 2.19 0.19 0.60 1.40 0.42 0.96 0.98 1.66 0
Vippy Spinpro 201403 5.87 25.12 22.91 0.22 2.43 0.29 0.58 1.56 0.52 1.03 1.03 1.76 0
Vippy Spinpro 201406 5.87 26.63 25.08 0.21 1.76 0.56 0.80 0.40 0.11 0.30 0.30 0.50 0
Vipul Dye Chem 201309 5.48 11.03 10.51 0.02 0.54 0.12 0.10 0.32 0.09 0.23 0.23 0.42 8
Vipul Dye Chem 201312 5.48 11.28 10.86 0.01 0.43 0.11 0.11 0.20 0.07 0.13 0.13 0.24 8
Vipul Dye Chem 201403 5.48 11.33 10.97 0.02 0.38 0.13 0.12 0.13 0.07 0.06 0.06 0.10 8
Vipul Dye Chem 201406 5.48 9.44 8.85 0.01 0.60 0.17 0.07 0.19 0.06 0.14 0.14 0.25 8
Visa Steel 201309 110.00 309.80 279.57 5.72 35.95 45.84 19.26 -48.66 -0.80 -47.86 -46.33 -4.21 0
Visa Steel 201312 110.00 392.60 16.98 376.00 5.19 38.77 48.02 19.17 -27.64 -0.13 -30.27 -33.42 -3.04 0
Visa Steel 201403 110.00 419.64 10.91 400.33 3.59 33.80 28.64 18.59 -13.10 1.02 -14.11 -15.63 -1.42 0
Visa Steel 201406 110.00 341.77 8.15 317.39 2.79 35.31 39.76 19.11 -38.39 0.78 -39.17 -29.41 -2.67 0
Visagar Financial Services 201309 6.50 -1.07 0.16 0.12 -1.02 0.00 -1.02 -1.02 -1.02 0
Visagar Financial Services 201312 6.50 0.06 0.05 0.01 0.01 0.01 0.01 0
Visagar Financial Services 201403 6.50 0.25 0.03 0.22 0.00 0.22 0.22 0.22 0
Visagar Financial Services 201406 6.50 0.04 0.04 0
Vishnu Chemicals 201309 11.95 84.37 0.91 70.76 -0.22 14.29 6.94 3.26 4.10 1.68 2.42 2.42 1.22 0
Vishnu Chemicals 201312 11.95 79.78 1.67 65.03 16.42 7.26 3.29 5.87 2.25 3.62 3.62 2.22 0
Vishnu Chemicals 201403 11.95 111.67 1.18 93.10 19.74 7.08 3.23 9.47 3.62 5.86 5.86 4.07 0
Vishnu Chemicals 201406 11.95 82.97 0.64 70.09 13.53 6.76 3.23 3.49 1.25 2.24 2.24 1.03 0
Vista Pharmaceuticals 201309 15.00 1.99 1.81 0.18 0.16 0.02 0.02 0.02 0.01 0
Vista Pharmaceuticals 201312 15.00 0.41 0.02 -0.39 0.16 -0.55 -0.55 -0.55 -0.36 0
Vista Pharmaceuticals 201403 15.00 5.43 3.80 1.63 0.29 1.34 1.34 1.34 0.89 0
Vista Pharmaceuticals 201406 15.00 3.10 2.78 0.32 0.03 0.20 0.10 0.10 0.10 0.06 0
VLS Finance 201309 39.92 1005.20 1004.39 0.00 0.82 0.00 0.11 0.71 0.39 0.31 0.31 0.08 0
VLS Finance 201312 39.92 912.95 912.12 0.00 0.84 0.00 0.11 0.73 -0.44 1.17 1.17 0.29 0
VLS Finance 201403 38.78 1393.85 1392.10 0.01 1.75 0.01 0.10 1.04 0.15 0.89 0.89 0.23 0
VLS Finance 201406 38.78 1040.94 1039.12 0.00 1.83 0.00 0.10 1.73 0.41 1.32 1.32 0.34 0

Co_Name Year Equity N.Sale O.O.I T. Exp O.I PBIDT Int. Dep. PBT T.Tax PAT A.PAT EPS Div (%)
Exp
ecte
d R
esu
lts
on
14
No
vem
ber
201
4
Vogue Textiles 201309 5.90 0.73 0.66 0.04 0.11 0.01 0.09 0.01 0.00 0.01 0.01 0.02 0
Vogue Textiles 201312 5.90 0.57 0.53 0.03 0.07 0.00 0.06 0.01 0.00 0.01 0.01 0.01 0
Vogue Textiles 201403 5.90 0.21 0.19 0.01 0.03 0.00 0.03 0.00 0.00 0.00 0
Vogue Textiles 201406 5.90 0.77 0.73 0.06 0.10 0.01 0.08 0.01 0.00 0.01 0.01 0.01 0
Vora Constructions 201309 2.00 2.14 0.02 2.14 0.01 0.01 0.01 0.01 0
Vora Constructions 201312 2.00 0.79 0.02 0.81 0.00 0.00 0.00 0.00 0
Vora Constructions 201403 2.00 0.57 0.07 0.59 0.05 0.05 0.00 0.05 0.05 0
Vora Constructions 201406 2.00 4.71 0.01 4.66 0.07 0.07 0.01 0.06 0.06 0.30 0
VR Woodart 201309 7.73 0.01 -0.01 -0.01 -0.01 -0.01 -0.01 0
VR Woodart 201312 7.73 0.00 0.00 0.00 0.00 0.00 0.00 0.00 0.00 0.00 -0.01 0
VR Woodart 201403 7.73 0.76 -0.76 -0.76 -0.76 -0.76 -0.98 0
VR Woodart 201406 7.73 0.03 -0.03 -0.03 -0.03 -0.03 0
Warner Multimedia 201309 18.56 0.22 0.26 -0.04 0.01 -0.05 -0.05 -0.05 -0.03 0
Warner Multimedia 201312 18.56 0.00 0.00 0.00 0.00 0.00 0
Warner Multimedia 201403 18.56 -0.02 0.03 0.01 -0.05 -0.05 -0.05 -0.05 -0.03 0
Warner Multimedia 201406 18.56 0.02 0.02 0.00 0.00 0.00 0.00 0.00 0
Warren Tea 201309 11.95 55.66 0.29 29.60 0.75 27.10 0.08 1.23 25.79 0.00 25.79 25.79 21.58 0
Warren Tea 201312 11.95 47.41 0.27 36.49 0.31 11.50 0.19 1.25 10.06 0.00 10.06 10.06 8.42 0
Warren Tea 201403 11.95 20.98 0.16 31.50 0.43 -9.93 0.07 1.29 -11.29 6.83 -18.12 -18.12 -15.16 0
Warren Tea 201406 11.95 24.47 0.04 19.09 0.21 5.63 0.06 1.22 4.35 4.35 4.35 3.64 0
Websol Energy Systems 201309 21.97 95.66 91.14 0.01 4.53 4.96 4.48 -13.04 0.00 -13.04 -13.04 -5.94 0
Websol Energy Systems 201312 21.97 90.98 86.39 0.68 5.27 12.92 4.47 -17.35 -17.35 -17.35 -7.90 0
Websol Energy Systems 201403 21.97 71.06 69.31 0.55 2.30 9.55 4.40 -8.69 -9.62 -8.69 -4.38 0
Websol Energy Systems 201406 21.97 38.47 40.25 -1.78 9.06 4.17 -14.26 -14.26 -14.26 -6.49 0
Western Ministil 201309 2.16 1.86 1.40 -0.46 0.05 -0.52 -0.52 -0.52 -2.39 0
Western Ministil 201312 2.16 0.01 -0.01 0.00 -0.01 -0.01 -0.01 -0.05 0
Western Ministil 201403 2.16 0.02 -0.02 0.00 0.01 0.01 0.01 0.02 0
Western Ministil 201406 2.16 0.01 -0.01 -0.01 -0.01 -0.01 -0.05 0
Wim Plast 201309 6.00 68.07 0.19 55.91 0.04 12.40 0.09 2.21 10.11 2.73 7.38 7.38 12.30 90
Wim Plast 201312 6.00 73.16 0.16 59.46 0.01 13.88 0.04 2.34 11.50 3.17 8.34 8.34 13.89 90
Wim Plast 201403 6.00 79.91 0.18 65.20 0.25 15.13 0.07 2.32 12.74 3.56 9.18 9.18 15.30 90
Wim Plast 201406 6.00 82.79 0.15 70.21 0.39 13.12 0.03 2.18 10.91 3.07 7.84 7.84 13.06 90
Windsor Machines 201309 12.99 55.32 0.80 50.49 0.47 6.10 0.32 0.60 5.18 5.18 5.18 0.80 0
Windsor Machines 201312 12.99 59.96 0.52 54.32 0.55 6.71 0.33 0.64 5.75 5.75 5.75 0.89 0
Windsor Machines 201403 12.99 71.55 1.03 64.34 4.44 12.67 0.31 0.64 11.72 6.91 4.81 4.81 0.74 0
Windsor Machines 201406 12.99 49.48 0.98 50.03 0.31 0.73 0.20 1.03 -0.50 -0.06 -0.44 -0.44 -0.07 0

Co_Name Year Equity N.Sale O.O.I T. Exp O.I PBIDT Int. Dep. PBT T.Tax PAT A.PAT EPS Div (%)
Exp
ecte
d R
esu
lts
on
14
No
vem
ber
201
4
Winsome Breweries 201309 27.67 12.21 0.19 11.66 0.01 0.75 0.08 0.34 0.33 0.33 0.33 0.12 0
Winsome Breweries 201312 27.67 10.51 0.23 10.03 0.71 0.07 0.34 0.30 0.30 0.30 0.11 0
Winsome Breweries 201403 27.67 15.39 0.30 16.71 1.35 0.33 0.09 0.34 -0.09 0.12 -0.21 -0.21 -0.08 0
Winsome Breweries 201406 27.67 22.01 0.47 21.82 0.66 0.06 0.35 0.25 0.08 0.17 0.17 0.06 0
Worldwide Leather Exports 201309 2.97 2.51 -0.07 2.24 0.12 0.33 0.04 0.28 0.07 0.21 0.21 0.54 0
Worldwide Leather Exports 201312 2.97 1.44 -0.05 1.67 0.13 -0.15 -0.01 0.06 -0.43 -0.43 -0.43 -1.45 0
Worldwide Leather Exports 201403 2.97 2.31 -0.05 2.49 0.24 0.01 0.02 0.03 -0.05 -0.07 0.02 0.02 0.06 0
Worldwide Leather Exports 201406 2.97 0.94 0.02 0.85 0.04 0.14 0.04 0.10 0.03 0.07 0.07 0.02 0
Worth Investment & Trading Co 201406 3.28 0.08 0.02 0.06 0.00 0.06 0.06 0.06 0.19 0
WS Industries (India) 201309 21.14 22.12 0.12 34.40 137.06 124.90 15.99 2.05 106.87 29.73 77.14 77.14 37.21 0
WS Industries (India) 201312 21.14 33.52 0.13 40.98 -7.33 10.04 2.42 -19.80 -3.64 -16.16 -16.16 -7.79 0
WS Industries (India) 201403 21.14 36.97 2.17 47.31 -8.18 10.14 2.27 -20.59 -2.78 -17.81 -17.81 -8.57 0
WS Industries (India) 201406 21.14 34.91 0.42 43.49 -8.16 11.65 2.27 -22.09 -4.93 -17.16 -17.16 -8.26 0
XL Energy 201309 22.77 0.27 0.09 1.29 -0.94 0.76 -1.70 -0.99 -0.71 -0.71 -0.31 0
XL Energy 201312 22.77 0.63 0.86 -0.23 0.77 -0.99 -0.99 -0.99 -0.44 0
XL Energy 201403 22.77 0.03 0.59 0.02 -0.53 0.04 0.98 -1.56 -0.99 -0.57 -0.57 -0.25 0
XL Energy 201406 22.77 0.31 0.66 -0.35 -0.35 -0.35 -0.35 -0.15 0
Yamini Investments 201309 0.24 0.12 0.02 0.10 0.10 0.10 0.10 0
Yamini Investments 201312 0.24 0.87 0.50 0.85 0.52 0.52 0.52 0.52 2.15 0
Yamini Investments 201403 0.24 -0.52 0.01 -0.53 -0.53 -0.53 -0.53 0
Yamini Investments 201406 0.24 0.05 0.02 0.03 0.03 0.03 0.03 0.11 0
York Exports 201309 3.36 4.28 0.02 3.99 0.04 0.35 0.18 0.15 0.03 0.00 0.03 0.03 0.08 0
York Exports 201312 3.36 4.68 0.01 4.63 0.37 0.43 0.15 0.15 0.13 0.01 0.12 0.12 0.35 0
York Exports 201403 3.36 1.06 0.06 1.23 0.13 0.02 0.02 0.16 -0.16 -0.01 -0.15 -0.15 -0.45 0
York Exports 201406 3.36 1.24 0.02 0.94 0.31 0.10 0.13 0.08 0.08 0.08 0.22 0
Yuvraaj Hygiene Product 201309 6.92 4.37 3.84 0.53 0.26 0.16 0.11 0.03 0.08 0.08 0.01 0
Yuvraaj Hygiene Product 201312 6.92 4.49 3.92 0.57 0.21 0.18 0.18 0.05 0.13 0.13 0.02 0
Yuvraaj Hygiene Product 201403 6.92 4.12 3.75 0.37 0.21 0.17 -0.01 -0.01 0.01 0.01 0
Yuvraaj Hygiene Product 201406 6.92 3.61 3.12 0.50 0.22 0.21 0.07 0.02 0.05 0.05 0.01 0
Zenith Birla (India) 201309 131.28 41.93 17.34 80.59 -21.32 13.96 2.06 -37.34 -37.34 -37.34 -5.20 0
Zenith Birla (India) 201312 131.28 23.16 28.76 -5.60 11.58 1.54 -18.72 -18.72 -18.72 -1.43 0
Zenith Birla (India) 201403 131.28 33.85 -0.77 114.05 10.19 -70.78 1.47 -72.25 -0.01 -128.27 -72.24 -9.77 0
Zenith Birla (India) 201406 131.28 14.09 39.26 -25.17 1.47 2.91 -29.55 -29.55 -29.55 -2.25 0
Zenith Computers 201309 15.48 26.33 35.77 0.33 -9.11 1.78 0.26 -11.15 -11.15 -11.15 -7.20 0
Zenith Computers 201312 15.48 15.66 24.44 0.06 -8.72 1.74 0.27 -10.73 -10.73 -10.73 -6.93 0
Zenith Computers 201403 15.48 20.74 31.18 0.37 -10.07 1.56 0.21 -11.83 -11.83 -11.83 -7.64 0
Zenith Computers 201406 15.48 11.42 9.42 0.06 2.06 1.68 0.26 0.12 0.12 0.12 0.08 0

Co_Name Year Equity N.Sale O.O.I T. Exp O.I PBIDT Int. Dep. PBT T.Tax PAT A.PAT EPS Div (%)
Exp
ecte
d R
esu
lts
on
14
No
vem
ber
201
4
Zenith Exports 201309 5.40 78.71 4.48 79.65 0.23 3.77 1.51 1.61 0.65 -0.02 0.67 0.67 1.24 0
Zenith Exports 201312 5.40 70.65 4.23 70.76 0.81 4.93 1.34 1.61 1.98 0.65 1.33 1.33 2.46 0
Zenith Exports 201403 5.40 75.59 4.46 77.83 1.15 3.37 1.56 1.54 0.27 0.33 -0.06 -0.06 -0.11 0
Zenith Exports 201406 5.40 59.74 3.88 63.02 1.98 2.58 1.56 1.21 -0.19 -0.29 0.10 0.10 0.18 0
Zigma Software 201309 41.76 0.17 0.07 -0.10 0.04 -0.15 -0.15 -0.15 0
Zigma Software 201312 41.76 0.16 0.07 -0.09 0.04 -0.13 -0.13 -0.13 0
Zigma Software 201403 41.76 0.16 0.06 -0.10 0.04 -0.14 -0.14 -0.14 0
Zigma Software 201406 41.76 0.10 0.03 -0.07 0.03 -0.10 -0.10 -0.10 0
Zodiac Ventures 201309 3.73 0.20 0.13 0.02 0.09 0.09 0.09 0.09 0.23 4
Zodiac Ventures 201312 3.73 0.01 0.14 0.01 -0.12 -0.12 -0.12 -0.12 -0.33 4
Zodiac Ventures 201403 3.73 1.00 0.16 0.01 0.85 0.85 0.24 0.61 0.61 1.64 4
Zodiac Ventures 201406 3.73 0.18 0.00 -0.18 -0.25 -0.25 -0.25 -0.68 4
Disclaimer:
This Document has been prepared by Nirmal Bang Research (A Division of Nirmal Bang Securities Pvt. ). The information, analysis and estimates
contained herein are based on Nirmal Bang Research assessment and have been obtained from sources believed to be reliable. This document is
meant for the use of the intended recipient only. This document, at best, represents Nirmal Bang Research opinion and is meant for general
information only. Nirmal Bang Research, its directors, officers or employees shall not in anyway be responsible for the contents stated herein. Nirmal
Bang Research expressly disclaims any and all liabilities that may arise from information, errors or omissions in this connection. This document is
not to be considered as an offer to sell or a solicitation to buy any securities. Nirmal Bang Research, its affiliates and their employees may from time
to time hold positions in securities referred to herein. Nirmal Bang Research or its affiliates may from time to time solicit from or perform investment
banking or other services for any company mentioned in this document.
Nirmal Bang Research (Division of Nirmal Bang Securities Pvt. )
B-2, 301/302, Marathon Innova,
Opp. Peninsula Corporate Park
Off. Ganpatrao Kadam Marg
Lower Parel (W), Mumbai-400013
Board No. : 91 22 3926 8000/8001
Fax. : 022 3926 8010