Expanded graphite as superior anode for sodium-ion …mse.umd.edu/~cumings/PDF...
10
ARTICLE Received 13 Sep 2013 | Accepted 4 May 2014 | Published 4 Jun 2014 Expanded graphite as superior anode for sodium-ion batteries Yang Wen 1, *, Kai He 2, *, Yujie Zhu 1, *, Fudong Han 1 , Yunhua Xu 1 , Isamu Matsuda 3 , Yoshitaka Ishii 3,4 , John Cumings 2 & Chunsheng Wang 1 Graphite, as the most common anode for commercial Li-ion batteries, has been reported to have a very low capacity when used as a Na-ion battery anode. It is well known that electrochemical insertion of Na þ into graphite is significantly hindered by the insufficient interlayer spacing. Here we report expanded graphite as a Na-ion battery anode. Prepared through a process of oxidation and partial reduction on graphite, expanded graphite has an enlarged interlayer lattice distance of 4.3 Å yet retains an analogous long-range-ordered layered structure to graphite. In situ transmission electron microscopy has demonstrated that the Na-ion can be reversibly inserted into and extracted from expanded graphite. Galvano- static studies show that expanded graphite can deliver a high reversible capacity of 284 mAh g 1 at a current density of 20 mA g 1 , maintain a capacity of 184 mAh g 1 at 100 mA g 1 , and retain 73.92% of its capacity after 2,000 cycles. DOI: 10.1038/ncomms5033 1 Department of Chemical and Biomolecular Engineering, University of Maryland, College Park, Maryland 20742, USA. 2 Department of Materials Science and Engineering, University of Maryland, College Park, Maryland 20742, USA. 3 Department of Chemistry, University of Illinois at Chicago, Chicago, Illinois 60607, USA. 4 Center for Structural Biology, University of Illinois at Chicago, Chicago, Illinois 60607, USA. *These authors contributed equally to the work. Correspondence and requests for materials should be addressed to C.W. (email: [email protected]) or to J.C. (email: [email protected]). NATURE COMMUNICATIONS | 5:4033 | DOI: 10.1038/ncomms5033 | www.nature.com/naturecommunications 1 & 2014 Macmillan Publishers Limited. All rights reserved.
Transcript of Expanded graphite as superior anode for sodium-ion …mse.umd.edu/~cumings/PDF...
ARTICLE
Received 13 Sep 2013 | Accepted 4 May 2014 | Published 4 Jun 2014
Expanded graphite as superior anode forsodium-ion batteriesYang Wen1,*, Kai He2,*, Yujie Zhu1,*, Fudong Han1, Yunhua Xu1, Isamu Matsuda3, Yoshitaka Ishii3,4,
John Cumings2 & Chunsheng Wang1
Graphite, as the most common anode for commercial Li-ion batteries, has been reported
to have a very low capacity when used as a Na-ion battery anode. It is well known that
electrochemical insertion of Naþ into graphite is significantly hindered by the insufficient
interlayer spacing. Here we report expanded graphite as a Na-ion battery anode. Prepared
through a process of oxidation and partial reduction on graphite, expanded graphite has an
enlarged interlayer lattice distance of 4.3 Å yet retains an analogous long-range-ordered
layered structure to graphite. In situ transmission electron microscopy has demonstrated that
the Na-ion can be reversibly inserted into and extracted from expanded graphite. Galvano-
static studies show that expanded graphite can deliver a high reversible capacity of
284 mAh g� 1 at a current density of 20 mA g� 1, maintain a capacity of 184 mAh g� 1 at
100 mA g� 1, and retain 73.92% of its capacity after 2,000 cycles.
DOI: 10.1038/ncomms5033
1 Department of Chemical and Biomolecular Engineering, University of Maryland, College Park, Maryland 20742, USA. 2 Department of Materials Science andEngineering, University of Maryland, College Park, Maryland 20742, USA. 3 Department of Chemistry, University of Illinois at Chicago, Chicago, Illinois60607, USA. 4 Center for Structural Biology, University of Illinois at Chicago, Chicago, Illinois 60607, USA. * These authors contributed equally to the work.Correspondence and requests for materials should be addressed to C.W. (email: [email protected]) or to J.C. (email: [email protected]).
NATURE COMMUNICATIONS | 5:4033 | DOI: 10.1038/ncomms5033 | www.nature.com/naturecommunications 1
& 2014 Macmillan Publishers Limited. All rights reserved.

The Li-ion battery (LIB) industry has been continuouslyexpanding over the last three decades, mostly because ofthe steadily increasing demands of a growing market for
portable electronic devices. However, as demand emerges forhybrid and electric vehicles, and as emphasis shifts to the powergrid and other large-scale applications, the limits of the naturalabundance and uneven global distribution of lithium-containingprecursors present unavoidable challenges to industry. For suchlarge-scale applications, a low-cost and sustainable supply-chainis critical. As an alternative, Na-ion batteries (NIBs) have recentlydrawn significant attention because, unlike Li, Na is a ubiquitousand earth-abundant element. NIBs were originally developed inthe late 1980s, in approximately the same time period as LIBs1–3,and the demand for large-scale energy storage for gridapplications has recently revived the interest. Most of the recentresearch on NIB electrode materials has focused mainly oncathodes, but here we concentrate instead on a possible newanode material.
Since Li and Na share common properties as alkali metals, it issometimes assumed to be convenient to transfer the insightsgained from the science of LIBs to NIBs. However, Naþ has alarger radius than Liþ , which directly affects the mass transportand storage in the electrochemical process. It makes many of thesuperior LIB anode materials, such as graphite, unsuitable forNIBs. Graphite, as the most common anode for commercial LIBs,has a long-range-ordered layered structure, and Liþ can readilyelectrochemically intercalate between the graphite layers. Theintercalated material has a high theoretical reversible capability of372 mAh g� 1 and long cycle life. However, the electrochemicalsodiation/desodiation capacity of graphite is o35 mAh g� 1
(refs 4,5). As demonstrated by recent theoretical calculations,the interlayer distance of graphite (B0.34 nm) is too small toaccommodate the large Naþ ion (Fig. 1a), and a minimuminterlayer distance of 0.37 nm is believed to be required for Naþ
insertion6.A variety of carbon materials, such as carbon with different
structures (soft carbons5 and hard carbons5,7,8), differentcompositions (hydrogen-contained carbons5) and differentmorphologies (carbon nanotubes6, porous carbons9, hollowcarbon nanoparticles10 and reduced graphene oxides11), havebeen investigated as anodes for NIB in previous studies. Most ofthese carbon-based materials consist of few-layer-stackedgraphite nanocrystallites with large interlayer distances in therange of 0.37–0.40 nm (ref. 6). These localized nanocrystallitesleave many disordered nanovoids within the materials5,6,9–12,and it is believed that the Naþ ions can reversibly insert into thegraphite nanocrystallites and the nanovoids in these carbonmaterials. Naþ insertion in nanocrystallite usually occurs in awide potential range from 1.5 to 0.1 V (versus Na/Naþ ), whereasthe Naþ filling into nanovoids happens in a low and narrow
potential range of 0.1–0.0 V (versus Na/Naþ )5,6,9–12. In these twomechanisms, the interlayer insertion reaction would be preferred,as the pore-filling reaction occurs only at low potentials, where itcan be accompanied by Na plating during fast charging, causingNa loss and, more severely, battery failure due to electricalshorting. Certain conclusions can be drawn from these studies,and it is apparent that materials with long-range-ordered layeredstructures, larger interlayer distances and low porosity aredesired.
Here we report expanded graphite (EG) as a superior NIBanode material. EG is a graphite-derived material formed by atwo-step oxidation-reduction process that retains the long-range-ordered layered structure of graphite, yielding a generally largeinterlayer distance (40.34 nm; Fig. 1b,c). These features providefavourable conditions for electrochemical intercalation of Naþ
ions. Moreover, the interlayer spacing of EG can be manipulatedby controlled oxidation and reduction processing, which posi-tions EG as a promising anode material for NIBs. We report herethat Naþ indeed can reversibly insert into and extract from theEG, with an interlayer distance of 0.43 nm. The sodiation- anddesodiation-induced microstructure changes of EG are dynami-cally captured during real-time imaging at the atomic scale usingin situ high-resolution transmission electron microscopy(HRTEM). Electrochemical tests show that the EG can providea high reversible capacity of 284 mAh g� 1 at a current density of20 mA g� 1; 184 mAh g� 1 at a current density of 100 mA g� 1;and retain 73.92% of the capacity after 2,000 cycles (loss 0.037%per cycle). Along with the mature and low-cost synthesistechnique of graphite anodes for LIBs, EG could be a verypromising anode material for the NIBs industry in the nearfuture.
ResultsMaterial and structural design. EG was synthesized by oxidizingpristine graphite (PG) to become graphite oxide (GO) usingmodified Hummer’s method13 and followed by a partialreducing process of GO. The modified Hummer’s method iswell known as an oxidization method to form GO in the graphenesynthesis technique11. In a typical graphene synthesis procedure,the resulting GO is sonicated before (or after) the reductionreaction to peel off the functionalized graphene layers fromgraphite and acquire single-layer or few-layer graphenes. In oursynthesis, we intentionally omitted the sonication step to avoidthe damage caused by sonication and maintain the long-range-ordered layered structure. More experimental details are providedin Methods section.
The crystal structures of PG, GO and two EG samples (EG-1 hand EG-5 h with 1 h/5 h denoting the thermal reduction periodapplied on GO to obtain the sample) were characterized using
=Na+ =C =H=O
Graphite Graphite oxide Expanded graphite
Figure 1 | Schematic illustration of sodium storage in graphite-based materials. (a) Naþ cannot be electrochemically intercalated into graphite
because of the small interlayer spacing. (b) Electrochemical intercalation of Naþ into GO is enabled by the enlarged interlayer distance because of
oxidation. However, the intercalation is limited by steric hindering from large amounts of oxygen-containing groups. (c) A significant amount of Naþ can be
electrochemically intercalated into EG owing to suitable interlayer distance and reduced oxygen-containing groups in the interlayers.
ARTICLE NATURE COMMUNICATIONS | DOI: 10.1038/ncomms5033
2 NATURE COMMUNICATIONS | 5:4033 | DOI: 10.1038/ncomms5033 | www.nature.com/naturecommunications
& 2014 Macmillan Publishers Limited. All rights reserved.

powder X-ray diffraction (XRD; Supplementary Fig. 1). For thepurpose of systematically analysing the reduction time effect,GO was considered as EG-0 h to compare with EG samples(EG-1 h and EG-5 h). PG exhibits a sharp peak at 2y B26.6�(Supplementary Fig. 1), which corresponds to the diffraction of(002) plane with an interlayer distance of 3.36 Å (B0.34 nm)(refs 14,15). Upon oxidation, the inserted oxygen-containinggroups will attach to both sides of the single graphene plane,causing distortion of the interlayer structure16,17. The diffractionpeak of GO shifts to 2y B13.0�, which indicates an enlargedinter-planar distance. After thermal reduction for 1 h, thediffraction peak of EG-1 h shifts back to 2y B23.0�, yet is stillsmaller than that in graphite (B26.6�), exhibiting a graphite-likestructure with a larger inter-planar distance. As thermal reductiontime increases to 5 h, the diffraction peak of EG-5 h shifts to 2yB25.3�, indicating a shrinkage of interlayer distance comparedwith EG-1 h.
The surface areas of PG, GO and EG samples werecharacterized by using N2 gas adsorption–desorption. TheBrunauer–Emmett–Teller (BET) surface areas are measured tobe 13.52 m2 g� 1 for PG, 64.89 m2 g� 1 for GO, 30.22 m2 g� 1 forEG-1 h and 34.70 m2 g� 1 for EG-5 h. Both EG samples reveal alow surface area, which is much smaller than that of typicalgraphene/graphene oxide prepared through Hummer’s method18,indicating low exfoliation degree and good graphite-like stackmorphology retention. On the other hand, the low surface area ofEGs also implies that only a small amount of pores are introducedduring oxidation and thermal reduction process. Different fromgraphite, the N2 adsorption–desorption isotherm profiles of GO,EG-1 h and EG-5 h exhibit no limiting adsorption at high P/P0
(Supplementary Fig. 2a), revealing a typical character of plate-likeparticle with slit-shaped pores19. The specific surface area of PGused in this study is three times higher than that of previouslyreported graphite20, and is similar to that of the hard carbon(SX114i19 in ref. 21). The EGs’ surface areas are similar to thehard carbon (SX114i5 in ref. 21) reported by Dahn and group21.The tap densities for PG, GO, EG-1 h and 5 h samples weremeasured to be 0.72, 4.38, 2.38 and 1.88 g cm� 3 (SupplementaryFig. 2b). The tap densities of EG samples are higher than that ofmost of reported soft carbons (B0.66–1.26 g cm� 3; (ref. 22) andhard carbon (B0.50–0.81 g cm� 3; (refs 22,23), whereas the PG’stap density is similar to the hard carbon21. The EG samples were
observed to be more condensed than the reported carbon materialused in LIB21. The graphitization degree of PG, GO and EGmaterials was determined by Raman spectroscopy. All samplesexhibit typical D band (centred at B1,360 cm� 1) and Gband (centred atB1,585 cm� 1) for carbon material24. The Dband corresponds to the disordered carbon, whereas the G bandrepresents the typical signal for graphite-like morphology incarbon material. The ID/IG intensity ratios for PG, GO, EG-1 hand EG-5 h are 0.22, 0.86, 0.88 and 0.97 (Supplementary Fig. 2c),indicating that EGs partially maintain the graphitic character. Theelectronic conductivities of PG, GO, EG-1 h and EG-5 h weremeasured to be 461.47, 87.65, 322.62 and 363.40 S cm� 1,respectively (Supplementary Fig. 2d). Both EG samples showmuch better conductivity than GO (EG-0 h) because of theremoval of oxygen-containing groups during thermal reduction.
The structures of PG, GO and EGs were further characterizedby TEM. Figure 2 shows HRTEM images of the cross-sectionalview for PG, GO, EG-1 h and EG-5 h, in which the layeredstructures of these specimens are well resolved by the alternatingbright and dark contrast. The PG displays well-defined layers oflong-range order stacking parallel to each other (Fig. 2a). Afteroxidation, such long-range order is disrupted by massiveintercalation of oxygen in the graphite interlayer, forming amore disordered pattern with only localized short-range ordering,as shown in Fig. 2b. However, after partial reduction, the materialrecovers toward a well-organized morphology, while preservingexpanded interlayer distances and the long-range channelssuitable for Na ions transport, as shown in Fig. 2c,d. In addition,the progressive change in interlayer distance is also clearlyapparent. The contrast line profiles across five stacking layers atrepresentative locations, indicated by the arrows, are plottedunder the corresponding images. The average interlayer spacingsare measured to be B0.34 nm for PG, 0.61 nm for GO, 0.43 nmfor EG-1 h and 0.37 nm for EG-5 h. It is obvious that the distancebetween PG layers is expanded after the oxidation reactionsbecause of the insertion of oxygen-containing groups, and that itstill retains larger than PG after reduction treatments.
Nature and content of oxygen-containing groups in theinterlayer. From above XRD and HRTEM results, it is clear thatthe interlayer distances of PG, GO and EGs are related to the
GOPG
1,000
900
800
700
600
1,000
900
800
700
6000.0 0.5 1.0 1.5 2.0 2.5 0.0 0.5 1.0 1.5 2.0
1,000
900
800
700
6000.0 0.5 1.0 1.5
nm0.0 0.5 1.0 1.5
nm nm nm
1,000
900
800
700
600
500
EG-1 h EG-5 h
d–PG = 0.34 nm d–GO = 0.61 nm d–EG–1 h = 0.43 nm d–EG–5 h = 0.37 nm
Figure 2 | High-resolution TEM analysis of PG, GO and EG. High-resolution TEM images showing cross-sectional layered structures for (a) PG, (b) GO,
(c) EG-1 h and (d) EG-5 h. Scale bars, 2 nm. Contrast profiles along the arrows indicate interlayer spacings of corresponding samples.
NATURE COMMUNICATIONS | DOI: 10.1038/ncomms5033 ARTICLE
NATURE COMMUNICATIONS | 5:4033 | DOI: 10.1038/ncomms5033 | www.nature.com/naturecommunications 3
& 2014 Macmillan Publishers Limited. All rights reserved.
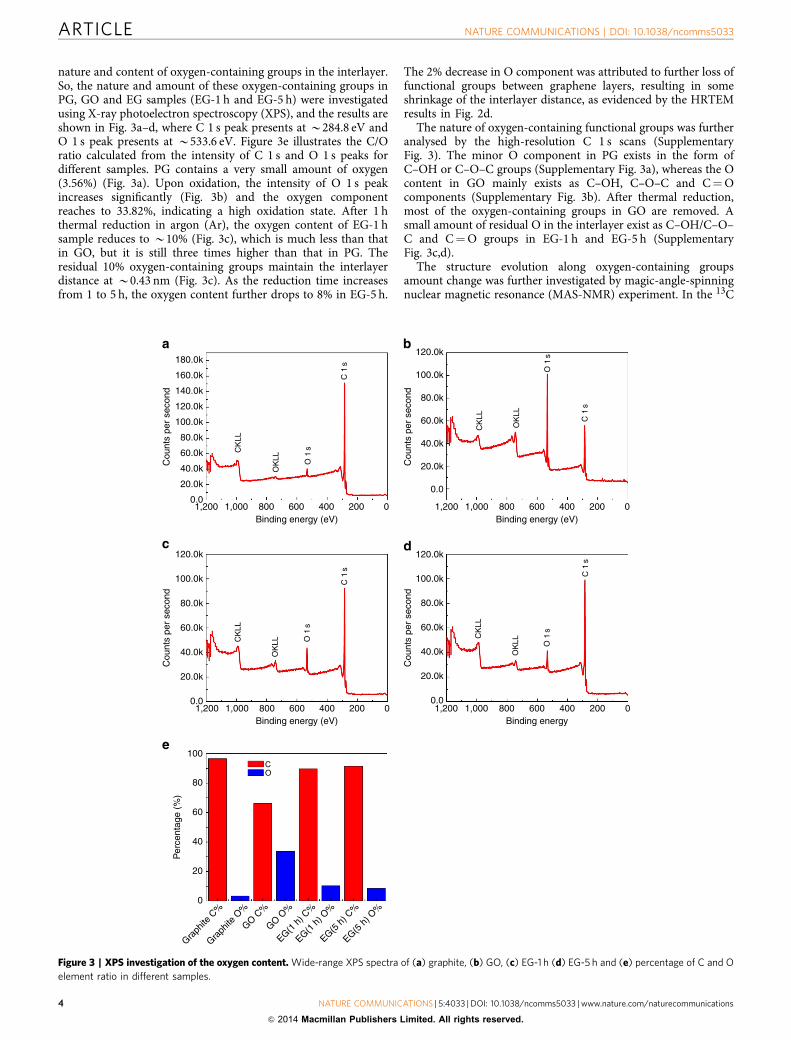
nature and content of oxygen-containing groups in the interlayer.So, the nature and amount of these oxygen-containing groups inPG, GO and EG samples (EG-1 h and EG-5 h) were investigatedusing X-ray photoelectron spectroscopy (XPS), and the results areshown in Fig. 3a–d, where C 1 s peak presents at B284.8 eV andO 1 s peak presents at B533.6 eV. Figure 3e illustrates the C/Oratio calculated from the intensity of C 1 s and O 1 s peaks fordifferent samples. PG contains a very small amount of oxygen(3.56%) (Fig. 3a). Upon oxidation, the intensity of O 1 s peakincreases significantly (Fig. 3b) and the oxygen componentreaches to 33.82%, indicating a high oxidation state. After 1 hthermal reduction in argon (Ar), the oxygen content of EG-1 hsample reduces to B10% (Fig. 3c), which is much less than thatin GO, but it is still three times higher than that in PG. Theresidual 10% oxygen-containing groups maintain the interlayerdistance at B0.43 nm (Fig. 3c). As the reduction time increasesfrom 1 to 5 h, the oxygen content further drops to 8% in EG-5 h.
The 2% decrease in O component was attributed to further loss offunctional groups between graphene layers, resulting in someshrinkage of the interlayer distance, as evidenced by the HRTEMresults in Fig. 2d.
The nature of oxygen-containing functional groups was furtheranalysed by the high-resolution C 1 s scans (SupplementaryFig. 3). The minor O component in PG exists in the form ofC–OH or C–O–C groups (Supplementary Fig. 3a), whereas the Ocontent in GO mainly exists as C–OH, C–O–C and C¼Ocomponents (Supplementary Fig. 3b). After thermal reduction,most of the oxygen-containing groups in GO are removed. Asmall amount of residual O in the interlayer exist as C–OH/C–O–C and C¼O groups in EG-1 h and EG-5 h (SupplementaryFig. 3c,d).
The structure evolution along oxygen-containing groupsamount change was further investigated by magic-angle-spinningnuclear magnetic resonance (MAS-NMR) experiment. In the 13C
Cou
nts
per
seco
nd
Cou
nts
per
seco
nd
Cou
nts
per
seco
nd
Cou
nts
per
seco
nd
CK
LL
OK
LL O 1
sO
1s
C 1
s
OK
LLCK
LL
C 1
s180.0k
160.0k
140.0k
120.0k
100.0k
80.0k
60.0k
40.0k
20.0k
0.0
120.0k
100.0k
80.0k
60.0k
40.0k
20.0k
0.0
120.0k
100.0k
80.0k
60.0k
40.0k
20.0k
0.0
120.0k
100.0k
80.0k
60.0k
40.0k
20.0k
0.0
Binding energy (eV)
Binding energy (eV)
CO
Per
cent
age
(%)
Binding energy (eV)
Binding energy
1,200 1,000 800 600 400 200 0 1,200 1,000 800 600 400 200 0
1,200 1,000 800 600 400 200 0
100
80
60
40
20
0
Graph
ite C
%
Graph
ite O
%
GO C%
GO O%
EG(1 h
) C%
EG(1 h
) O%
EG(5 h
) C%
EG(5 h
) O%
1,200 1,000 800 600 400 200 0
O 1
s
C 1
s
OK
LL
CK
LL
C 1
s
O 1
s
OK
LL
CK
LL
Figure 3 | XPS investigation of the oxygen content. Wide-range XPS spectra of (a) graphite, (b) GO, (c) EG-1 h (d) EG-5 h and (e) percentage of C and O
element ratio in different samples.
ARTICLE NATURE COMMUNICATIONS | DOI: 10.1038/ncomms5033
4 NATURE COMMUNICATIONS | 5:4033 | DOI: 10.1038/ncomms5033 | www.nature.com/naturecommunications
& 2014 Macmillan Publishers Limited. All rights reserved.

spectrum of GO (Fig. 4a), three major peaks at 131, 69 and 61p.p.m. evidence the occurring of the oxidization that is consistentto the previous study25,26. The weak peaks at B165 and B190p.p.m. (indicated by blue arrows) can be assigned to –CO2– andC¼O27, consistent with the XPS measurements. The EG-1 h andEG-5 h samples show a single broader major peak at 117 p.p.m.(Fig. 4b) and 116 p.p.m. (Fig. 4c) with another broad shoulderpeak at B170 p.p.m. The observed 13C shifts are consistent withthose for sp2 carbons without oxidized sites (B120 p.p.m.) suchas graphene or graphite, suggesting the restoration of sp2
conjugation network. The change in the 13C shift position forthe sp2 species from B130 p.p.m. in GO to B120 p.p.m. in EGreflects the removal of electron-withdrawing oxygen-containinggroups by the reduction. No noticeable peaks were observedeither at 60 or 70 p.p.m., although a weak peak for the C–OHgroup may overlap with a tail of the sp2 carbons at 120 p.p.m. Theresults suggest that thermal reduction for 1 h is sufficient torestore the sp2 network in the EG sample. Based on the integralintensities of the spectra at 40–80 p.p.m. region in Fig. 4b,c, theseoxidized species should constitute B3–8% of the carbon. Thisportion of the carbon can be attributed to the C–OH or epoxidefrom graphene plane that is highly related to the interlayerspacing. The broad shoulder peak at B170 p.p.m. may beattributed minor species (such as C¼O and –CO2H species) thatcould be found around the edges/defects. Minor discrepanciesfrom the XRD results may be attributed to the oxygen species atthe edges/defects.
To identify C–OH groups and other 1H-containing species inthe GO and EG samples, 13C–1H dipolar dephasing experimentswere performed by using a 13C–1H rotational echo double
resonance (REDOR) pulse sequence. It is notable that for GOsample, the signal for C–OH was mildly dephased(Supplementary Fig. 4). The difference between non-dephasedspectrum (Supplementary Fig. 4a) and dephased spectrum(Supplementary Fig. 4b) clearly shows that the signal intensitiesfor the C–OH and epoxide groups are reduced by about 20% and13%, respectively, whereas the intensity for the sp2 group isreduced by only 6%. The strongest dephasing is a direct evidenceof the existent of massive oxygen-containing species, especiallythe C–OH, in GO.
This approach is adopted to analyse EG-1 h and EG-5 h.Supplementary Fig. 5 shows 13C MAS spectra of EG-1 h(Supplementary Fig. 5a–c) and EG-5 h (Supplementary Fig. 5d–f)without and with 13C–1H dipolar dephasing by 13C–1H REDOR,together with corresponding difference spectra (SupplementaryFig. 5c,f). For the both samples, no notable selective dephasing wasobserved unlike the above-mentioned experiment for GO. Rather,the peaks corresponding to sp2 group at B120 p.p.m. wereuniformly dephased for EG-1 h (Supplementary Fig. 5c) and EG-5 h (Supplementary Fig. 5f) by 12% and 8%, respectively. It isnoteworthy that the signal reduction is higher than that wasobserved for sp2 species in GO. The results indicate that thesurface of the restored graphene sheets in EG can be covered byhydrogen-containing species, and these species may be, in part,responsible for expanded interlayer distances. Indeed, that EG-5 hshows a lower dephasing than EG-1 h, which is consistent with theobserved smaller interlayer distance for EG-5 h.
Effect of oxygen content on sodium storage capacity. Theore-tical calculations have revealed that when the interlayer spacingincreases to B0.37 nm, the energy barrier for Naþ insertiondrops to 0.053 eV (ref. 6). This calculation suggests that it isthermodynamically feasible to electrochemically insert Naþ intoEG-1 h. Although a large interlayer distance is desired for Naþ
insertion, too many oxygen-containing groups between graphenelayers could reduce the available positions for Naþ and slow theNaþ transport. The amount of remaining oxygen-containinggroups in the interlayer of EG should in principle be optimized tomaintain the sufficient interlayer distance and maximize possiblepositions for Na-ion storage.
The effects of oxygen content on sodiation/desodiationcapacity were investigated using galvanostatic charge/dischargeat a current density of 20 mA g� 1. The charge and dischargecurves of PG, GO, EG-1 h and EG-5 h at the second cycles arepresented in Fig. 5a. Retarded by the small interlayer spacing, PGhas a negligible sodium storage capacity of B13 mAh g� 1, whichis widely known and has been reported previously28. Oxidation ofgraphite increases the interlayer distance from 0.34 to 0.61 nm,allowing Naþ intercalation into interlayer of GO. The GO showsmonotonic voltage curves during the whole sodiation–desodiatonprocess with an increased capacity of B156 mAh g� 1. However,33.82% of oxygen-containing groups in the interlayer reduce theamount of possible positions for Naþ storage. After 1 h ofthermal reduction, 23.80% of the oxygen-containing functionalgroups are removed, allowing more Naþ to insert into the carboninterlayer of EG, despite the reduced interlayer distance of EG-1 has 0.43 nm. EG-1 h can deliver a high reversible Naþ capacity ofB300 mAh g� 1, which is significantly higher than PG and GO.When the reduction time extends to 5 h, the capacity of EG-5 hdrops to B100 mAh g� 1. Although similar charge–dischargepattern was observed between EG-1 h and EG-5 h, the capacitydelivered by EG-5 h decreased significantly, implying that theinterlayer distance predominantly controls the Naþ storagecapacity. The sodiation curve of EGs clearly consists of two stages,that is, monotonic sloping voltage profile between 2.0 and 0.3 V
GOsp2
COHEpoxide
**
*
*
(p.p.m.)0100200
EG-1 h
EG-5 h
*
*
Figure 4 | Solid-state NMR study. 1D 13C MAS solid-state NMR spectra of
(a) GO, (b) EG-1 h and (c) EG-5 h. All the spectra were obtained at a 13C
NMR frequency of 125.78 MHz with 15 kHz MAS for the samples of (a)
33 mg, (b) 38 mg, (c) 45 mg. The 13C MAS spectra were obtained with
direct 13C excitation by a p/2-pulse followed by a rotor-synchronous echo.
The peaks marked by * denote spinning sidebands. The recycle delay was
2 s, and the experimental times were (a) 3 h and (b,c) 7 h. A Lorentz
broadening of 300 Hz was applied to improve the signal-to-noise ratios. 13C
T1 values of the samples were found to be 0.5–0.6 s. The 13C p/2-pulse
widths are (a) 3.65 ms and (b,c) 5.75 ms.
NATURE COMMUNICATIONS | DOI: 10.1038/ncomms5033 ARTICLE
NATURE COMMUNICATIONS | 5:4033 | DOI: 10.1038/ncomms5033 | www.nature.com/naturecommunications 5
& 2014 Macmillan Publishers Limited. All rights reserved.
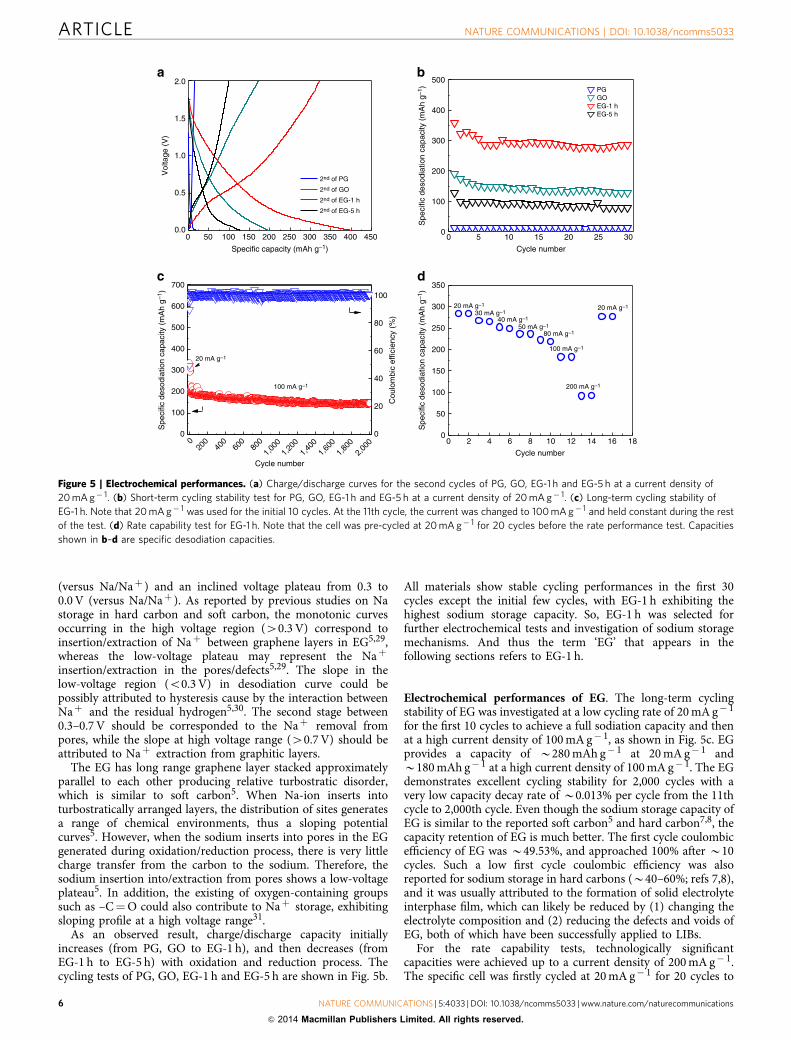
(versus Na/Naþ ) and an inclined voltage plateau from 0.3 to0.0 V (versus Na/Naþ ). As reported by previous studies on Nastorage in hard carbon and soft carbon, the monotonic curvesoccurring in the high voltage region (40.3 V) correspond toinsertion/extraction of Naþ between graphene layers in EG5,29,whereas the low-voltage plateau may represent the Naþ
insertion/extraction in the pores/defects5,29. The slope in thelow-voltage region (o0.3 V) in desodiation curve could bepossibly attributed to hysteresis cause by the interaction betweenNaþ and the residual hydrogen5,30. The second stage between0.3–0.7 V should be corresponded to the Naþ removal frompores, while the slope at high voltage range (40.7 V) should beattributed to Naþ extraction from graphitic layers.
The EG has long range graphene layer stacked approximatelyparallel to each other producing relative turbostratic disorder,which is similar to soft carbon5. When Na-ion inserts intoturbostratically arranged layers, the distribution of sites generatesa range of chemical environments, thus a sloping potentialcurves5. However, when the sodium inserts into pores in the EGgenerated during oxidation/reduction process, there is very littlecharge transfer from the carbon to the sodium. Therefore, thesodium insertion into/extraction from pores shows a low-voltageplateau5. In addition, the existing of oxygen-containing groupssuch as –C¼O could also contribute to Naþ storage, exhibitingsloping profile at a high voltage range31.
As an observed result, charge/discharge capacity initiallyincreases (from PG, GO to EG-1 h), and then decreases (fromEG-1 h to EG-5 h) with oxidation and reduction process. Thecycling tests of PG, GO, EG-1 h and EG-5 h are shown in Fig. 5b.
All materials show stable cycling performances in the first 30cycles except the initial few cycles, with EG-1 h exhibiting thehighest sodium storage capacity. So, EG-1 h was selected forfurther electrochemical tests and investigation of sodium storagemechanisms. And thus the term ‘EG’ that appears in thefollowing sections refers to EG-1 h.
Electrochemical performances of EG. The long-term cyclingstability of EG was investigated at a low cycling rate of 20 mA g� 1
for the first 10 cycles to achieve a full sodiation capacity and thenat a high current density of 100 mA g� 1, as shown in Fig. 5c. EGprovides a capacity of B280 mAh g� 1 at 20 mA g� 1 andB180 mAh g� 1 at a high current density of 100 mA g� 1. The EGdemonstrates excellent cycling stability for 2,000 cycles with avery low capacity decay rate of B0.013% per cycle from the 11thcycle to 2,000th cycle. Even though the sodium storage capacity ofEG is similar to the reported soft carbon5 and hard carbon7,8, thecapacity retention of EG is much better. The first cycle coulombicefficiency of EG was B49.53%, and approached 100% after B10cycles. Such a low first cycle coulombic efficiency was alsoreported for sodium storage in hard carbons (B40–60%; refs 7,8),and it was usually attributed to the formation of solid electrolyteinterphase film, which can likely be reduced by (1) changing theelectrolyte composition and (2) reducing the defects and voids ofEG, both of which have been successfully applied to LIBs.
For the rate capability tests, technologically significantcapacities were achieved up to a current density of 200 mA g� 1.The specific cell was firstly cycled at 20 mA g� 1 for 20 cycles to
0.0
0.5
1.0
1.5
2.0
Vol
tage
(V
)
2nd of PG
2nd of GO
2nd of EG-1 h
2nd of EG-5 h
020
040
060
080
0
1,00
01,
200
1,40
01,
600
1,80
02,
000
0
100
200
300
400
500
600
700
0
20
40
60
80
100
Cycle number
100 mA g–1
20 mA g–1
Cou
lom
bic
effic
ienc
y (%
)
0 2 4 6 8 10 12 14 16 180
50
100
150
200
250
300
350
20 mA g–1
40 mA g–1
200 mA g–1
100 mA g–1
80 mA g–150 mA g–1
30 mA g–1
Spe
cific
des
odia
tion
capa
city
(m
Ah
g–1)
Cycle number
20 mA g–1
0 5 10 15 20 25 300
100
200
300
400
500PGGOEG-1 hEG-5 h
Spe
cific
des
odia
tion
capa
city
(m
Ah
g–1)
Cycle number
Spe
cific
des
odia
tion
capa
city
(m
Ah
g–1)
Specific capacity (mAh g–1)
0 50 100 150 200 250 300 350 450400
Figure 5 | Electrochemical performances. (a) Charge/discharge curves for the second cycles of PG, GO, EG-1 h and EG-5 h at a current density of
20 mA g� 1. (b) Short-term cycling stability test for PG, GO, EG-1 h and EG-5 h at a current density of 20 mA g� 1. (c) Long-term cycling stability of
EG-1 h. Note that 20 mA g� 1 was used for the initial 10 cycles. At the 11th cycle, the current was changed to 100 mA g� 1 and held constant during the rest
of the test. (d) Rate capability test for EG-1 h. Note that the cell was pre-cycled at 20 mA g� 1 for 20 cycles before the rate performance test. Capacities
shown in b–d are specific desodiation capacities.
ARTICLE NATURE COMMUNICATIONS | DOI: 10.1038/ncomms5033
6 NATURE COMMUNICATIONS | 5:4033 | DOI: 10.1038/ncomms5033 | www.nature.com/naturecommunications
& 2014 Macmillan Publishers Limited. All rights reserved.
achieve stable cycling status before the rate capability experiment.As shown in Fig. 5d, EG exhibits a capacity of 284 mAh g� 1 at20 mA g� 1; 184 mAh g� 1 at 100 mA g� 1; 91 mAh g� 1 at200 mA g� 1; and 278 mAh g� 1 when the current density ischanged back to 20 mA g� 1, demonstrating the stability of EGunder a wide range of charge–discharge conditions. The ratecapability of EG is modest compared with reported hard carbon8,and it could be further improved through nanoengineering tooptimize EG’s microstructure.
Investigation on the sodium storage mechanism in EG. Cyclicvoltammetry was used to analyse the sodium storage mechanism.EG was tested at the scan rates of 0.05, 0.1, 0.5, 1, 2, 3, 5,
10 and 20 mV s� 1, as shown in Supplementary Fig. 6a. InSupplementary Fig. 6b,c, a linear relationship was found betweenthe capacity and the reciprocal square root of scan rate, sug-gesting that the capacity was mainly limited by ion diffusion,similar to most battery electrodes32, because capacitivecontribution, that is, pseudocapacitance because of surfacereaction between Naþ and oxygen-containing functionalgroups (for example, –C¼O)31 and double layer chargingshould be independent of the scan rate33. The capacitivecontribution was approximately estimated by extrapolating theplot to V� 1/2 QUOTE , and it only contributed to 10% ofthe total sodiation capacity (Supplementary Fig. 6a) and 11%of the total desodiation capacity (Supplementary Fig. 6b) at0.05 mV s� 1 (B0.1 C rate), indicating that the majority of
C (110) (100) (002)
(110)
(200)(211)
(220)Na
(110)
(200)(211)(220)
(222)Na
(310)
(111) Na2O(200)
C (110) (100) (002)
Na EG
Na2O
Brass rodPtmanipulator
− Potentiostat +
Pristine Sodiation Desodiation
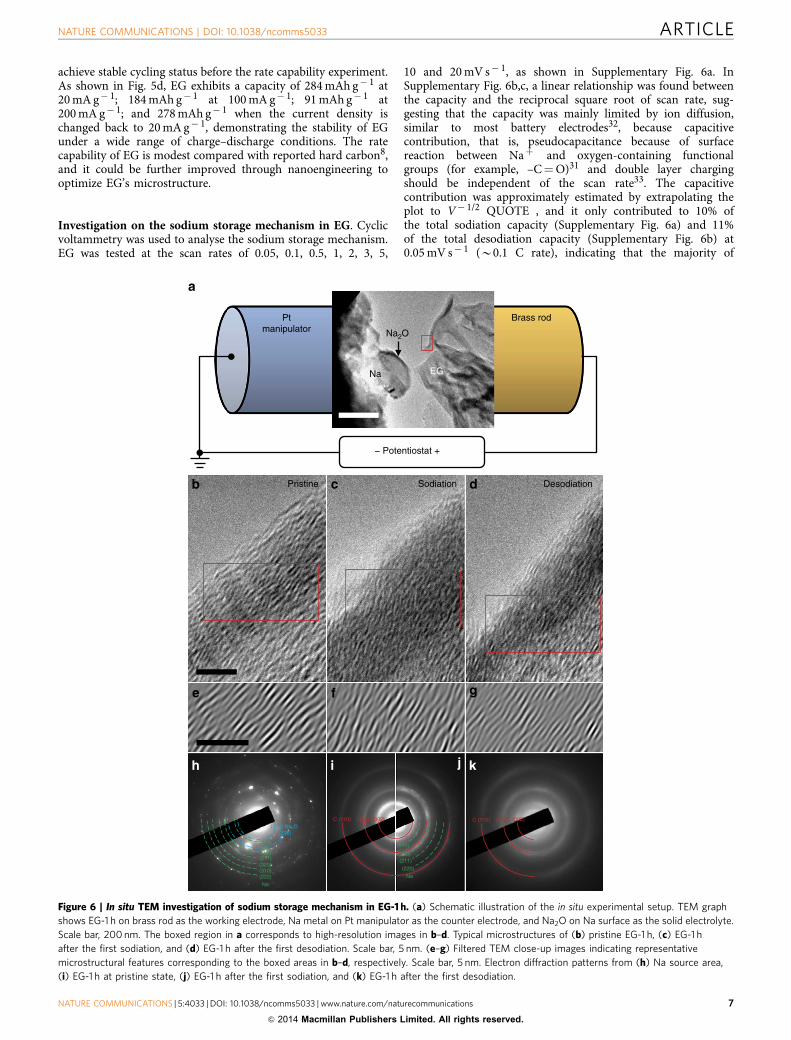
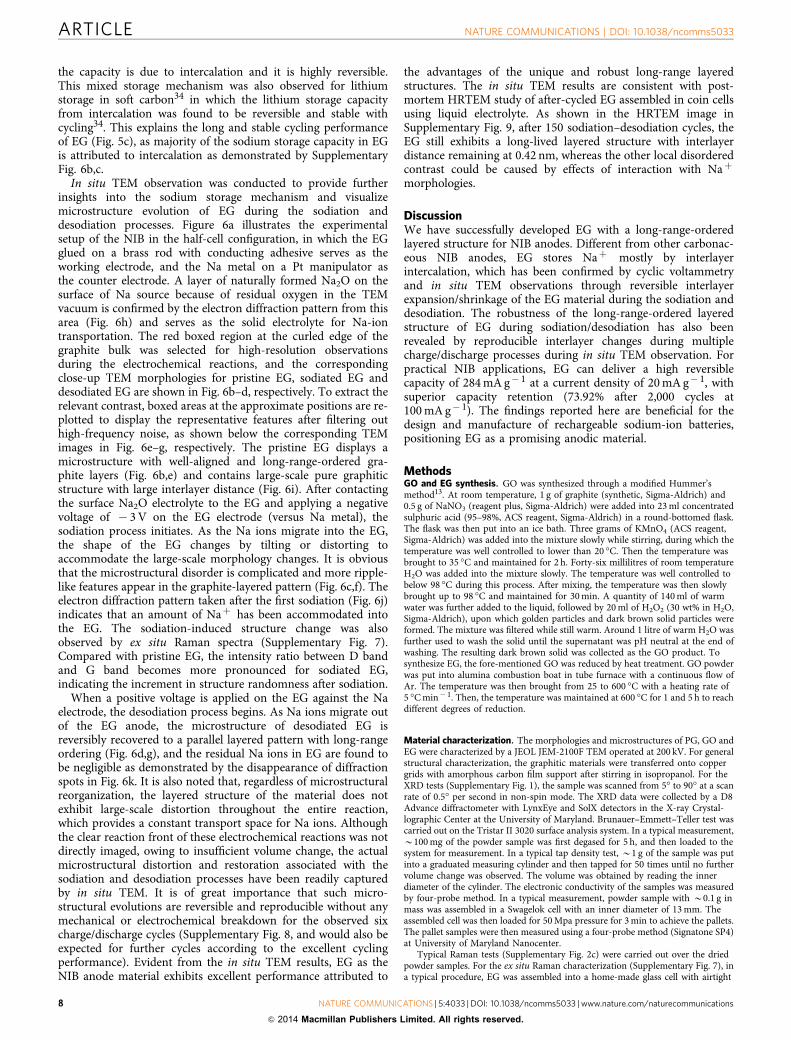
Figure 6 | In situ TEM investigation of sodium storage mechanism in EG-1 h. (a) Schematic illustration of the in situ experimental setup. TEM graph
shows EG-1 h on brass rod as the working electrode, Na metal on Pt manipulator as the counter electrode, and Na2O on Na surface as the solid electrolyte.
Scale bar, 200 nm. The boxed region in a corresponds to high-resolution images in b–d. Typical microstructures of (b) pristine EG-1 h, (c) EG-1 h
after the first sodiation, and (d) EG-1 h after the first desodiation. Scale bar, 5 nm. (e–g) Filtered TEM close-up images indicating representative
microstructural features corresponding to the boxed areas in b–d, respectively. Scale bar, 5 nm. Electron diffraction patterns from (h) Na source area,
(i) EG-1 h at pristine state, (j) EG-1 h after the first sodiation, and (k) EG-1 h after the first desodiation.
NATURE COMMUNICATIONS | DOI: 10.1038/ncomms5033 ARTICLE
NATURE COMMUNICATIONS | 5:4033 | DOI: 10.1038/ncomms5033 | www.nature.com/naturecommunications 7
& 2014 Macmillan Publishers Limited. All rights reserved.
the capacity is due to intercalation and it is highly reversible.This mixed storage mechanism was also observed for lithiumstorage in soft carbon34 in which the lithium storage capacityfrom intercalation was found to be reversible and stable withcycling34. This explains the long and stable cycling performanceof EG (Fig. 5c), as majority of the sodium storage capacity in EGis attributed to intercalation as demonstrated by SupplementaryFig. 6b,c.
In situ TEM observation was conducted to provide furtherinsights into the sodium storage mechanism and visualizemicrostructure evolution of EG during the sodiation anddesodiation processes. Figure 6a illustrates the experimentalsetup of the NIB in the half-cell configuration, in which the EGglued on a brass rod with conducting adhesive serves as theworking electrode, and the Na metal on a Pt manipulator asthe counter electrode. A layer of naturally formed Na2O on thesurface of Na source because of residual oxygen in the TEMvacuum is confirmed by the electron diffraction pattern from thisarea (Fig. 6h) and serves as the solid electrolyte for Na-iontransportation. The red boxed region at the curled edge of thegraphite bulk was selected for high-resolution observationsduring the electrochemical reactions, and the correspondingclose-up TEM morphologies for pristine EG, sodiated EG anddesodiated EG are shown in Fig. 6b–d, respectively. To extract therelevant contrast, boxed areas at the approximate positions are re-plotted to display the representative features after filtering outhigh-frequency noise, as shown below the corresponding TEMimages in Fig. 6e–g, respectively. The pristine EG displays amicrostructure with well-aligned and long-range-ordered gra-phite layers (Fig. 6b,e) and contains large-scale pure graphiticstructure with large interlayer distance (Fig. 6i). After contactingthe surface Na2O electrolyte to the EG and applying a negativevoltage of � 3 V on the EG electrode (versus Na metal), thesodiation process initiates. As the Na ions migrate into the EG,the shape of the EG changes by tilting or distorting toaccommodate the large-scale morphology changes. It is obviousthat the microstructural disorder is complicated and more ripple-like features appear in the graphite-layered pattern (Fig. 6c,f). Theelectron diffraction pattern taken after the first sodiation (Fig. 6j)indicates that an amount of Naþ has been accommodated intothe EG. The sodiation-induced structure change was alsoobserved by ex situ Raman spectra (Supplementary Fig. 7).Compared with pristine EG, the intensity ratio between D bandand G band becomes more pronounced for sodiated EG,indicating the increment in structure randomness after sodiation.
When a positive voltage is applied on the EG against the Naelectrode, the desodiation process begins. As Na ions migrate outof the EG anode, the microstructure of desodiated EG isreversibly recovered to a parallel layered pattern with long-rangeordering (Fig. 6d,g), and the residual Na ions in EG are found tobe negligible as demonstrated by the disappearance of diffractionspots in Fig. 6k. It is also noted that, regardless of microstructuralreorganization, the layered structure of the material does notexhibit large-scale distortion throughout the entire reaction,which provides a constant transport space for Na ions. Althoughthe clear reaction front of these electrochemical reactions was notdirectly imaged, owing to insufficient volume change, the actualmicrostructural distortion and restoration associated with thesodiation and desodiation processes have been readily capturedby in situ TEM. It is of great importance that such micro-structural evolutions are reversible and reproducible without anymechanical or electrochemical breakdown for the observed sixcharge/discharge cycles (Supplementary Fig. 8, and would also beexpected for further cycles according to the excellent cyclingperformance). Evident from the in situ TEM results, EG as theNIB anode material exhibits excellent performance attributed to
the advantages of the unique and robust long-range layeredstructures. The in situ TEM results are consistent with post-mortem HRTEM study of after-cycled EG assembled in coin cellsusing liquid electrolyte. As shown in the HRTEM image inSupplementary Fig. 9, after 150 sodiation–desodiation cycles, theEG still exhibits a long-lived layered structure with interlayerdistance remaining at 0.42 nm, whereas the other local disorderedcontrast could be caused by effects of interaction with Naþ
morphologies.
DiscussionWe have successfully developed EG with a long-range-orderedlayered structure for NIB anodes. Different from other carbonac-eous NIB anodes, EG stores Naþ mostly by interlayerintercalation, which has been confirmed by cyclic voltammetryand in situ TEM observations through reversible interlayerexpansion/shrinkage of the EG material during the sodiation anddesodiation. The robustness of the long-range-ordered layeredstructure of EG during sodiation/desodiation has also beenrevealed by reproducible interlayer changes during multiplecharge/discharge processes during in situ TEM observation. Forpractical NIB applications, EG can deliver a high reversiblecapacity of 284 mA g� 1 at a current density of 20 mA g� 1, withsuperior capacity retention (73.92% after 2,000 cycles at100 mA g� 1). The findings reported here are beneficial for thedesign and manufacture of rechargeable sodium-ion batteries,positioning EG as a promising anodic material.
MethodsGO and EG synthesis. GO was synthesized through a modified Hummer’smethod13. At room temperature, 1 g of graphite (synthetic, Sigma-Aldrich) and0.5 g of NaNO3 (reagent plus, Sigma-Aldrich) were added into 23 ml concentratedsulphuric acid (95–98%, ACS reagent, Sigma-Aldrich) in a round-bottomed flask.The flask was then put into an ice bath. Three grams of KMnO4 (ACS reagent,Sigma-Aldrich) was added into the mixture slowly while stirring, during which thetemperature was well controlled to lower than 20 �C. Then the temperature wasbrought to 35 �C and maintained for 2 h. Forty-six millilitres of room temperatureH2O was added into the mixture slowly. The temperature was well controlled tobelow 98 �C during this process. After mixing, the temperature was then slowlybrought up to 98 �C and maintained for 30 min. A quantity of 140 ml of warmwater was further added to the liquid, followed by 20 ml of H2O2 (30 wt% in H2O,Sigma-Aldrich), upon which golden particles and dark brown solid particles wereformed. The mixture was filtered while still warm. Around 1 litre of warm H2O wasfurther used to wash the solid until the supernatant was pH neutral at the end ofwashing. The resulting dark brown solid was collected as the GO product. Tosynthesize EG, the fore-mentioned GO was reduced by heat treatment. GO powderwas put into alumina combustion boat in tube furnace with a continuous flow ofAr. The temperature was then brought from 25 to 600 �C with a heating rate of5 �C min� 1. Then, the temperature was maintained at 600 �C for 1 and 5 h to reachdifferent degrees of reduction.
Material characterization. The morphologies and microstructures of PG, GO andEG were characterized by a JEOL JEM-2100F TEM operated at 200 kV. For generalstructural characterization, the graphitic materials were transferred onto coppergrids with amorphous carbon film support after stirring in isopropanol. For theXRD tests (Supplementary Fig. 1), the sample was scanned from 5� to 90� at a scanrate of 0.5� per second in non-spin mode. The XRD data were collected by a D8Advance diffractometer with LynxEye and SolX detectors in the X-ray Crystal-lographic Center at the University of Maryland. Brunauer–Emmett–Teller test wascarried out on the Tristar II 3020 surface analysis system. In a typical measurement,B100 mg of the powder sample was first degased for 5 h, and then loaded to thesystem for measurement. In a typical tap density test, B1 g of the sample was putinto a graduated measuring cylinder and then tapped for 50 times until no furthervolume change was observed. The volume was obtained by reading the innerdiameter of the cylinder. The electronic conductivity of the samples was measuredby four-probe method. In a typical measurement, powder sample with B0.1 g inmass was assembled in a Swagelok cell with an inner diameter of 13 mm. Theassembled cell was then loaded for 50 Mpa pressure for 3 min to achieve the pallets.The pallet samples were then measured using a four-probe method (Signatone SP4)at University of Maryland Nanocenter.
Typical Raman tests (Supplementary Fig. 2c) were carried out over the driedpowder samples. For the ex situ Raman characterization (Supplementary Fig. 7), ina typical procedure, EG was assembled into a home-made glass cell with airtight
ARTICLE NATURE COMMUNICATIONS | DOI: 10.1038/ncomms5033
8 NATURE COMMUNICATIONS | 5:4033 | DOI: 10.1038/ncomms5033 | www.nature.com/naturecommunications
& 2014 Macmillan Publishers Limited. All rights reserved.
structure. The cell was assembled with an EG working electrode, a sodium metalcounter electrode and 1.0 M NaClO4 in polycarbonate solvent liquid electrolyte inglove box with Ar atmosphere. Raman data were collected by Horiba–Jobin–YvonRaman microscope in the University of Maryland Nanocenter with laserwavelength of 532 nm.
XPS investigation was performed on powdered samples at room temperature.Data were collected using a high-sensitivity Kratos AXIS 165 spectrometer withsurvey pass energy of 160 eV and high-resolution pass energy of 20 eV, also at theUniversity of Maryland Nanocenter.
The solid-state NMR experiments were performed at 1H frequencies of500.16 MHz with Bruker Avance III system using a Bruker 3.2-mm triple-resonance E-free MAS probe in a double resonance mode. 13C MAS spectra inFig. 4 were collected by a rotor-synchronous echo sequence with (Fig. 4a) andwithout (Fig. 4b,c) a background suppression pulse sequence35 using a Kel-F cap.The background suppression sequence was used in Fig. 4b,c to quantify the signalsof very limited oxidized species without the effects of background signals. In the13C–1H REDOR experiments36,37, the data were collected with 13C p-pulsesandwiched by 13C–1H dephasing periods of four rotor cycles (tR¼ 66.7 ms).The details are described in the Supplementary Material.
Electrochemical characterization. Electrochemical properties were characterizedusing a half-cell against a pure Na counter electrode. To assemble a test cell, the EGpowder was mixed with 15 wt % of Na alginate in water in mortar and milled for30 min. The resulting slurry was then cast on copper foil. After drying at roomtemperature for B12 h, the sample was then transferred into a standard vacuum ovenkept at 100 �C for overnight. A 0.5-inch circular die-punch was used to cut theelectrode. The typical loading amount of active material was B0.5 mg cm� 2. Coincells, consisting of an EG electrode, a sodium metal counter electrode, Celgard 3501separator and 1.0 M NaClO4 in polycarbonate solvent liquid electrolyte, wereassembled in a glove box under Ar atmosphere for further electrochemical tests.
Galvanostatic charge/discharge was carried out on an Arbin BT-2000 teststation. Cells were cycled between 0.0 and 2.0 V (versus Na/Naþ ) at differentcurrent densities. After the cell reached the cutoff voltage, it was relaxed for 10 minbefore subsequent charge or discharge. The capacity was calculated based on themass of active material.
For the rate capability tests, cells were pre-cycled for 20 cycles for activation andthen charged–discharged at different current densities between 0.0 and 2.0 V (Na/Naþ ). The capacity is calculated based on the mass of EG.
The cyclic voltammetry test was carried out on the Solartron 1260/1287Electrochemical Interface test station (Solartron Metrology, UK). Cells were pre-cycled for 20 cycles to achieve the stable status before loaded to the testing system.The scan range was 0–2 V (versus Na/Naþ ) with various scan rates.
HRTEM characterization. TEM characterization and in situ imaging were carriedout on a JEOL 2100F transmission electron microscope operated at 200 kV. RegularHRTEM observation was conducted for ex situ samples to determine their struc-tures and morphologies at different conditions. In situ HRTEM experiments wereperformed with a customized NanoFactory manipulation holder equipped with apiezo-driven Pt probe. The setup is shown in Fig. 6a. In a typical experiment, EGwas glued onto a specimen rod using conductive Ag epoxy, and Na metal wasscratched off a fresh-cut surface of Na bulk using the Pt manipulator inside a glovebox filled with high-purity nitrogen to prevent oxidation. Then the Na metal wasintentionally exposed to the air for o5 s during the holder loading process, in orderto form a thin layer of Na2O on the surface, serving as a solid electrolyte. Duringthe in situ operation, potentials of � 1.0 V to � 4.0 V were applied to EG withrespect to Na metal to initiate sodiation, and þ 1.0 V to þ 4.0 V for desodiation.
References1. Molenda, J., Delmas, C. & Hagenmuller, P. Electronic and electrochemical
properties of NaxCoO2� y cathode. Solid State Ionics 9&10, 431–435 (1983).2. Nagelberg, A. S. & Worrel, W. L. A thermodynamic study of sodium-
intercalated TaS2 and TiS2. J. Solid State Chem. 29, 345–354 (1979).3. Delmas, C., Braconnier, J.-J., Fouassier, C. & Hagenmuller, P. Electrochemical
intercalation of sodium in NaxCoO2 bronzes. Solid State Ionics 3–4, 165–169(1981).
4. Ge, P. & Fouletier, M. Electrochemical interaction of sodium in graphite. SolidState Ionics 28–30, 1172–1175 (1988).
5. Stevens, D. A. & Dahn, J. R. The mechanisms of lithium and sodium insertionin carbon materials. J. Electrochem. Soc. 148, A803–A811 (2001).
6. Cao, Y. et al. Sodium ion insertion in hollow carbon nanowires for batteryapplications. Nano Lett. 12, 3783–3787 (2012).
7. Zhao, J. et al. Electrochemical and thermal properties of hard carbon-typeanodes for Na-ion batteries. J. Power Sources 244, 752–757 (2013).
8. Ponrouch, A., Goni, A. R. & Palacın, M. R. High capacity hard carbon anodesfor sodium ion batteries in additive free electrolyte. Electrochem. Commun. 27,85–88 (2013).
9. Wenzel, S., Hara, T., Janek, J. & Adelhelm, P. Room-temperature sodium-ionbatteries: Improving the rate capability of carbon anode materials by templatingstrategies. Energy Environ. Sci. 4, 3342–3345 (2011).
10. Tang, K. et al. Hollow carbon nanosphere with superior rate capability forsodium-based batteries. Adv. Energy Mater. 2, 873–877 (2012).
11. Wang, Y.-X., Chou, S.-L., Liu, H.-K. & Dou, S.-X. Reduced graphene oxide withsuperior cycling stability and rate capability for sodium storage. Carbon 57,202–208 (2013).
12. Sangster, J. C-Na (carbon-sodium) system. J. Phase Equilib. Diff. 28, 571–579(2007).
13. Hummers, Jr. W. S. & Offeman, R. E. Preparation of graphitic oxide. J. Am.Chem. Soc. 80, 1339–1339 (1957).
14. Yagi, T., Utsumi, W., Yamakata, M.-a., Kikegawa, T. & Shimomura, O.High-pressure in situ X-ray-diffraction study of the phase transformation fromgraphite to hexagonal diamond at room temperature. Phys. Rev. B 46,6031–6039 (1992).
15. Aurbach, D. & Ein-Eli, D. The Study of Li-graphite intercalation processes inseveral electrolyte systems using in situ X-ray diffraction. J. Electrochem. Soc.142, 1746–1752 (1995).
16. Lerf, A., He, H., Forster, M. & Klinowski, J. Structure of graphite oxiderevisited. J. Phys. Chem. B 102, 4477–4482 (1998).
17. Szabo, T. et al. I. Evolution of surface functional groups in a series ofprogressively oxidized graphite oxides. Chem. Mater. 18, 2740–2749 (2006).
18. Xu, B. et al. What is the choice for supercapacitors: graphene or grapheneoxide? Energy Environ. Sci. 4, 2826–2830 (2011).
19. Sing, K. S. W. Reporting physisorption data for gas/solid systems with specialreference to the determination of surface area and porosity. Pure Appl. Chem.57, 603–619 (1985).
20. Ng, S. H. et al. Correlations between surface properties of graphite and thefirst cycle specific charge loss in lithium-ion batteries. Carbon 47, 705–712(2009).
21. Xing, W., Xue, J. S. & Dahn, J. R. Optimizing pyrolysis of sugar carbons for useas anode materials in lithium-ion batteries. J. Electrochem. Soc. 143, 3046–3052(1996).
22. Zheng, T., Xue, J. & Dahn, J. R. Lithium insertion in hydrogen-containingcarbonaceous materials. Chem. Mater. 8, 389–393 (1996).
23. Zheng, T., Zhong, Q. & Dahn, J. R. High-capacity carbons prepared fromphenolic resin for anodes of lithium-ion batteries. J. Electrochem. Soc. 142,L211–L214 (1995).
24. Wang, Y., Alsmeyer, D. C. & McCreery, R. L. Raman spectroscopy ofcarbon materials: structural basis of observed spectra. Chem. Mater. 2, 557–563(1990).
25. Cai, W. et al. Synthesis and solid-state NMR structural characterizationof 13C-labeled graphite oxide. Science 321, 1815–1817 (2008).
26. Casabianca, L. B. et al. NMR-based structural modeling of graphite oxide usingmulti-dimensional 13C solid-state NMR and ab-initio chemical shiftcalculations. J. Am. Chem. Soc. 132, 5672–5676 (2010).
27. Gao, W., Alemany, L. B., Ci, L. J. & Ajayan, P. M. New insights into thestructure and reduction of graphite oxide. Nat. Chem. 1, 403–408 (2009).
28. DiVincenzo, D. P. & Mele, E. J. Cohesion and structure in stage-1 graphiteintercalation compounds. Phys. Rev. B 32, 2538–2553 (1985).
29. Gotoh, K. et al. NMR study for electrochemically inserted Na in hard carbonelectrode of sodium ion battery. J. Power Sources 225, 137–140 (2013).
30. Stevens, D. A. & Dahn, J. R. High capacity anode materials for rechargeablesodium-ion batteries. J. Electrochem. Soc. 147, 1271–1273 (2000).
31. Shao, Y. et al. Surface-driven sodium ion energy storage in nanocellular carbonfoams. Nano Lett. 13, 3909–3914 (2013).
32. Augustyn, V. et al. High-rate electrochemical energy storage through Liþ
intercalation pseudocapacitance. Nat. Mater. 12, 518–522 (2013).33. Ardizzone, S, Fregonara, G & Trasatti, S. ‘Inner’ and ‘outer’ active surface of
RuO2 electrodes. Electrochim. Acta 35, 263–267 (1990).34. Mochida, I., Ku, C.-H., Yoon, S.-H. & Korai, Y. Anodic performance and
mechanism of mesophase-pitch-derived carbons in lithium ion batteries.J. Power Sources 75, 214–222 (1998).
35. Chen, Q., Hou, S. S. & Schmidt-Rohr, K. A simple scheme for probeheadbackground suppression in one-pulse 1H NMR. Solid State Nucl. Magn. Reson.26, 11–15 (2004).
36. Ishii, Y., Wickramasinghe, N. P. & Chimon, S. A new approach in 1D and 2D13C high resolution solid-state NMR spectroscopy of paramagneticorganometallic complexes by very fast magic-angle spinning. J. Am. Chem. Soc.125, 3438–3439 (2003).
37. Wickramasinghe, N. P. et al. Progress in 13C and 1H solid-state NMR forparamagnetic systems under very fast magic angle spinning. J. Chem. Phys. 128,052210-1–052210-15 (2008).
AcknowledgementsThis work was supported as part of the Science of Nanostructures for Electrical EnergyStorage, an Energy Frontier Research Center funded by the US Department of Energy,Office of Science, Office of Basic Energy Sciences under Award Number DESC0001160.We also acknowledge funding for the NMR studies by Y.I. (NSF CHE-1310363) and theuse of facilities in Maryland NanoCenter and its NISP Lab supported in part by the NSF
NATURE COMMUNICATIONS | DOI: 10.1038/ncomms5033 ARTICLE
NATURE COMMUNICATIONS | 5:4033 | DOI: 10.1038/ncomms5033 | www.nature.com/naturecommunications 9
& 2014 Macmillan Publishers Limited. All rights reserved.

MRSEC under grant DMR 05-20471. We thank Dr Karen Gaskell at the Surface AnalysisCenter of University of Maryland for the help on the XPS data analysis.
Author contributionsY.W., Y.X. and C.W. conceived the ideas; Y.W. prepared the materials and performedmajority of the materials characterization and electrochemical tests; F.H. carried out theelectronic conductivity test; K.H. and Y.W. carried out the in situ TEM experimentsunder the direction of J.C. and C.W., respectively; I.M. and Y.I. performed the MAS-NMR characterization, and co-wrote the related session; Y.W. and Y.Z. analysed all thedata; and Y.W., K.H. and Y.Z. co-wrote the manuscript. All authors discussed andcommented on the manuscript.
Additional informationSupplementary Information accompanies this paper at http://www.nature.com/naturecommunications
Competing financial interests: The authors declare no competing financial interests.
Reprints and permission information is available online at http://npg.nature.com/reprintsandpermissions/
How to cite this article: Wen, Y. et al. Expanded graphite as superior anodefor sodium-ion batteries. Nat. Commun. 5:4033 doi: 10.1038/ncomms5033(2014).
ARTICLE NATURE COMMUNICATIONS | DOI: 10.1038/ncomms5033
10 NATURE COMMUNICATIONS | 5:4033 | DOI: 10.1038/ncomms5033 | www.nature.com/naturecommunications
& 2014 Macmillan Publishers Limited. All rights reserved.