Exhibit C Geotechnical Report - unionridgesolar.com
67
Case No. 20-1757-EL-BGN Union Ridge Solar Exhibit C Geotechnical Report
Transcript of Exhibit C Geotechnical Report - unionridgesolar.com
Case No. 20-1757-EL-BGN
Union Ridge Solar
Exhibit C
Geotechnical Report

20212714.001A/DEN21R120804_rev2 January 29, 2021 © 2021 Kleinfelder www.kleinfelder.com
KLEINFELDER 707 17th Street, Suite 3000, Denver, CO 80202 p | 303.237.6601
January 29, 2021 Project No. 20212714.001A Mr. Bill Branca, PE Senior Director - Development Leeward Renewable Energy, LLC 6688 N. Central Expressway, Suite 500 Dallas, TX 75206 Subject: Geotechnical Report
Union Ridge Solar Project Licking County, Ohio
Dear Mr. Branca, Kleinfelder is pleased to present this revised report summarizing the geotechnical investigation for the Union Ridge Solar project. The purpose of the geotechnical investigation is to characterize the subsurface conditions and provide geotechnical recommendations for the design and construction of the Union Ridge Solar project. The recommendations presented in this report are subject to the limitations presented herein. In addition, the brief by the Geotechnical Business Association (GBA, Appendix E) provides additional information regarding data interpretation and industry-standard limitations of a geotechnical investigation. We appreciate the opportunity to provide geotechnical engineering services on this project. Should you have any questions, please contact Bradley Baum at 303.297.5733 Respectfully submitted, KLEINFELDER, INC. Bradley M. Baum, MS, PMP James M. Beideman, PE (OH) Project Manager III Program Manager
20212714.001A/DEN21R120804_rev2 January 29, 2021 © 2021 Kleinfelder www.kleinfelder.com
KLEINFELDER 707 17th Street, Suite 3000, Denver, CO 80202 p | 303.237.6601
GEOTECHNICAL REPORT UNION RIDGE SOLAR PROJECT LICKING COUNTY, OHIO KLEINFELDER PROJECT NO. 20212714.001A
January 29, 2021
Copyright 2021 Kleinfelder All Rights Reserved
ONLY THE CLIENT OR ITS DESIGNATED REPRESENTATIVES MAY USE THIS DOCUMENT AND ONLY FOR THE SPECIFIC
PROJECT FOR WHICH THIS REPORT WAS PREPARED.

20212714.001A/ DEN21R120804_rev2 Page ii of iv January 29, 2021 © 2021 Kleinfelder www.kleinfelder.com
A Report Prepared for: Mr. Bill Branca, PE Senior Director - Development Leeward Renewable Energy, LLC 6688 N. Central Expressway, Suite 500 Dallas, TX 75206 GEOTECHNICAL REPORT UNION RIDGE SOLAR PROJECT LICKING COUNTY, OHIO Prepared by: Jennifer Carey, PE* Project Professional *Not Licensed in Ohio James M. Beideman, PE (OH) Program Manager KLEINFELDER 707 17th Street, Suite 3000 Denver, Colorado 80202 P:303.237.6601 Kleinfelder Project No. 20212714.001A January 29, 2021
01-29-2021

20212714.001A/ DEN21R120804_rev2 Page iii of iv January 29, 2021 © 2021 Kleinfelder www.kleinfelder.com
TABLE OF CONTENTS
Section Page 1 INTRODUCTION ............................................................................................................... 1
1.1 PROJECT DESCRIPTION .................................................................................... 1 2 FIELD EXPLORATION & LABORATORY TESTING ...................................................... 3
2.1 FIELD EXPLORATION .......................................................................................... 3 Soil Test Borings ........................................................................................ 3 Test Pits ..................................................................................................... 4 Field Resistivity Testing ............................................................................. 4 Laboratory Testing ..................................................................................... 4
3 SITE DESCRIPTION AND GEOLOGICAL SETTING ...................................................... 6 3.1 SITE DESCRIPTION ............................................................................................. 6 3.2 GEOLOGIC SETTING AND SURFACE SOILS .................................................... 6
Physical Setting ......................................................................................... 6 Surficial Geology........................................................................................ 6 Bedrock Geology ....................................................................................... 7 Geologic Hazards ...................................................................................... 7
3.3 SUBSURFACE CONDITIONS .............................................................................. 8 Groundwater .............................................................................................. 9
3.4 CORROSIVITY TEST RESULTS .......................................................................... 9 3.5 THERMAL RESISTIVITY .................................................................................... 10
4 CONCLUSIONS AND RECOMMENDATIONS .............................................................. 11 4.1 GENERAL CONCLUSIONS ................................................................................ 11 4.2 EARTHWORK ..................................................................................................... 11
Subgrade Preparation.............................................................................. 11 Excavation and Trenching ....................................................................... 12 Structural Fill ............................................................................................ 12 Fill Placement and Compaction ............................................................... 13 Construction in Wet or Cold Weather ...................................................... 14 Construction Testing and Observation .................................................... 14 Surface Drainage and Final Site Grading ................................................ 15
4.3 SEISMIC SITE CLASS ........................................................................................ 15 4.4 FROST HEAVE CONSIDERATIONS .................................................................. 16 4.5 PV ARRAY FOUNDATIONS ............................................................................... 16
Axial Capacity .......................................................................................... 16 Lateral Capacity ....................................................................................... 17 Refusal Considerations............................................................................ 18
4.6 EQUIPMENT FOUNDATIONS ............................................................................ 18 4.7 DIRECT EMBEDMENT POLES .......................................................................... 20 4.8 ACCESS ROADS ................................................................................................ 20
5 LIMITATIONS ................................................................................................................. 23 FIGURES
Figure 1. Exploration Location Plan & Vicinity Map Figure 2. Surficial Geology Map Figure 3. Bedrock Geology Map Figure 4. Geohazard Map

20212714.001A/ DEN21R120804_rev2 Page iv of iv January 29, 2021 © 2021 Kleinfelder www.kleinfelder.com
APPENDICES Appendix A. Soil Boring and Test Pit Logs Appendix B. Field Testing: Resistivity Testing Results Appendix C. Laboratory Test Results: Index Testing Appendix D. Laboratory Test Results: Corrosion and Thermal Resistivity Testing Appendix E. GBA Document

20212714.001A/ DEN21R120804_rev2 Page 1 of 24 January 29, 2021 © 2021 Kleinfelder www.kleinfelder.com
1 INTRODUCTION
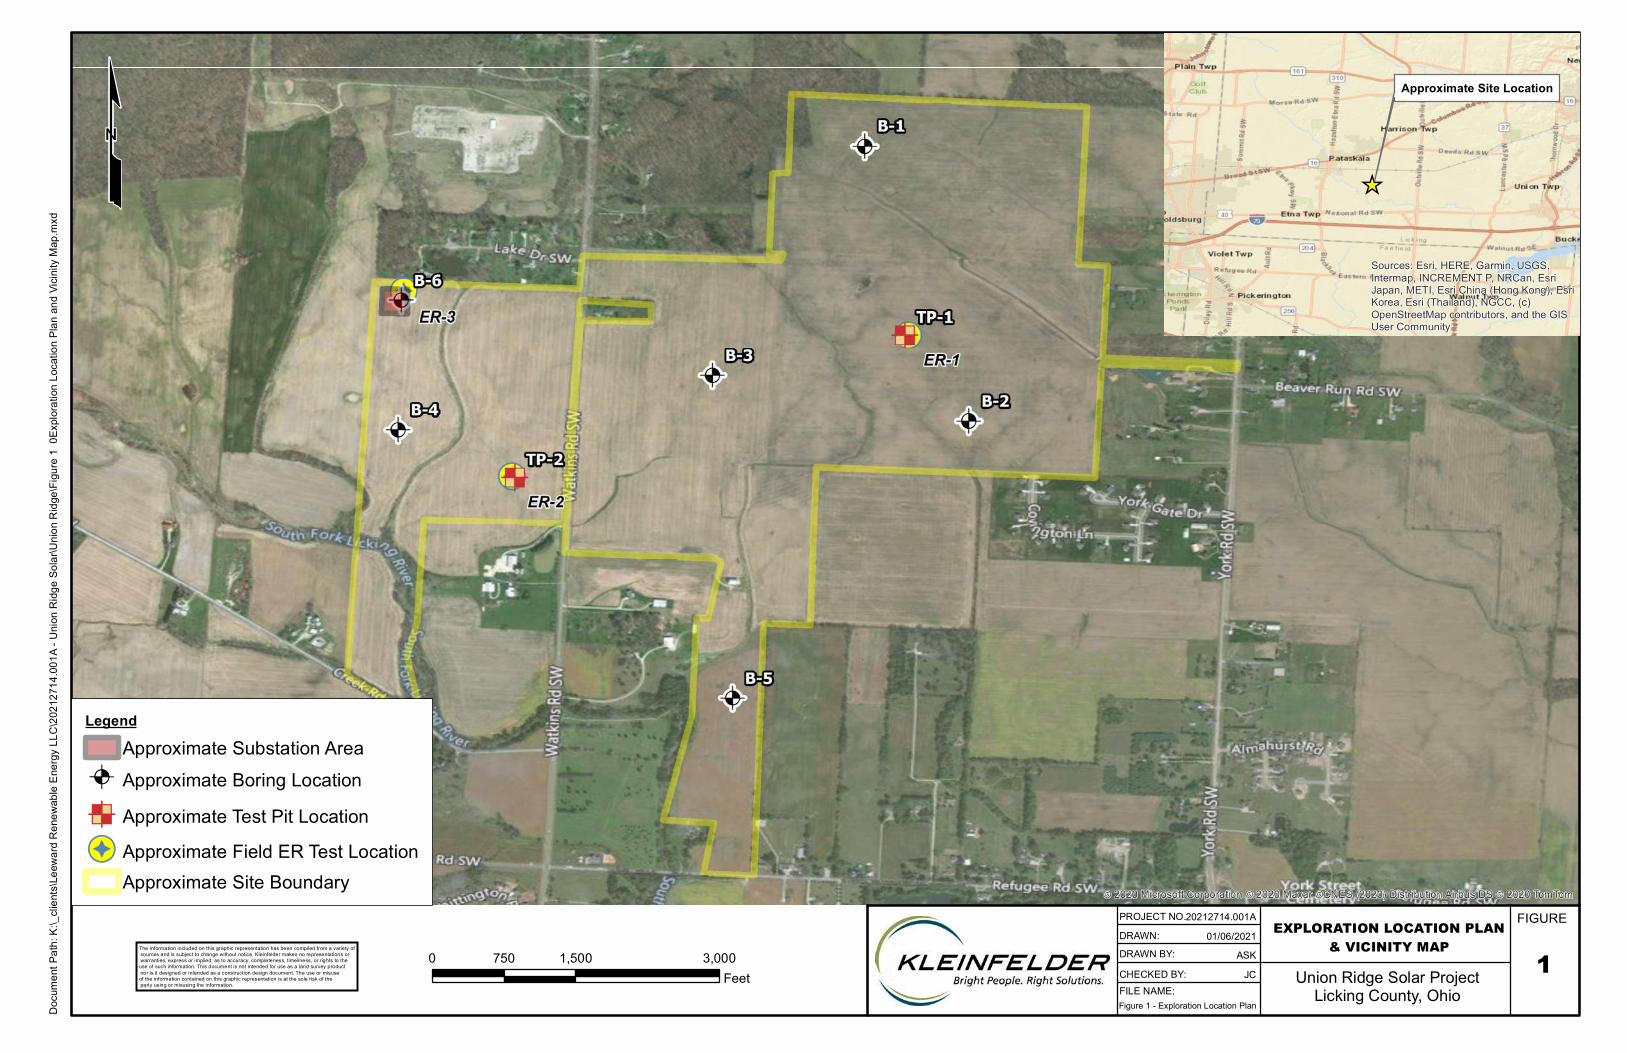
This report presents the results of Kleinfelder’s geotechnical investigation of the proposed Union
Ridge photovoltaic (PV) 108-MWac solar electric generation facility approximately 1.5 miles
southeast of the City of Pataskala in Licking County, Ohio (the Project or Site). The location of
the Project is shown on Figure 1. Kleinfelder’s services were performed in general accordance
with our proposal dated September 22, 2020. Please note that project name was changed from
Elm Solar Project to Union Ridge Solar project after submission of our proposal.
The scope of Kleinfelder’s geotechnical investigation consists of subsurface exploration,
laboratory testing, engineering analysis, and preparation of this report. The purpose of
Kleinfelder’s geotechnical engineering investigation is to provide design and construction
recommendations for the PV array foundations, equipment pads, access roads, site preparation,
and general earthwork.
In summary, the Site appears to be suitable for the intended development provided the
recommendations outlined in this report are properly incorporated in the design and construction
phases of the project.
The conclusions and recommendations presented in this report are based on subsurface
information encountered in our explorations, our site observations, and our experience with similar
developments. The recommendations contained in this report are subject to the provisions and
requirements outlined in the Limitations section of this report.
1.1 PROJECT DESCRIPTION
We understand that the Project will include the installation of ground-mounted solar PV arrays
consisting of PV panels attached to a single-axis tracker (SAT) system. The arrays will be
supported on driven steel piles, typically fabricated from wide-flange beams. Maximum axial and
lateral loads are expected to be on the order of two to three kips.
Other components installed at the Site will include overhead and underground electrical
conductors, inverters, transformers, and other electrical components, to be supported on piles,
slabs-on-grade, or combinations of slabs and piles. Additional site development will likely include
access roadways for construction and maintenance purposes.

20212714.001A/ DEN21R120804_rev2 Page 2 of 24 January 29, 2021 © 2021 Kleinfelder www.kleinfelder.com
The finished site grades had not been provided at the time this report was prepared. Kleinfelder
anticipates grading within the solar array field will be limited. Earthwork cuts and fills of no more
than approximately two feet are expected for equipment pads. Utility trenches are not anticipated
to exceed four feet in depth.

20212714.001A/ DEN21R120804_rev2 Page 3 of 24 January 29, 2021 © 2021 Kleinfelder www.kleinfelder.com
2 FIELD EXPLORATION & LABORATORY TESTING
2.1 FIELD EXPLORATION
Subsurface conditions at the Site were explored with six soil test borings, two test pits, and three
in-situ soil electrical resistivity tests between December 7, 2020, and January 13, 2021. The
approximate test and field resistivity locations are presented on Figure 1.
Prior to Kleinfelder’s field exploration, the exploration locations were cleared for underground
utilities through the Ohio 811 system. Kleinfelder staked the boring and test pit locations in the
field using a handheld GPS unit with an accuracy of approximately 16 feet. Kleinfelder
geotechnical staff observed drilling and test pit operations, collected soil samples, and reviewed
the subsurface conditions logged in each boring and test pit. Kleinfelder visually classified the
observed soils in general accordance with ASTM D2488 and the Unified Soil Classification
System. Keys to the soil descriptions and symbols used to describe the subsurface conditions
encountered are presented in Appendix A. Kleinfelder geotechnical staff also visually evaluated
the Site for the presence of obvious geohazards, such as karst features, that could impact the
construction of the PV arrays.
Soil Test Borings
Six soil test borings were advanced with a Geoprobe 7822DT track-mounted drill rig using hollow
stem auger drilling techniques to depths ranging from 15 to 50 feet below the ground surface
(bgs). Soil samples were collected with a standard 1.4-inch I.D., 2-inch O.D., split-tube sampler.
The sampler was first seated six inches, then driven an additional 18-inches with blows of a
140-pound auto-hammer falling 30 inches. Standard Penetration Tests (SPTs) were performed
at 2.5-foot intervals for the first 10 feet and at five-foot intervals thereafter, in general accordance
with ASTM D1586. Standard Penetration Test data (SPT N-values) were used to estimate the in-
situ soil strength and density. Soil samples were collected at each test interval. Groundwater
observations were recorded during drilling, upon completion of drilling, and prior to backfilling the
borings. All soil test borings were excavated to their target depths. The borings were backfilled
with cuttings from the drill operations. Logs of the borings are presented in Appendix A.
20212714.001A/ DEN21R120804_rev2 Page 4 of 24 January 29, 2021 © 2021 Kleinfelder www.kleinfelder.com
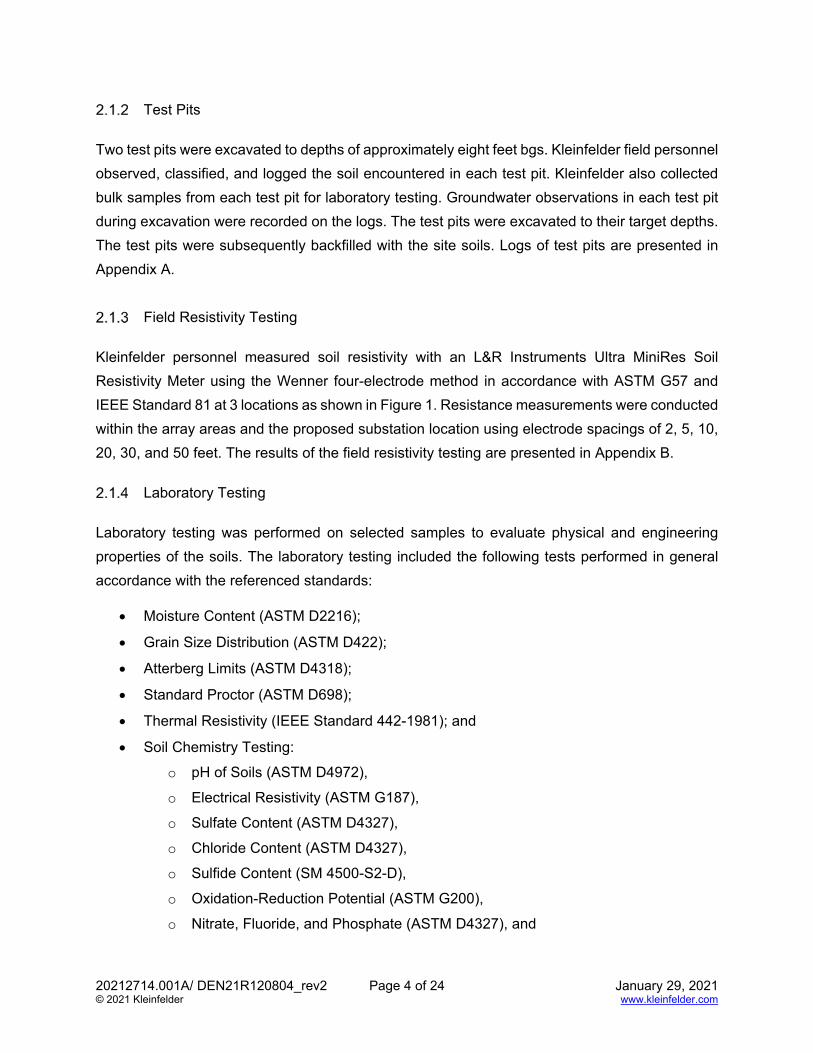
Test Pits
Two test pits were excavated to depths of approximately eight feet bgs. Kleinfelder field personnel
observed, classified, and logged the soil encountered in each test pit. Kleinfelder also collected
bulk samples from each test pit for laboratory testing. Groundwater observations in each test pit
during excavation were recorded on the logs. The test pits were excavated to their target depths.
The test pits were subsequently backfilled with the site soils. Logs of test pits are presented in
Appendix A.
Field Resistivity Testing
Kleinfelder personnel measured soil resistivity with an L&R Instruments Ultra MiniRes Soil
Resistivity Meter using the Wenner four-electrode method in accordance with ASTM G57 and
IEEE Standard 81 at 3 locations as shown in Figure 1. Resistance measurements were conducted
within the array areas and the proposed substation location using electrode spacings of 2, 5, 10,
20, 30, and 50 feet. The results of the field resistivity testing are presented in Appendix B.
Laboratory Testing
Laboratory testing was performed on selected samples to evaluate physical and engineering
properties of the soils. The laboratory testing included the following tests performed in general
accordance with the referenced standards:
Moisture Content (ASTM D2216);
Grain Size Distribution (ASTM D422);
Atterberg Limits (ASTM D4318);
Standard Proctor (ASTM D698);
Thermal Resistivity (IEEE Standard 442-1981); and
Soil Chemistry Testing:
o pH of Soils (ASTM D4972),
o Electrical Resistivity (ASTM G187),
o Sulfate Content (ASTM D4327),
o Chloride Content (ASTM D4327),
o Sulfide Content (SM 4500-S2-D),
o Oxidation-Reduction Potential (ASTM G200),
o Nitrate, Fluoride, and Phosphate (ASTM D4327), and

20212714.001A/ DEN21R120804_rev2 Page 5 of 24 January 29, 2021 © 2021 Kleinfelder www.kleinfelder.com
o Ammonium, Lithium, Sodium, Potassium, Magnesium, and Calcium (ASTM
D6919).
Laboratory testing results are shown on the boring logs and test pits presented in Appendix A. A
summary table and laboratory test results are included in Appendix C. Thermal Resistivity Test
Results and Corrosion Test Results are included in Appendix D.

20212714.001A/ DEN21R120804_rev2 Page 6 of 24 January 29, 2021 © 2021 Kleinfelder www.kleinfelder.com
3 SITE DESCRIPTION AND GEOLOGICAL SETTING
3.1 SITE DESCRIPTION
The project site consists of approximately 480 acres of predominantly undeveloped farmland. The
topography of the Site is relatively flat and with several drainages and streams crossing it. The
South Fork Licking River bisects the southwest corner of the Site. Topographic relief is
approximately 100 feet across the Site. Ground cover at the time of our investigation primarily
consisted of predominantly harvested crops. Drain tiles are located throughout the Site to aid in
drainage of the field. It appears that some drain tiles have been damaged as evident by standing
water at the Site. Review of aerial and satellite photography from 1994 through 2020 indicates
the Site has remained mostly undeveloped agricultural land. A Quonset hut, owned by Mr. Jerry
Lamp, is located near the center of the site and was used as a muster point/equipment storage
area during our investigation. A small structure to the south of PLT-5 is shown on a satellite image
in 1994 but has been demolished and removed from the Site. It is possible that abandoned
underground structures, such as foundations, may still exist in the area. Overhead power lines
traverse the northern portion of the Site between PLT-1 and PLT-2 and along the east side of
Watkins Road SW.
3.2 GEOLOGIC SETTING AND SURFACE SOILS
Physical Setting
Based on the “Physiographic Regions of Ohio” map published by Ohio Department of Natural
Resources (OH DNR), the Site is mapped within the Galion Glaciated Low Plateau Section of the
Central Lowland Physiographic Province. This geology of this region consists of medium- to low-
lime Wisconsinan-age till over Mississippian-age shales and sandstones. The ground surface
ranges in elevation from 950 to 1,050 feet above mean sea level.
Surficial Geology
A review of the Quaternary Geology Map published by the Ohio DNR’s Division of Geologic
Survey indicates the presence of several surficial geologic units across the Site. These geologic
units are known to have originated from the Late Wisconsinan-aged Woodfordian ice deposits
and are comprised predominantly of loam till on the northeastern and silty loam till to the
southwestern portions of the Site. Figure 2 shows the project site overlain on the OH DNR

20212714.001A/ DEN21R120804_rev2 Page 7 of 24 January 29, 2021 © 2021 Kleinfelder www.kleinfelder.com
Quaternary Geologic map. More detailed descriptions of these units have been presented in Table
3-1 below:
Table 3-1. Surficial Geologic Units
Geologic Unit
Unit Symbol
Description
Ground Moraine G1
Loam till with thin loess (<1 m) cover (Kent, Navarre tills); flat to gently undulating
Ground Moraine G2 Silty loam till (Darby, Bellfontaine, Centerburg tills); flat to gently undulating
Low-Level Valley-Train Outwash
L4 Clayey Till (Hiram Till); very flat, planed by waves in glacial lakes; small patches of sand, silt, or clay on the surface in many areas
End Moraine M1 Loam till with thin loess (<1 m) cover (Kent, Navarre tills); End moraine, occurs as hummocky ridges higher than adjacent terrain
Bedrock Geology
Based on the Bedrock Geology map published by the Ohio DNR’s Division of Geologic Survey,
the Site is underlain by the Maxville Limestone of the Logan and Cuyahoga Formations (Mu) and
Sunbury and Bedford Formations (Msbd). According to the US Geological Survey (USGS), the
Logan and Cuyahoga Formations consist of interbedded shale, siltstone and sandstone that are
various shades of gray, yellow and brown. The Sunbury and Bedford Formations consist of black
to brownish-black shale and siltstone. Figure 3 shows the project site overlain on the regional
bedrock geology.
Geologic Hazards
Based on our review of geologic literature and our explorations performed on the Site, the
following Table 3-2 summarizes our finding and the relative risk related to geologic hazards in the
project site area. The geologic hazards listed below are also summarized on Figure 4.

20212714.001A/ DEN21R120804_rev2 Page 8 of 24 January 29, 2021 © 2021 Kleinfelder www.kleinfelder.com
Table 3-2. Summary of Geologic Hazards
Geologic Hazard Relative
Risk Comments
Collapsible Soils Low Geologic setting and climate do not indicate likely presence of collapsible soils.
Expansive Soils Medium Results of Atterberg Limits tests and Grain Size Analysis tests indicate medium shrink/swell potential.
Landslides of Slide-Prone Soils
Low
Based on the Landslide Overview Map of the Conterminous United States (1982) by Radbruch-Hall, Dorothy, et al., US Geologic Survey there is a low incidence (less than 1.5% of the area involved) of landslides in the vicinity of the site.
Karst Low
Based on the Karst in the United States: A Digital Map Compilation, by Weary, D.J., US Geological Survey Open-File Report 2014-1156, the project site is not mapped within an area that is known to be comprised of flat-lying beds of carbonate rocks (such as dolomite) beneath an overburden of non-carbonate material. A review of the “Probable Karst areas of Ohio” map published by the OH DNR does not indicate the presence of known karst features in the general vicinity of the site. Kleinfelder did not observe indications of karst features such as depressions, vugs, or voids at the completed exploration or resistivity test locations.
Earthquakes Low
Based on the USGS 2018 one-year model, the project site has a less than 1 percent chance of potentially minor damage (equivalent to a Modified Mercalli Intensity VI). There are no faults shown in the project area on the USGS Quaternary Faults and Folds Database.
Mining Low
Based on the “Mines of Ohio” database published by the Ohio Division of Mineral Resources, there are no documented surficial or underground mines directly beneath the project site. There is an inactive surface mine located near the southeast corner of York Road SW and Refugee Rd SW, approximately 1.5 miles southeast of the project site.
Flooding Medium
Based on our review of the FEMA Flood Insurance Rate Maps, the project site area predominantly lies within Zone X (an area outside the 0.2% annual chance of flooding). A portion of the site is mapped within the 1% Annual Chance Flood Hazard Zone, or Special Flood Hazard Area (SFHA). Special construction or other provisions may apply based on federal, state, and local codes.
3.3 SUBSURFACE CONDITIONS
The following description provides a general summary of the subsurface conditions encountered
during the field exploration and further identified by the laboratory testing program. A more
detailed description can be found on the Boring and Test Pit Logs presented in Appendix A.

20212714.001A/ DEN21R120804_rev2 Page 9 of 24 January 29, 2021 © 2021 Kleinfelder www.kleinfelder.com
The surface soil conditions encountered at the Site generally consist of Glacial Till. Approximately
six inches of topsoil was observed in each test boring. The borings, with the exception of Boring
B-3, consist of medium stiff to very stiff lean clay (CL) with various amounts of sand and gravel to
a maximum observed depth of 18 feet. Below 18 feet, Boring B-6 encountered loose to dense
silty and clayey sand (SM-SC) with varying amounts of gravel to a depth of 48 feet bgs. Boring
B-6 encountered stiff lean clay (CL) with sand was encountered at 48 feet bgs. Boring B-3
encountered loose silty and clayey sand (SM-SC) below the topsoil to a depth of 5 feet bgs.
Bedrock was not encountered in any of the test borings or test pits.
The subsurface conditions in the two test pits were generally similar to those observed in the
borings. Excavation refusal was not encountered in either test pit, which extended to depths of
approximately 8 feet bgs.
Engineering properties of the soils were evaluated using field and laboratory testing and are
included in Appendix C. Atterberg limits tests performed on selected samples of the soils indicated
liquid limit (LL) values ranging from 22 to 35 and plasticity index (PI) values ranging from 5 to 18.
Groundwater
Groundwater was observed in Boring B-6 at a depth of approximately 17 feet bgs during drilling
and at a depth of 5 feet bgs prior to backfilling. Some fluctuation in groundwater levels can occur
with climatic and seasonal variations. Fluctuation of the groundwater level, localized zones of
perched water, and increased soil moisture content should be anticipated during and following
rain events. Therefore, subsurface water conditions at other times may be different from those
described in this report.
3.4 CORROSIVITY TEST RESULTS
Project X Corrosion Engineering (Project X) completed soil chemistry laboratory testing of two
samples to provide data regarding the corrosivity of onsite soils. These analytical laboratory tests
were performed on discrete samples and do not provide a complete representation of all soil types
at the Site. The soil corrosion laboratory test results are general and should be considered only a
random survey. The results of the chemical testing are summarized in Table 3-3 and provided in
Appendix D.

20212714.001A/ DEN21R120804_rev2 Page 10 of 24 January 29, 2021 © 2021 Kleinfelder www.kleinfelder.com
Table 3-3. Summary of Laboratory Soil Corrosivity Testing
Boring No.
Depth (ft)
pH Sulfide (mg/kg)
Chloride (mg/kg)
Sulfate (mg/kg)
Minimum Resistivity (ohm-cm)
Redox Potential Eh (mV)
TP-1 2-4 7.7 <0.01 11.5 56.5 2,680 163
TP-2 2-4 6.4 <0.01 4.9 16.0 4,288 135
These laboratory results were compared to the “Building Code Requirements for Reinforced
Concrete”, ACI 318, to evaluate the potential of corrosion and attack to concrete. Based upon the
tested sulfate concentrations, the soils have a Class S0 exposure rating for sulfate attack. ACI
has no special requirements for cement type or concrete formulation for concrete in contact with
soil based on the measured sulfate concentrations.
The results of the laboratory resistivity testing, as shown in Appendix D, generally indicate that
there is the potential for corrosion to bare steel articles in contact with soils. Galvanization is
typically used for protection of PV racking support piles, but additional measures such as coatings
or active corrosion protection systems may be necessary depending on the design life of the
system. Corrosion design recommendations should be obtained from a corrosion engineer for the
project design life.
3.5 THERMAL RESISTIVITY
Two thermal resistivity tests were performed in the laboratory on samples obtained from the test
pits. The thermal resistivity tests were performed in general accordance with IEEE Standard 442-
2017-Guide for Soil Thermal Resistivity Measurements and ASTM standards. The results of the
thermal resistivity testing are presented below in Table 3-4. Graphical results of the individual
thermal dry-out curves and more detailed information regarding the sample preparation are
presented in Appendix D.
Table 3-4. Thermal Resistivity of Native Soil Samples
Test Location
Tested Initial Moisture Content
(% dry weight)
Tested Dry
Density
(lb/ft3)
Thermal Resistivity,
wet
(°C-cm/W)
Thermal Resistivity,
dry
(°C-cm/W)
Standard Max. Dry Density (lb/ft3)
Optimum Moisture Content
(% dry weight)
TP-1 13.3 114.5 57 218 114.5 13.3
TP-2 15.4 110.7 59 293 110.7 15.4

20212714.001A/ DEN21R120804_rev2 Page 11 of 24 January 29, 2021 © 2021 Kleinfelder www.kleinfelder.com
4 CONCLUSIONS AND RECOMMENDATIONS
4.1 GENERAL CONCLUSIONS
The conclusions and recommendations presented below are based on the subsurface conditions
observed in the explorations, laboratory test results, engineering analyses, and our experience
with similar utility-scale PV solar projects. Based on the results of our field exploration and
laboratory testing, the Site appears to be geotechnically suitable for PV solar development.
4.2 EARTHWORK
Subgrade Preparation
Initial site work should consist of grubbing and stripping of vegetation, demolition, and removal of
existing structures and other deleterious materials. Deleterious material should be removed for
offsite disposal in accordance with local laws and regulations.
Subgrades below roadways, equipment pads, and areas planned for structural fill placement
should be evaluated by an experienced geotechnical engineer or their representative prior to
construction. Areas should be proof rolled with a loaded dump truck (minimum 18-kip axle load).
Areas that express excessive rutting or pumping should be undercut and backfilled with structural
fill per the following paragraphs. The excavations should extend horizontally beyond the
construction limits, extending outward one foot for every one foot of excavation.
We recommend native soils below structural fill, equipment pads, spread foundations, and access
roadways be scarified, moisture conditioned to zero to three percent above optimum moisture
content, and recompacted at least eight inches below the structural fill, access road subgrade, or
base of concrete.
In the area where PV array piles will be installed, stripping of the organic materials is not required
unless there will be areas of fill in excess of 12 inches in depth. Preparation of the tilled or
disturbed soils should be completed as required to facilitate array installation equipment access
and will likely include levelling and compaction of the existing soil.

20212714.001A/ DEN21R120804_rev2 Page 12 of 24 January 29, 2021 © 2021 Kleinfelder www.kleinfelder.com
Excavation and Trenching
We anticipate that the site soils can be excavated using conventional heavy-duty construction
equipment. Our borings and test pits did not encounter bedrock, boulders, or other layers
anticipated to present difficult excavation conditions at typical utility installation depths.
All excavations must comply with applicable local, state, and federal safety regulations including
the current OSHA Excavation and Trench Safety Standards. OSHA soil type and allowable
sloping must be made in the field by the contractor’s OSHA-qualified “competent person”
whenever personnel exposure is anticipated. Construction site safety is the responsibility of the
contractor, who shall also be solely responsible for the means, methods, and sequencing of
construction operations.
Structural Fill
Structural fill is defined as any fill that will support structural elements. Structural fill will be required
for backfill of utilities and for site-grading fill. All structural fill must be free of sod, rubbish, topsoil,
frozen soil, and other deleterious materials. The onsite soils are generally suitable for reuse as
structural fill, provided they are properly moisture conditioned to maintain workability. Imported
Structural fill materials should consist of a non-expansive, mainly granular material as specified
in the table below.

20212714.001A/ DEN21R120804_rev2 Page 13 of 24 January 29, 2021 © 2021 Kleinfelder www.kleinfelder.com
Table 4-1. Structural Fill Criteria
Gradation Requirements
Standard Sieve Size Percent Passing
3 inches 100
3/4 inch 80 - 100
No. 200 10 - 35
Plasticity Requirements (Atterberg Limits)
Liquid Limit 30 or less
Plasticity Index 12 or less
The materials encountered during Kleinfelder’s evaluation were generally fine-grained (i.e.,
greater than 50 percent passing the No. 200 sieve) with higher liquid limits and plasticity indices
than listed in Table 4-1. The in-situ moisture content of tested onsite soils ranged from about 13
to 23 percent, while proctor test results indicate optimum moisture contents ranging from
approximately 13 to 16 percent. Fine-grained soils with elevated liquid limits and plastic indices
are moisture sensitive and can be difficult to dry out to achieve compaction requirements.
A sample of any imported fill material should be submitted to the geotechnical engineer for
approval and testing at least one week prior to stockpiling at the Site. Structural fill should be
placed according to the recommendations in Section 4.2.4.
Fill Placement and Compaction
Structural fill should be placed in loose lifts and in thicknesses appropriate for the compaction
equipment being used. However, in no case should loose-lift thickness exceed eight inches.
Structural fill should be compacted to the specifications presented in Table 4-2.

20212714.001A/ DEN21R120804_rev2 Page 14 of 24 January 29, 2021 © 2021 Kleinfelder www.kleinfelder.com
Table 4-2. Compaction Specifications
Fill Location Fill Material
Type
Minimum Percent Compaction
(ASTM D698)
Moisture Content
Foundation and Roadway Subgrade Preparation or
Site Grading
Clay Soil 95 0 to +3% of
optimum
Sandy Soil 95 -2 to +2% of
optimum
Construction in Wet or Cold Weather
During construction, the Site should be graded such that surface water can drain readily away
from excavations. Any water should be promptly pumped out or otherwise removed since water
may accumulate in excavations or on subgrade surfaces. These wet areas should be allowed to
dry before resuming construction. The use of berms, ditches, and similar means may be used to
prevent stormwater from entering the work area and to convey any water off-site efficiently.
If earthwork is performed during the winter months when freezing may occur, no grading fill,
structural fill, or other fill should be placed on frosted or frozen ground, nor should frozen material
be placed as fill. Frozen ground should be allowed to thaw or be completely removed prior to
placement of fill. A good practice is to cover the compacted fill with a “blanket” of loose fill to help
prevent the compacted fill from freezing.
Construction Testing and Observation
Field testing and construction observation should take place under the direction of a qualified
geotechnical engineer. Furthermore, the opinions and recommendations expressed in a
geotechnical report are based on interpretation of limited information obtained from the field
exploration. Therefore, it is common to find that actual site conditions differ from those indicated
in the report. The geotechnical engineer should remain involved throughout the project to evaluate
such differing conditions as they appear, and to modify or add to the geotechnical
recommendations, as necessary.

20212714.001A/ DEN21R120804_rev2 Page 15 of 24 January 29, 2021 © 2021 Kleinfelder www.kleinfelder.com
Surface Drainage and Final Site Grading
Positive drainage away from structures is essential to the performance of foundations and roads
and should be provided during the life of the facility. Consideration should be given to improving
the slope and surface drainage of areas that have ponding of surface water and/or poor surface
drainage near slab foundations or roads.
4.3 SEISMIC SITE CLASS
Based on the soil conditions encountered in the borings and our knowledge of geologic conditions
in the area of the site, a Site Class of ‘D’ is considered appropriate. From our research, the 2017
Ohio Building Code is currently being utilized, which is based on the 2015 International Building
Code and the ASCE 7-10 Minimum Design Loads for Buildings and Other Structures. The seismic
design parameters, based on a latitude/longitude of 39.9837°/-82.6401° as determined in ASCE
7-10 from the ATC Hazards by Location website (hazards.atcouncil.org), are summarized below
in Table 4-3.
Table 4-3. Seismic Design Parameters
Design Parameter Recommended
Value
Site Class D
PGA 0.051
PGAM 0.082
Ss 0.112
S1 0.096
Fa 1.6
Fv 2.4
SMS 0.179
SM1 0.143
SDS 0.120
SD1 0.096
The typical soil profile encountered in our borings was predominately medium stiff to very stiff
lean clay loose to medium dense sand.

20212714.001A/ DEN21R120804_rev2 Page 16 of 24 January 29, 2021 © 2021 Kleinfelder www.kleinfelder.com
It is our opinion that the upper 10 to 15-foot soil profile presents negligible risk of liquefaction due
to the presence of stiff clays and low seismicity at the Site. Layers of saturated loose and medium
dense sands below the clay profile may be subject to liquefaction if cyclic or vibration loading at
the Site were to occur in those layers, but liquefaction due to seismic shaking is unlikely at the
Site.
4.4 FROST HEAVE CONSIDERATIONS
The Columbus, Ohio Code of Ordinances, Chapter 2145.03, Ohio Building Code, Structural –
Frost Line, has indicated that the standard frost depth is thirty-two inches for Columbus, Ohio,
located approximately 18 miles west of the project site. Figure 7 from Soil Mechanics: NAVFAC
DM7.01 indicates that the extreme frost depth at the site is between 30 and 40 inches. We
estimate the frost depth at the Site is approximately thirty-six inches.
Groundwater was encountered at one boring at the Site at a depth of approximately 17 feet bgs
and below the lean clay layer. At the completion of drilling, groundwater was measured at a depth
of approximately 5 feet bgs. Due to the presence, depth and thickness of the lean clay layer
encountered in the upper fifteen feet over the majority of the Site, in combination with the depth
to groundwater encountered at the Site, we anticipate the risk of frost action to be low to moderate.
4.5 PV ARRAY FOUNDATIONS
Typical foundations used for PV arrays, such as driven steel piles, drilled piers, helical piers,
ballasts, or footings will likely be feasible for use for this project. We have assumed driven steel
piles are preferred.
The following design values for evaluation of axial and lateral pile capacity are based on the
findings of our field investigation, laboratory testing, and our experience in the area. Based on the
soils encountered at the Site and potential frost-heave considerations, we recommend all PV
support piles have a minimum driven depth of at least 7.5 feet below grade. Greater depths may
be required to achieve structural requirements.
Axial Capacity
Axial capacity of driven piles may be estimated based on the perimeter of the pile and embedment
depth. The perimeter of a wide-flange beam should be taken as twice the sum of the flange width

20212714.001A/ DEN21R120804_rev2 Page 17 of 24 January 29, 2021 © 2021 Kleinfelder www.kleinfelder.com
and web depth. We recommend the upper one foot of soil be neglected from the skin friction
component of axial capacity.
Kleinfelder evaluated the skin friction of pile based on the exploration and testing results
presented in this report. The ultimate skin friction of driven pile foundations can be taken as 350
psf. Thus, the nominal axial load capacity of the driven piles for PV racking in the upper 15 feet
can be calculated using the following formula:
Qult = 350psf * P * (L-1ft)
Where: Qult = ultimate (nominal) axial capacity (pounds) P = perimeter equal to twice the section depth plus twice the flange width (ft) L = embedment depth (ft), neglecting the upper 1ft
For design of piles, we recommend a factor of safety of at least 2 for evaluation of allowable skin
friction, or a resistance factor of 0.6 for design using load and resistance factored design (LRFD).
For piles in compression, end bearing can be considered additive to the skin friction. Ultimate end
bearing pressure can be taken as 5,000 psf, calculated based on the box end area of the pile. For
evaluation of allowable end pressure, we recommend a factor of safety of 2.5. For LRFD, we
recommend a maximum a resistance factor of 0.5. The above values can be used to estimate the
capacity of piles for both refusal and non-refusal installations.
Lateral Capacity
Lateral load response of pile foundations can be calculated with the computer program LPile,
created by Ensoft, Inc. The stiffness of the pile and the stress-strain properties of the surrounding
soils determine the lateral resistance of the foundation. Recommended LPile input parameters for
the clay soils encountered are included below in Table 4-4. As shown in the table, the upper foot
of soil should be neglected for lateral capacity.
Table 4-4: LPile Input Parameters
Depth Below Grade (ft)
Soil Type Effective Unit Weight (pcf)
Elastic Subgrade Reaction (pci)
Undrained Cohesion (psf)
0 to 1 Neglect
1 to 15 Stiff Clay w/o Free
Water 110 - 1,000

20212714.001A/ DEN21R120804_rev2 Page 18 of 24 January 29, 2021 © 2021 Kleinfelder www.kleinfelder.com
Kleinfelder developed these parameters from the results of the field and laboratory testing. These
parameters can be used for the full depth of pile embedment. If piles will be wider than 7 inches,
Kleinfelder should be given the opportunity to reevaluate these parameters.
Refusal Considerations
We recommend that all PV support piles have a minimum driven depth of at least 7.5 feet. Greater
depths may be required to achieve structural requirements. Refusal is defined as no advancement
after driving the piles at full power (minimum 830 Joules) for at least 30 seconds. Piles that refuse
and require additional embedment depth should be withdrawn and the pile location predrilled.
Predrilled pile holes should be backfilled with compacted granular material. Compaction should
be completed by tamping with a heavy tamping bar with at least three lifts.
4.6 EQUIPMENT FOUNDATIONS
We understand that the proposed substation equipment may be supported on shallow/mat
foundations. We evaluated several foundation sizes to provide allowable bearing pressures for
various sizes based on the limiting factors of soil bearing capacity and estimates for 1-inch of
settlement (whichever is lower). Our recommendations are based on Boring B-6 from within the
proposed substation area and are summarized in Table 4-5.
Table 4-5: Summary of Shallow Foundation Bearing Pressures
Width (ft) Length (ft) Allowable Bearing
Pressure (psf)
2 2 3,000
6 6 2,500
10 10 2,000
20 20 2,000
We recommend mat foundations be designed in accordance with the following criteria:
The recommended allowable bearing pressures range from 2,000 to 3,000 psf and include
a factor of safety of at least 3 with regards to bearing capacity as shown in Table 4-5. Any
unsuitable subgrade conditions encountered in the area of mat foundations should be
improved as discussed in Section 4.2.1

20212714.001A/ DEN21R120804_rev2 Page 19 of 24 January 29, 2021 © 2021 Kleinfelder www.kleinfelder.com
An allowable modulus of subgrade reaction, kV1, of 150 pounds per square inch per inch
deflection (pci) may be used for design of mat foundations. kV1 refers to a 1-foot square plate
and should be adjusted for actual foundation dimensions using the following equation (B is
the mat width in feet).
𝑘
To provide frost protection, mat foundations should have a minimum embedment depth of
36 inches based on the frost depth or as required by more stringent codes. Minimum
embedment may be achieved by turned down or thickened edges which will also aid in
providing mat confinement. Turned down edges for the mat should extend 36 inches below
grade and should be a minimum of 12 inches in width at their base. The soils included inside
the turned down edges within the entire footprint of the mat should consist of a minimum of
12 inches of gravel (AASHTO No. 57 or equivalent). Drainage provisions should be provided
to ensure surface water does not become trapped beneath the mat.
The mat and foundation should be reinforced per the structural engineer’s recommendations.
Mat foundations should be loaded to distribute loads uniformly over the mat area as much
as possible.
Minimum foundation size should be 2-feet by 2-feet unless otherwise noted.
Post-construction total settlements of the mat foundations are estimated to be up to about 1
inch, at the sizes and allowable bearing pressures provided in Table 4-5, with
post-construction differential settlements of up to about 0.5-inch.
Underground utilities running parallel to the mat and lying 4 feet or shallower, generally
should be located no closer than 2 feet outside of the perimeter edges of the mat slab. Deeper
utilities should be located above a 1:1 (horizontal to vertical) slope projected downward from
the bottom edges of the mat.
For resistance to lateral loading, we recommend an ultimate coefficient of friction of 0.30 be
utilized for calculation of friction resistance along the bottom of foundations constructed on
approved subgrade soils. The vertical dead loads acting on the mat can be utilized to
calculate the ultimate friction resistance. We recommend a minimum factor of safety of 1.5
when using sliding friction alone. A passive pressure coefficient of 3.0 may be used to
calculate ultimate passive pressure resistance on the side of mats for resistance to sliding in
Structural Fill and site soils. A moist unit weight of 110 pcf may be used to calculate passive
pressures. The passive pressure can be assumed to act starting at a depth of 1 foot below
grade in level unpaved areas. A larger magnitude of movement is required to engage the full
passive resistance than sliding friction. Therefore, a minimum factor of safety of 2.0 is

20212714.001A/ DEN21R120804_rev2 Page 20 of 24 January 29, 2021 © 2021 Kleinfelder www.kleinfelder.com
recommended on the passive pressure when using passive pressure in conjunction with
base friction to resist lateral loads. It should be noted that the lateral load resistance values
discussed above are only applicable where the concrete for foundations are either placed
directly against undisturbed soils or that the voids created from the use of forming are
backfilled with properly compacted soil.
During construction, foundation excavations should be observed by a representative of the
Geotechnical Engineer to evaluate the supporting capabilities of the bearing materials. If
unsuitable bearing conditions are encountered, the area should be over-excavated and backfilled
with compacted Structural Fill at the recommendation of the Geotechnical Engineer of Record.
The Contractor should not allow surface and/or ground water to accumulate in foundation
excavations. Foundations should be placed in excavations immediately after foundation
subgrades are approved by the on-site geotechnical representative. Water entering foundation
excavations should be removed and the subgrade scarified, moisture conditioned, and re-
compacted in accordance with Section 4.2.1 of this report, prior to foundation placement. The use
of a “mud mat”, an unreinforced concrete slab (approximately 3 inches thick), may be considered
for foundation subgrades to protect the subgrade from damage resulting from precipitation.
4.7 DIRECT EMBEDMENT POLES
Overhead interconnection lines are assumed to be supported on direct embedment poles. Based
on the "Design Manual for High Voltage Transmission Lines" RUS Bulletin 1724E-200, the
standard for installation of direct embedment poles in “good soil” is "10 percent plus 2 feet". The
subsurface conditions encountered in our borings and test pits appear to fall within this category;
however, the pole designer should review the logs to determine an appropriate depth for poles.
4.8 ACCESS ROADS
At typical solar sites, access roads are heavily used during construction, but see very low traffic
volumes during the life of the installation. Vehicle types are anticipated to vary significantly, from
lightly to heavily loaded trucks and construction equipment. Access road sections are typically
designed based on post-construction traffic volumes, with the assumption that localized
improvements and/or frequent maintenance of the roads will occur during construction.
Gravel-surfaced or soil access roads are typical for these facilities.
Near surface soils encountered in the explorations were predominately lean clay with various
amounts of sand and gravel with low to medium plasticity. These soils are considered fair to poor

20212714.001A/ DEN21R120804_rev2 Page 21 of 24 January 29, 2021 © 2021 Kleinfelder www.kleinfelder.com
subgrade for roads, and the strength of the subgrade will be highly influenced by moisture content.
Based on the soil type encountered, we estimate these soils to have a field CBR value of 5 for
road section design.
Performance of gravel-surface roads is greatly influenced by moisture in the subgrade soils. High
subgrade moisture contents will increase the frequency and depth of rutting and ponding on the
wearing surface. The use of subgrade stabilization (e.g., 4 to 6% lime or fly-ash) or a geotextile
separation fabric (e.g., Tensar BX1100 geogrid or equivalent) can improve support qualities and
may be appropriate for high-traffic areas. A geotextile can also reduce rutting and maintain
strength of a gravel surface course.
Based on AASHTO design criteria for low-volume roads, we recommend a minimum wearing
surface of ten inches of aggregate for a traffic load of six trucks per weekday for a year during
construction. Traffic after construction is anticipated to be very limited, mainly consisting of pick-
up trucks and rare heavy trucks for maintenance operations. These traffic volumes are too small
for typical road design methods, and the primary concern will be access. Therefore, we
recommend a wearing surface of a minimum of 6 inches of aggregate. This recommendation is
not additional to the “during construction” section. The 6-inch section can be achieved through
grading and spot-filling of ruts and other thin or warn areas in the roads.
Wearing course should consist of imported granular material that meets the requirements of the
Ohio Department of Transportation Construction and Material Specifications (2019) Section
703.04, Aggregate for Asphalt Concrete Base. An increased thickness of granular material may
be required in isolated areas to achieve stability.
We recommend the roads be designed with cross-slope to promote drainage, and, where
possible, with ditches to help drain water from the road and convey off-site.
Road alignments should be properly prepared by stripping all vegetation, organic soil, and
deleterious materials and scarified and recompacted to a depth 12 inches below final subgrade
elevation. The road alignment should be proof rolled with a fully loaded dump truck or similar
vehicle. Areas that deflect, rut, or pump should be further excavated and recompacted, or
stabilized.
Regular maintenance including grading and the addition of gravel should be anticipated during
the facility construction because truck and heavy equipment traffic will be frequent. After

20212714.001A/ DEN21R120804_rev2 Page 22 of 24 January 29, 2021 © 2021 Kleinfelder www.kleinfelder.com
construction, traffic volumes are anticipated to be very low, and mainly related to facility
maintenance operations.

20212714.001A/ DEN21R120804_rev2 Page 23 of 24 January 29, 2021 © 2021 Kleinfelder www.kleinfelder.com
5 LIMITATIONS
This work was performed in a manner consistent with that level of care and skill ordinarily
exercised by other members of Kleinfelder’s profession practicing in the same locality, under
similar conditions and at the date the services are provided. Our conclusions, opinions, and
recommendations are based on a limited number of observations and data. It is possible that
conditions could vary between or beyond the data evaluated. Kleinfelder makes no other
representation, guarantee, or warranty, express or implied, regarding the services,
communication (oral or written), report, opinion, or instrument of service provided.
This report may be used only by Leeward Renewable Energy, LLC and the registered design
professional in responsible charge and only for the purposes stated for this specific engagement
within a reasonable time from its issuance, but in no event later than two (2) years from the date
of the report.
The work performed was based on project information provided by Leeward Renewable Energy,
LLC. If Leeward Renewable Energy, LLC does not retain Kleinfelder to review any plans and
specifications, including any revisions or modifications to the plans and specifications, Kleinfelder
assumes no responsibility for the interpretation or implementation of our recommendations. In
addition, if there are any changes in the field to the plans and specifications, Leeward Renewable
Energy, LLC must obtain written approval from Kleinfelder’s engineer that such changes do not
affect our recommendations. Failure to do so will vitiate Kleinfelder’s recommendations.
Kleinfelder offers various levels of investigative and engineering services to suit the varying needs
of different clients. Although risk can never be eliminated, more detailed and extensive studies
yield more information, which may help understand and manage the level of risk. Since detailed
study and analysis involves greater expense, our clients participate in determining levels of
service, which provide information for their purposes at acceptable levels of risk. Leeward
Renewable Energy, LLC and key members of the design team should discuss the issues covered
in this report with Kleinfelder, so that the issues are understood and applied in a manner
consistent with the owner’s budget, tolerance of risk and expectations for future performance and
maintenance.
The scope of services for this subsurface exploration and geotechnical report did not include
environmental assessments or evaluations regarding the presence or absence of wetlands or
hazardous substances in the soil, surface water, or groundwater at this site.

20212714.001A/ DEN21R120804_rev2 Page 24 of 24 January 29, 2021 © 2021 Kleinfelder www.kleinfelder.com
This report, and any future addenda or reports regarding this site, may be made available to
bidders to supply them with only the data contained in the report regarding subsurface conditions
and laboratory test results at the point and time noted. Bidders may not rely on interpretations,
opinions, recommendations, or conclusions contained in the report. Because of the limited nature
of any subsurface study, the contractor may encounter conditions during construction which differ
from those presented in this report. In such event, the contractor should promptly notify the owner
so that Kleinfelder’s Geotechnical Engineer can be contacted to confirm those conditions. We
recommend the contractor describe the nature and extent of the differing conditions in writing and
that the construction contract include provisions for dealing with differing conditions. Contingency
funds should be reserved for potential problems during foundation construction.

20212714.001A/DEN21R120804_rev2 January 29, 2021 © 2020 Kleinfelder www.kleinfelder.com
FIGURES

M1
G2
O3
G2
G1
Copyright:© 2013 National Geographic Society, i-cubed
SURFICIAL GEOLOGY MAP2
20212714.001A01/06/2021
ASKJC
Figure 2 - Surficial Geology
The information included on this graphic representation has been compiled from a variety of sources and is subject to change without notice. Kleinfelder makes no representations or warranties, express or implied, as to accuracy, completeness, timeliness, or rights to the use of such information. This document is not intended for use as a land survey product nor is it designed or intended as a construction design document. The use or misuse of the information contained on this graphic representation is at the sole risk of the party using or misusing the information.
£
0 1,500 3,000750Feet
www.kleinfelder.com
PROJECT NO.DRAWN:DRAWN BY:CHECKED BY:FILE NAME:
PLATE
Docu
ment
Path:
K:\_
clients
\Leew
ard R
enew
able
Energ
y LLC
\2021
2714
.001A
- Unio
n Ridg
e Sola
r\Unio
n Ridg
e\Figu
re 2 -
Surfic
ial G
eolog
y.mxd
FIGURE
LegendApproximate Substation AreaApproximate Site BoundaryO3 - Low-level valley-train outwashG2 - Ground moraineG1 - Ground moraineM1 - End moraine
REFERENCE"Quaternary Geology 500K - Geologic Units"Published by : Ohio Department of Natural Resources -Division of Geological Survey Union Ridge Solar Project
Licking County, Ohio

Mu
Mu
Msbd
Mu
Mu
Do
Msbd
Copyright:© 2013 National Geographic Society, i-cubed
BEDROCK GEOLOGY MAP3
20212714.001A01/06/2021
ASKJC
Figure 3 - Bedrock Geology
The information included on this graphic representation has been compiled from a variety of sources and is subject to change without notice. Kleinfelder makes no representations or warranties, express or implied, as to accuracy, completeness, timeliness, or rights to the use of such information. This document is not intended for use as a land survey product nor is it designed or intended as a construction design document. The use or misuse of the information contained on this graphic representation is at the sole risk of the party using or misusing the information.
£
0 2,000 4,0001,000Feet
www.kleinfelder.com
PROJECT NO.DRAWN:DRAWN BY:CHECKED BY:FILE NAME:
PLATE
Docu
ment
Path:
K:\_
clients
\Leew
ard R
enew
able
Energ
y LLC
\2021
2714
.001A
- Unio
n Ridg
e Sola
r\Unio
n Ridg
e\Figu
re 3 -
Bedro
ck G
eolog
y.mxd
FIGURE
LegendApproximate Substation AreaApproximate Site BoundaryMu - Maxville Limestone, Logan Formation, And Cuyahoga Formations UndividedMsbd - Sunbury And Bedford Formations UndividedDo - Ohio And Olentangy Shales Undivided
REFERENCE"Bedrock Geology 24K - Geologic Units"Published by : Ohio Department of Natural Resources -Division of Geological Survey Union Ridge Solar Project
Licking County, Ohio
EXPLORATION LOCATION PLAN& VICINITY MAP 1
20212714.001A01/06/2021
ASKJC
Figure 1 - Exploration Location P lan
The inform ation inc lud e d on this graphic re pre se ntation has be e n com pile d from a varie ty of sourc e s and is subje c t to c hange without notic e . Kle infe ld e r m ake s no re pre se ntations or warrantie s, e xpre ss or im plie d , as to ac c urac y, com ple te ne ss, tim e line ss, or rights to the use of suc h inform ation. This d ocum e nt is not inte nd e d for use as a land surve y product nor is it d e signe d or inte nd e d as a c onstruction d e sign doc um e nt. The use or m isuse of the inform ation containe d on this graphic re pre se ntation is at the sole risk of the party using or m isusing the inform ation.
£
0 1,500 3,000750Fe e t
www.kle infe ld e r.c om
P ROJECT NO.DRAWN:DRAWN BY:CHECKED BY:FILE NAME:
P LATE
Document Path: K:\_clients\Leeward Renewable Energy LLC\20212714.001A - Union Ridge Solar\Union Ridge\Figure 1 – Exploration Location Plan and Vicinity Map.mxd
FIGURE
LegendApproxim ate Substation Are a
'A Approxim ate Boring LocationED Approxim ate Te st P it Location&% Approxim ate Fie ld ER Te st LocationApproxim ate Site Bound ary
Union Rid ge Solar P roje c tLic king County, Ohio
_̂
Sourc e s: Esri, HERE, Garm in, USGS,Inte rm ap, INCREMENT P , NRCan, EsriJapan, METI, Esri China (Hong Kong), EsriKore a, Esri (Thailand), NGCC, (c)Ope nStre e tMap contributors, and the GISUse r Com m unity
Approximate Site Location

U.S. Geological Survey (USGS), Copyright:© 2013 National Geographic Society, i-cubed
GEOHAZARD MAP4
20212714.001A01/06/2021
ASKJC
Figure 4 - Geohazard Map
The information included on this graphic representation has been compiled from a variety of sources and is subject to change without notice. Kleinfelder makes no representations or warranties, express or implied, as to accuracy, completeness, timeliness, or rights to the use of such information. This document is not intended for use as a land survey product nor is it designed or intended as a construction design document. The use or misuse of the information contained on this graphic representation is at the sole risk of the party using or misusing the information.
£
0 2,500 5,0001,250Feet
www.kleinfelder.com
PROJECT NO.DRAWN:DRAWN BY:CHECKED BY:FILE NAME:
PLATE
Docu
ment
Path:
K:\_
clients
\Leew
ard R
enew
able
Energ
y LLC
\2021
2714
.001A
- Unio
n Ridg
e Sola
r\Unio
n Ridg
e\Figu
re 4 -
Geo
haza
rd Ma
p.mxd
FIGURE
LegendApproximate Substation AreaApproximate Site Boundary
Flood Hazard Zones1% Annual Chance Flood HazardRegulatory FloodwaySpecial FloodwayArea of Undetermined Flood Hazard0.2% Annual Chance Flood HazardFuture Conditions 1% Annual Chance Flood HazardArea with Reduced Risk Due to LeveeFIRM Panels
Landslide Incidence and SusceptibilityHigh incidenceHigh susceptibility, moderate incidenceHigh susceptibility, low incidenceModerate incidenceModerate susceptibility, low incidenceLow incidenceNo data
REFERENCERadbruch-Hall, Dorothy, et al., "Landslide OverviewMap of the Conterminous United States (1982)", publishedby : US Geologucal SurveyNational Flood Hazard Layer (NFHL) obtained fromFederal Emergency Management Agency (FEMA)
Union Ridge Solar ProjectLicking County, Ohio

20212714.001A/DEN21R120804_rev2 January 29, 2021 © 2020 Kleinfelder www.kleinfelder.com
APPENDIX A.
SOIL BORING AND TEST PIT LOGS

A-1
FIGUREGRAPHICS KEY
Union Ridge Solar ProjectLicking County, OH
The report and graphics key are an integral part of these logs. All dataand interpretations in this log are subject to the explanations andlimitations stated in the report.
Lines separating strata on the logs represent approximate boundariesonly. Actual transitions may be gradual or differ from those shown.
No warranty is provided as to the continuity of soil or rock conditionsbetween individual sample locations.
Logs represent general soil or rock conditions observed at the point ofexploration on the date indicated.
In general, Unified Soil Classification System designations presentedon the logs were based on visual classification in the field and weremodified where appropriate based on gradation and index property testing.
Fine grained soils that plot within the hatched area on the PlasticityChart, and coarse grained soils with between 5% and 12% passing the No.200 sieve require dual USCS symbols, ie., GW-GM, GP-GM, GW-GC,GP-GC, GC-GM, SW-SM, SP-SM, SW-SC, SP-SC, SC-SM.
If sampler is not able to be driven at least 6 inches then 50/X indicatesnumber of blows required to drive the identified sampler X inches with a140 pound hammer falling 30 inches.
ABBREVIATIONSPID - Photoionization Detector
WELL-GRADED GRAVELS,GRAVEL-SAND MIXTURES WITHLITTLE FINES
WELL-GRADED GRAVELS,GRAVEL-SAND MIXTURES WITHLITTLE CLAY FINES
POORLY GRADED GRAVELS,GRAVEL-SAND MIXTURES WITHLITTLE FINES
POORLY GRADED GRAVELS,GRAVEL-SAND MIXTURES WITHLITTLE CLAY FINES
SILTY GRAVELS, GRAVEL-SILT-SANDMIXTURES
CLAYEY GRAVELS,GRAVEL-SAND-CLAY-SILT MIXTURES
WELL-GRADED SANDS,SAND-GRAVEL MIXTURES WITHLITTLE CLAY FINES
POORLY GRADED SANDS,SAND-GRAVEL MIXTURES WITHLITTLE CLAY FINES
SW
SW-SC
POORLY GRADED SANDS,SAND-GRAVEL MIXTURES WITHLITTLE FINES
Cu 4 and/or 1 Cc 3>
>
INORGANIC SILTS AND VERY FINE SANDS, SILTY ORCLAYEY FINE SANDS, SILTS WITH SLIGHT PLASTICITY
ORGANIC CLAYS & ORGANIC SILTS OFMEDIUM-TO-HIGH PLASTICITY
INORGANIC CLAYS OF HIGH PLASTICITY, FATCLAYS
INORGANIC SILTS, MICACEOUS ORDIATOMACEOUS FINE SAND OR SILT
INORGANIC CLAYS-SILTS OF LOW PLASTICITY, GRAVELLYCLAYS, SANDY CLAYS, SILTY CLAYS, LEAN CLAYS
_
SILTY SANDS, SAND-GRAVEL-SILTMIXTURES
CLAYEY SANDS,SAND-GRAVEL-CLAY MIXTURES
SW-SM
CLAYEY SANDS, SAND-SILT-CLAYMIXTURES
CL
CL-ML
>
<
<
SANDSWITH5% TO
12%FINES
SANDSWITH >
12%FINES
WELL-GRADED SANDS,SAND-GRAVEL MIXTURES WITHLITTLE FINES
Cu 4 and/or 1 Cc 3>
CLEANGRAVEL
WITH<5%
FINES
GRAVELSWITH5% TO
12%FINES
OL
CH
CLAYEY GRAVELS,GRAVEL-SAND-CLAY MIXTURES
FIN
E G
RA
INE
D S
OIL
S(H
alf o
r m
ore
of m
ater
ial i
ssm
alle
r th
anth
e #2
00 s
ieve
)
GRAVELSWITH >
12%FINES
>
Cu 4 and1 Cc 3
>_
_
BULK SAMPLE
STANDARD PENETRATION SPLIT SPOON SAMPLER(2 in. (50.8 mm.) outer diameter and 1-3/8 in. (34.9 mm.) innerdiameter)
_
GM
GC
GW
GP
GW-GM
GW-GC
_ _
_
INORGANIC CLAYS OF LOW TO MEDIUM PLASTICITY, GRAVELLYCLAYS, SANDY CLAYS, SILTY CLAYS, LEAN CLAYS
<
SAMPLE/SAMPLER TYPE GRAPHICS
>
<
<
>
CLEANSANDSWITH<5%
FINES
GR
AV
EL
S (
Mor
e th
an h
alf o
f coa
rse
frac
tion
is la
rger
than
the
#4 s
ieve
)
Cu 6 and/or 1 Cc 3
Cu 6 and/or 1 Cc 3
>
Cu 6 and1 Cc 3
SC-SM
Cu 4 and1 Cc 3
< _
ORGANIC SILTS & ORGANIC SILTY CLAYS OFLOW PLASTICITY
SILTS AND CLAYS(Liquid Limitless than 50)
WELL-GRADED SANDS,SAND-GRAVEL MIXTURES WITHLITTLE OR NO FINES
POORLY GRADED SANDS,SAND-GRAVEL MIXTURES WITHLITTLE OR NO FINES
MH
OH
ML
GC-GM
CO
AR
SE
GR
AIN
ED
SO
ILS
(M
ore
than
hal
f of m
ater
ial i
s la
rger
than
the
#200
sie
ve)
UNIFIED SOIL CLASSIFICATION SYSTEM (ASTM D 2487)
<
Cu 6 and1 Cc 3
GP-GM
GP-GC
_
_ _<
>
<
<
>
SP
SP-SM
SP-SC
SM
SC
< _<
>
WELL-GRADED GRAVELS,GRAVEL-SAND MIXTURES WITHLITTLE OR NO FINES
POORLY GRADED GRAVELS,GRAVEL-SAND MIXTURES WITHLITTLE OR NO FINES
SILTS AND CLAYS(Liquid Limit50 or greater)
SA
ND
S (
Hal
f or
mor
e of
coa
rse
frac
tion
is s
mal
ler
than
the
#4 s
ieve
)
NOTE: USE MATERIAL DESCRIPTION ON THE LOG TO DEFINE A GRAPHIC THAT MAY NOT BEPROVIDED ON THIS LEGEND.
GROUND WATER GRAPHICS
OBSERVED SEEPAGE
WATER LEVEL (level after exploration completion)
WATER LEVEL (level where first observed)
WATER LEVEL (additional levels after exploration)
NOTES
gIN
T F
ILE
: K
lf_gi
nt_m
aste
r_20
21
P
RO
JEC
T N
UM
BE
R:
2021
2714
.001
A
O
FF
ICE
FIL
TE
R:
DE
NV
ER
gIN
T T
EM
PLA
TE
: E
:KLF
_ST
AN
DA
RD
_GIN
T_L
IBR
AR
Y_2
021
.GLB
[_
_KLF
_GE
O-L
EG
1 (G
RA
PH
ICS
KE
Y)
WIT
H U
SC
S]
PLO
TT
ED
: 01
/07/
202
1 0
3:5
5 P
M B
Y:
MP
alm
er
DATE: 12/30/2020
CHECKED BY: BB
DRAWN BY: MG
20212714.001A
PROJECT NO.:

A-2
SOIL DESCRIPTION KEYFIGURE
CALIFORNIASAMPLER(# blows/ft)
MODIFIED CASAMPLER(# blows/ft)
SPT-N60
(# blows/ft)
Union Ridge Solar ProjectLicking County, OH
DESCRIPTION FIELD TEST
PP < 0.25
Medium Stiff
0.25 PP <0.5
30 - 50
10 - 30
4 - 10
<4
>60
35 - 60
12 - 35
5 - 12
<4
>70
40 - 70
15 - 40
5 - 15
CONSISTENCY
<2
Moist
DESCRIPTION
Strongly
FIELD TEST
>30
Very Soft
PI
NP
Either the LL or the PI (orboth) may be used todescribe the soil plasticity.The ranges of numbersshown here do not implythat the LL rangescorrelate with the PIranges for all soils.
DESCRIPTION
Damp but novisible water
Boulders
Cobbles
coarse
fineGravel
Sand
Fines
GRAIN SIZE
>12 in. (304.8 mm.)
3 - 12 in. (76.2 - 304.8 mm.) Fist-sized to basketball-sized
3/4 -3 in. (19 - 76.2 mm.) Thumb-sized to fist-sized
0.19 - 0.75 in. (4.8 - 19 mm.) Pea-sized to thumb-sized
0.079 - 0.19 in. (2 - 4.9 mm.)#10 - #4
0.017 - 0.079 in. (0.43 - 2 mm.)
#200 - #40
coarse
fine
medium
SIEVE SIZE APPROXIMATE SIZE
Larger than basketball-sized>12 in. (304.8 mm.)
3 - 12 in. (76.2 - 304.8 mm.)
3/4 -3 in. (19 - 76.2 mm.)
#4 - 3/4 in. (#4 - 19 mm.)
Rock salt-sized to pea-sized
#40 - #10 Sugar-sized to rock salt-sized
0.0029 - 0.017 in. (0.07 - 0.43 mm.) Flour-sized to sugar-sized
Passing #200 <0.0029 in. (<0.07 mm.) Flour-sized and smaller
DESCRIPTION
SecondaryConstituent isFine Grained
SecondaryConstituent is
Coarse Grained
SPT - N60
(# blows / ft)
Soft
Stiff
Very Stiff
Hard
2 - 4
4 - 8
8 - 15
15 - 30
WeaklyCrumbles or breakswith handling or slightfinger pressure
Crumbles or breakswith considerable fingerpressure
UNCONFINEDCOMPRESSIVE
STRENGTH (Qu)(psf)VISUAL / MANUAL CRITERIA
<500
0.5 PP <1
1 PP <2
2 PP <4
4 PP >8000
4000 - 8000
500 - 1000
1000 - 2000
2000 - 4000
Dry
WetVisible free water,usually soil is belowwater table
Thumb will penetrate more than 1 inch (25 mm). Extrudesbetween fingers when squeezed.
Thumb will penetrate soil about 1 inch (25 mm).Remolded by light finger pressure.
Thumb will penetrate soil about 1/4 inch (6 mm).Remolded by strong finger pressure.
Can be imprinted with considerable pressure from thumb.
Thumb will not indent soil but readily indented withthumbnail.
Thumbnail will not indent soil.
DESCRIPTION
Alternating layers of varying material or color with the layerless than 1/4-in. thick, note thickness.
15 - 25
> 25
FIELD TEST
Absence ofmoisture, dusty,dry to the touch
Moderately
Will not crumble orbreak with fingerpressure
Pocket Pen(tsf)
Termof
Use
<5%
With
Modifier
5 to <15%
15%
Trace <15%
15 to <30%
30%
AMOUNT
Fissured
Slickensided
Blocky
Lensed
CRITERIA
Stratified
Laminated
Fracture planes appear polished or glossy, sometimes striated.
Alternating layers of varying material or color with layers atleast 1/4-in. thick, note thickness.
Breaks along definite planes of fracture withlittle resistance to fracturing.
Cohesive soil that can be broken down into small angular lumpswhich resist further breakdown.Inclusion of small pockets of different soils, such as small lensesof sand scattered through a mass of clay; note thickness.
None
Weak
Strong
No visible reaction
RELATIVEDENSITY
(%)
APPARENTDENSITY
Some reaction,with bubblesforming slowly
Violent reaction,with bubblesformingimmediately
85 - 100
65 - 85
35 - 65
15 - 35
<5 0 - 15
Very Dense
Dense
Medium Dense
>50
Loose
Very Loose
FROM TERZAGHI AND PECK, 1948
DESCRIPTION
Non-Plastic NP
LL
Low < 30
Medium 30 - 50
High > 50
LL is from Casagrande, 1948. PI is from Holtz , 1959.
< 15
Rounded
SubroundedParticles have nearly plane sides but have well-rounded corners andedges.
AngularParticles have sharp edges and relatively plane sides with unpolishedsurfaces.
Subangular
Particles have smoothly curved sides and no edges.
Particles are similar to angular description but have rounded edges.
DESCRIPTION CRITERIA
MOISTURE CONTENT
CONSISTENCY - FINE-GRAINED SOIL REACTION WITHHYDROCHLORIC ACID
STRUCTURE
SECONDARY CONSTITUENT CEMENTATION
APPARENT / RELATIVE DENSITY - COARSE-GRAINED SOIL
GRAIN SIZE
PLASTICITY
ANGULARITY
gIN
T F
ILE
: K
lf_gi
nt_m
aste
r_20
21
P
RO
JEC
T N
UM
BE
R:
2021
2714
.001
A
O
FF
ICE
FIL
TE
R:
DE
NV
ER
gIN
T T
EM
PLA
TE
: E
:KLF
_ST
AN
DA
RD
_GIN
T_L
IBR
AR
Y_2
021
.GLB
[_
KLF
_GE
O-L
EG
2 (
SO
IL D
ES
C K
EY
)]P
LOT
TE
D:
01/0
7/20
21
03
:55
PM
BY
: M
Pal
mer
DATE: 12/30/2020
CHECKED BY: BB
DRAWN BY: MG
20212714.001A
PROJECT NO.:

92 65
TOPSOIL
Sandy Lean CLAY (CL): low plasticity, olive yellow,moist, medium stiff to stiff, trace gravel
Gravelly Lean CLAY (CL): low plasticity, gray,moist, stiff
The boring was terminated at approximately 15 ft.below ground surface. The boring was backfilledwith auger cuttings on December 07, 2020.
24"
18"
16"
12"
24"
CL 17.8
BC=1233
BC=47812
BC=1091311
BC=4766
BC=5888
31 13
Groundwater was not observed during drilling or aftercompletion.GENERAL NOTES:A iPad integrated GPS unit was used to locate the explorationwith an accuracy of 5 meters.Caving was observed at a depth of 11 ft. below ground surface.
GROUNDWATER LEVEL INFORMATION:
1 of 1
FIELD EXPLORATION
BORING
B-1
LABORATORY RESULTS
Lithologic Description
BORING LOG B-1
PAGE:
BORING LOG B-1
Dry
Uni
t Wt.
(pcf
)
Pas
sing
#4
(%)
Pas
sing
#20
0 (%
)
Latitude: 39.99093°Longitude: -82.63680°
Surface Condition: Bare Earth
WGS 1984 - Not Available
Terra TestingDrilling Company:
Drilling Method:
Drilling Equipment:
30°F Snow Exploration Diameter:
Hammer Type - Drop: 140 lb. Automatic - 30 in.
Logged By:
Date Begin - End:
Hor.-Vert. Datum:
Weather:
Drill Crew:
Geoprobe 7822DT
3.25 in. I.D.
M. Glassmeyer
Hollow Stem AugerPlunge: -90 degrees
J. Winters
12/07/2020
Dep
th (
feet
)
5
10
15
20
25
30
Gra
phic
al L
og
Rec
over
y(N
R=
No
Rec
over
y)
US
CS
Sym
bol
Wat
erC
onte
nt (
%)
Blo
w C
ount
s(B
C)=
Unc
orr
Blo
ws/
6 in
.
Liqu
id L
imit
Add
ition
al T
ests
/R
emar
ks
Pla
stic
ity I
ndex
(NP
=N
onP
last
ic)
Union Ridge Solar ProjectLicking County, OH
PLO
TT
ED
: 01
/14/
202
1 0
1:1
4 P
M B
Y:
MP
alm
er
gIN
T F
ILE
: K
lf_gi
nt_m
aste
r_20
21
P
RO
JEC
T N
UM
BE
R:
2021
2714
.001
A
O
FF
ICE
FIL
TE
R:
DE
NV
ER
gIN
T T
EM
PLA
TE
: E
:KLF
_ST
AN
DA
RD
_GIN
T_L
IBR
AR
Y_2
021
.GLB
[_
_KLF
_BO
RIN
G/T
ES
T P
IT S
OIL
LO
G]
DATE: 12/30/2020
CHECKED BY: BB
DRAWN BY: MG
PROJECT NO.:
20212714.001A
Sam
ple
Typ
e

85 65
TOPSOIL
Sandy Lean CLAY (CL): low plasticity, olive yellow,moist, stiff
Lean CLAY (CL): low plasticity, light brownish gray,moist, very stiff, trace sand
Gravelly Lean CLAY (CL): low plasticity, gray,moist, stiff, trace sand
The boring was terminated at approximately 15 ft.below ground surface. The boring was backfilledwith auger cuttings on December 07, 2020.
12"
24"
14"
24"
24"
CL 13.1
BC=1235
BC=2545
BC=7788
BC=7101211
BC=3478
27 10
Groundwater was not observed during drilling or aftercompletion.GENERAL NOTES:A iPad integrated GPS unit was used to locate the explorationwith an accuracy of 5 meters.Caving was observed at a depth of 9.5 ft. below ground surface.
GROUNDWATER LEVEL INFORMATION:
1 of 1
FIELD EXPLORATION
BORING
B-2
LABORATORY RESULTS
Lithologic Description
BORING LOG B-2
PAGE:
BORING LOG B-2
Dry
Uni
t Wt.
(pcf
)
Pas
sing
#4
(%)
Pas
sing
#20
0 (%
)
Latitude: 39.98305°Longitude: -82.63382°
Surface Condition: Bare Earth
WGS 1984 - Not Available
Terra TestingDrilling Company:
Drilling Method:
Drilling Equipment:
30°F Snow Exploration Diameter:
Hammer Type - Drop: 140 lb. Automatic - 30 in.
Logged By:
Date Begin - End:
Hor.-Vert. Datum:
Weather:
Drill Crew:
Geoprobe 7822DT
3.25 in. I.D.
M. Glassmeyer
Hollow Stem AugerPlunge: -90 degrees
J. Winters
12/07/2020
Dep
th (
feet
)
5
10
15
20
25
30
Gra
phic
al L
og
Rec
over
y(N
R=
No
Rec
over
y)
US
CS
Sym
bol
Wat
erC
onte
nt (
%)
Blo
w C
ount
s(B
C)=
Unc
orr
Blo
ws/
6 in
.
Liqu
id L
imit
Add
ition
al T
ests
/R
emar
ks
Pla
stic
ity I
ndex
(NP
=N
onP
last
ic)
Union Ridge Solar ProjectLicking County, OH
PLO
TT
ED
: 01
/14/
202
1 0
1:1
5 P
M B
Y:
MP
alm
er
gIN
T F
ILE
: K
lf_gi
nt_m
aste
r_20
21
P
RO
JEC
T N
UM
BE
R:
2021
2714
.001
A
O
FF
ICE
FIL
TE
R:
DE
NV
ER
gIN
T T
EM
PLA
TE
: E
:KLF
_ST
AN
DA
RD
_GIN
T_L
IBR
AR
Y_2
021
.GLB
[_
_KLF
_BO
RIN
G/T
ES
T P
IT S
OIL
LO
G]
DATE: 12/30/2020
CHECKED BY: BB
DRAWN BY: MG
PROJECT NO.:
20212714.001A
Sam
ple
Typ
e

68 31
TOPSOIL
Silty, Clayey SAND with Gravel (SC-SM): lowplasticity, yellow, moist to wet, loose
Lean CLAY (CL): low plasticity, olive yellow, moist,stiff, trace sand and gravel
Lean CLAY with Gravel (CL): low plasticity, gray,moist, stiff, trace sand
The boring was terminated at approximately 15 ft.below ground surface. The boring was backfilledwith auger cuttings on December 08, 2020.
8"
14"
12"
24"
13"
SC-SM 19.9
BC=1224
BC=4234
BC=4467
BC=5678
BC=6777
23 5
Groundwater was not observed during drilling or aftercompletion.GENERAL NOTES:A iPad integrated GPS unit was used to locate the explorationwith an accuracy of 5 meters.Caving was observed at a depth of 9.5 ft. below ground surface.
GROUNDWATER LEVEL INFORMATION:
1 of 1
FIELD EXPLORATION
BORING
B-3
LABORATORY RESULTS
Lithologic Description
BORING LOG B-3
PAGE:
BORING LOG B-3
Dry
Uni
t Wt.
(pcf
)
Pas
sing
#4
(%)
Pas
sing
#20
0 (%
)
Latitude: 39.98436°Longitude: -82.64116°
Surface Condition: Bare Earth
WGS 1984 - Not Available
Terra TestingDrilling Company:
Drilling Method:
Drilling Equipment:
30°F Snow Exploration Diameter:
Hammer Type - Drop: 140 lb. Automatic - 30 in.
Logged By:
Date Begin - End:
Hor.-Vert. Datum:
Weather:
Drill Crew:
Geoprobe 7822DT
3.25 in. I.D.
M. Glassmeyer
Hollow Stem AugerPlunge: -90 degrees
J. Winters
12/08/2020
Dep
th (
feet
)
5
10
15
20
25
30
Gra
phic
al L
og
Rec
over
y(N
R=
No
Rec
over
y)
US
CS
Sym
bol
Wat
erC
onte
nt (
%)
Blo
w C
ount
s(B
C)=
Unc
orr
Blo
ws/
6 in
.
Liqu
id L
imit
Add
ition
al T
ests
/R
emar
ks
Pla
stic
ity I
ndex
(NP
=N
onP
last
ic)
Union Ridge Solar ProjectLicking County, OH
PLO
TT
ED
: 01
/14/
202
1 0
1:1
5 P
M B
Y:
MP
alm
er
gIN
T F
ILE
: K
lf_gi
nt_m
aste
r_20
21
P
RO
JEC
T N
UM
BE
R:
2021
2714
.001
A
O
FF
ICE
FIL
TE
R:
DE
NV
ER
gIN
T T
EM
PLA
TE
: E
:KLF
_ST
AN
DA
RD
_GIN
T_L
IBR
AR
Y_2
021
.GLB
[_
_KLF
_BO
RIN
G/T
ES
T P
IT S
OIL
LO
G]
DATE: 12/30/2020
CHECKED BY: BB
DRAWN BY: MG
PROJECT NO.:
20212714.001A
Sam
ple
Typ
e

98 75
TOPSOIL
Lean CLAY with Sand (CL): low plasticity, oliveyellow, moist, soft to stiff, trace gravel
SAND (SW): fine to medium-grained, subangular,gray, moist, loose, trace gravel
The boring was terminated at approximately 15 ft.below ground surface. The boring was backfilledwith auger cuttings on December 08, 2020.
24"
24"
24"
9"
4"
CL 17.5
BC=WOH123
BC=2545
BC=3455
BC=7101010
BC=2545
29 12
Groundwater was not observed during drilling or aftercompletion.GENERAL NOTES:A iPad integrated GPS unit was used to locate the explorationwith an accuracy of 5 meters.Caving was observed at a depth of 11.5 ft. below ground surface.
GROUNDWATER LEVEL INFORMATION:
1 of 1
FIELD EXPLORATION
BORING
B-4
LABORATORY RESULTS
Lithologic Description
BORING LOG B-4
PAGE:
BORING LOG B-4
Dry
Uni
t Wt.
(pcf
)
Pas
sing
#4
(%)
Pas
sing
#20
0 (%
)
Latitude: 39.98280°Longitude: -82.65016°
Surface Condition: Bare Earth
WGS 1984 - Not Available
Terra TestingDrilling Company:
Drilling Method:
Drilling Equipment:
30°F Snow Exploration Diameter:
Hammer Type - Drop: 140 lb. Automatic - 30 in.
Logged By:
Date Begin - End:
Hor.-Vert. Datum:
Weather:
Drill Crew:
Geoprobe 7822DT
3.25 in. I.D.
M. Glassmeyer
Hollow Stem AugerPlunge: -90 degrees
J. Winters
12/08/2020
Dep
th (
feet
)
5
10
15
20
25
30
Gra
phic
al L
og
Rec
over
y(N
R=
No
Rec
over
y)
US
CS
Sym
bol
Wat
erC
onte
nt (
%)
Blo
w C
ount
s(B
C)=
Unc
orr
Blo
ws/
6 in
.
Liqu
id L
imit
Add
ition
al T
ests
/R
emar
ks
Pla
stic
ity I
ndex
(NP
=N
onP
last
ic)
Union Ridge Solar ProjectLicking County, OH
PLO
TT
ED
: 01
/14/
202
1 0
1:1
5 P
M B
Y:
MP
alm
er
gIN
T F
ILE
: K
lf_gi
nt_m
aste
r_20
21
P
RO
JEC
T N
UM
BE
R:
2021
2714
.001
A
O
FF
ICE
FIL
TE
R:
DE
NV
ER
gIN
T T
EM
PLA
TE
: E
:KLF
_ST
AN
DA
RD
_GIN
T_L
IBR
AR
Y_2
021
.GLB
[_
_KLF
_BO
RIN
G/T
ES
T P
IT S
OIL
LO
G]
DATE: 12/30/2020
CHECKED BY: BB
DRAWN BY: MG
PROJECT NO.:
20212714.001A
Sam
ple
Typ
e

97 60
TOPSOIL
Sandy Lean CLAY (CL): low plasticity, reddishyellow, moist, soft to stiff, trace gravel
The boring was terminated at approximately 15 ft.below ground surface. The boring was backfilledwith auger cuttings on December 07, 2020.
16"
18"
24"
16"
24"
CL 19.7
BC=1233
BC=2677
BC=3557
BC=7779
BC=4876
35 18
Groundwater was not observed during drilling or aftercompletion.GENERAL NOTES:A iPad integrated GPS unit was used to locate the explorationwith an accuracy of 5 meters.Caving was observed at a depth of 11 ft. below ground surface.
GROUNDWATER LEVEL INFORMATION:
1 of 1
FIELD EXPLORATION
BORING
B-5
LABORATORY RESULTS
Lithologic Description
BORING LOG B-5
PAGE:
BORING LOG B-5
Dry
Uni
t Wt.
(pcf
)
Pas
sing
#4
(%)
Pas
sing
#20
0 (%
)
Latitude: 39.97513°Longitude: -82.64059°
Surface Condition: Bare Earth
WGS 1984 - Not Available
Terra TestingDrilling Company:
Drilling Method:
Drilling Equipment:
30°F Snow Exploration Diameter:
Hammer Type - Drop: 140 lb. Automatic - 30 in.
Logged By:
Date Begin - End:
Hor.-Vert. Datum:
Weather:
Drill Crew:
Geoprobe 7822DT
3.25 in. I.D.
M. Glassmeyer
Hollow Stem AugerPlunge: -90 degrees
J. Winters
12/07/2020
Dep
th (
feet
)
5
10
15
20
25
30
Gra
phic
al L
og
Rec
over
y(N
R=
No
Rec
over
y)
US
CS
Sym
bol
Wat
erC
onte
nt (
%)
Blo
w C
ount
s(B
C)=
Unc
orr
Blo
ws/
6 in
.
Liqu
id L
imit
Add
ition
al T
ests
/R
emar
ks
Pla
stic
ity I
ndex
(NP
=N
onP
last
ic)
Union Ridge Solar ProjectLicking County, OH
PLO
TT
ED
: 01
/14/
202
1 0
1:1
5 P
M B
Y:
MP
alm
er
gIN
T F
ILE
: K
lf_gi
nt_m
aste
r_20
21
P
RO
JEC
T N
UM
BE
R:
2021
2714
.001
A
O
FF
ICE
FIL
TE
R:
DE
NV
ER
gIN
T T
EM
PLA
TE
: E
:KLF
_ST
AN
DA
RD
_GIN
T_L
IBR
AR
Y_2
021
.GLB
[_
_KLF
_BO
RIN
G/T
ES
T P
IT S
OIL
LO
G]
DATE: 12/30/2020
CHECKED BY: BB
DRAWN BY: MG
PROJECT NO.:
20212714.001A
Sam
ple
Typ
e
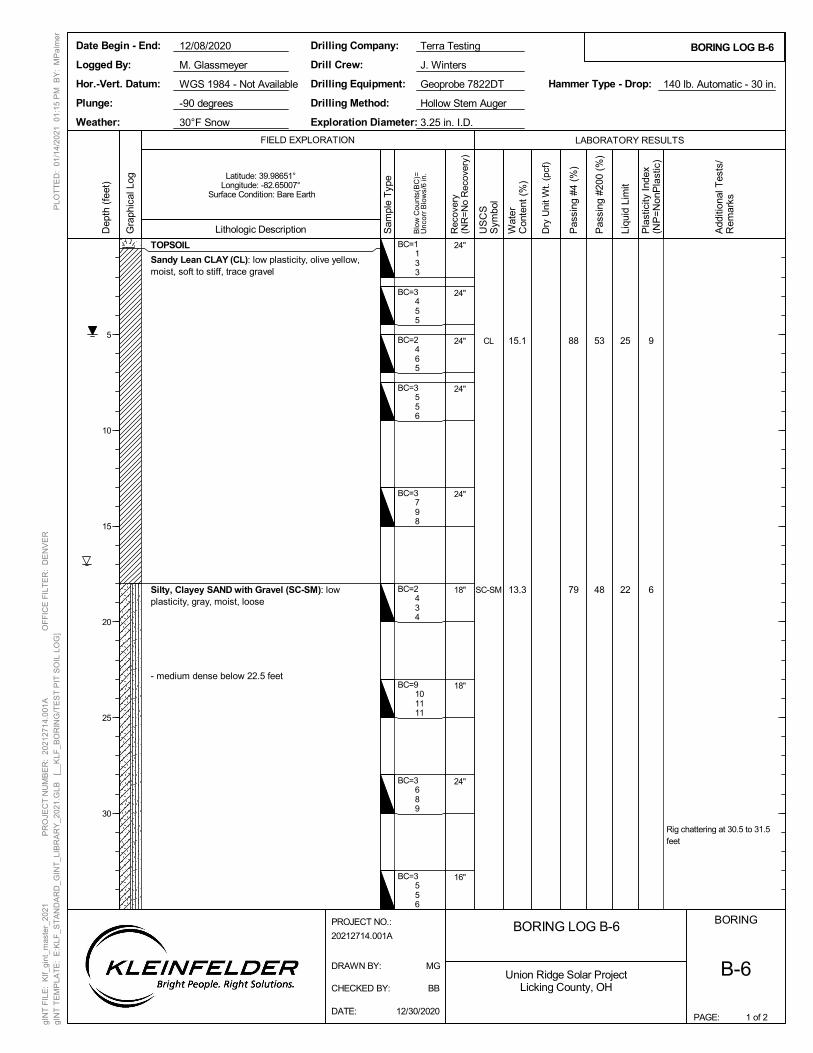
88
79
53
48
TOPSOIL
Sandy Lean CLAY (CL): low plasticity, olive yellow,moist, soft to stiff, trace gravel
Silty, Clayey SAND with Gravel (SC-SM): lowplasticity, gray, moist, loose
- medium dense below 22.5 feet
24"
24"
24"
24"
24"
18"
18"
24"
16"
CL
SC-SM
15.1
13.3
BC=1133
BC=3455
BC=2465
BC=3556
BC=3798
BC=2434
BC=9101111
BC=3689
BC=3556
25
22
Rig chattering at 30.5 to 31.5feet
9
6
1 of 2
FIELD EXPLORATION
BORING
B-6
LABORATORY RESULTS
Lithologic Description
BORING LOG B-6
PAGE:
BORING LOG B-6
Dry
Uni
t Wt.
(pcf
)
Pas
sing
#4
(%)
Pas
sing
#20
0 (%
)
Latitude: 39.98651°Longitude: -82.65007°
Surface Condition: Bare Earth
WGS 1984 - Not Available
Terra TestingDrilling Company:
Drilling Method:
Drilling Equipment:
30°F Snow Exploration Diameter:
Hammer Type - Drop: 140 lb. Automatic - 30 in.
Logged By:
Date Begin - End:
Hor.-Vert. Datum:
Weather:
Drill Crew:
Geoprobe 7822DT
3.25 in. I.D.
M. Glassmeyer
Hollow Stem AugerPlunge: -90 degrees
J. Winters
12/08/2020
Dep
th (
feet
)
5
10
15
20
25
30
Gra
phic
al L
og
Rec
over
y(N
R=
No
Rec
over
y)
US
CS
Sym
bol
Wat
erC
onte
nt (
%)
Blo
w C
ount
s(B
C)=
Unc
orr
Blo
ws/
6 in
.
Liqu
id L
imit
Add
ition
al T
ests
/R
emar
ks
Pla
stic
ity I
ndex
(NP
=N
onP
last
ic)
Union Ridge Solar ProjectLicking County, OH
PLO
TT
ED
: 01
/14/
202
1 0
1:1
5 P
M B
Y:
MP
alm
er
gIN
T F
ILE
: K
lf_gi
nt_m
aste
r_20
21
P
RO
JEC
T N
UM
BE
R:
2021
2714
.001
A
O
FF
ICE
FIL
TE
R:
DE
NV
ER
gIN
T T
EM
PLA
TE
: E
:KLF
_ST
AN
DA
RD
_GIN
T_L
IBR
AR
Y_2
021
.GLB
[_
_KLF
_BO
RIN
G/T
ES
T P
IT S
OIL
LO
G]
DATE: 12/30/2020
CHECKED BY: BB
DRAWN BY: MG
PROJECT NO.:
20212714.001A
Sam
ple
Typ
e

82 48
Silty, Clayey SAND with Gravel (SC-SM): lowplasticity, gray, moist, medium dense
- dense below 42.5 feet
Sandy Lean CLAY (CL): low plasticity, gray, moist,stiff
The boring was terminated at approximately 50 ft.below ground surface. The boring was backfilledwith auger cuttings on December 08, 2020.
18"
24"
24"
SC-SM 11.9BC=571011
BC=8102530
BC=46811
22 7
Groundwater was observed at approximately 17 ft. below groundsurface during drilling.
Groundwater was observed at approximately 5 ft. below groundsurface at the end of drilling.GENERAL NOTES:A iPad integrated GPS unit was used to locate the explorationwith an accuracy of 5 meters.Caving was observed at a depth of 35 ft. below ground surface.
GROUNDWATER LEVEL INFORMATION:
2 of 2
FIELD EXPLORATION
BORING
B-6
LABORATORY RESULTS
Lithologic Description
BORING LOG B-6
PAGE:
BORING LOG B-6
Dry
Uni
t Wt.
(pcf
)
Pas
sing
#4
(%)
Pas
sing
#20
0 (%
)
Latitude: 39.98651°Longitude: -82.65007°
Surface Condition: Bare Earth
WGS 1984 - Not Available
Terra TestingDrilling Company:
Drilling Method:
Drilling Equipment:
30°F Snow Exploration Diameter:
Hammer Type - Drop: 140 lb. Automatic - 30 in.
Logged By:
Date Begin - End:
Hor.-Vert. Datum:
Weather:
Drill Crew:
Geoprobe 7822DT
3.25 in. I.D.
M. Glassmeyer
Hollow Stem AugerPlunge: -90 degrees
J. Winters
12/08/2020
Dep
th (
feet
)
40
45
50
55
60
65
Gra
phic
al L
og
Rec
over
y(N
R=
No
Rec
over
y)
US
CS
Sym
bol
Wat
erC
onte
nt (
%)
Blo
w C
ount
s(B
C)=
Unc
orr
Blo
ws/
6 in
.
Liqu
id L
imit
Add
ition
al T
ests
/R
emar
ks
Pla
stic
ity I
ndex
(NP
=N
onP
last
ic)
Union Ridge Solar ProjectLicking County, OH
PLO
TT
ED
: 01
/14/
202
1 0
1:1
5 P
M B
Y:
MP
alm
er
gIN
T F
ILE
: K
lf_gi
nt_m
aste
r_20
21
P
RO
JEC
T N
UM
BE
R:
2021
2714
.001
A
O
FF
ICE
FIL
TE
R:
DE
NV
ER
gIN
T T
EM
PLA
TE
: E
:KLF
_ST
AN
DA
RD
_GIN
T_L
IBR
AR
Y_2
021
.GLB
[_
_KLF
_BO
RIN
G/T
ES
T P
IT S
OIL
LO
G]
DATE: 12/30/2020
CHECKED BY: BB
DRAWN BY: MG
PROJECT NO.:
20212714.001A
Sam
ple
Typ
e

93 70
TOPSOIL
Lean CLAY with Sand (CL): olive yellow, moist
The test pit was terminated at approximately 8 ft. below ground surface.The test pit was backfilled with excavated material on December 09,2020.
CL 19.2 32 ASTM D698 Method B=Max. Dry Unit Wt.: 114.5 pcfOpt. Water Content: 12.9%
14
Groundwater was not observed during excavation or aftercompletion.GENERAL NOTES:A iPad integrated GPS unit was used to locate the explorationwith an accuracy of 5 meters.
GROUNDWATER LEVEL INFORMATION:
1 of 1
FIELD EXPLORATION
TEST PIT
TP-1
LABORATORY RESULTS
Lithologic Description
TEST PIT LOG TP-1
PAGE:
TEST PIT LOG TP-1
Dry
Uni
t Wt.
(pcf
)
Pas
sing
#4
(%)
Pas
sing
#20
0 (%
)
Latitude: 39.98551°Longitude: -82.63565°
Surface Condition: Bare Earth
WGS 1984 - Not Available
Terra TestingExcavation Company:
Excavation Equip.:
45°F Clear
Excav. Dimensions:
Logged By:
Date Begin - End:
Hor.-Vert. Datum:
Weather:
Excavation Crew:
John Deere 35G Excavator
3x12 ft
M. Glassmeyer
Plunge: -90 degrees
J. Winters
12/09/2020
Dep
th (
feet
)
5
10
15
Gra
phic
al L
og
US
CS
Sym
bol
Wat
erC
onte
nt (
%)
Liqu
id L
imit
Add
ition
al T
ests
/R
emar
ks
Pla
stic
ity I
ndex
(NP
=N
onP
last
ic)
Union Ridge Solar ProjectLicking County, OH
PLO
TT
ED
: 01
/14/
202
1 0
1:1
7 P
M B
Y:
MP
alm
er
gIN
T F
ILE
: K
lf_gi
nt_m
aste
r_20
21
P
RO
JEC
T N
UM
BE
R:
2021
2714
.001
A
O
FF
ICE
FIL
TE
R:
DE
NV
ER
gIN
T T
EM
PLA
TE
: E
:KLF
_ST
AN
DA
RD
_GIN
T_L
IBR
AR
Y_2
021
.GLB
[_
_KLF
_BO
RIN
G/T
ES
T P
IT S
OIL
LO
G]
DATE: 12/30/2020
CHECKED BY: BB
DRAWN BY: MG
PROJECT NO.:
20212714.001A
Sam
ple
Typ
e

89 51
TOPSOIL
Sandy Lean CLAY (CL): yellowish brown, moist, trace gravel
Lean CLAY with Sand (CL): light brownish gray, moist, trace gravel
The test pit was terminated at approximately 8 ft. below ground surface.The test pit was backfilled with excavated material on December 09,2020.
CL 22.9 31 ASTM D698 Method B=Max. Dry Unit Wt.: 111.4 pcfOpt. Water Content: 13.3%
13
Groundwater was not observed during excavation or aftercompletion.GENERAL NOTES:A iPad integrated GPS unit was used to locate the explorationwith an accuracy of 5 meters.
GROUNDWATER LEVEL INFORMATION:
1 of 1
FIELD EXPLORATION
TEST PIT
TP-2
LABORATORY RESULTS
Lithologic Description
TEST PIT LOG TP-2
PAGE:
TEST PIT LOG TP-2
Dry
Uni
t Wt.
(pcf
)
Pas
sing
#4
(%)
Pas
sing
#20
0 (%
)
Latitude: 39.98142°Longitude: -82.64682°
Surface Condition: Bare Earth
WGS 1984 - Not Available
Terra TestingExcavation Company:
Excavation Equip.:
45°F Clear
Excav. Dimensions:
Logged By:
Date Begin - End:
Hor.-Vert. Datum:
Weather:
Excavation Crew:
John Deere 35G Excavator
3x12 ft
M. Glassmeyer
Plunge: -90 degrees
J. Winters
12/09/2020
Dep
th (
feet
)
5
10
15
Gra
phic
al L
og
US
CS
Sym
bol
Wat
erC
onte
nt (
%)
Liqu
id L
imit
Add
ition
al T
ests
/R
emar
ks
Pla
stic
ity I
ndex
(NP
=N
onP
last
ic)
Union Ridge Solar ProjectLicking County, OH
PLO
TT
ED
: 01
/14/
202
1 0
1:1
7 P
M B
Y:
MP
alm
er
gIN
T F
ILE
: K
lf_gi
nt_m
aste
r_20
21
P
RO
JEC
T N
UM
BE
R:
2021
2714
.001
A
O
FF
ICE
FIL
TE
R:
DE
NV
ER
gIN
T T
EM
PLA
TE
: E
:KLF
_ST
AN
DA
RD
_GIN
T_L
IBR
AR
Y_2
021
.GLB
[_
_KLF
_BO
RIN
G/T
ES
T P
IT S
OIL
LO
G]
DATE: 12/30/2020
CHECKED BY: BB
DRAWN BY: MG
PROJECT NO.:
20212714.001A
Sam
ple
Typ
e

20212714.001A/DEN21R120804_rev2 January 29, 2021 © 2020 Kleinfelder www.kleinfelder.com
APPENDIX B.
FIELD TESTING: RESISTIVITY TESTING RESULTS

707 17th Street; Suite 3000
Denver, CO 80202
Tel: (303) 237-6601
Fax: (303) 237-6602
Checked by
JAC/ADT/JB
Reading R Notes:
(Ω)
17.90
6.08
2.83
1.33
0.89
0.55
16.90
6.17
2.75
1.28
0.84
0.52
30 6 48
50 6 50
10 6 53
20 6 49
FIELD ELECTRICAL RESISTIVITY TESTING
Project Number Project Name Client
20212714.001A Union Ridge Solar Project Leeward Energy
Date and Time Location Coordinates
1/13/2021 Licking County, OH ER-1
Type of Test Weather Surface Conditions
4-Point Test (Wenner) Sunny, 40°F Moist Soil
Equipment Make Model Test Engineer(s)
L&R Ultra MiniRes Ultra MiniRes - SN-302 Akhil Katari
5 6 59
Probe Spacing "A" Probe depth "B" Resistivity r (calc.)
(feet) (inches) (Ω-m)
North - South
2 6 75
10 6 54
20 6 51
30 6 51
50 6 53
East-West
2 6 71
5 6 60

707 17th Street; Suite 3000
Denver, CO 80202
Tel: (303) 237-6601
Fax: (303) 237-6602
Checked by
JAC/ADT/JB
Reading R Notes:
(Ω)
14.50
6.61
2.88
1.57
0.99
0.71
15.60
5.83
2.73
1.68
1.06
0.7550 6 72
20 6 64
30 6 61
5 6 57
10 6 53
East-West
2 6 66
30 6 57
50 6 68
10 6 55
20 6 60
North - South
2 6 61
5 6 64
Probe Spacing "A" Probe depth "B" Resistivity r (calc.)
(feet) (inches) (Ω-m)
Equipment Make Model Test Engineer(s)
L&R Ultra MiniRes Ultra MiniRes - SN-302 Akhil Katari
Type of Test Weather Surface Conditions
4-Point Test (Wenner) Sunny, 43°F Moist Soil
Date and Time Location Coordinates
1/13/2021 Licking County, OH ER-2
FIELD ELECTRICAL RESISTIVITY TESTING
Project Number Project Name Client
20212714.001A Union Ridge Solar Project Leeward Energy

707 17th Street; Suite 3000
Denver, CO 80202
Tel: (303) 237-6601
Fax: (303) 237-6602
Checked by
JAC/ADT/JB
Reading R Notes:
(Ω)
25.80
6.75
3.04
1.30
0.94
0.69
28.90
7.06
3.11
1.43
1.02
0.6850 6 65
20 6 55
30 6 58
5 6 69
10 6 60
East-West
2 6 122
30 6 54
50 6 66
10 6 59
20 6 50
North - South
2 6 109
5 6 66
Probe Spacing "A" Probe depth "B" Resistivity r (calc.)
(feet) (inches) (Ω-m)
Equipment Make Model Test Engineer(s)
L&R Ultra MiniRes Ultra MiniRes - SN-302 Akhil Katari
Type of Test Weather Surface Conditions
4-Point Test (Wenner) Sunny, 45°F Moist Soil
Date and Time Location Coordinates
1/13/2021 Licking County, OH ER-3
FIELD ELECTRICAL RESISTIVITY TESTING
Project Number Project Name Client
20212714.001A Union Ridge Solar Project Leeward Energy

20212714.001A/DEN21R120804_rev2 January 29, 2021 © 2020 Kleinfelder www.kleinfelder.com
APPENDIX C.
LABORATORY TEST RESULTS: INDEX TESTING
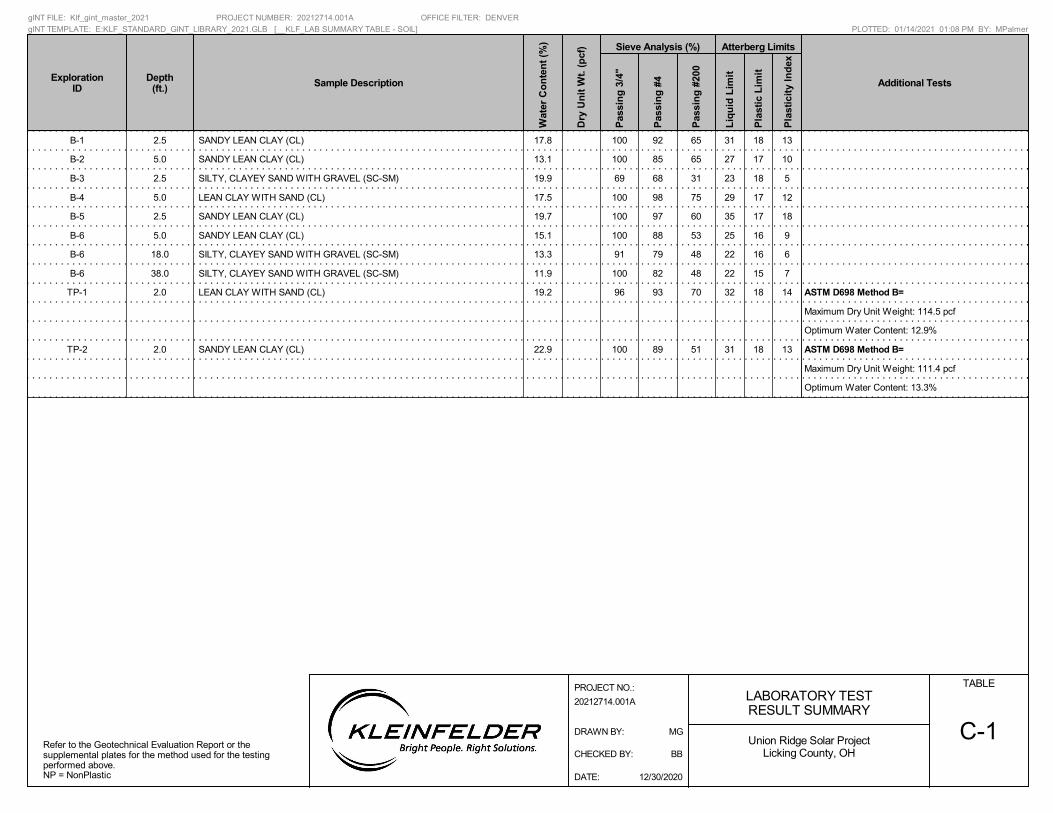
B-1 2.5 SANDY LEAN CLAY (CL) 17.8 100 92 65 31 18 13
B-2 5.0 SANDY LEAN CLAY (CL) 13.1 100 85 65 27 17 10
B-3 2.5 SILTY, CLAYEY SAND WITH GRAVEL (SC-SM) 19.9 69 68 31 23 18 5
B-4 5.0 LEAN CLAY WITH SAND (CL) 17.5 100 98 75 29 17 12
B-5 2.5 SANDY LEAN CLAY (CL) 19.7 100 97 60 35 17 18
B-6 5.0 SANDY LEAN CLAY (CL) 15.1 100 88 53 25 16 9
B-6 18.0 SILTY, CLAYEY SAND WITH GRAVEL (SC-SM) 13.3 91 79 48 22 16 6
B-6 38.0 SILTY, CLAYEY SAND WITH GRAVEL (SC-SM) 11.9 100 82 48 22 15 7
TP-1 2.0 LEAN CLAY WITH SAND (CL) 19.2 96 93 70 32 18 14 ASTM D698 Method B=
Maximum Dry Unit Weight: 114.5 pcf
Optimum Water Content: 12.9%
TP-2 2.0 SANDY LEAN CLAY (CL) 22.9 100 89 51 31 18 13 ASTM D698 Method B=
Maximum Dry Unit Weight: 111.4 pcf
Optimum Water Content: 13.3%
Pas
sin
g 3
/4"
Sieve Analysis (%)
Pas
sin
g #
4
Pas
sin
g #
200
C-1
TABLE
Pla
stic
ity
Ind
ex
Depth(ft.)
Atterberg Limits
Liq
uid
Lim
it
Sample Description
Pla
stic
Lim
it
Wat
er C
on
ten
t (%
)
Dry
Un
it W
t. (
pcf
)
ExplorationID Additional Tests
Refer to the Geotechnical Evaluation Report or thesupplemental plates for the method used for the testingperformed above.NP = NonPlastic
LABORATORY TESTRESULT SUMMARY
gINT FILE: Klf_gint_master_2021 PROJECT NUMBER: 20212714.001A OFFICE FILTER: DENVER
gINT TEMPLATE: E:KLF_STANDARD_GINT_LIBRARY_2021.GLB [__KLF_LAB SUMMARY TABLE - SOIL] PLOTTED: 01/14/2021 01:08 PM BY: MPalmer
Union Ridge Solar ProjectLicking County, OH
PROJECT NO.:
DATE: 12/30/2020
CHECKED BY: BB
DRAWN BY: MG
20212714.001A

0
5
10
15
20
25
30
35
40
45
50
55
60
65
70
75
80
85
90
95
100
0.0010.010.1110100
3/8 3 10024 16 301 2006 10
Sample Description LL PL PI
CuCc
20 40
BO
UL
DE
R
6 601.5 8
%Clay*D60 D30 D10D100Passing
3/4"Passing
#4Passing
#200
18
17
18
17
17
31
27
23
29
35
13
10
5
12
18
NM
NM
NM
NM
NM
NM
NM
NM
NM
NM
2.5 - 4.5
5 - 7
2.5 - 4.5
5 - 7
2.5 - 4.5
92
85
68
98
97
100
100
69
100
100
19
19
25
19
19
NM
NM
NM
NM
NM
Exploration ID Depth (ft.)
PE
RC
EN
T F
INE
R B
Y W
EIG
HT
GRAIN SIZE IN MILLIMETERS
medium fine
GRAVEL SANDCOBBLE
coarse coarsefine
Exploration ID Depth (ft.)
C-2
SIEVE ANALYSIS
SILT
50HYDROMETERU.S. SIEVE OPENING IN INCHES U.S. SIEVE NUMBERS
1403 4
Coefficients of Uniformity - Cu = D60 / D10
Coefficients of Curvature - CC = (D30)2 / D60 D10
D60 = Grain diameter at 60% passing
D30 = Grain diameter at 30% passing
D10 = Grain diameter at 10% passing
2.5 - 4.5
5 - 7
2.5 - 4.5
5 - 7
2.5 - 4.5
B-1
B-2
B-3
B-4
B-5
B-1
B-2
B-3
B-4
B-5
NM
NM
0.272
NM
0.077
SANDY LEAN CLAY (CL)
SANDY LEAN CLAY (CL)
SILTY, CLAYEY SAND with GRAVEL (SC-SM)
LEAN CLAY with SAND (CL)
SANDY LEAN CLAY (CL)
NM
NM
NM
NM
NM
NM
NM
NM
NM
NM
FIGURE
143/4 1/212
65
65
31
75
60
NM
NM
NM
NM
NM
CLAY
%Silt*
*These numbers represent silt-sized and clay-sized content but may notindicate the percentage of the material with the engineering properties of silt or clay.Sieve Analysis and Hydrometer Analysis testing performed in general accordancewith ASTM D6913(Sieve Analysis) and ASTM D7928 (Hydrometer Analysis).NP = NonplasticNM = Not Measured
Union Ridge Solar ProjectLicking County, OH
PLO
TT
ED
: 01
/14/
202
1 0
1:0
9 P
M B
Y:
MP
alm
er
gIN
T F
ILE
: K
lf_gi
nt_m
aste
r_20
21
P
RO
JEC
T N
UM
BE
R:
2021
2714
.001
A
O
FF
ICE
FIL
TE
R:
DE
NV
ER
gIN
T T
EM
PLA
TE
: E
:KLF
_ST
AN
DA
RD
_GIN
T_L
IBR
AR
Y_2
021
.GLB
[_
KLF
_SIE
VE
AN
ALY
SIS
]
DATE: 12/30/2020
CHECKED BY: BB
DRAWN BY: MG
PROJECT NO.:
20212714.001A

0
5
10
15
20
25
30
35
40
45
50
55
60
65
70
75
80
85
90
95
100
0.0010.010.1110100
3/8 3 10024 16 301 2006 10
Sample Description LL PL PI
CuCc
20 40
BO
UL
DE
R
6 601.5 8
%Clay*D60 D30 D10D100Passing
3/4"Passing
#4Passing
#200
16
16
15
18
18
25
22
22
32
31
9
6
7
14
13
NM
NM
NM
NM
NM
NM
NM
NM
NM
NM
5 - 7
18 - 20
38 - 40
2 - 4
2 - 4
88
79
82
93
89
100
91
100
96
100
19
25
19
25
19
NM
NM
NM
NM
NM
Exploration ID Depth (ft.)
PE
RC
EN
T F
INE
R B
Y W
EIG
HT
GRAIN SIZE IN MILLIMETERS
medium fine
GRAVEL SANDCOBBLE
coarse coarsefine
Exploration ID Depth (ft.)
C-3
SIEVE ANALYSIS
SILT
50HYDROMETERU.S. SIEVE OPENING IN INCHES U.S. SIEVE NUMBERS
1403 4
Coefficients of Uniformity - Cu = D60 / D10
Coefficients of Curvature - CC = (D30)2 / D60 D10
D60 = Grain diameter at 60% passing
D30 = Grain diameter at 30% passing
D10 = Grain diameter at 10% passing
5 - 7
18 - 20
38 - 40
2 - 4
2 - 4
B-6
B-6
B-6
TP-1
TP-2
B-6
B-6
B-6
TP-1
TP-2
0.143
0.384
0.358
NM
0.147
SANDY LEAN CLAY (CL)
SILTY, CLAYEY SAND with GRAVEL (SC-SM)
SILTY, CLAYEY SAND with GRAVEL (SC-SM)
LEAN CLAY with SAND (CL)
SANDY LEAN CLAY (CL)
NM
NM
NM
NM
NM
NM
NM
NM
NM
NM
FIGURE
143/4 1/212
53
48
48
70
51
NM
NM
NM
NM
NM
CLAY
%Silt*
*These numbers represent silt-sized and clay-sized content but may notindicate the percentage of the material with the engineering properties of silt or clay.Sieve Analysis and Hydrometer Analysis testing performed in general accordancewith ASTM D6913(Sieve Analysis) and ASTM D7928 (Hydrometer Analysis).NP = NonplasticNM = Not Measured
Union Ridge Solar ProjectLicking County, OH
PLO
TT
ED
: 01
/14/
202
1 0
1:0
9 P
M B
Y:
MP
alm
er
gIN
T F
ILE
: K
lf_gi
nt_m
aste
r_20
21
P
RO
JEC
T N
UM
BE
R:
2021
2714
.001
A
O
FF
ICE
FIL
TE
R:
DE
NV
ER
gIN
T T
EM
PLA
TE
: E
:KLF
_ST
AN
DA
RD
_GIN
T_L
IBR
AR
Y_2
021
.GLB
[_
KLF
_SIE
VE
AN
ALY
SIS
]
DATE: 12/30/2020
CHECKED BY: BB
DRAWN BY: MG
PROJECT NO.:
20212714.001A

0
10
20
30
40
50
60
0 10 20 30 40 50 60 70 80 90 100 110
ATTERBERG LIMITS
LL PL PIPassing#200
C-4
Exploration ID Depth (ft.)
16
18
17
18
17
17
16
16
15
18
18
65
65
31
75
60
53
48
48
70
51
2.5 - 4.5
5 - 7
2.5 - 4.5
5 - 7
2.5 - 4.5
5 - 7
18 - 20
38 - 40
2 - 4
2 - 4
CL-ML
LIQUID LIMIT (LL)
PLA
ST
ICIT
Y I
ND
EX
(P
I)
CL or OL
"U" L
INE
ML or OL4
7
MH or OH
"A" L
INE
CH or OH
Sample Description
B-1
B-2
B-3
B-4
B-5
B-6
B-6
B-6
TP-1
TP-2
31
27
23
29
35
25
22
22
32
31
13
10
5
12
18
9
6
7
14
13
SANDY LEAN CLAY (CL)
SANDY LEAN CLAY (CL)
SILTY, CLAYEY SAND with GRAVEL (SC-SM)
LEAN CLAY with SAND (CL)
SANDY LEAN CLAY (CL)
SANDY LEAN CLAY (CL)
SILTY, CLAYEY SAND with GRAVEL (SC-SM)
SILTY, CLAYEY SAND with GRAVEL (SC-SM)
LEAN CLAY with SAND (CL)
SANDY LEAN CLAY (CL)
FIGURE
Testing performed in general accordance with ASTM D4318.NP = NonplasticNM = Not Measured
Union Ridge Solar ProjectLicking County, OH
Chart Reference: ASTM D2487
PLO
TT
ED
: 01
/14/
202
1 0
1:1
2 P
M B
Y:
MP
alm
er
gIN
T F
ILE
: K
lf_gi
nt_m
aste
r_20
21
P
RO
JEC
T N
UM
BE
R:
2021
2714
.001
A
O
FF
ICE
FIL
TE
R:
DE
NV
ER
gIN
T T
EM
PLA
TE
: E
:KLF
_ST
AN
DA
RD
_GIN
T_L
IBR
AR
Y_2
021
.GLB
[_
KLF
_AT
TE
RB
ER
G (
AS
TM
)]
DATE: 12/30/2020
CHECKED BY: BB
DRAWN BY: MG
PROJECT NO.:
20212714.001A
For classification of fine-grained soilsand fine-grained fraction of coarse-grainedsoils.

20212714.001A Union Ridge Solar Project
Leeward Renewable Energy, LLC Lick Co., OH
Sample: TP-1 / 2-4 ft.
Olive yellow sandy clay
Maximum Dry Density, pcf @ Optimum Water Content, % 114.5 @ 13.3
D 698: B manual
Dry
19
4.8
N/A
Remarks:
Report Date: December 28, 2020
ASTM Test Method: ASTM D 698-12e
Limitations: Pursuant to applicable building codes, the results presented in this report are for the exclusive use of the client and the registered design professional in responsible
charge. The results apply only to the samples tested. This report may not be reproduced, except in full, without written approval of Kleinfelder.
Oversize Correction BSG
% Retained on Controlling Sieve
Soil Description:
As-received Water Content %
Preparation Method
ASTM Method Type of Rammer
Client
Laboratory Compaction Characteristics of Soil
Project Name:Project Number:
105
106
107
108
109
110
111
112
113
114
115
116
8 9 10 11 12 13 14 15 16 17 18
Un
it W
eig
ht,
pc
f
Water Content %

20212714.001A Union Ridge Solar Project
Leeward Renewable Energy, LLC Lick Co., OH
Sample: TP-2 / 2-4 ft.
Brown sandy clay
Maximum Dry Density, pcf @ Optimum Water Content, % 110.7 @ 15.4
D 698: B manual
Dry
23
2
N/A
Remarks:
Client
Laboratory Compaction Characteristics of Soil
Project Name:Project Number:
% Retained on Controlling Sieve
Soil Description:
As-received Water Content %
Preparation Method
ASTM Method Type of Rammer
Report Date: December 28, 2020
ASTM Test Method: ASTM D 698-12e
Limitations: Pursuant to applicable building codes, the results presented in this report are for the exclusive use of the client and the registered design professional in responsible
charge. The results apply only to the samples tested. This report may not be reproduced, except in full, without written approval of Kleinfelder.
Oversize Correction BSG
100
101
102
103
104
105
106
107
108
109
110
111
112
8 9 10 11 12 13 14 15 16 17 18 19 20 21 22 23
Un
it W
eig
ht,
pc
f
Water Content %

20212714.001A/DEN21R120804_rev2 January 29, 2021 © 2020 Kleinfelder www.kleinfelder.com
APPENDIX D.
LABORATORY TEST RESULTS: CORROSION AND THERMAL RESISTIVITY TESTING

Project X REPORT S201223DCorrosion Engineering Page 1 Corrosion Control – Soil, Water, Metallurgy Testing Lab
29990 Technology Dr, Suite 13, Murrieta, CA 92563 Tel: 213-928-7213 Fax: 951-226-1720 www.projectxcorrosion.com
Thermal Dry Out Curve & Results Only Soil Testing
for Union Ridge Solar
January 4, 2021
Prepared for: David Acampora Kleinfelder, Inc
180 Sheree Blvd, Suite #3800 Exton, PA 19341
Project X Job#: S201223D Client Job or PO#: 20212714.001A
Respectfully Submitted,
Eduardo Hernandez, M.Sc., P.E. Sr. Corrosion Consultant NACE Corrosion Technologist #16592 Professional Engineer California No. M37102 [email protected]

Project X REPORT S201223DCorrosion Engineering Page 2 Corrosion Control – Soil, Water, Metallurgy Testing Lab
29990 Technology Dr, Suite 13, Murrieta, CA 92563 Tel: 213-928-7213 Fax: 951-226-1720 www.projectxcorrosion.com
Client: Kleinfelder, Inc Job Name: Union Ridge Solar
Client Job Number: 20212714.001A Project X Job Number: S201223D
Method: IEEE Std 442-81 Report Date: January 4, 2021
Remolded Tube Sample
(S201223D) Sample Location
Sample Depth
(ft)
Thermal Resistivity (oC-cm/W)
Optimal Moisture Content
Proctor Dry
Density
Requested Compaction
Wet Dry (%) (PCF) (%) G-1 / TP-1 2-4 57 218 13.3% 114.50 90%

Project X REPORT S201223DCorrosion Engineering Page 3 Corrosion Control – Soil, Water, Metallurgy Testing Lab
29990 Technology Dr, Suite 13, Murrieta, CA 92563 Tel: 213-928-7213 Fax: 951-226-1720 www.projectxcorrosion.com
Client: Kleinfelder, Inc Job Name: Union Ridge Solar
Client Job Number: 20212714.001A Project X Job Number: S201223D
Method: IEEE Std 442-81 Report Date: January 4, 2021
Remolded Tube Sample
(S201223D) Sample
Location
Sample Depth
(ft)
Thermal Resistivity (oC-cm/W)
Optimal Moisture Content
Proctor Dry
Density
Requested Compaction
Wet Dry (%) (PCF) (%) G-1 / TP-2 2-4 59 293 15.4% 110.70 90%

Project X REPORT S201223D Corrosion Engineering Page 4 Corrosion Control – Soil, Water, Metallurgy Testing Lab
29990 Technology Dr., Suite 13, Murrieta, CA 92563 Tel: 213-928-7213 Fax: 951-226-1720 www.projectxcorrosion.com
Soil Analysis Lab ResultsClient: Kleinfelder, Inc
Job Name: Union Ridge Solar Client Job Number: 20212714.001A Project X Job Number: S201223D
January 4, 2021 Method ASTM
D4972ASTM G200
SM 4500-S2-D
ASTM D4327
ASTM D6919
ASTM D6919
ASTM D6919
ASTM D6919
ASTM D6919
ASTM D6919
ASTM D4327
ASTM D4327
Bore# / Description Depth pH Redox Sulfide S2-
Nitrate NO3
-Ammonium
NH4+
LithiumLi+
SodiumNa+
PotassiumK+
MagnesiumMg2+
CalciumCa2+
FluorideF2
--Phosphate
PO43-
(ft) (mg/kg) (wt%) (mg/kg) (wt%) (Ohm-cm) (Ohm-cm) (mV) (mg/kg) (mg/kg) (mg/kg) (mg/kg) (mg/kg) (mg/kg) (mg/kg) (mg/kg) (mg/kg) (mg/kg)
G-1 / TP-1 2-4 56.5 0.0057 11.5 0.0011 2,814 2,680 7.7 163 <0.01 6.0 12.2 0.0 14.4 1.0 37.2 177.0 3.4 0.9G-1 / TP-2 2-4 16.0 0.0016 4.9 0.0005 4,422 4,288 6.4 135 <0.01 3.2 6.3 0.0 8.7 1.6 43.5 123.3 4.5 6.6
ASTM G187
ASTM D4327
ASTM D4327
Resistivity As Rec'd | Minimum
SulfatesSO4
2-Chlorides
Cl-
Cations and Anions, except Sulfide and Bicarbonate, tested with Ion Chromatography mg/kg = milligrams per kilogram (parts per million) of dry soil weight
ND = 0 = Not Detected | NT = Not Tested | Unk = Unknown Chemical Analysis performed on 1:3 Soil-To-Water extract


20212714.001A/DEN21R120804_rev2 January 29, 2021 © 2020 Kleinfelder www.kleinfelder.com
APPENDIX E.
GBA DOCUMENT
Geotechnical-Engineering ReportImportant Information about This
Subsurface problems are a principal cause of construction delays, cost overruns, claims, and disputes.
While you cannot eliminate all such risks, you can manage them. The following information is provided to help.
The Geoprofessional Business Association (GBA) has prepared this advisory to help you – assumedly a client representative – interpret and apply this geotechnical-engineering report as effectively as possible. In that way, you can benefit from a lowered exposure to problems associated with subsurface conditions at project sites and development of them that, for decades, have been a principal cause of construction delays, cost overruns, claims, and disputes. If you have questions or want more information about any of the issues discussed herein, contact your GBA-member geotechnical engineer. Active engagement in GBA exposes geotechnical engineers to a wide array of risk-confrontation techniques that can be of genuine benefit for everyone involved with a construction project.
Understand the Geotechnical-Engineering Services Provided for this ReportGeotechnical-engineering services typically include the planning, collection, interpretation, and analysis of exploratory data from widely spaced borings and/or test pits. Field data are combined with results from laboratory tests of soil and rock samples obtained from field exploration (if applicable), observations made during site reconnaissance, and historical information to form one or more models of the expected subsurface conditions beneath the site. Local geology and alterations of the site surface and subsurface by previous and proposed construction are also important considerations. Geotechnical engineers apply their engineering training, experience, and judgment to adapt the requirements of the prospective project to the subsurface model(s). Estimates are made of the subsurface conditions that will likely be exposed during construction as well as the expected performance of foundations and other structures being planned and/or affected by construction activities.
The culmination of these geotechnical-engineering services is typically a geotechnical-engineering report providing the data obtained, a discussion of the subsurface model(s), the engineering and geologic engineering assessments and analyses made, and the recommendations developed to satisfy the given requirements of the project. These reports may be titled investigations, explorations, studies, assessments, or evaluations. Regardless of the title used, the geotechnical-engineering report is an engineering interpretation of the subsurface conditions within the context of the project and does not represent a close examination, systematic inquiry, or thorough investigation of all site and subsurface conditions.
Geotechnical-Engineering Services are Performed for Specific Purposes, Persons, and Projects, and At Specific TimesGeotechnical engineers structure their services to meet the specific needs, goals, and risk management preferences of their clients. A geotechnical-engineering study conducted for a given civil engineer
will not likely meet the needs of a civil-works constructor or even a different civil engineer. Because each geotechnical-engineering study is unique, each geotechnical-engineering report is unique, prepared solely for the client.
Likewise, geotechnical-engineering services are performed for a specific project and purpose. For example, it is unlikely that a geotechnical-engineering study for a refrigerated warehouse will be the same as one prepared for a parking garage; and a few borings drilled during a preliminary study to evaluate site feasibility will not be adequate to develop geotechnical design recommendations for the project.
Do not rely on this report if your geotechnical engineer prepared it: • for a different client;• for a different project or purpose;• for a different site (that may or may not include all or a portion of
the original site); or• before important events occurred at the site or adjacent to it;
e.g., man-made events like construction or environmental remediation, or natural events like floods, droughts, earthquakes, or groundwater fluctuations.
Note, too, the reliability of a geotechnical-engineering report can be affected by the passage of time, because of factors like changed subsurface conditions; new or modified codes, standards, or regulations; or new techniques or tools. If you are the least bit uncertain about the continued reliability of this report, contact your geotechnical engineer before applying the recommendations in it. A minor amount of additional testing or analysis after the passage of time – if any is required at all – could prevent major problems.
Read this Report in FullCostly problems have occurred because those relying on a geotechnical-engineering report did not read the report in its entirety. Do not rely on an executive summary. Do not read selective elements only. Read and refer to the report in full.
You Need to Inform Your Geotechnical Engineer About ChangeYour geotechnical engineer considered unique, project-specific factors when developing the scope of study behind this report and developing the confirmation-dependent recommendations the report conveys. Typical changes that could erode the reliability of this report include those that affect:
• the site’s size or shape;• the elevation, configuration, location, orientation,
function or weight of the proposed structure and the desired performance criteria;
• the composition of the design team; or • project ownership.
As a general rule, always inform your geotechnical engineer of project or site changes – even minor ones – and request an assessment of their impact. The geotechnical engineer who prepared this report cannot accept

responsibility or liability for problems that arise because the geotechnical engineer was not informed about developments the engineer otherwise would have considered.
Most of the “Findings” Related in This Report Are Professional OpinionsBefore construction begins, geotechnical engineers explore a site’s subsurface using various sampling and testing procedures. Geotechnical engineers can observe actual subsurface conditions only at those specific locations where sampling and testing is performed. The data derived from that sampling and testing were reviewed by your geotechnical engineer, who then applied professional judgement to form opinions about subsurface conditions throughout the site. Actual sitewide-subsurface conditions may differ – maybe significantly – from those indicated in this report. Confront that risk by retaining your geotechnical engineer to serve on the design team through project completion to obtain informed guidance quickly, whenever needed.
This Report’s Recommendations Are Confirmation-DependentThe recommendations included in this report – including any options or alternatives – are confirmation-dependent. In other words, they are not final, because the geotechnical engineer who developed them relied heavily on judgement and opinion to do so. Your geotechnical engineer can finalize the recommendations only after observing actual subsurface conditions exposed during construction. If through observation your geotechnical engineer confirms that the conditions assumed to exist actually do exist, the recommendations can be relied upon, assuming no other changes have occurred. The geotechnical engineer who prepared this report cannot assume responsibility or liability for confirmation-dependent recommendations if you fail to retain that engineer to perform construction observation.
This Report Could Be MisinterpretedOther design professionals’ misinterpretation of geotechnical-engineering reports has resulted in costly problems. Confront that risk by having your geotechnical engineer serve as a continuing member of the design team, to:
• confer with other design-team members;• help develop specifications;• review pertinent elements of other design professionals’ plans and
specifications; and• be available whenever geotechnical-engineering guidance is needed.
You should also confront the risk of constructors misinterpreting this report. Do so by retaining your geotechnical engineer to participate in prebid and preconstruction conferences and to perform construction-phase observations.
Give Constructors a Complete Report and GuidanceSome owners and design professionals mistakenly believe they can shift unanticipated-subsurface-conditions liability to constructors by limiting the information they provide for bid preparation. To help prevent the costly, contentious problems this practice has caused, include the complete geotechnical-engineering report, along with any attachments or appendices, with your contract documents, but be certain to note
conspicuously that you’ve included the material for information purposes only. To avoid misunderstanding, you may also want to note that “informational purposes” means constructors have no right to rely on the interpretations, opinions, conclusions, or recommendations in the report. Be certain that constructors know they may learn about specific project requirements, including options selected from the report, only from the design drawings and specifications. Remind constructors that they may perform their own studies if they want to, and be sure to allow enough time to permit them to do so. Only then might you be in a position to give constructors the information available to you, while requiring them to at least share some of the financial responsibilities stemming from unanticipated conditions. Conducting prebid and preconstruction conferences can also be valuable in this respect.
Read Responsibility Provisions CloselySome client representatives, design professionals, and constructors do not realize that geotechnical engineering is far less exact than other engineering disciplines. This happens in part because soil and rock on project sites are typically heterogeneous and not manufactured materials with well-defined engineering properties like steel and concrete. That lack of understanding has nurtured unrealistic expectations that have resulted in disappointments, delays, cost overruns, claims, and disputes. To confront that risk, geotechnical engineers commonly include explanatory provisions in their reports. Sometimes labeled “limitations,” many of these provisions indicate where geotechnical engineers’ responsibilities begin and end, to help others recognize their own responsibilities and risks. Read these provisions closely. Ask questions. Your geotechnical engineer should respond fully and frankly.
Geoenvironmental Concerns Are Not CoveredThe personnel, equipment, and techniques used to perform an environmental study – e.g., a “phase-one” or “phase-two” environmental site assessment – differ significantly from those used to perform a geotechnical-engineering study. For that reason, a geotechnical-engineering report does not usually provide environmental findings, conclusions, or recommendations; e.g., about the likelihood of encountering underground storage tanks or regulated contaminants. Unanticipated subsurface environmental problems have led to project failures. If you have not obtained your own environmental information about the project site, ask your geotechnical consultant for a recommendation on how to find environmental risk-management guidance.
Obtain Professional Assistance to Deal with Moisture Infiltration and MoldWhile your geotechnical engineer may have addressed groundwater, water infiltration, or similar issues in this report, the engineer’s services were not designed, conducted, or intended to prevent migration of moisture – including water vapor – from the soil through building slabs and walls and into the building interior, where it can cause mold growth and material-performance deficiencies. Accordingly, proper implementation of the geotechnical engineer’s recommendations will not of itself be sufficient to prevent moisture infiltration. Confront the risk of moisture infiltration by including building-envelope or mold specialists on the design team. Geotechnical engineers are not building-envelope or mold specialists.
Copyright 2019 by Geoprofessional Business Association (GBA). Duplication, reproduction, or copying of this document, in whole or in part, by any means whatsoever, is strictly prohibited, except with GBA’s specific written permission. Excerpting, quoting, or otherwise extracting wording from this document is permitted only with the express written permission of GBA, and only for purposes of scholarly research or book review. Only members of GBA may use this document or its wording as a complement to or as an element of a report of any kind.
Any other firm, individual, or other entity that so uses this document without being a GBA member could be committing negligent or intentional (fraudulent) misrepresentation.
Telephone: 301/565-2733e-mail: [email protected] www.geoprofessional.org