Appendix C: Geotechnical Engineering Evaluation
15
APPENDIX C GEOTECHNICAL ENGINEERING EVALUATION
Transcript of Appendix C: Geotechnical Engineering Evaluation

APPENDIX C GEOTECHNICAL ENGINEERING EVALUATION
TABLE OF CONTENTS 1 INTRODUCTION ............................................................................................................ C-1
2 GEOTECHNICAL ENGINEERING EVALUATIONS ...................................................... C-2
2.1 Geologic Background and Seismicity ......................................................................... C-2
2.2 Stability of Dredge Cuts .............................................................................................. C-3
2.2.1 Slope Deformation Due to Seismic Event........................................................... C-5
2.3 Stability of Caps on Slopes .......................................................................................... C-8
2.4 Filter Design for Shoreline Armor ............................................................................. C-9
3 REFERENCES ................................................................................................................ C-12
List of Tables Table C-1 Summary of Earthquake Accelerations for Various Return-Interval
Earthquakes ........................................................................................................ C-3
Table C-2 Slope Stability Soil Parameters .......................................................................... C-4
Table C-3 Dredge Cut Stability Evaluation Results .......................................................... C-5
Table C-4 Filter Material Grain Size Recommendation ................................................. C-11
Figure Figure C-1 SMA-2 Cross Sections B-B' ................................................................................ C-7
Appendix C: Geotechnical Engineering Evaluation May 2015 Port Gamble Bay Cleanup Project C-i 130388-01.02
1 INTRODUCTION
This technical appendix describes geotechnical engineering evaluations performed in support of the Port Gamble Bay cleanup project. This appendix is a component of the Engineering Design Report (EDR) for the project, and describes analyses that are based on project elements described elsewhere in the EDR. Analyses are based on geologic information generated during historic site investigations, as well as recent investigations conducted in support of the remedial design (pre-design investigation; see Appendix A of the EDR). The following evaluations are described in this appendix:
• Geologic background • Stability of dredge cuts • Stability of caps on slopes • Filter design (gradation) for materials underlying shoreline armor rock
Appendix C: Geotechnical Engineering Evaluation May 2015 Port Gamble Bay Cleanup Project C-1 130388-01.02

2 GEOTECHNICAL ENGINEERING EVALUATIONS
This section provides the details and conclusions of the geotechnical engineering evaluations conducted in support of the remedial design for the Port Gamble Bay cleanup project.
2.1 Geologic Background and Seismicity
Port Gamble is located in Kitsap County, a region that has been geologically influenced by repeated episodes of glacial advance through the area. The most recent glacial episode left a sequence of soils that are expressed near the ground surface as Pleistocene-aged glacial till and glacial drift (WDNR 2014). The former mill site consists predominantly of mixed fill overlying marine beach deposits. The mill site fill was placed episodically starting in the mid to late 1800s to develop the mill site, and is likely on the order of 10 feet thick or greater, particularly near the current shoreline. Port Gamble is located within a seismically active area. One way to describe seismic risk is to consider the Peak Ground Acceleration (PGA) associated with an earthquake that has a given probability of exceedance (i.e., return interval). PGAs can be determined through seismic hazard deaggregation, tools for which are publically available (USGS 2014). The PGA reported by these tools is for a bedrock site. In order to modify the PGA for site-specific geologic conditions, a scaling factor (FPGA) is used. To support the slope stability evaluation, various potential earthquake return intervals were considered for the Port Gamble site, and PGAs were tabulated for these earthquakes using the 2008 USGS deaggregation tools (USGS 2014). Table C-1 presents a summary of the PGA for three different standard return-interval earthquakes. For each of these PGA values, the site-specific scaling factor, FPGA, for a soft soil site (Site Class E) was determined in accordance with the Federal Highway Administration reference manual (FHWA 2011), to calculate the potential peak horizontal acceleration (kh) that could be expected during these various earthquake events.
Appendix C: Geotechnical Engineering Evaluation May 2015 Port Gamble Bay Cleanup Project C-2 130388-01.02

Geotechnical Engineering Evaluations
Table C-1 Summary of Earthquake Accelerations for Various Return-Interval Earthquakes
Probability of Exceedance Return Interval
PGA (% g) FPGA
kh (% g)
50% in 50 years 72-year 0.11 2.42 0.27
10% in 50 years 475-year 0.29 1.17 0.34
5% in 50 years 975-year 0.39 0.93 0.36
Note: FPGA for Site Class E
2.2 Stability of Dredge Cuts
The remedy will include dredging at the toe of the existing underwater slopes to remove sediments exceeding cleanup criteria. The deepest dredge cut, based on data collected during the pre-design investigation (see Appendix A of the EDR), will occur in sediment management area (SMA)-2, along the south facing shoreline of the former mill site where chip barges were historically loaded. This area was considered to be the critical cross section for stability evaluation. The generalized soil conditions are fill (typically consisting of sand and gravel) overlying native material consisting of poorly graded fine sand. Due to the cohesionless nature of the fill and native soil, it is expected that any porewater pressure generated during short-term (construction) conditions will dissipate almost instantaneously from the area of activity. This would result in highly similar stability results for both short-term and long-term (post-construction) stability. Therefore, long-term stability was analyzed as the most critical static scenario and seismic parameters were applied to this condition. The input assumptions in Table C-2 were used for soil modeling. These soil parameters are considered appropriate for the soil conditions based on historical information, typical soil correlations, and experience in the area.
Appendix C: Geotechnical Engineering Evaluation May 2015 Port Gamble Bay Cleanup Project C-3 130388-01.02

Geotechnical Engineering Evaluations
Table C-2 Slope Stability Soil Parameters
Generalized Soil Description
Unit Weight (lb/ft3)
Friction Angle (degrees)
Cohesion (psf)
Fill 120 30 0
Native Soils 120 35 0
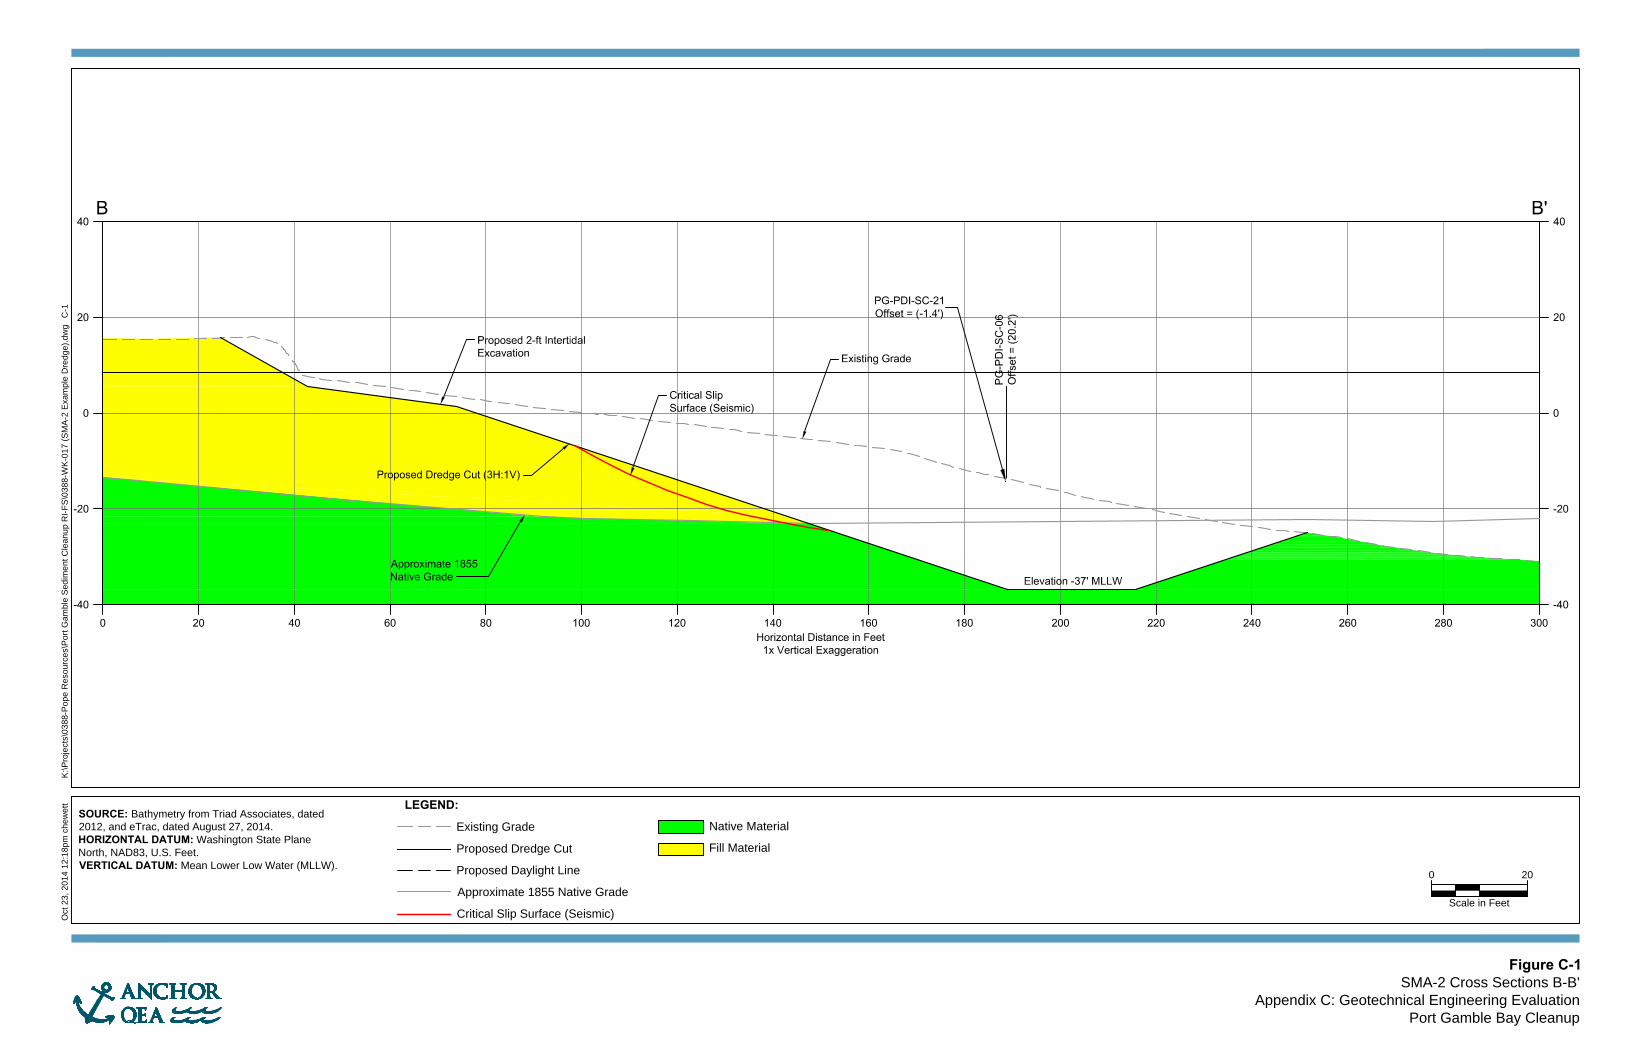
To evaluate dredge cut slope stability, both 2 horizontal to 1 vertical (2H:1V) and 3H:1V slopes were modeled using limit equilibrium methods implemented in the Slide 6.0 software package by Rocscience, Inc. A geologic cross section was developed through the most critical slope (Figure C-1) to evaluate global stability under long-term and seismic scenarios. The static groundwater and sea level elevation were assumed to be at elevation 8.4 feet mean lower low water for both water tables based on measurements at upland well MW-4 (Anchor Environmental and EPI 2008). The failure surface searches were restricted to surfaces greater than 3 feet thick; for limit equilibrium analyses that assume zero cohesion (a simplifying modeling assumption that does not necessarily represent typical soil behavior), critical slip surfaces are as shallow as the model will allow, and restricting surfaces to 3 feet or thicker prevents the model from reporting unrealistically low factors of safety that occur at infinitesimally small scales. Based on the U.S. Army Corps of Engineers (USACE; 2003) and Duncan and Wright (2005) guidelines, the following factors of safety (FOSs) are targeted for long-term and seismic evaluations:
• Target long-term FOS ≥ 1.5 • Target seismic FOS ≥ 1.0
Seismic parameters were used to model the 72-year return interval and the 475-year return interval events (as noted in Table C-1). Table C-3 summarizes the results of the slope stability evaluation. Based on the results of this evaluation, 3H:1V design slopes were selected for the dredge cuts. Under the seismic condition, the FOS is less than 1.0 for the 475-year earthquake. This implies that some slope
Appendix C: Geotechnical Engineering Evaluation May 2015 Port Gamble Bay Cleanup Project C-4 130388-01.02
Geotechnical Engineering Evaluations
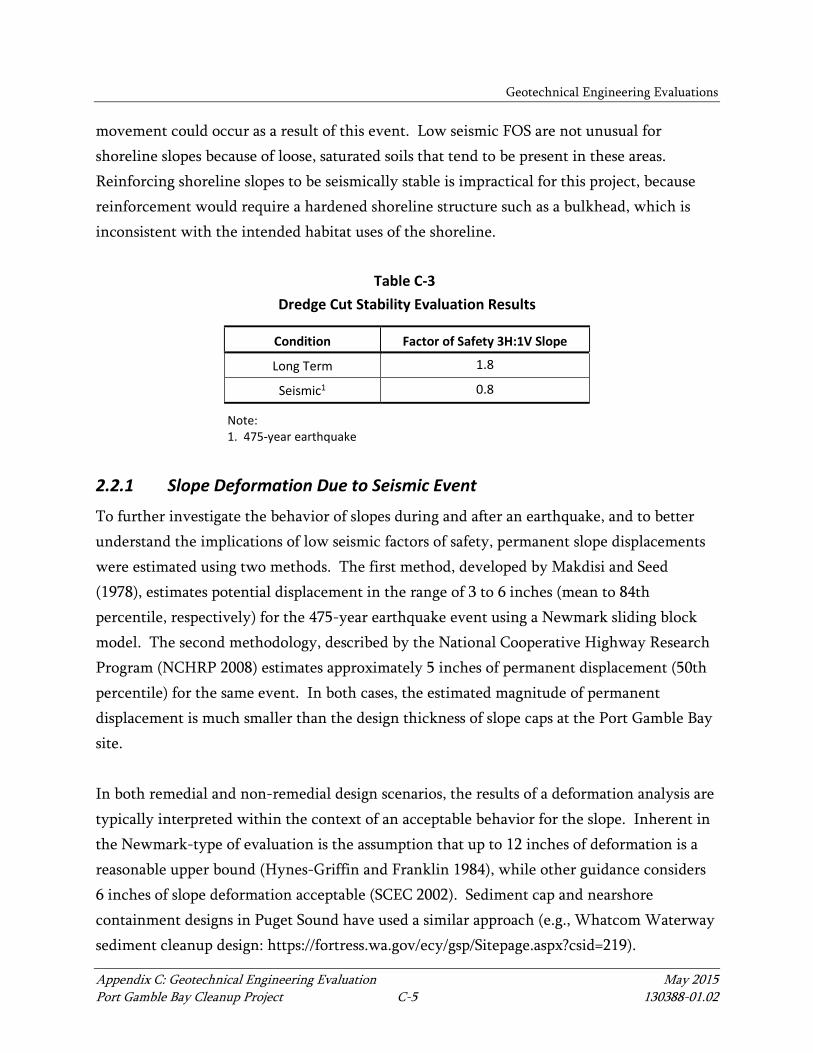
movement could occur as a result of this event. Low seismic FOS are not unusual for shoreline slopes because of loose, saturated soils that tend to be present in these areas. Reinforcing shoreline slopes to be seismically stable is impractical for this project, because reinforcement would require a hardened shoreline structure such as a bulkhead, which is inconsistent with the intended habitat uses of the shoreline.
Table C-3 Dredge Cut Stability Evaluation Results
Condition Factor of Safety 3H:1V Slope
Long Term 1.8
Seismic1 0.8
Note: 1. 475-year earthquake
2.2.1 Slope Deformation Due to Seismic Event
To further investigate the behavior of slopes during and after an earthquake, and to better understand the implications of low seismic factors of safety, permanent slope displacements were estimated using two methods. The first method, developed by Makdisi and Seed (1978), estimates potential displacement in the range of 3 to 6 inches (mean to 84th percentile, respectively) for the 475-year earthquake event using a Newmark sliding block model. The second methodology, described by the National Cooperative Highway Research Program (NCHRP 2008) estimates approximately 5 inches of permanent displacement (50th percentile) for the same event. In both cases, the estimated magnitude of permanent displacement is much smaller than the design thickness of slope caps at the Port Gamble Bay site. In both remedial and non-remedial design scenarios, the results of a deformation analysis are typically interpreted within the context of an acceptable behavior for the slope. Inherent in the Newmark-type of evaluation is the assumption that up to 12 inches of deformation is a reasonable upper bound (Hynes-Griffin and Franklin 1984), while other guidance considers 6 inches of slope deformation acceptable (SCEC 2002). Sediment cap and nearshore containment designs in Puget Sound have used a similar approach (e.g., Whatcom Waterway sediment cleanup design: https://fortress.wa.gov/ecy/gsp/Sitepage.aspx?csid=219).
Appendix C: Geotechnical Engineering Evaluation May 2015 Port Gamble Bay Cleanup Project C-5 130388-01.02

Geotechnical Engineering Evaluations
Given that some slope deformation could occur following a 475-year earthquake and in light of the fact that the location and extent of deformation cannot be reliably predicted or avoided in advance, inspection (and repair, as necessary) of slopes following an earthquake will occur immediately following a relatively large seismic event (e.g., 100-year or greater earthquake). Inspection will include both a visual reconnaissance at low tide, as well as bathymetric survey of the slope areas. If deformation of the cap is identified during an inspection, cap thickness measurements will be conducted in the area of interest, and additional material will be placed on the slope to restore the required cap thickness in the deformed area if necessary. This adaptive management approach, which will be described in more detail in the Operations, Maintenance, and Monitoring Plan (see Appendix F of the EDR), is consistent with the approach that has been successfully used at similar sediment cleanup sites throughout Puget Sound for decades.
Appendix C: Geotechnical Engineering Evaluation May 2015 Port Gamble Bay Cleanup Project C-6 130388-01.02
0 20
Scale in Feet
O
ct 23, 2014 12:18pm
chew
ett K
:\P
rojects\0388-P
ope R
esources\P
ort G
am
ble S
edim
ent C
leanup R
I-F
S\0388-W
K-017 (S
MA
-2 E
xam
ple D
redge).dw
g C
-1
Figure C-1
SMA-2 Cross Sections B-B'
Appendix C: Geotechnical Engineering Evaluation
Port Gamble Bay Cleanup
SOURCE: Bathymetry from Triad Associates, dated
2012, and eTrac, dated August 27, 2014.
HORIZONTAL DATUM: Washington State Plane
North, NAD83, U.S. Feet.
VERTICAL DATUM: Mean Lower Low Water (MLLW).
LEGEND:
Existing Grade
Proposed Dredge Cut
Proposed Daylight Line
Approximate 1855 Native Grade
Critical Slip Surface (Seismic)
Native Material
Fill Material

Geotechnical Engineering Evaluations
2.3 Stability of Caps on Slopes
Slope stability for caps on slopes is concerned with the possibility of raveling (downhill movement) of capping materials along inclined slopes. Raveling is surficial migration of soil and is typically a consideration for near-surface (upper 3 feet) materials placed on slopes. Since shallow slip circles less than 3 feet in depth are not well-modeled in limiting equilibrium analyses due to limitations in soil modeling assumptions, a different methodology (infinite slope analysis) was used to evaluate the stability of caps on slopes. The infinite slope analysis methodology (Duncan and Wright 2005) is briefly outlined below. Step 1: Determine pore pressure ratio, 𝒓𝒓𝒖𝒖
𝑟𝑟𝑢𝑢 = 𝑢𝑢𝛾𝛾𝛾𝛾
where: 𝑢𝑢 = pore pressure (psf) 𝛾𝛾 = total unit weight of soil (pcf) 𝛾𝛾H = depth corresponding to pore pressure (feet)
Note, for a submerged slope with no excess pore pressures, γ = γb (buoyant unit weight) and ru = 0. Step 2: Determine values of dimensionless parameters A & B For slope ratio of 3H:1V, A = 1.0 and B ≈ 3.25 Step 3: Calculate FOS
FOS = Atan𝜑𝜑′tan𝛽𝛽
+ 𝐵𝐵 𝑐𝑐′𝛾𝛾𝛾𝛾
where: 𝜑𝜑′ = angle of internal friction in terms of effective stress (𝜑𝜑′ = 𝜑𝜑 for granular
soil)
Appendix C: Geotechnical Engineering Evaluation May 2015 Port Gamble Bay Cleanup Project C-8 130388-01.02

Geotechnical Engineering Evaluations
𝛽𝛽 = slope angle 𝑐𝑐′ = cohesion intercept in terms of effective stress (𝑐𝑐′ = 0 for granular soil) 𝛾𝛾 = depth of sliding mass measured vertically (feet)
For submerged slopes consisting of granular, cohesionless material (i.e., sand), the FOS was calculated to be about 1.7, which is greater than the target of 1.5 for static conditions. If surficial raveling is noted along the slopes, then this may need to be managed through future maintenance.
2.4 Filter Design for Shoreline Armor
A granular filter is typically used to separate finer native subgrade materials from coarser gravel and cobble cap and armor materials. This filter layer prevents loss of the subgrade material through the interstices of the coarser overlying cap. Filter design is conducted in accordance with typical guidance developed by USACE. A coastal engineering evaluation was performed for intertidal areas, to determine extreme wave conditions along the shoreline at Port Gamble Bay during a 100-year storm event (see Appendix D of the EDR). Appendix D separates the site into different shoreline reaches depending on wave conditions, which are the primary factor that determines cap armor size. Based on proximity and review of adjacent explorations, representative gradations for the native soils within the cap areas were chosen for use in the calculation of an appropriate filter gradation that will prevent loss of the capped subgrade soils through the armored cap interstices. This gradation defines a range of grain sizes that the cap material should have where the cap provides separation between the underlying subgrade and the overlying armor layer. The filter design methodology was based on the USACE (1984) criteria. Filter gradation is dependent on the gradation of the underlying soil and the overlying armor. To evaluate filter stability, the following equations were used:
𝐷𝐷50 𝑠𝑠𝑠𝑠𝑠𝑠𝑠𝑠𝑠𝑠𝑠𝑠𝑠𝑠
𝐷𝐷50 𝑠𝑠𝑠𝑠𝑠𝑠𝑠𝑠𝑠𝑠𝑠𝑠𝑠𝑠𝑠𝑠𝑠𝑠𝑠𝑠 ≤ 25 and 𝐷𝐷15 𝑠𝑠𝑠𝑠𝑠𝑠𝑠𝑠𝑠𝑠𝑠𝑠𝑠𝑠
𝐷𝐷85 𝑠𝑠𝑠𝑠𝑠𝑠𝑠𝑠𝑠𝑠𝑠𝑠𝑠𝑠𝑠𝑠𝑠𝑠𝑠𝑠 ≤ 5
Appendix C: Geotechnical Engineering Evaluation May 2015 Port Gamble Bay Cleanup Project C-9 130388-01.02

Geotechnical Engineering Evaluations
where: 𝐷𝐷15 𝑠𝑠𝑢𝑢𝑠𝑠𝑠𝑠𝑠𝑠𝑠𝑠𝑠𝑠 = The diameter of the particles in which 15% of the remaining
soil is smaller. This value is taken from the gradation of the overlying soil.
𝐷𝐷50 𝑠𝑠𝑢𝑢𝑠𝑠𝑠𝑠𝑠𝑠𝑠𝑠𝑠𝑠 = The diameter of the particles in which 50% of the remaining
soil is smaller. This value is taken from the gradation of the overlying soil.
𝐷𝐷50 𝑠𝑠𝑢𝑢𝑠𝑠𝑠𝑠𝑢𝑢𝑠𝑠𝑠𝑠𝑠𝑠𝑠𝑠𝑠𝑠 = The diameter of the particle in which 50% of the remaining soil
is smaller. This value is taken from the gradation of the underlying soil.
𝐷𝐷85 𝑠𝑠𝑢𝑢𝑠𝑠𝑠𝑠𝑢𝑢𝑠𝑠𝑠𝑠𝑠𝑠𝑠𝑠𝑠𝑠 = The diameter of the particle in which 85% of the remaining soil
is smaller. This value is taken from the gradation of the underlying soil.
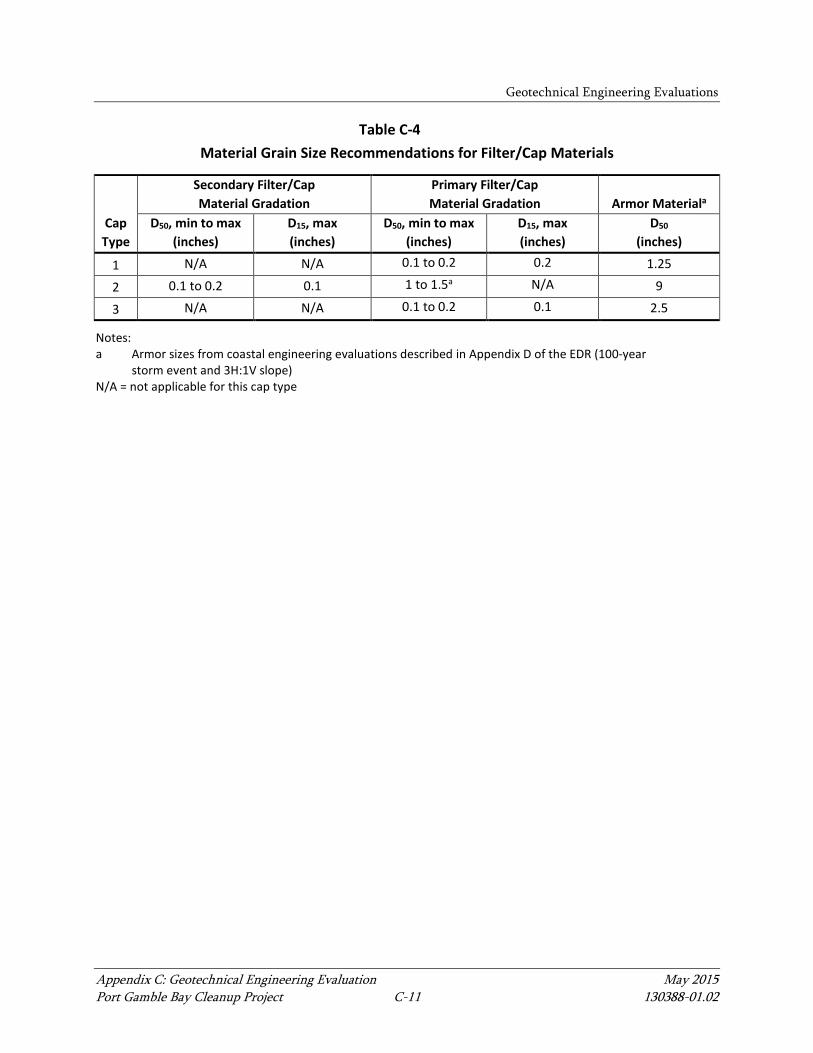
The D50 surface values provided by the coastal evaluation were used to evaluate the D50 subsurface for filter stability. In this step, the filter/cap material is considered the “subsurface.” This calculated D50 is the minimum value. The next step was to use approximate values of D50 and D85 of the native soils to determine the required D15 surface and D50 surface for filter stability. In this step, the filter/cap material is now considered the “surface.” This calculated D50 is the maximum value. Comparing the calculated values where there is “overlap” then provides the range of D50 for the filter/cap material. Where significant changes in gradation are necessary (e.g., from fine sand subgrade to coarse armor rock), a secondary filter/cap layer may be necessary to achieve filter stability. Based on the results of this evaluation, armor and filter/cap gradation recommendations are summarized in Table C-4.
Appendix C: Geotechnical Engineering Evaluation May 2015 Port Gamble Bay Cleanup Project C-10 130388-01.02
Geotechnical Engineering Evaluations
Table C-4 Material Grain Size Recommendations for Filter/Cap Materials
Cap Type
Secondary Filter/Cap Material Gradation
Primary Filter/Cap Material Gradation Armor Materiala
D50, min to max (inches)
D15, max (inches)
D50, min to max (inches)
D15, max (inches)
D50 (inches)
1 N/A N/A 0.1 to 0.2 0.2 1.25
2 0.1 to 0.2 0.1 1 to 1.5a N/A 9
3 N/A N/A 0.1 to 0.2 0.1 2.5
Notes: a Armor sizes from coastal engineering evaluations described in Appendix D of the EDR (100-year
storm event and 3H:1V slope) N/A = not applicable for this cap type
Appendix C: Geotechnical Engineering Evaluation May 2015 Port Gamble Bay Cleanup Project C-11 130388-01.02

3 REFERENCES
Anchor Environmental, L.L.C., and EPI (Environmental Partners, Inc.), 2008. Final Remedial Investigation/Feasibility Study Work Plan and Sampling and Analysis Plan. Former Pope & Talbot Inc. Sawmill Site, Port Gamble, Washington. Prepared for Pope Resources LP, Olympic Property Group L.L.C., and the Washington State Department of Ecology. October 2008.
Duncan, J. Michael, and Stephen G. Wright, 2005. Soil Strength and Slope Stability. John Wiley & Sons, Inc.
FHWA (Federal Highway Administration), 2011. LRFD Seismic Analysis and Design of Transportation Geotechnical Features and Structural Foundations Reference Manual FHWA-NHI-11-032. Federal Highway Administration GEC No. 3. August 2011 (Rev. 1).
Hynes-Griffin, Mary E., and Arley G. Franklin, 1984. Rationalizing the Seismic Coefficient Method. Miscellaneous Paper GL-84-13. U.S. Army Waterways Experiment Station, Corps of Engineers. July.
Makdisi, Faiz I., and H. Bolton Seed, 1978. Simplified Procedure for Estimating Dam and Embankment Earthquake-Induced Deformations. ASCE Journal of Geotechnical Engineering Division 104:849-867.
NCHRP (National Cooperative Highway Research Program), 2008. Report Number 611 Seismic Analysis and Design of Retaining Walls, Buried Structures, Slopes and Embankments. Transportation Research Board, Washington D.C.
SCEC (Southern California Earthquake Center), 2002. Recommended Procedures for Implementation of DMG Special Publication 117 Guidelines for Analyzing and Mitigating Landslide Hazards in California.
USACE (U.S. Army Corps of Engineers), 1984. Engineering and Design, Drainage and Erosion Control Mobilization Construction, EM 1110-3-136. U.S. Army Corps of Engineers Manual No. 1110-3-136. April 9, 1984.
USACE, 2003. Engineering and Design Slope Stability EM 1110-2-1902. U.S. Army Corps of Engineers Manual No. 1110-2-1902. October 31, 2003.
Appendix C: Geotechnical Engineering Evaluation May 2015 Port Gamble Bay Cleanup Project C-12 130388-01.02
References
USGS (U.S. Geologic Survey), 2014. Interactive Deaggregation web site. Available at: http://geohazards.usgs.gov/deaggint/2008/.
WDNR (Washington Department of Natural Resources), 2014. Washington Interactive Geologic Map web site. Available at: https://fortress.wa.gov/dnr/geology/?Theme=subsurf.
Wright, Steven J., Ram K. Mohan, Mark P. Brown, and Chayong C. Kim, 2001. Filter Design Criteria for Sediment Caps in Rivers and Harbors. Journal of Coastal Research 17(2), pp. 353-362. Spring 2001.
Appendix C: Geotechnical Engineering Evaluation May 2015 Port Gamble Bay Cleanup Project C-13 130388-01.02