EXHIBIT 15-5 82 Amity Street
70
APPRAISAL OF REAL PROPERTY Three-Story Shell Building 82 Amity Street Brooklyn, Kings County, NY 11201 IN A SUMMARY APPRAISAL REPORT As of October 1, 2013 Prepared For: Cozen O'Connor 277 Park Avenue, 16th Floor New York, New York 10172 Prepared By: Cushman & Wakefield, Inc. Valuation & Advisory 1290 Avenue of the Americas New York, NY 10104 C&W File ID: 13-12002-902821 02123
Transcript of EXHIBIT 15-5 82 Amity Street

APPRAISAL OF REAL PROPERTY
Three-Story Shell Building
82 Amity Street
Brooklyn, Kings County, NY 11201
IN A SUMMARY APPRAISAL REPORT
As of October 1, 2013
Prepared For:
Cozen O'Connor
277 Park Avenue, 16th Floor
New York, New York 10172
Prepared By:
Cushman & Wakefield, Inc.
Valuation & Advisory
1290 Avenue of the Americas
New York, NY 10104
C&W File ID: 13-12002-902821
02123

CUSHMAN & WAKEFIELD, INC. 1290 AVENUE OF THE AMERICAS NEW YORK, NY 10104
Three-Story Shell Building 82 Amity Street Brooklyn, Kings County, NY 11201
02124
1290 AVENUE OF THE AMERICAS
NEW YORK, NY 10104
October 25, 2013
Kenneth K. Fisher, Esq. Cozen O'Connor 277 Park Avenue, 16th Floor New York, New York 10172
Re: Appraisal of Real Property In a Summary Report
Three-Story Shell Building 82 Amity Street Brooklyn, Kings County, NY 11201
C&W File ID: 13-12002-902821
Dear Mr. Fisher:
In fulfillment of our agreement as outlined in the Letter of Engagement, we are pleased to transmit our appraisal of the above captioned property in a summary report dated October 25, 2013. The effective date of value is October 1, 2013.
This is a summary appraisal, which is intended to comply with the reporting requirements set forth under Standards Rule 2-2(b) of the Uniform Standards of Professional Appraisal Practice. As such, it presents limited discussions of the data, reasoning, or analyses used in the appraisal process to develop the appraisers' opinion of value. Additional supporting documentation concerning the data, reasoning, and analyses is retained in our files. The depth of discussion contained in this report is specific to the needs of the client and for the intended use stated within the report.
Cushman & Wakefield, Inc. has performed a previous appraisal of the subject property within the three years prior to this assignment.
This appraisal report has been prepared in accordance with our interpretation of your institution’s guidelines and the Uniform Standards of Professional Appraisal Practice (USPAP).
02125
KENNETH K. FISHER, ESQ. COZEN O'CONNOR OCTOBER 25, 2013 PAGE 2
CUSHMAN & WAKEFIELD, INC.
M A R K E T V A L U E A S I S Based on our Appraisal as defined by the Uniform Standards of Professional Appraisal Practice, we have developed an opinion that the Market Value of the Fee Simple Interest of the subject property, subject to the assumptions and limiting conditions, certification, extraordinary assumptions and hypothetical conditions, if any, and definitions, “As-Is” on October 1, 2013, was:
ONE MILLION FOUR HUNDRED THOUSAND DOLLARS
$1,400,000
The value opinion in this report is qualified by certain assumptions, limiting conditions, certification, and definitions. We particularly call your attention to the extraordinary assumptions and hypothetical conditions listed below.
E X T R A O R D I N A R Y A S S U M P T I O N S For a definition of Extraordinary Assumptions please see the Glossary of Terms & Definitions.
This appraisal employs two extraordinary assumptions. 1) The subject property, along with all of the other buildings that are part of the hospital campus, is currently under the ownership of Downstate at LICH Holding Company, Inc. This appraisal assumes that the subject property is marketed as an individual property and not as a group of properties to be sold in bulk. 2) The appraisers inspected the interior of the asset in September 2010. We have assumed no change in conditions observed from the prior inspection.
H Y P O T H E T I C A L C O N D I T I O N S For a definition of Hypothetical Conditions please see the Glossary of Terms & Definitions.
This appraisal does not employ any hypothetical conditions.
02126

KENNETH K. FISHER, ESQ. COZEN O'CONNOR OCTOBER 25, 2013 PAGE 3
CUSHMAN & WAKEFIELD, INC.
This letter is invalid as an opinion of value if detached from the report, which contains the text, exhibits, and Addenda.
Respectfully submitted,
CUSHMAN & WAKEFIELD, INC.
Michael J. Garcia Director NY Certified General Appraiser License No. 46000049472
John T. Feeney, Jr. Executive Director NY Certified General Appraiser License No. 46000028659
Robert S. Nardella, MAI, MRICS Senior Managing Director NY Certified General Appraiser License No. 46000004620
02127

82 AMITY STREET EXECUTIVE SUMMARY IV
S U M M A R Y O F S A L I E N T F A C T S A N D C O N C L U S I O N S The subject property consists of a three-story shell building with a gross building area of 3,840 square feet. The subject property is located on the south side of Amity Street between Hicks Street and Henry Street.
The chart below is an executive summary of the information that we present in more detail in the report.
BASIC INFORMATIONCommon Property Name: Three-Story Shell Building Report Type: SummaryAddress: 82 Amity Street Interest Appraised: Fee SimpleCity: Brooklyn Date of Value As Is: 10/1/13State: NYZip Code: 11201County: Kings Date of Exterior Inspection: 10/1/13Property Ownership Entity: Downstate at LICH Holding Company, Inc. Date of Report: 10/25/13CW File Reference: 13-12002-902821
SITE INFORMATIONLand Area Gross SF: 1,481 Site Utility: AverageFlood Zone: X Site Topography: Level and at street gradeFlood Map Number: 360497-0203F Site Shape: RectangularFlood Map Date: 9/5/07 Frontage: Average
Access: AverageVisibility: Average
BUILDING INFORMATIONType of Property: Residential Actual Age: 113 YearsNumber of Buildings: 1 Quality: AverageGross Building Area (Above Grade): 3,840 SF Condition: FairNumber of Stories: 3
MUNICIPAL INFORMATIONAssessor's Parcel Identification: Block 295, Lot 11 Municipality Governing Zoning: City of New YorkAssessing Authority: City of New York Current Zoning: R6 within the Limited Height District (LH-1)Current Tax Year: 2013/2014 Is current use permitted: YesTaxable Assessment: $55,840 Is current use compliant: Legal, pre-existing, non-conforming useCurrent Tax Liability: $7,360 Current Use Compliance: Legal, pre-existing, non-conforming use
HIGHEST & BEST USEAs Vacant: As Improved:Construction of a residential building built to its maximum permitted potential. Renovation of the existing improvements for use as a residential apartment building.
VALUATION INDICES Market Value As IsCOST APPROACHIndicated Value: N/A
SALES COMPARISON APPROACHIndicated Value: $1,400,000
INCOME CAPITALIZATION APPROACHIndicated Value: N/A
EXPOSURE TIMEExposure Time: 6 to 9 MonthsMarketing Time: 6 to 9 Months
02128

82 AMITY STREET EXECUTIVE SUMMARY V
E X T R A O R D I N A R Y A S S U M P T I O N S For a definition of Extraordinary Assumptions please see the Glossary of Terms & Definitions.
This appraisal employs two extraordinary assumptions. 1) The subject property, along with all of the other buildings that are part of the hospital campus, is currently under the ownership of Downstate at LICH Holding Company, Inc. This appraisal assumes that the subject property is marketed as an individual property and not as a group of properties to be sold in bulk. 2) The appraisers inspected the interior of the asset in September 2010. We have assumed no change in conditions observed from the prior inspection.
H Y P O T H E T I C A L C O N D I T I O N S For a definition of Hypothetical Conditions please see the Glossary of Terms & Definitions.
This appraisal does not employ any hypothetical conditions.
02129

82 AMITY STREET PROPERTY PHOTOGRAPHS VI
Property Photographs
AERIAL MAP
02130

82 AMITY STREET PROPERTY PHOTOGRAPHS VII
View of the subject facing southeast across Amity Street
View of the subject facing south across Amity Street
02131

82 AMITY STREET PROPERTY PHOTOGRAPHS VIII
Street scene facing west on Amity Street, subject to the left
Street scene facing east on Amity Street, subject to the right
02132

82 AMITY STREET PROPERTY PHOTOGRAPHS IX
The following photographs are from a prior inspection undertaken in September 2010.
View of a typical bathroom
02133

82 AMITY STREET PROPERTY PHOTOGRAPHS X
View of a typical community facility unit
02134

82 AMITY STREET PROPERTY PHOTOGRAPHS XI
View of the boiler
02135

82 AMITY STREET TABLE OF CONTENTS XII
T a b l e o f C o n t e n t s PROPERTY PHOTOGRAPHS ------------------------------------------------------------------------------------------------------------------------------ VI INTRODUCTION ---------------------------------------------------------------------------------------------------------------------------------------------------- 1
SCOPE OF WORK ------------------------------------------------------------------------------------------------------------------------------ 1 IDENTIFICATION OF PROPERTY --------------------------------------------------------------------------------------------------------- 2 PROPERTY OWNERSHIP AND RECENT HISTORY --------------------------------------------------------------------------------- 2 DATES OF INSPECTION AND VALUATION -------------------------------------------------------------------------------------------- 2 CLIENT, INTENDED USE AND USERS OF THE APPRAISAL --------------------------------------------------------------------- 2 EXTRAORDINARY ASSUMPTIONS ------------------------------------------------------------------------------------------------------- 3 HYPOTHETICAL CONDITIONS ------------------------------------------------------------------------------------------------------------- 3
NEW YORK CITY REGIONAL ANALYSIS ------------------------------------------------------------------------------------------------------------- 4 INTRODUCTION--------------------------------------------------------------------------------------------------------------------------------- 5 DEMOGRAPHIC TRENDS -------------------------------------------------------------------------------------------------------------------- 6 ECONOMIC TRENDS -------------------------------------------------------------------------------------------------------------------------- 9 CONCLUSION----------------------------------------------------------------------------------------------------------------------------------- 14
LOCAL AREA ANALYSIS ------------------------------------------------------------------------------------------------------------------------------------ 15 PROPERTY ANALYSIS --------------------------------------------------------------------------------------------------------------------------------------- 19
SITE DESCRIPTION--------------------------------------------------------------------------------------------------------------------------- 19 IMPROVEMENTS DESCRIPTION --------------------------------------------------------------------------------------------------------- 21 REAL PROPERTY TAXES AND ASSESSMENTS ------------------------------------------------------------------------------------ 23 ZONING ------------------------------------------------------------------------------------------------------------------------------------------- 24
VALUATION --------------------------------------------------------------------------------------------------------------------------------------------------------- 27 HIGHEST AND BEST USE ------------------------------------------------------------------------------------------------------------------ 27 VALUATION PROCESS ---------------------------------------------------------------------------------------------------------------------- 30 SALES COMPARISON APPROACH ------------------------------------------------------------------------------------------------------ 32 RECONCILIATION AND FINAL VALUE OPINION ------------------------------------------------------------------------------------ 37 ASSUMPTIONS AND LIMITING CONDITIONS ---------------------------------------------------------------------------------------- 39 CERTIFICATION OF APPRAISAL --------------------------------------------------------------------------------------------------------- 42
ADDENDA CONTENTS --------------------------------------------------------------------------------------------------------------------------------------- 44
02136
82 AMITY STREET INTRODUCTION 1
Introduct ion
S C O P E O F W O R K This appraisal, presented in a summary report, is intended to comply with the reporting requirements outlined under the USPAP for a summary appraisal report. This appraisal report has been prepared in accordance with our interpretation of your institution’s guidelines and the Uniform Standards of Professional Appraisal Practice (USPAP).
This is a summary appraisal, which is intended to comply with the reporting requirements set forth under Standards Rule 2-2(b) of the Uniform Standards of Professional Appraisal Practice. As such, it presents limited discussions of the data, reasoning, or analyses used in the appraisal process to develop the appraisers' opinion of value. Additional supporting documentation concerning the data, reasoning, and analyses is retained in our files. The depth of discussion contained in this report is specific to the needs of the client and for the intended use stated within the report.
Cushman & Wakefield, Inc. has performed a previous appraisal of the subject property within the three years prior to this assignment.
Cushman & Wakefield, Inc. has an internal Quality Control Oversight Program. This Program mandates a “second read” of all appraisals. Assignments prepared and signed solely by designated members (MAIs) are read by another MAI who is not participating in the assignment. Assignments prepared, in whole or in part, by non-designated appraisers require MAI participation, Quality Control Oversight, and signature.
The scope of this appraisal required collecting primary and secondary data relevant to the subject property. We investigated numerous land sales, improved building sales, and condominium unit sales in the subject’s market, analyzed rental data, and considered the input of buyers, sellers, brokers, property developers and public officials. We made a physical inspection of the exterior of the subject property. We also investigated the general regional economy as well as the specifics of the subject property’s local area.
The data have been thoroughly analyzed and confirmed with sources believed to be reliable, leading to the value conclusions in this report. The valuation process used generally accepted market-derived methods and procedures appropriate to the assignment.
This appraisal employs the Sales Comparison Approach. Based on our analysis and knowledge of the subject property type and relevant investor profiles, it is our opinion that only this approach would be considered meaningful and applicable in developing a credible value conclusion. As part of the agreed upon scope of work for this report, the appraisers analyzed the subject property as a stand-alone asset without consideration to the other assets comprising the Long Island College Hospital campus.
02137

82 AMITY STREET INTRODUCTION 2
I D E N T I F I C A T I O N O F P R O P E R T Y Common Property Name: Three-Story Shell Building
Location: The subject property is located at 82 Amity Street in Brooklyn, Kings County, New York 11201
Assessor's Parcel
Numbers:
Block 295, Lot 11
Legal Description: A metes and bounds legal description for the subject property has been retained in the files of the appraisers.
P R O P E R T Y O W N E R S H I P A N D R E C E N T H I S T O R Y Current Ownership: Downstate at LICH Holding Company, Inc.
Sale History: Title of the subject property, as well as the other buildings that comprise the Long Island College Hospital campus, was transferred to current ownership in May 2011 according to public records. The allocated price for the subject property was $1,200,000. We have not been provided the details of the acquisition nor the methodology used in ownership’s allocation process.
To the best of our knowledge, there have been no other arm’s-length transfers of the subject property within the last three years.
Current Disposition: To the best of our knowledge, the subject property is not being marketed for sale or under contract.
D A T E S O F I N S P E C T I O N A N D V A L U A T I O N Dates of Valuation: October 1, 2013
Date of Inspection: October 1, 2013 (exterior only)
Property Inspected by: Michael J. Garcia performed an exterior inspection of the improvements. An interior inspection of the improvements was undertaken as part of a prior assignment in 2010.
C L I E N T , I N T E N D E D U S E A N D U S E R S O F T H E A P P R A I S A L Client: Cozen O'Connor
Intended Use: The appraisal determines the Market Value of the Fee Simple Interest of the subject property in its as is condition. The report is to be used in connection with an internal review by the client for decision making purposes regarding the asset and in contemplation of potential litigation involving the subject and other assets. This report is not intended for any other use.
Intended Users: This report is for use and benefit of, and may be relied upon by Cozen O'Connor and its client, Downstate at LICH Holding Co, Inc. Use of this report by others is not
02138

82 AMITY STREET INTRODUCTION 3
intended by the appraisers.
E X T R A O R D I N A R Y A S S U M P T I O N S This appraisal employs two extraordinary assumptions. 1) The subject property, along with all of the other buildings that are part of the hospital campus, is currently under the ownership of Downstate at LICH Holding Company, Inc. This appraisal assumes that the subject property is marketed as an individual property and not as a group of properties to be sold in bulk. 2) The appraisers inspected the interior of the asset in September 2010. We have assumed no change in conditions observed from the prior inspection.
H Y P O T H E T I C A L C O N D I T I O N S This appraisal does not employ any hypothetical conditions.
02139

82 AMITY STREET NEW YORK CITY REGIONAL ANALYSIS 4
New York City Regional Analysis REGIONAL MAP
02140
82 AMITY STREET NEW YORK CITY REGIONAL ANALYSIS 5
I N T R O D U C T I O N
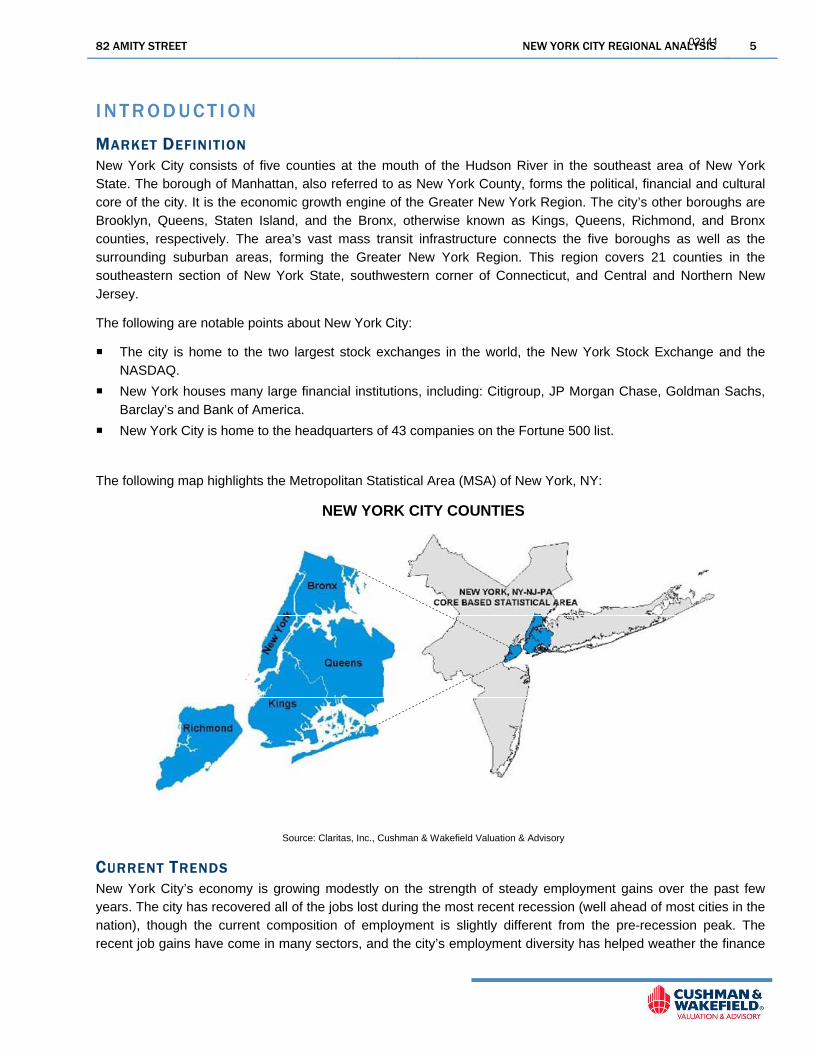
MARKET DEFINITION New York City consists of five counties at the mouth of the Hudson River in the southeast area of New York State. The borough of Manhattan, also referred to as New York County, forms the political, financial and cultural core of the city. It is the economic growth engine of the Greater New York Region. The city’s other boroughs are Brooklyn, Queens, Staten Island, and the Bronx, otherwise known as Kings, Queens, Richmond, and Bronx counties, respectively. The area’s vast mass transit infrastructure connects the five boroughs as well as the surrounding suburban areas, forming the Greater New York Region. This region covers 21 counties in the southeastern section of New York State, southwestern corner of Connecticut, and Central and Northern New Jersey.
The following are notable points about New York City:
The city is home to the two largest stock exchanges in the world, the New York Stock Exchange and the NASDAQ.
New York houses many large financial institutions, including: Citigroup, JP Morgan Chase, Goldman Sachs, Barclay’s and Bank of America.
New York City is home to the headquarters of 43 companies on the Fortune 500 list.
The following map highlights the Metropolitan Statistical Area (MSA) of New York, NY:
NEW YORK CITY COUNTIES
Source: Claritas, Inc., Cushman & Wakefield Valuation & Advisory
CURRENT TRENDS New York City’s economy is growing modestly on the strength of steady employment gains over the past few years. The city has recovered all of the jobs lost during the most recent recession (well ahead of most cities in the nation), though the current composition of employment is slightly different from the pre-recession peak. The recent job gains have come in many sectors, and the city’s employment diversity has helped weather the finance
02141

82 AMITY STREET NEW YORK CITY REGIONAL ANALYSIS 6
industry’s struggles. A major source of recent economic growth has been the city’s tourism industry. NYC & Co. reports that New York City had a record 52.0 million visitors in 2012. Healthy tourism is generating revenue for both the retail and hospitality sectors. This boom in the industry explains the city’s expansion in related employment sectors, and will continue to help the local economy.
Another bright spot for the city has been its tech sector. Major companies like Google and Facebook have been joined by small startups throughout the city in creating a thriving tech ecosystem. According to a 2013 study presented at the Bloomberg Technology Summit, the city’s tech boom has been responsible for roughly one-third of its private sector job creation since 2007. New York City’s government is helping to nurture the growth with economic development and education initiatives. As a result, Cornell, NYU, and Columbia are all opening or expanding tech campuses in the city, in an effort to meet the need for highly educated workers.
Despite the city’s strong job growth, not all of the jobs added have been high quality and well-paying professional positions. As Wall Street remains stagnant in terms of hiring, the tourism industry has created thousands of low-paying retail jobs. This tradeoff is likely to have a negative impact on New York City’s average household income. Moreover, New York City’s unemployment rate remains above the nation’s well into 2013.
Further considerations are as follows:
To support the city’s tech industry, the mayor’s office launched a campaign in February 2013 called “We Are Made in NY”. The initiative will help jobseekers find tech opportunities and organize resources and benefits for startups.
Long Island College Hospital in Brooklyn is currently slated to close permanently. Community opposition has stalled the closure twice so far in 2013, and a state Supreme Court justice put a temporary hold on the closure in September. A shutdown would result in thousands of lost jobs.
A September 2013 report from the New York Building Congress found that $7.9 billion worth of construction projects were started in New York City in the first half of 2013, a 10.0 percent increase from the first half of 2012.
In September 2013, the City Planning Commission approved a plan for what will be the world’s largest Ferris Wheel. The project, which will be located on Staten Island adjacent to a proposed outlet mall, needs to be approved by the City Council before proceeding.
Steiner Studios is spending up to $85.0 million to expand its film studio and production space at the Brooklyn Navy Yard. The studio is the largest movie and production facility east of Hollywood.
The New York City government selected a developer in September to redevelop a large city-owned site on the Lower East Side, referred to as the Seward Park sites. Plans for the redevelopment call for 1,000 units of housing, a bowling alley, an urban farm, tech incubator space, and the New York annex of the Andy Warhol museum.
D E M O G R A P H I C T R E N D S
DEMOGRAPHIC CHARACTERISTICS New York City exceeds national averages in household income at both the top and bottom of the spectrum. As a result, the city’s middle income brackets are relatively small. The high cost of living in New York City pushes out many of those who are not poor enough to qualify for subsidized rents or wealthy enough to afford market-rate housing. A 2012 study from the Center for Housing Policy found that for the decade ended in 2010, housing and transportation costs in New York City rose 55.0 percent. Over the same time period, income in the area only grew by 31.0 percent.
02142

82 AMITY STREET NEW YORK CITY REGIONAL ANALYSIS 7
The city also has a gap in educational attainment. A higher percentage of New York City residents are without a high school diploma than the national population, and likewise for residents with at least a bachelor’s degree.
Further considerations are as follows:
The median person in New York City is 36 years old, one year younger than the national median.
New York City’s average household income ($78,052) is significantly higher than the country’s ($69,636). When looking at median household income, however, the roles are reversed. Median income in New York is $49,047, while the country’s median household income is $49,231. Medians are typically a better measure of central tendency, as means are more easily influenced by outliers. As discussed above, New York is full of outliers at the upper and lower ends of the income scale.
A survey set released by the U.S. Census in September 2013 revealed that in 2011, 21.2 percent of New York City residents were under the poverty line, compared to only 15.9 percent for the nation as a whole. This marked the fourth straight year that the percentage increased. The stat seems to suggest that much of the region’s recent job growth has been in industries with low wages.
New York City is ahead of the national average in residents with at least a bachelor’s degree by 5.3 percentage points. The city boasts a large number of institutions of higher learning, along with industries that require such education. This makes New York City an attractive destination for many businesses.
The following table compares the demographic characteristics of New York City with those of the United States:
CharacteristicNew York
CityUnitedStates
Median Age (years) 36.0 37.0
Average Annual Household Income $78,052 $69,636
Median Annual Household Income $49,047 $49,231
<$25,000 28.4% 25.4%
$25,000 to $49,999 22.3% 25.3%
$50,000 to $74,999 16.0% 18.1%
$75,000 to $99,999 10.5% 11.7%
$100,000 plus 22.7% 19.5%
< High School 20.6% 14.6%
High School Graduate 25.1% 28.4%
College < Bachelor Degree 20.8% 28.9%
Bachelor Degree 19.9% 17.7%
Advanced Degree 13.5% 10.4%
Households by Annual Income Level:
Education Breakdown:
Source: Claritas, Inc., Cushman & Wakefield Valuation & Advisory
Demographic CharacteristicsNew York City vs. United States
2013 Estimates
POPULATION According to Moody’s Analytics, the current population of New York City is estimated at over 8.3 million. Rapid population growth is and always will be a challenge for New York City, as the densely populated metro area has little room for growth. The recent trend of redeveloping former industrial and office buildings into residential buildings could help, but the city will likely never grow as quickly as the rest of the country. Of all the boroughs, Brooklyn is expected to grow the most quickly in the near future, as its current renaissance continues. According to Moody’s Analytics, the borough is forecast to grow by an average annual rate of 0.5 percent through 2017.
02143
82 AMITY STREET NEW YORK CITY REGIONAL ANALYSIS 8
Further considerations are as follows:
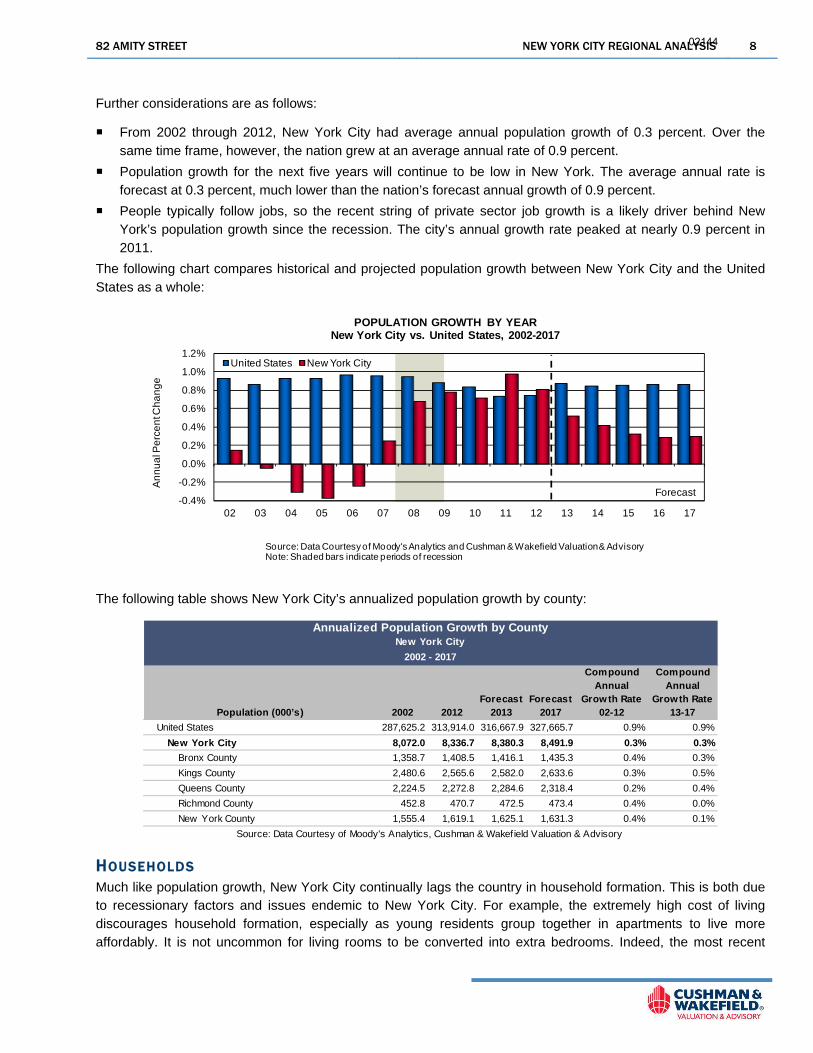
From 2002 through 2012, New York City had average annual population growth of 0.3 percent. Over the same time frame, however, the nation grew at an average annual rate of 0.9 percent.
Population growth for the next five years will continue to be low in New York. The average annual rate is forecast at 0.3 percent, much lower than the nation’s forecast annual growth of 0.9 percent.
People typically follow jobs, so the recent string of private sector job growth is a likely driver behind New York’s population growth since the recession. The city’s annual growth rate peaked at nearly 0.9 percent in 2011.
The following chart compares historical and projected population growth between New York City and the United States as a whole:
-0.4%
-0.2%
0.0%
0.2%
0.4%
0.6%
0.8%
1.0%
1.2%
02 03 04 05 06 07 08 09 10 11 12 13 14 15 16 17
An
nu
al P
erc
en
t Ch
an
ge
Source: Data Courtesy of Moody's Analytics and Cushman & Wakefield Valuation & Advisory Note: Shaded bars indicate periods of recession
POPULATION GROWTH BY YEAR New York City vs. United States, 2002-2017
United States New York City
Forecast
The following table shows New York City’s annualized population growth by county:
Population (000’s) 2002 2012Forecast
2013Forecast
2017
Compound Annual
Growth Rate02-12
Compound Annual
Growth Rate13-17
United States 287,625.2 313,914.0 316,667.9 327,665.7 0.9% 0.9%
New York City 8,072.0 8,336.7 8,380.3 8,491.9 0.3% 0.3%
Bronx County 1,358.7 1,408.5 1,416.1 1,435.3 0.4% 0.3%
Kings County 2,480.6 2,565.6 2,582.0 2,633.6 0.3% 0.5%
Queens County 2,224.5 2,272.8 2,284.6 2,318.4 0.2% 0.4%
Richmond County 452.8 470.7 472.5 473.4 0.4% 0.0%
New York County 1,555.4 1,619.1 1,625.1 1,631.3 0.4% 0.1%
Source: Data Courtesy of Moody's Analytics, Cushman & Wakefield Valuation & Advisory
Annualized Population Growth by CountyNew York City
2002 - 2017
HOUSEHOLDS Much like population growth, New York City continually lags the country in household formation. This is both due to recessionary factors and issues endemic to New York City. For example, the extremely high cost of living discourages household formation, especially as young residents group together in apartments to live more affordably. It is not uncommon for living rooms to be converted into extra bedrooms. Indeed, the most recent
02144

82 AMITY STREET NEW YORK CITY REGIONAL ANALYSIS 9
census data show that New York City leads the nation in nonfamily households, with almost 60.0 percent of households having members with no familial relationship.
Further considerations are as follows:
From 2002 to 2012, household formation in the city grew at an average annual rate of 0.3 percent, lower than the national rate of 1.0 percent per year.
Over the next five years, the city’s average growth rate is expected to be 0.6 percent per year, half that of the nation’s.
The chart below compares historical and projected household formation growth between New York City and the United States as a whole:
0.0%
0.2%
0.4%
0.6%
0.8%
1.0%
1.2%
1.4%
02 03 04 05 06 07 08 09 10 11 12 13 14 15 16 17
An
nu
al P
erc
en
t Ch
an
ge
Source: Data Courtesy of Moody's Analytics and Cushman & Wakefield Valuation & Advisory Note: Shaded bars indicate periods of recession
HOUSEHOLD FORMATION BY YEAR New York City vs. United States, 2002-2017
United States New York City Forecast
E C O N O M I C T R E N D S
GROSS METRO PRODUCT One of the city’s biggest new growth drivers since the recession is the tech industry. Giants like Microsoft, eBay, Yahoo!, Google, Facebook, Twitter, and LinkedIn have been expanding, while smaller tech firms and startups are popping up in “Silicon Alley”. Notable among these are Kickstarter, Gilt Groupe, and Tumblr. A May 2012 study from the Center for an Urban Future found that New York City has the fastest growing tech industry in the country. The industry has also been one of the biggest consumers of office space in the city in recent quarters. Expansion is expected to continue as Cornell University’s proposed $2.0 billion high-tech graduate school on Roosevelt Island begins to come to fruition. It may take some time before new jobs and businesses arise from the initiative, but the industry will continue to own a growing share of the city’s economic output.
Though economic growth in early 2013 was relatively slow due to fears of sequestration, the pace has picked up going into the second half of the year. According to Moody’s Analytics, the city’s economy is expected to have grown by over 2.0 percent by the end of the year, outpacing the nation’s growth. The city’s economy is well-diversified now, and growth will further intensify when financial companies return to growth.
Further considerations are as follows:
02145

82 AMITY STREET NEW YORK CITY REGIONAL ANALYSIS 10
For the purpose of comparing the economies of New York City and the United States, we use Gross Metro Product (GMP) and Gross Domestic Product (GDP), respectively. The measures are analogous in what they attempt to capture, but GDP is on a much larger scale than GMP.
From 2002 through 2012, New York City averaged 1.9 percent annual GMP growth, slightly better than the nation’s annual GDP growth of 1.8 percent over the same time period.
The city’s GMP growth is expected to outpace the nation’s GDP growth over the next five years, growing by an annual average rate of 3.6 percent. The nation’s GDP is forecast to have 3.1 percent annual growth.
The following chart compares historical and projected GMP growth by year for New York City and GDP growth for the United States:
-4.0%-3.0%-2.0%-1.0%0.0%1.0%2.0%3.0%4.0%5.0%6.0%7.0%
02 03 04 05 06 07 08 09 10 11 12 13 14 15 16 17
An
nu
al P
erc
en
t Ch
an
ge
Source: Data Courtesy of Moody's Analytics and Cushman & Wakefield Valuation & Advisory Note: Shaded bars indicate periods of recession
REAL GROSS PRODUCT GROWTH BY YEAR New York City vs. United States, 2002-2017
United States
New York City
Forecast
EMPLOYMENT DISTRIBUTION New York City is heavily weighted in office-using employment sectors, which comprise 31.5 percent of jobs compared to 24.4 percent for the nation. This helps to explain the high wages and job growth found in the metro area. Furthermore, the city’s abundance of service jobs has shielded it from the gradual decay in manufacturing employment across the nation.
Further considerations are as follows:
More New York City workers are employed in education/health services than in any other sector, comprising 20.6 percent of the workforce. The national representation for this sector is currently at 15.3 percent.
The sector with the lowest employment representation in the city is manufacturing, which accounts for only 1.9 percent of the workforce. By contrast, the sector accounts for 8.8 percent of national employment. This is a reflection of the service heavy orientation of New York City, the high cost of land, and the lack of space for large manufacturing facilities.
New York City employment in the financial activities sector is nearly double that of the national proportion, with 11.1 percent of city workers in the field. This is not surprising, as New York City is the financial capital of the United States and home to Wall Street.
The area also has more than two times the information sector representation than the rest of the country. Recent growth in this sector is a result of the tech boom.
The following chart compares non-farm employment sectors for New York City and the United States as a whole:
02146

82 AMITY STREET NEW YORK CITY REGIONAL ANALYSIS 11
0% 3% 6% 9% 12% 15% 18% 21%
Construction
Manufacturing
Trade, Transportation & Utilities
Information
Financial Activities
Professional & Business Services
Education & Health Services
Leisure & Hospitality
Other Services (except Govt.)
Government
Source: Data Courtesy of Moody's Analytics and Cushman & Wakefield Valuation & Advisory
EMPLOYMENT BY SECTOR New York City vs. United States
2013 Estimates
United States
New York City
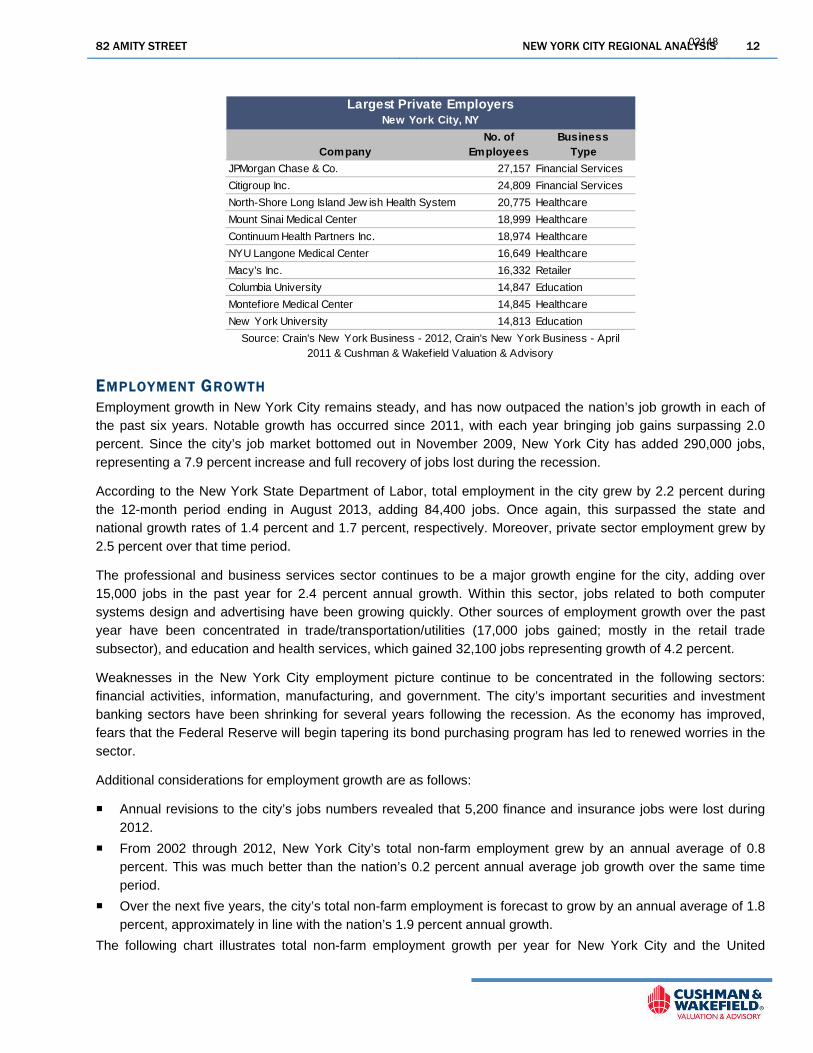
MAJOR EMPLOYERS New York City’s major employers are a good reflection of the city’s employment distribution. Just as many New York City jobs are in education/health services and financial activities, many of the largest employers are found in those sectors. Of the ten largest private employers in the city, five work in healthcare, two are schools, two are banks, and one is a major retailer.
Further considerations are as follows:
JP Morgan Chase & Co. and Citigroup Inc. are the two largest private sector employers, employing almost 52,000 people combined. Their appearance on this list is not surprising, given New York’s status in the financial world, but their payrolls have been decreasing in 2012 and into 2013.
As previously stated, the education/health services sector is the largest in the city, and the rest of the list reflects this. In addition to New York City’s most renowned schools (NYU and Columbia), the five largest hospitals (North-Shore Long Island Jewish Health System, Mount Sinai Medical Center, Continuum Health Partners, NYU Langone Medical Center, and Montefiore Medical Center) employ over 90,000 New Yorkers.
The following table lists New York City’s largest private employers:
02147
82 AMITY STREET NEW YORK CITY REGIONAL ANALYSIS 12
CompanyNo. of
EmployeesBusiness
Type
JPMorgan Chase & Co. 27,157 Financial Services
Citigroup Inc. 24,809 Financial Services
North-Shore Long Island Jew ish Health System 20,775 Healthcare
Mount Sinai Medical Center 18,999 Healthcare
Continuum Health Partners Inc. 18,974 Healthcare
NYU Langone Medical Center 16,649 Healthcare
Macy's Inc. 16,332 Retailer
Columbia University 14,847 Education
Montefiore Medical Center 14,845 Healthcare
New York University 14,813 Education
Largest Private EmployersNew York City, NY
Source: Crain's New York Business - 2012, Crain's New York Business - April 2011 & Cushman & Wakefield Valuation & Advisory
EMPLOYMENT GROWTH Employment growth in New York City remains steady, and has now outpaced the nation’s job growth in each of the past six years. Notable growth has occurred since 2011, with each year bringing job gains surpassing 2.0 percent. Since the city’s job market bottomed out in November 2009, New York City has added 290,000 jobs, representing a 7.9 percent increase and full recovery of jobs lost during the recession.
According to the New York State Department of Labor, total employment in the city grew by 2.2 percent during the 12-month period ending in August 2013, adding 84,400 jobs. Once again, this surpassed the state and national growth rates of 1.4 percent and 1.7 percent, respectively. Moreover, private sector employment grew by 2.5 percent over that time period.
The professional and business services sector continues to be a major growth engine for the city, adding over 15,000 jobs in the past year for 2.4 percent annual growth. Within this sector, jobs related to both computer systems design and advertising have been growing quickly. Other sources of employment growth over the past year have been concentrated in trade/transportation/utilities (17,000 jobs gained; mostly in the retail trade subsector), and education and health services, which gained 32,100 jobs representing growth of 4.2 percent.
Weaknesses in the New York City employment picture continue to be concentrated in the following sectors: financial activities, information, manufacturing, and government. The city’s important securities and investment banking sectors have been shrinking for several years following the recession. As the economy has improved, fears that the Federal Reserve will begin tapering its bond purchasing program has led to renewed worries in the sector.
Additional considerations for employment growth are as follows:
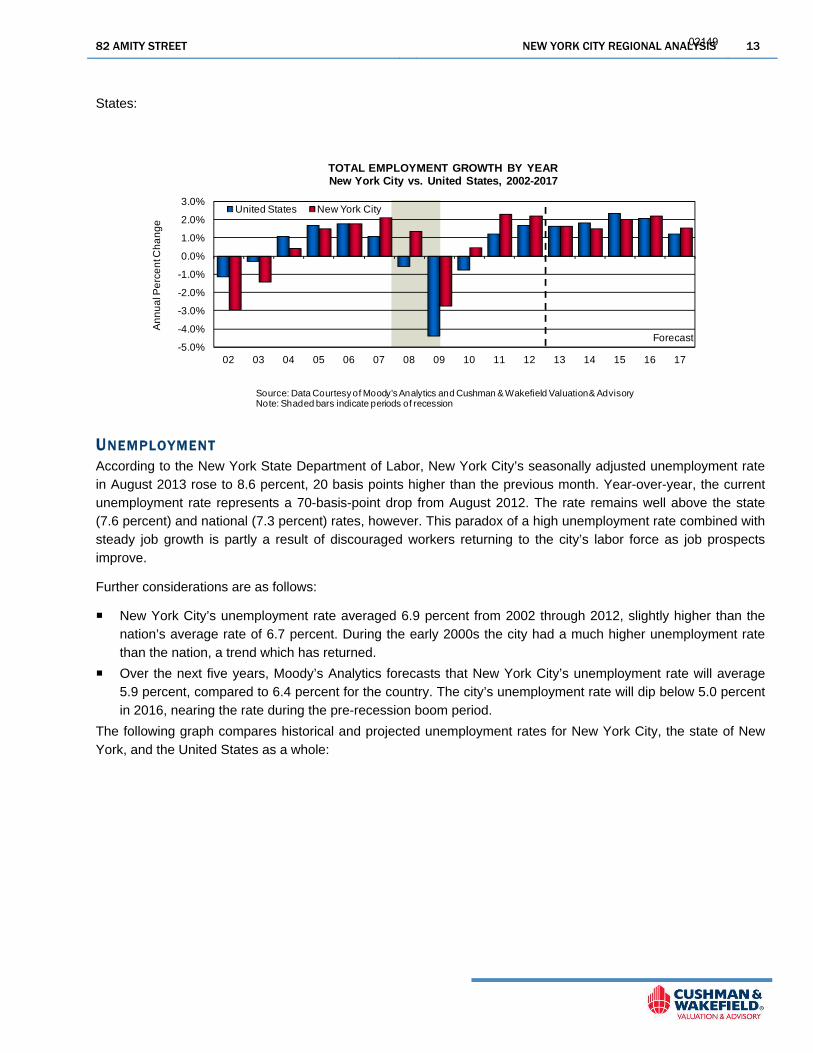
Annual revisions to the city’s jobs numbers revealed that 5,200 finance and insurance jobs were lost during 2012.
From 2002 through 2012, New York City’s total non-farm employment grew by an annual average of 0.8 percent. This was much better than the nation’s 0.2 percent annual average job growth over the same time period.
Over the next five years, the city’s total non-farm employment is forecast to grow by an annual average of 1.8 percent, approximately in line with the nation’s 1.9 percent annual growth.
The following chart illustrates total non-farm employment growth per year for New York City and the United
02148
82 AMITY STREET NEW YORK CITY REGIONAL ANALYSIS 13
States:
-5.0%
-4.0%
-3.0%
-2.0%
-1.0%
0.0%
1.0%
2.0%
3.0%
02 03 04 05 06 07 08 09 10 11 12 13 14 15 16 17
An
nu
al P
erc
en
t Ch
an
ge
Source: Data Courtesy of Moody's Analytics and Cushman & Wakefield Valuation & Advisory Note: Shaded bars indicate periods of recession
TOTAL EMPLOYMENT GROWTH BY YEAR New York City vs. United States, 2002-2017
United States New York City
Forecast
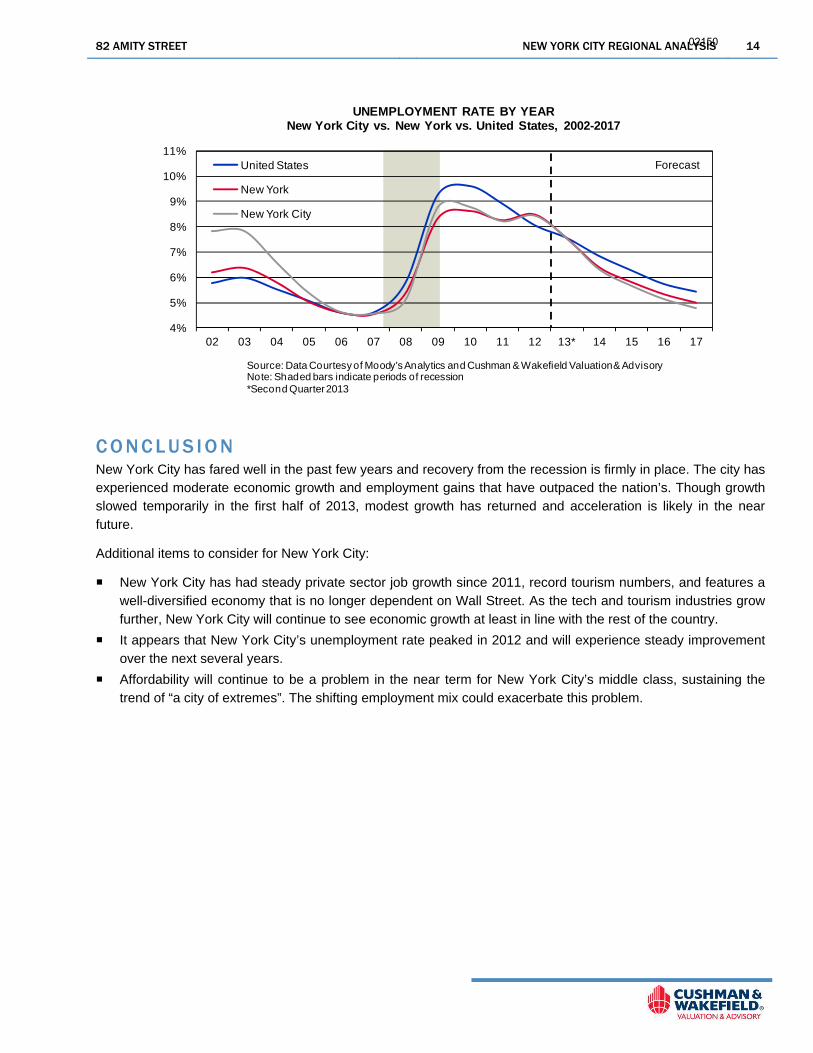
UNEMPLOYMENT According to the New York State Department of Labor, New York City’s seasonally adjusted unemployment rate in August 2013 rose to 8.6 percent, 20 basis points higher than the previous month. Year-over-year, the current unemployment rate represents a 70-basis-point drop from August 2012. The rate remains well above the state (7.6 percent) and national (7.3 percent) rates, however. This paradox of a high unemployment rate combined with steady job growth is partly a result of discouraged workers returning to the city’s labor force as job prospects improve.
Further considerations are as follows:
New York City’s unemployment rate averaged 6.9 percent from 2002 through 2012, slightly higher than the nation’s average rate of 6.7 percent. During the early 2000s the city had a much higher unemployment rate than the nation, a trend which has returned.
Over the next five years, Moody’s Analytics forecasts that New York City’s unemployment rate will average 5.9 percent, compared to 6.4 percent for the country. The city’s unemployment rate will dip below 5.0 percent in 2016, nearing the rate during the pre-recession boom period.
The following graph compares historical and projected unemployment rates for New York City, the state of New York, and the United States as a whole:
02149
82 AMITY STREET NEW YORK CITY REGIONAL ANALYSIS 14
Forecast
4%
5%
6%
7%
8%
9%
10%
11%
02 03 04 05 06 07 08 09 10 11 12 13* 14 15 16 17
Source: Data Courtesy of Moody's Analytics and Cushman & Wakefield Valuation & Advisory Note: Shaded bars indicate periods of recession*Second Quarter 2013
UNEMPLOYMENT RATE BY YEAR New York City vs. New York vs. United States, 2002-2017
United States
New York
New York City
C O N C L U S I O N New York City has fared well in the past few years and recovery from the recession is firmly in place. The city has experienced moderate economic growth and employment gains that have outpaced the nation’s. Though growth slowed temporarily in the first half of 2013, modest growth has returned and acceleration is likely in the near future.
Additional items to consider for New York City:
New York City has had steady private sector job growth since 2011, record tourism numbers, and features a well-diversified economy that is no longer dependent on Wall Street. As the tech and tourism industries grow further, New York City will continue to see economic growth at least in line with the rest of the country.
It appears that New York City’s unemployment rate peaked in 2012 and will experience steady improvement over the next several years.
Affordability will continue to be a problem in the near term for New York City’s middle class, sustaining the trend of “a city of extremes”. The shifting employment mix could exacerbate this problem.
02150

82 AMITY STREET LOCAL AREA ANALYSIS 15
Local Area Analysis LOCAL AREA MAP
02151
82 AMITY STREET LOCAL AREA ANALYSIS 16
LOCATION OVERVIEW The subject property is located on the south side of Amity Street between Hicks Street and Henry Street. The subject property is located in the Cobble Hill neighborhood of Brooklyn. The subject property is also in proximity to, and influenced by, the Brooklyn Heights neighborhood, which is located directly to the north.
Cobble Hil l Cobble Hill is located in the northeastern portion of Brooklyn. The neighborhood is generally delineated by Atlantic Avenue to the north, the Brooklyn-Queens Expressway to the west, Degraw Street to the south, and Smith Street to the east. Surrounding neighborhoods include Boerum Hill to the east, Carroll Gardens to the south and Brooklyn Heights and Downtown Brooklyn to the north.
Cobble Hill is known for its specialty shops and residential character. It is considered one of the premiere residential neighborhoods in Brooklyn.
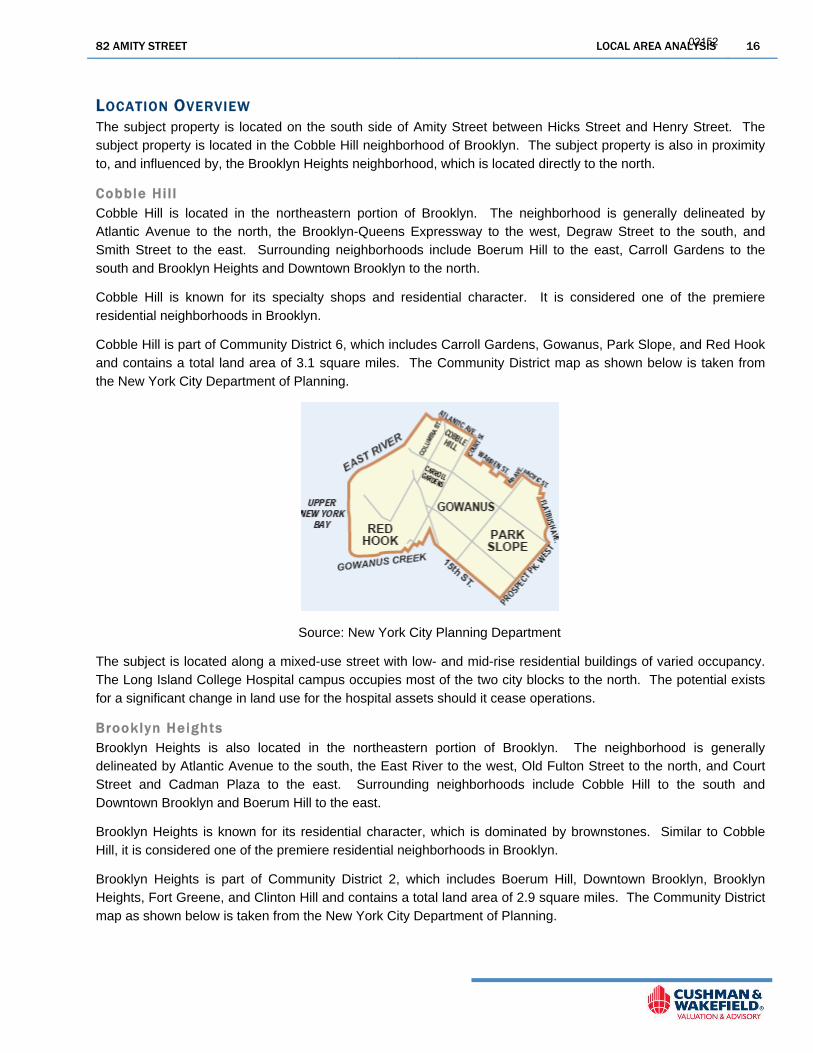
Cobble Hill is part of Community District 6, which includes Carroll Gardens, Gowanus, Park Slope, and Red Hook and contains a total land area of 3.1 square miles. The Community District map as shown below is taken from the New York City Department of Planning.
Source: New York City Planning Department
The subject is located along a mixed-use street with low- and mid-rise residential buildings of varied occupancy. The Long Island College Hospital campus occupies most of the two city blocks to the north. The potential exists for a significant change in land use for the hospital assets should it cease operations.
Brooklyn Heights Brooklyn Heights is also located in the northeastern portion of Brooklyn. The neighborhood is generally delineated by Atlantic Avenue to the south, the East River to the west, Old Fulton Street to the north, and Court Street and Cadman Plaza to the east. Surrounding neighborhoods include Cobble Hill to the south and Downtown Brooklyn and Boerum Hill to the east.
Brooklyn Heights is known for its residential character, which is dominated by brownstones. Similar to Cobble Hill, it is considered one of the premiere residential neighborhoods in Brooklyn.
Brooklyn Heights is part of Community District 2, which includes Boerum Hill, Downtown Brooklyn, Brooklyn Heights, Fort Greene, and Clinton Hill and contains a total land area of 2.9 square miles. The Community District map as shown below is taken from the New York City Department of Planning.
02152

82 AMITY STREET LOCAL AREA ANALYSIS 17
Source: New York City Planning Department
BROOKLYN BRIDGE PARK – CONCEPT PLAN One of the largest scale land use changes in the area will directly and positively impact the neighborhoods in proximity to it. The Concept Plan for Brooklyn Bridge Park presents a compelling vision for the 70-acre Brooklyn Bridge Park extending 1.3 miles along the East River from Atlantic Avenue to Jay Street.
The Park will offer a dramatic range of landscapes. In some places, the natural shoreline will likely be maintained or re-established amid the dominance of marine infrastructure. In other places, the industrial terrain will be transformed into rolling lawns and more carefully tailored urban landscapes for all types of outdoor activities. The Park design is proposed to integrate public art while respecting the site's unique historic context and marine environment.
The Plan also includes buildings that reflect the energy of urban life. There will be an indoor athletic complex hosting swimming, ice-skating, and other all-season activities. A new hotel and restaurants are designed to attract people into the Park in the evenings year round. Casual dining experiences will be interspersed throughout the Park. Perhaps most importantly, there will be places for the arts, education, and cultural facilities that celebrate the diverse history of this site and greater Brooklyn. Such uses will include an environmental education center and space for community performing arts. Public art will grace the Park. The Park's dominant icon, the majestic Brooklyn Bridge, will remain its centerpiece.
From south to north, the Plan identifies five interconnected areas: Atlantic Avenue Gateway, possibly Pier 6 with Piers 5-2 and their associated uplands, Pier I and Fulton Ferry landing, the Inter-bridge Area, and the Manhattan Bridge Gateway. Major access points into the Park, dominant existing land features, and the powerful presence of the two bridges define these areas. These elements will create natural focal points and transition zones within the Park.
The Park will connect to surrounding neighborhoods, the city, and the region by both land and water. The park experience will extend up from the water's edge along Atlantic Avenue and Old Fulton Street and into the surrounding neighborhoods. Access will also be by automobile, mass transit and possibly, ferry service. Over time, it is expected that the existing water taxi system serving the Park could link the Park to other parks along the Brooklyn waterfront in Red Hook and Williamsburg and to other harbor destinations such as Governor's Island, Ellis Island, and the Statue of Liberty. The Park's operating budget will include funds for a shuttle connecting the Park to local transit stops.
It has been a fundamental Park planning principle since 1992 that the Park should be economically self-sustaining rather than rely on scarce public funds. The Concept Plan presents a range of uses that are intended
02153

82 AMITY STREET LOCAL AREA ANALYSIS 18
to achieve that objective. Maintaining and operating the Park to the highest standards will require adequate revenues generated and retained within the Park. These funds will be dedicated entirely to Park uses including, high level maintenance, safety, and operation of a shuttle system. They will also support arts, cultural, educational and recreational programming. It is anticipated that programming will be further supplemented by private and community funding.
The Concept Plan presents a unified vision for a park that harmonizes multiple requirements. Each of these civic needs should be accommodated within an innovative approach to a sustainable ecological environment. The five areas offer a full range of park experiences and landscape types. The landscape provides opportunities to showcase public art as well as functional spaces for community events. The buildings will provide diverse programmatic.
Brooklyn Bridge Park operates under a mandate to be financially self sustaining. This mandate was memorialized in the Memorandum of Understanding signed by Governor George Pataki and Mayor Michael Bloomberg in 2002 that created Brooklyn Bridge Park. While a small fraction of the required operations and maintenance funds for the park will be collected from concessions located throughout the park, the majority of the funds will come from a limited number of revenue-generating development sites within the project’s footprint. The development program was determined after an in-depth analysis of the potential development types and locations. The analysis focused on finding uses that would (1) generate sufficient revenue to support park operations, (2) minimize the size of the required development footprint, and (3) be compatible with the surrounding park and neighborhood uses. Development locations were chosen to (1) take advantage of the existing urban context by concentrating development on the city side of the site, particularly around the park entrances (2) maintain the protected view corridor from the Brooklyn Heights Promenade, and (3) create vital, active urban junctions at each of the park’s three main entrances.
CONCLUSION The subject property is located in an established and very desirable neighborhood in Brooklyn. Brooklyn Heights and Cobble Hill are considered to be among the premiere neighborhoods in the borough and command premiums in pricing and rental rates compared to other areas. The area is considered to be adequately served by public transportation and major thoroughfares that provide access to employment centers of Manhattan and Downtown Brooklyn. Brooklyn Heights and Cobble Hill are heavily built up and there are few areas with developable land. The expected supply of new competitive inventory in Brooklyn Heights and Cobble Hill is expected to be minimal. The subject neighborhood is highly sought after by residential tenants and the overall long-term outlook for this area is positive.
02154

82 AMITY STREET PROPERTY ANALYSIS 19
Property Analysis
S I T E D E S C R I P T I O N
Location: 82 Amity Street
Brooklyn, Kings County, New York 11201
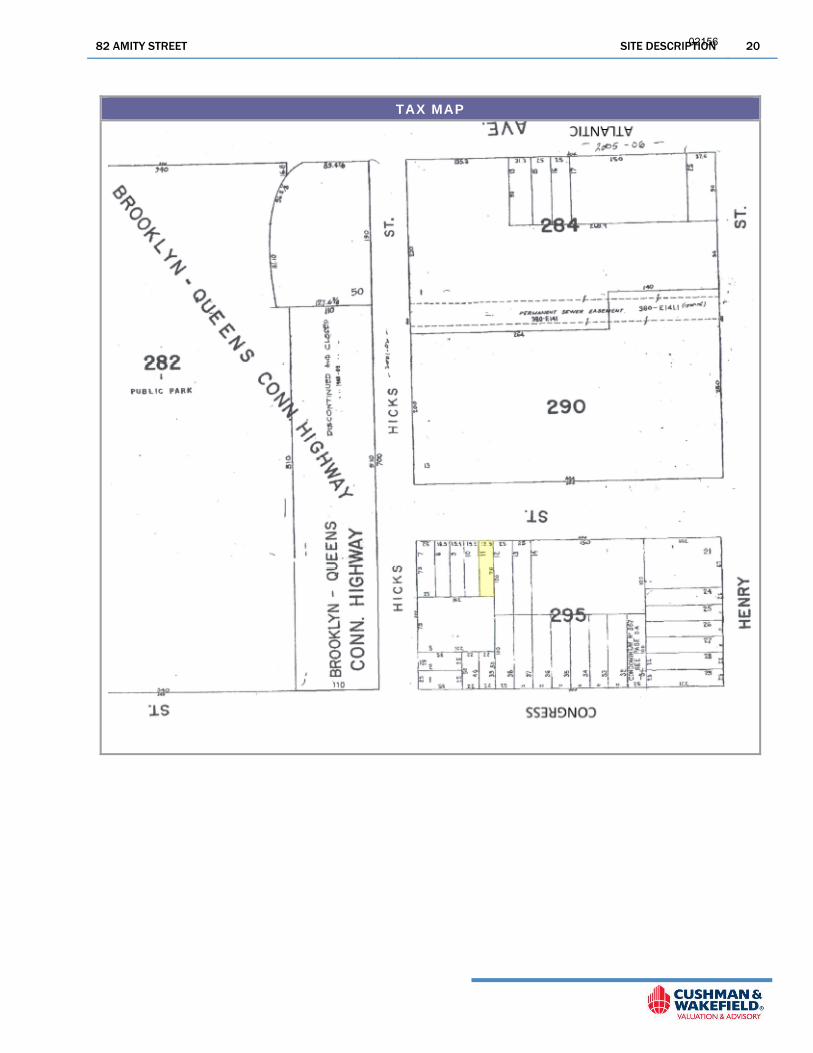
The subject property is located on the south side of Amity Street between Hicks Street and Henry Street.
Shape: Rectangular
Topography: Level and at street grade
Land Area: 0.03 acres / 1,481 square feet
Frontage: The subject site has average frontage. The frontage dimensions are listed below:
Amity Street: 19.75 feet
Access: The subject site has average access.
Visibility: The subject site has average visibility.
Soil Conditions: We were not given a soil report to review. However, we assume that the soil's load-bearing capacity is sufficient to support the existing structure. We did not observe any evidence to the contrary during our physical inspection of the property. Drainage appears to be adequate.
Utilities: All municipal/public utilities are provided and available to the site.
Site Improvements: Typical city improvements including macadam paved streets, street lighting, concrete sidewalks, curbs and gutters and below ground utilities.
Land Use Restrictions: We were not given a title report to review. We do not know of any easements, encroachments, or restrictions that would adversely affect the subject’s use. We recommend a title search to determine whether any adverse conditions exist.
Flood Zone Description: The subject property is located in flood zone X (Areas determined to be outside the500 year flood plain) as indicated by FEMA Map 360497-0203F, dated September 5, 2007.
Hazardous Substances: We observed no evidence of toxic or hazardous substances during our inspection of the site. However, we are not trained to perform technical environmental inspections and recommend the hiring of a professional engineer with expertise in this field.
Overall Site Utility: The subject site is functional for its current use.
Location Rating: Good
02155
82 AMITY STREET SITE DESCRIPTION 20
TAX MAP
02156
82 AMITY STREET IMPROVEMENTS DESCRIPTION 21
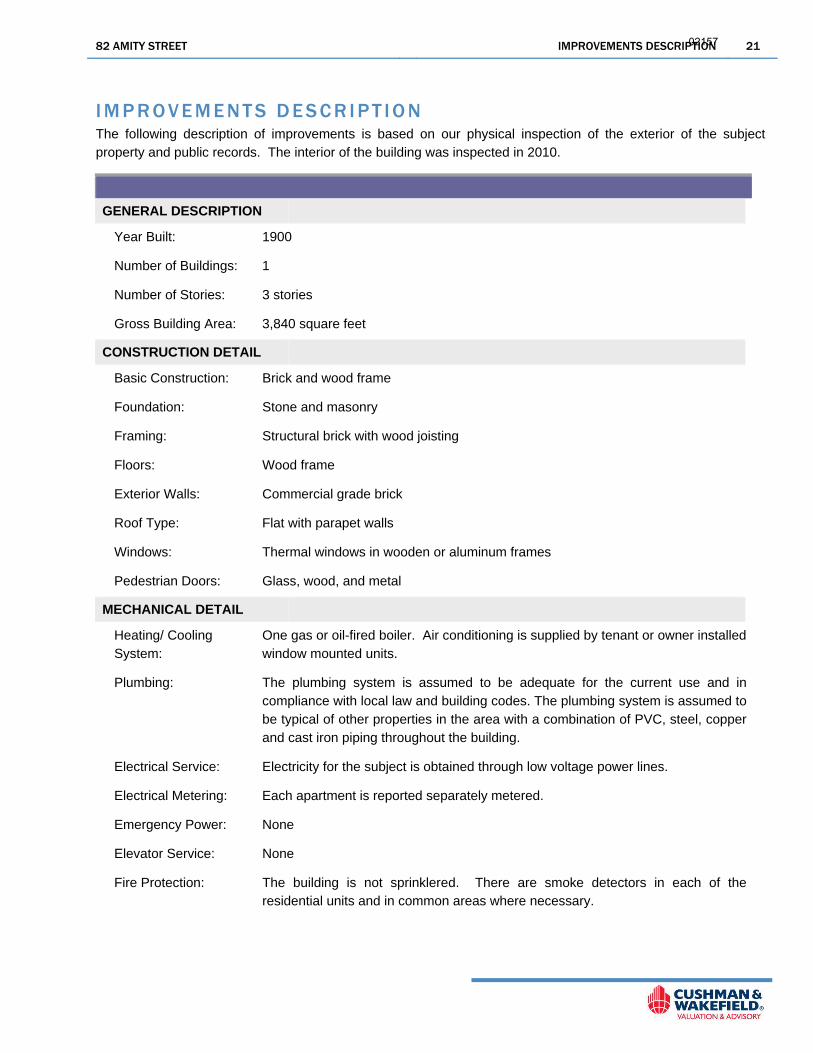
I M P R O V E M E N T S D E S C R I P T I O N The following description of improvements is based on our physical inspection of the exterior of the subject property and public records. The interior of the building was inspected in 2010.
GENERAL DESCRIPTION
Year Built: 1900
Number of Buildings: 1
Number of Stories: 3 stories
Gross Building Area: 3,840 square feet
CONSTRUCTION DETAIL
Basic Construction: Brick and wood frame
Foundation: Stone and masonry
Framing: Structural brick with wood joisting
Floors: Wood frame
Exterior Walls: Commercial grade brick
Roof Type: Flat with parapet walls
Windows: Thermal windows in wooden or aluminum frames
Pedestrian Doors: Glass, wood, and metal
MECHANICAL DETAIL
Heating/ Cooling System:
One gas or oil-fired boiler. Air conditioning is supplied by tenant or owner installed window mounted units.
Plumbing: The plumbing system is assumed to be adequate for the current use and in compliance with local law and building codes. The plumbing system is assumed to be typical of other properties in the area with a combination of PVC, steel, copper and cast iron piping throughout the building.
Electrical Service: Electricity for the subject is obtained through low voltage power lines.
Electrical Metering: Each apartment is reported separately metered.
Emergency Power: None
Elevator Service: None
Fire Protection: The building is not sprinklered. There are smoke detectors in each of the residential units and in common areas where necessary.
02157

82 AMITY STREET IMPROVEMENTS DESCRIPTION 22
Security: Locked front door and intercom system that allows residents to control visitor access.
INTERIOR DETAIL
Layout: The entrance to the subject property is located along the south side of Amity Street.
Floor Covering: Hardwood flooring in the living areas and bedrooms, vinyl tile flooring in the kitchens, and ceramic tile flooring in the bathrooms.
Walls: Painted gypsum wallboard
Ceilings: Painted gypsum wallboard
Lighting: Fluorescent and Incandescent
AMENITIES
Project Amenities: There are no building-wide amenities.
Unit Amenities: There are no in-unit amenities.
SITE IMPROVEMENTS
Parking: None
Onsite Landscaping: There is no on-site landscaping.
Other: Typical city improvements including macadam paved streets, street lighting, concrete sidewalks, curbs and gutters and below ground utilities.
PERSONAL PROPERTY
Personal property was excluded from our valuation.
SUMMARY
Condition: Fair
Quality: Average
02158

82 AMITY STREET REAL PROPERTY TAXES AND ASSESSMENTS 23
R E A L P R O P E R T Y T A X E S A N D A S S E S S M E N T S
CURRENT PROPERTY TAXES The subject property is located in the taxing jurisdiction of the City of New York. The assessor’s parcel identification number is Block 295, Lot 11.
PROPERTY CLASSIFICATION Real property within the five boroughs of New York City is given a tax class designation by the Department of Finance in conformance with the New York State Real Property Tax Law. Each tax classification has a specific tax rate, which is established annually. The tax classes are as follows:
Class 1 - Includes all primarily residential one, two and three family homes; residential condominiums of three dwelling units or less; residential condominiums of three stories or less that were originally built as condominiums; and certain vacant land zoned for residential use or adjoining improved Class 1 property.
Class 2 - Includes all other primarily residential properties that are not in Class 1, including cooperatives and all other residential condominiums. This classification does not include hotels, motels or other similar property.
Class 3 - Includes all utility corporations and special franchise properties, excluding land and certain buildings.
Class 4 - Includes all other properties, such as stores, warehouses, hotels and vacant land not classified as class 1.
The current assessments for the subject property are detailed below.
PROPERTY ASSESSMENT INFORMATION
Assessor's Parcel Number:Assessing Authority: City of New YorkTax Year: 2013/2014
ASSESSMENT INFORMATIONActual Transitional
Land: $30,453 $30,453Improvements: 25,387 25,387Taxable Assessment: $55,840 $55,840
TAX LIABILITY2012/2013 Class 2 Tax Rate 13.181%Property Taxes $7,360
Compiled by Cushman & Wakefield, Inc.
Block 295, Lot 11
The subject is a tax class 2A property. Taxes are estimated based on applying the Class 2 tax rate to the lower of the transitional or actual assessment. The 2012/2013 tax rate for a Class 2 property is 13.181 per $100 of assessed value. The 2013/2014 tax rates have yet to be established. We applied the 2012/2013 tax rate to the 2013/2014 transitional assessment. The total real estate tax obligation for the subject property, prior to exemption, equates to $7,360. The subject property is currently 100 percent exempt from real estate taxes.
02159

82 AMITY STREET ZONING 24
Z O N I N G
GENERAL INFORMATION The property is zoned R6 within the Limited Height District (LH-1) by the City of New York. A summary of the subject’s zoning is provided below:
ZONINGMunicipality Governing Zoning: City of New YorkCurrent Zoning: R6 within the Limited Height District (LH-1)Is proposed use permitted: YesPermitted Uses and General Regulations:
ZONING REQUIREMENTSMaximum Floor Area Ratio (FAR) - Residential - Wide Street 3.00 times lot areaMaximum Floor Area Ratio (FAR) - Residential - Narrow Street 2.20 times lot areaMaximum Floor Area Ratio (FAR) - Community Facility 4.80 times lot area
Compiled by Cushman & Wakefield, Inc.
R6 zoning districts are widely mapped in built-up, medium-density areas. The character of R6 districts can range fromneighborhoods with a diverse mix of building types and heights to large-scale “tower in the park” developments.Developers can choose between two sets of bulk regulations. Standard height factor regulations, introduced in 1961,produce small multifamily buildings on small zoning lots and, on larger lots, tall buildings that are set back from thestreet. Optional Quality Housing regulations produce high lot coverage buildings within height limits that often reflectthe scale of older, pre-1961 apartment buildings in the neighborhood.
Height Factor Regulations - Buildings developed pursuant to height factor regulations are often tall buildings set backfrom the street and surrounded by open space and on-site parking. The floor area ratio (FAR) in R6 districts rangesfrom 0.78 (for a single-story building) to 2.43 at a typical height of 13 stories; the open space ratio (OSR) ranges from27.5 to 37.5. Generally, the more open space, the taller the building. In the diagram, for example, 81% of the zoninglot with the 13-story building is required to be open space (2.43 FAR × 33.5 OSR). Thus, the maximum floor area ratiois achievable only where the zoning lot is large enough to accommodate a practical building footprint as well as therequired amount of open space. There are no height limits for height factor buildings although they must be set withina sky exposure plane which begins at a height of 60 feet above the street line and then slopes inward over the zoninglot. Off-street parking is required for 70% of a building’s dwelling units, or it can be waived if five or fewer spaces arerequired. Quality Housing Regulations - The optional Quality Housing regulations produce high lot coverage buildings set at ornear the street line. Height limitations ensure that these buildings are often more compatible with older buildings in theneighborhood. As an incentive for developers to choose the Quality Housing option outside the Manhattan Core,greater floor area ratio, and therefore, more apartments, is permitted for buildings on orwithin 100 feet of a widestreet than would be permitted under height factor regulations. The FAR is 3.0; the maximum base height beforesetback is 60 feet with a maximum building height of 70 feet. On a narrow street (beyond 100 feet of a wide street),the maximum FAR is 2.2; the maximum base height before setback is 45 feet with a maximum building height of 55feet. The area between a building’s street wall and the street line must be planted and the buildings must have interioramenities for the residents pursuant to the Quality Housing Program.
Off-street parking, which is not permitted in front of a building, is required for 50% of all dwelling units, less than forheight factor buildings because of the high lot coverage. Parking can be waived if five or fewer spaces are required.
SUBJECT PROPERTY CONFORMANCE The R6 zoning district permits a maximum FAR of 3.0 times the lot area for residential uses on, or within 100 feet of, a wide street and 2.2 times the lot size for residential uses on a narrow street. A wide street is defined by the New York City Department of Planning as a street that is at least 75 feet in width. In addition to the floor area ratios for residential use, the R6 zoning district allows for a floor area ratio of 4.8 times the lot size for community facility uses. Amity Street is 70 feet wide and is therefore considered a narrow street.
The LH-1 zoning district is a limited height district. Properties located in an R6 zoning district within this limited height area are restricted to a maximum building height of 50 feet.
In the Site Description section of the report, we indicated that the subject site contains 1,481 square feet based on our review of public records. Applying the maximum residential FAR of 2.2 times the lot to the site size indicates an as-of-right yield of 3,258 square feet. The current improvements have a total above grade gross building area of 3,840 square feet. The current improvements exceed the maximum bulk zoning regulations for
02160

82 AMITY STREET ZONING 25
the zoning district based on the FAR of 2.2 times the lot size. However, the improvements were constructed in 1900, prior to the implementation of the 1961 zoning regulations.
OTHER RESTRICTIONS We know of no deed restrictions, private or public, that further limit the subject property's use. The research required to determine whether or not such restrictions exist is beyond the scope of this appraisal assignment. Deed restrictions are a legal matter and only a title examination by an attorney or title company can usually uncover such restrictive covenants. We recommend a title examination to determine if any such restrictions exist.
ZONING CONCLUSIONS We analyzed the zoning requirements in relation to the subject property, and considered the compliance of the existing or proposed use. We are not experts in the interpretation of complex zoning ordinances but based on our review of public information and the provided documentation, the subject property appears to be a legal, pre-existing, non-conforming use.
Detailed zoning studies are typically performed by a zoning or land use expert, including attorneys, land use planners, or architects. The depth of our study correlates directly with the scope of this assignment, and it considers all pertinent issues that have been discovered through our due diligence.
We note that this appraisal is not intended to be a detailed determination of compliance, as that determination is beyond the scope of this real estate appraisal assignment.
The following is a detailed zoning map for the subject property.
02161

82 AMITY STREET ZONING 26
ZONING MAP
02162

82 AMITY STREET HIGHEST AND BEST USE 27
Valuat ion
H I G H E S T A N D B E S T U S E
HIGHEST AND BEST USE DEFINITION The Dictionary of Real Estate Appraisal, Fifth Edition (2010), a publication of the Appraisal Institute, defines the highest and best use as:
The most probable use of a property which is physically possible, appropriately justified, legally permissible, financially feasible, and which results in the highest value of the property being valued.
To determine the highest and best use we typically evaluate the subject property under two scenarios: as though vacant land and as presently improved. In both cases, the property’s highest and best use must meet the four criteria described above.
HIGHEST AND BEST USE OF PROPERTY AS THOUGH VACANT
Legally Permissible The zoning regulations in effect at the time of the appraisal determine the legal permissibility of a potential use of the subject property. As described in the Zoning section, the subject property is zoned R6 within the Limited Height District (LH-1) by the City of New York. Residential and community facility uses are permissible in this zoning district. We are not aware of any further legal restrictions that limit the potential uses of the subject. In addition, rezoning of the site is not likely due to the character of the area and the fact that it is located in a special purpose district.
Physically Possible The physical possibility of a use is dictated by the size, shape, topography, availability of utilities, and any other physical aspects of the site. The subject site contains 1,481 square feet. The site is rectangular in shape and level and at street grade. It has average frontage, average access, and average visibility. The overall utility of the site is considered to be average. All public utilities are available to the site including public water and sewer, gas, electric and telephone. Overall, the site is considered adequate to accommodate most small permitted development possibilities.
Financially Feasible and Maximally Productive In order to be seriously considered, a use must have the potential to provide a sufficient return to attract investment capital over alternative forms of investment. A positive net income or acceptable rate of return would indicate that a use is financially feasible. Financially feasible uses are those uses that can generate a profit over and above the cost of acquiring the site, and constructing the improvements. Of the uses that are permitted, possible, and financially feasible, the one that will result in the maximum value for the property is considered the highest and best use.
CONCLUSION We considered the legal issues related to zoning and legal restrictions. We also analyzed the physical characteristics of the site to determine what legal uses would be possible, and considered the financial feasibility of these uses to determine the use that is maximally productive.
Considering the subject property’s physical characteristics and location, as well as the state of the local market, it
02163
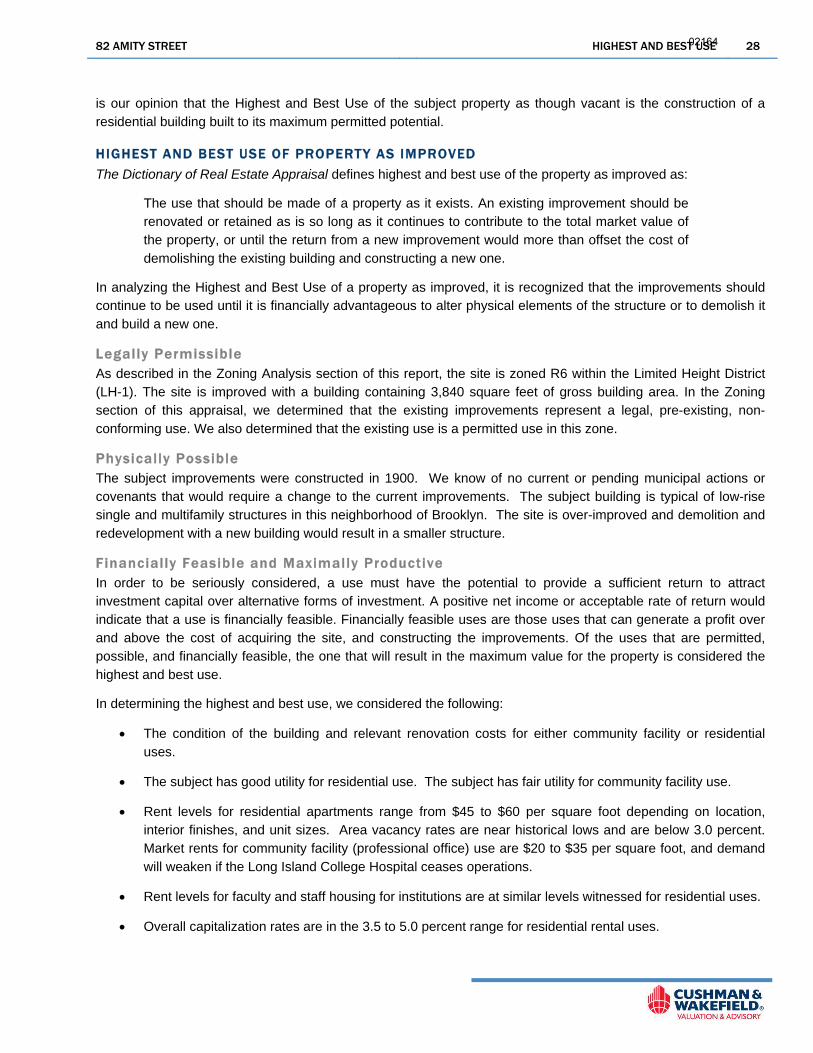
82 AMITY STREET HIGHEST AND BEST USE 28
is our opinion that the Highest and Best Use of the subject property as though vacant is the construction of a residential building built to its maximum permitted potential.
HIGHEST AND BEST USE OF PROPERTY AS IMPROVED The Dictionary of Real Estate Appraisal defines highest and best use of the property as improved as:
The use that should be made of a property as it exists. An existing improvement should be renovated or retained as is so long as it continues to contribute to the total market value of the property, or until the return from a new improvement would more than offset the cost of demolishing the existing building and constructing a new one.
In analyzing the Highest and Best Use of a property as improved, it is recognized that the improvements should continue to be used until it is financially advantageous to alter physical elements of the structure or to demolish it and build a new one.
Legally Permissible As described in the Zoning Analysis section of this report, the site is zoned R6 within the Limited Height District (LH-1). The site is improved with a building containing 3,840 square feet of gross building area. In the Zoning section of this appraisal, we determined that the existing improvements represent a legal, pre-existing, non-conforming use. We also determined that the existing use is a permitted use in this zone.
Physically Possible The subject improvements were constructed in 1900. We know of no current or pending municipal actions or covenants that would require a change to the current improvements. The subject building is typical of low-rise single and multifamily structures in this neighborhood of Brooklyn. The site is over-improved and demolition and redevelopment with a new building would result in a smaller structure.
Financially Feasible and Maximally Productive In order to be seriously considered, a use must have the potential to provide a sufficient return to attract investment capital over alternative forms of investment. A positive net income or acceptable rate of return would indicate that a use is financially feasible. Financially feasible uses are those uses that can generate a profit over and above the cost of acquiring the site, and constructing the improvements. Of the uses that are permitted, possible, and financially feasible, the one that will result in the maximum value for the property is considered the highest and best use.
In determining the highest and best use, we considered the following:
The condition of the building and relevant renovation costs for either community facility or residential uses.
The subject has good utility for residential use. The subject has fair utility for community facility use.
Rent levels for residential apartments range from $45 to $60 per square foot depending on location, interior finishes, and unit sizes. Area vacancy rates are near historical lows and are below 3.0 percent. Market rents for community facility (professional office) use are $20 to $35 per square foot, and demand will weaken if the Long Island College Hospital ceases operations.
Rent levels for faculty and staff housing for institutions are at similar levels witnessed for residential uses.
Overall capitalization rates are in the 3.5 to 5.0 percent range for residential rental uses.
02164

82 AMITY STREET HIGHEST AND BEST USE 29
The site is over-improved for residential use, which lends support for renovation of the existing improvements.
Renovation costs for residential uses range from $75 to $125 per square foot of gross building area. The building would require greater renovation for single family residential occupancy.
CONCLUSION Considering the subject property’s physical characteristics and location, as well as the state of the local market, it is our opinion that the Highest and Best Use of the subject property as improved is the renovation of the existing improvements for use as a residential apartment building.
02165

82 AMITY STREET VALUATION PROCESS 30
V A L U A T I O N P R O C E S S
METHODOLOGY There are three generally accepted approaches to developing an opinion of value: Cost, Sales Comparison and Income Capitalization. We considered each in this appraisal to develop an opinion of the market value of the subject property. In appraisal practice, an approach to value is included or eliminated based on its applicability to the property type being valued and the quality of information available. The reliability of each approach depends on the availability and comparability of market data as well as the motivation and thinking of purchasers.
The valuation process is concluded by analyzing each approach to value used in the appraisal. When more than one approach is used, each approach is judged based on its applicability, reliability, and the quantity and quality of its data. A final value opinion is chosen that either corresponds to one of the approaches to value, or is a correlation of all the approaches used in the appraisal.
We considered each approach in developing our opinion of the market value of the subject property. We discuss each approach below and conclude with a summary of their applicability to the subject property.
Cost Approach The Cost Approach is based on the proposition that an informed purchaser would pay no more for the subject than the cost to produce a substitute property with equivalent utility. This approach is particularly applicable when the property being appraised involves relatively new improvements which represent the Highest and Best Use of the land; or when relatively unique or specialized improvements are located on the site for which there are few improved sales or leases of comparable properties.
In the Cost Approach, the appraiser forms an opinion of the cost of all improvements, depreciating them to reflect any value loss from physical, functional and external causes. Land value, entrepreneurial profit and depreciated improvement costs are then added, resulting in an opinion of value for the subject property.
Sales Comparison Approach In the Sales Comparison Approach, sales of comparable properties are adjusted for differences to estimate a value for the subject property. A unit of comparison such as price per square foot of building area or effective gross income multiplier is typically used to value the property. When developing an opinion of land value the analysis is based on recent sales of sites of comparable zoning and utility, and the typical units of comparison are price per square foot of land, price per acre, price per unit, or price per square foot of potential building area. In both cases, adjustments are applied to the unit of comparison from an analysis of comparable sales, and the adjusted unit of comparison is then used to derive an opinion of value for the subject property.
Income Capital ization Approach In the Income Capitalization Approach the income-producing capacity of a property is estimated by using contract rents on existing leases and by estimating market rent from rental activity at competing properties for the vacant space. Deductions are then made for vacancy and collection loss and operating expenses. The resulting net operating income is divided by an overall capitalization rate to derive an opinion of value for the subject property. The capitalization rate represents the relationship between net operating income and value. This method is referred to as Direct Capitalization.
Related to the Direct Capitalization Method is the Yield Capitalization Method. In this method periodic cash flows (which consist of net operating income less capital costs) and a reversionary value are developed and discounted to a present value using an internal rate of return that is determined by analyzing current investor yield
02166

82 AMITY STREET VALUATION PROCESS 31
requirements for similar investments.
SUMMARY This appraisal employs the Sales Comparison Approach. Based on our analysis and knowledge of the subject property type and relevant investor profiles, it is our opinion that only this approach would be considered meaningful and applicable in developing a credible value conclusion.
02167

82 AMITY STREET SALES COMPARISON APPROACH 32
S A L E S C O M P A R I S O N A P P R O A C H
METHODOLOGY Using the Sales Comparison Approach, we developed an opinion of value by comparing this portion of the subject property to similar, recently sold properties in the surrounding or competing area. This approach relies on the principle of substitution, which holds that when a property is replaceable in the market, its value tends to be set at the cost of acquiring an equally desirable substitute property, assuming that no costly delay is encountered in making the substitution.
By analyzing sales that qualify as arm’s-length transactions between willing and knowledgeable buyers and sellers, we can identify value and price trends. The basic steps of this approach are:
Research recent, relevant property sales and current offerings in the competitive area;
Select and analyze properties that are similar to the subject property, analyzing changes in economic conditions that may have occurred between the sale date and the date of value, and other physical, functional, or locational factors;
Identify sales that include favorable financing and calculate the cash equivalent price;
Reduce the sale prices to a common unit of comparison such as price per unit or effective gross income multiplier;
Make appropriate comparative adjustments to the prices of the comparable properties to relate them to the subject property; and
Interpret the adjusted sales data and draw a logical value conclusion.
We used the Sales Comparison Approach to develop an opinion of value. In this method, we analyzed prices buyers have recently paid for similar buildings in the market. In making comparisons, we adjusted the sale prices for differences between this building and the comparable buildings. If the comparable was superior to the subject, a downward adjustment was made to the comparable sale. If inferior, an upward adjustment was made. We present on the following pages a summary of pertinent details of buildings recently sold that we compared to the subject property.
The most widely used and market-oriented unit of comparison for shell buildings such as the subject is the sale price per square foot of gross building area. All the comparable sales were analyzed on this basis. On the following page is the summary of the shell building sales that we compared with the subject property. This is followed by our adjustment chart, the narrative description of the conclusions.
Due to the nature of the subject property and the level of detail available for the comparable data, we elected to analyze the comparables through the application of a traditional adjustment grid using percentage adjustments.
02168

82 AMITY STREET SALES COMPARISON APPROACH 33
SUMMARY OF SHELL BUILDING SALES
PROPERTY INFORMATION TRANSACTION INFORMATION
No.
Property NameAddress, City, State Land (SF)
Building GBA Year Built
No. of Stories Quality Cond. Grantor Grantee
Value Interest Sale Date Sale Price $/Sqft Comments
1 102 Pierrepont Street Brooklyn, NY
2,000 6,516 1860 4 Good Average 102 Pierrepont Street, LLC
115 East 37 Realty, LLC
Leased Fee Dec-12 $3,000,000 $460 This is the sale of a 4-story walk up building located on the south side of PierrepontStreet between Henry Street and Clinton Street in the Brooklyn Heightsneighborhood. There are six residential units, five of which were vacant at the time ofsale. One apartment is occupied by a rent controlled tenant.
2 67 Remsen Street Brooklyn, NY
1,717 4,574 1900 4 Excellent Excellent Watchtower Bible and Tract Society of
New York, Inc.
Heights 67, LLC Fee Simple Sep-12 $3,250,000 $711 This is the sale of a four-story walk up building located on the north side of RemsenStreet between Henry Street and Hicks Street in the Brooklyn Heights neighborhood.The building contains ten residential apartments. The building was vacant at the timeof sale.
3 466 State Street Brooklyn, NY
1,710 2,565 1925 3 Average Fair Howard Hershkovich 466 State St, LLC Fee Simple Sep-12 $850,000 $331 This is the sale of a 3-story residential walk up building located on the south side ofState Street between Nevins Street and Third Avenue in the Boerum Hillneighborhood. The building contains three residential apartments, all of which werevacant at the time of sale.
4 184 Joralemon Street Brooklyn, NY
2,519 27,732 1910/1985 12 Good Good Brooklyn Law School 184 Joralemon LLC c/o United American Land
Fee Simple Sep-11 $10,756,000 $388 This is the sale of a 12-story building on an irregular shaped site located on the southside of Joralemon Street between Clinton and Court Streets in the Brooklyn Heightsneighborhood. The site has 25 feet of frontage. The existing building is proposed tobe converted to luxury residential apartments. The building was previously used as astudent housing dormitory for Brooklyn Law School. The building was vacant at thetime of sale and was not landmarked or located in a historic district.
5 121-123 Fort Greene Place Brooklyn, NY
4,150 7,300 1920 4 Average Average Project Renewal, Inc. 121 FGP LLC Fee Simple Jul-11 $2,810,000 $385 This is the sale of two adjacent buildings that are located on the east side of FortGreene Place between Lafayette Avenue and Hanson Place in the Fort Greeneneighborhood. The sites are rectangular in shape and have 41.5 feet of frontage.The existing buildings were vacant at the time of sale and are proposed for residentialuse. The buildings were previously rental apartments that had fallen into disrepair.The buildings are proposed for conversion to six residential units. Work on thebuildings includes restoration of the facade, removal of the rear extension andconstruction on the entire width of the site, as well as a rooftop addition andrestoration of the stoops. The buildings are landmarked and located in the BrooklynAcademy of Music Historic District.
STATISTICSLow 1,710 2,565 1860 3 Jul-11 $850,000 $331High 4,150 27,732 1925 12 Dec-12 $10,756,000 $711Average 2,419 9,737 1901 5 Apr-12 $4,133,200 $455
Compiled by Cushman & Wakefield, Inc.
02169
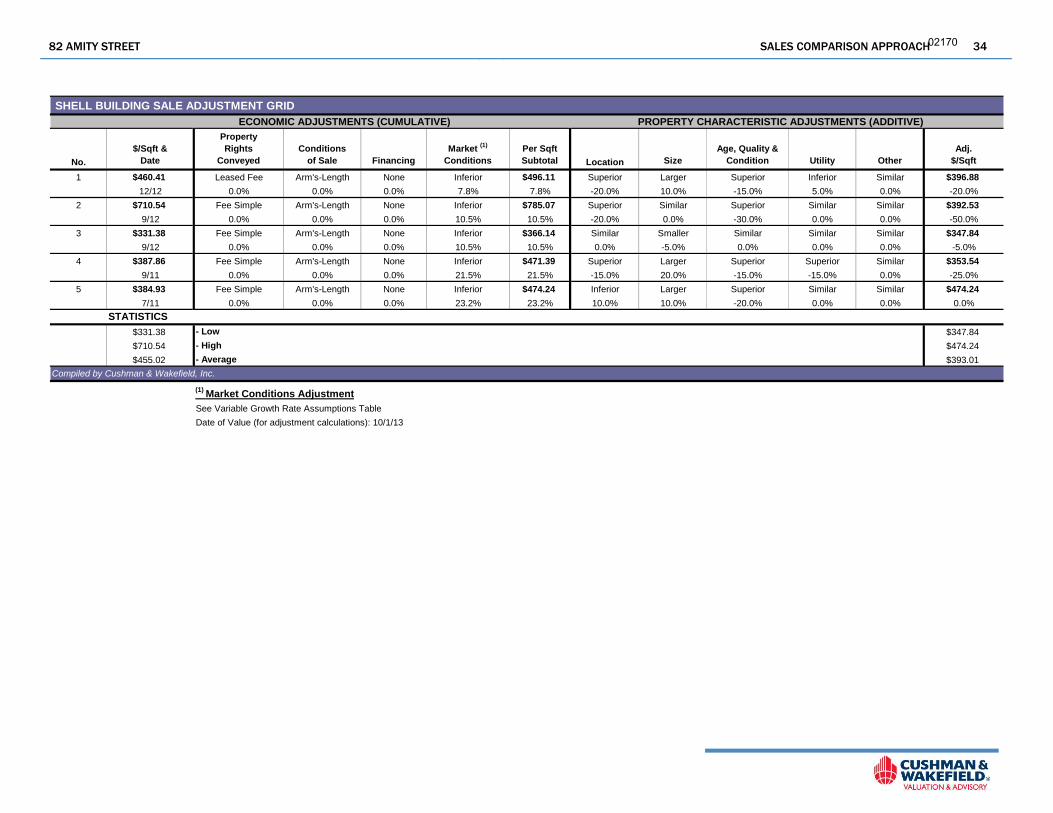
82 AMITY STREET SALES COMPARISON APPROACH 34
SHELL BUILDING SALE ADJUSTMENT GRID ECONOMIC ADJUSTMENTS (CUMULATIVE) PROPERTY CHARACTERISTIC ADJUSTMENTS (ADDITIVE)
No.
$/Sqft &Date
PropertyRights
ConveyedConditions
of Sale FinancingMarket (1)
ConditionsPer Sqft Subtotal Location Size
Age, Quality & Condition Utility Other
Adj.$/Sqft
1 $460.41 Leased Fee Arm's-Length None Inferior $496.11 Superior Larger Superior Inferior Similar $396.88
12/12 0.0% 0.0% 0.0% 7.8% 7.8% -20.0% 10.0% -15.0% 5.0% 0.0% -20.0%
2 $710.54 Fee Simple Arm's-Length None Inferior $785.07 Superior Similar Superior Similar Similar $392.53
9/12 0.0% 0.0% 0.0% 10.5% 10.5% -20.0% 0.0% -30.0% 0.0% 0.0% -50.0%
3 $331.38 Fee Simple Arm's-Length None Inferior $366.14 Similar Smaller Similar Similar Similar $347.84
9/12 0.0% 0.0% 0.0% 10.5% 10.5% 0.0% -5.0% 0.0% 0.0% 0.0% -5.0%
4 $387.86 Fee Simple Arm's-Length None Inferior $471.39 Superior Larger Superior Superior Similar $353.54
9/11 0.0% 0.0% 0.0% 21.5% 21.5% -15.0% 20.0% -15.0% -15.0% 0.0% -25.0%
5 $384.93 Fee Simple Arm's-Length None Inferior $474.24 Inferior Larger Superior Similar Similar $474.24
7/11 0.0% 0.0% 0.0% 23.2% 23.2% 10.0% 10.0% -20.0% 0.0% 0.0% 0.0%
STATISTICS
$331.38 - Low $347.84
$710.54 - High $474.24
$455.02 - Average $393.01
Compiled by Cushman & Wakefield, Inc.
(1) Market Conditions Adjustment
See Variable Growth Rate Assumptions Table
Date of Value (for adjustment calculations): 10/1/13
02170

82 AMITY STREET SALES COMPARISON APPROACH 35
DISCUSSION OF ADJUSTMENTS
Property Rights Conveyed The property rights conveyed in a transaction typically have an impact on the price that is paid. Acquiring the fee simple interest implies that the buyer is acquiring the full bundle of rights. Acquiring a leased fee interest typically means that the property being acquired is encumbered by at least one lease, which is a binding agreement transferring rights of use and occupancy to the tenant. A leasehold interest involves the acquisition of a lease, which conveys the rights to use and occupy the property to the buyer for a finite period of time. At the end of the lease term, there is typically no reversionary value to the leasehold interest. We are valuing the fee simple interest as reflected by all of the comparables, with the exception of Comparable No. 1. Comparable No. 1 involved the transfer of the leased fee interest as there was one rent controlled tenant in place at the time of sale. No adjustment was required for the property rights transferred.
Financial Terms The financial terms of a transaction can have an impact on the sale price of a property. A buyer who purchases an asset with favorable financing might pay a higher price, as the reduced cost of debt creates a favorable debt coverage ratio. A transaction involving above-market debt will typically involve a lower purchase price tied to the lower equity returns after debt service. We analyzed all of the transactions to account for atypical financing terms. To the best of our knowledge, all of the sales used in this analysis were accomplished with cash or market-oriented financing. Therefore, no adjustments were required.
Conditions of Sale Adjustments for conditions of sale usually reflect the motivations of the buyer and the seller. In many situations the conditions of sale may significantly affect transaction prices. However, all sales used in this analysis are considered to be "arm’s-length" market transactions between both knowledgeable buyers and sellers on the open market. Therefore, no adjustments were required.
Market Condit ions The breadth and speed of the virtual collapse of the American financial system in 2008 has had major reverberations in worldwide capital and credit markets. These events caused significant declines in the real estate market and led to a near cessation of transactions. However, markets have stabilized in the past 18 months as is evident in the transactional activity in 2010 and 2011. In the later portion of 2010, there was renewed investment activity particularly in the residential market, with a number of assets offered that generated significant interest from investors. Core U.S. markets including northern Virginia, Washington D.C., Boston, Dallas, and San Francisco witnessed a number of sales. As investors determined the markets were stabilized and with some financing available, developers were more willing to acquire development sites for potential development. Locally, this is evident by the number of transactions that occurred in the latter part of 2010 and early 2011. Beginning in September 2010, we have made a positive adjustment for market conditions at a rate of 10.0 percent per annum.
We discussed the investment sales market with Helen Hwang, Executive Vice President and head of Cushman & Wakefield’s Capital Markets team in New York City. Investment grade assets and development sites remain in strong demand by investors/developers. Cushman & Wakefield’s New York City Investment Sales team has sold several development sites and multifamily assets in 2011 and 2012 and demand was very strong and prices have increased through 2012 and into the third quarter of 2013.
Location Location adjustments were intended to reflect differences with regard to the character of the avenue or street,
02171
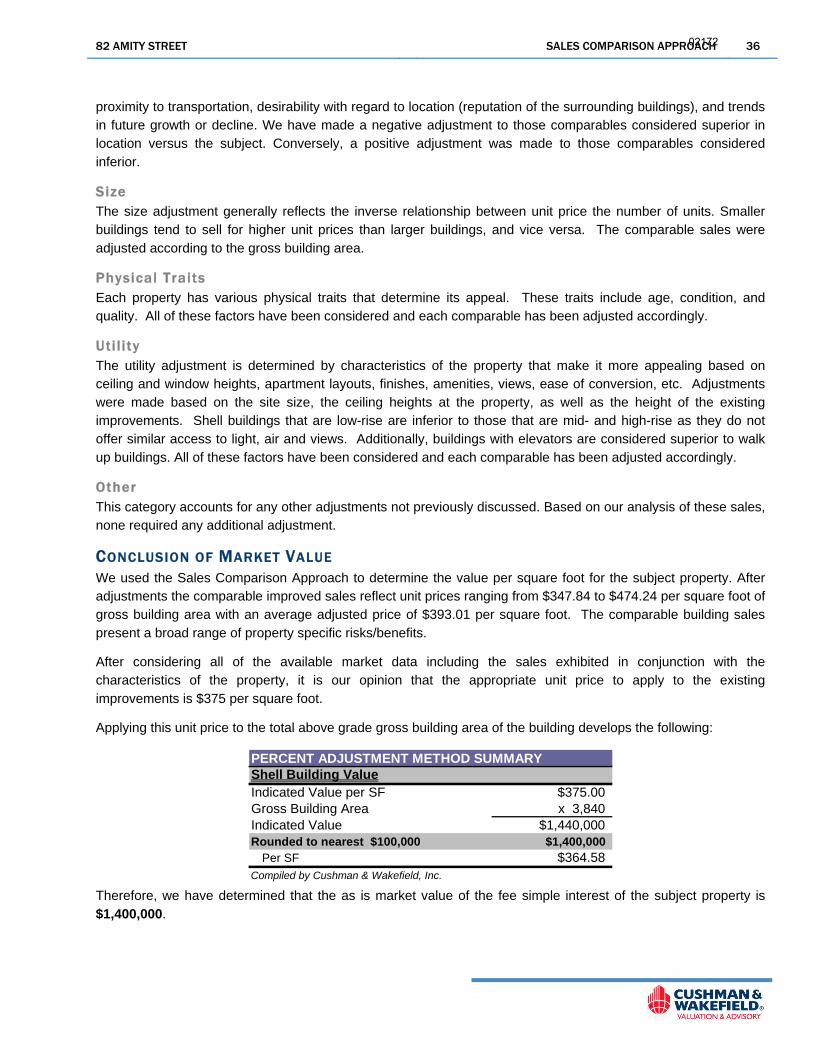
82 AMITY STREET SALES COMPARISON APPROACH 36
proximity to transportation, desirability with regard to location (reputation of the surrounding buildings), and trends in future growth or decline. We have made a negative adjustment to those comparables considered superior in location versus the subject. Conversely, a positive adjustment was made to those comparables considered inferior.
Size The size adjustment generally reflects the inverse relationship between unit price the number of units. Smaller buildings tend to sell for higher unit prices than larger buildings, and vice versa. The comparable sales were adjusted according to the gross building area.
Physical Traits Each property has various physical traits that determine its appeal. These traits include age, condition, and quality. All of these factors have been considered and each comparable has been adjusted accordingly.
Uti l i ty The utility adjustment is determined by characteristics of the property that make it more appealing based on ceiling and window heights, apartment layouts, finishes, amenities, views, ease of conversion, etc. Adjustments were made based on the site size, the ceiling heights at the property, as well as the height of the existing improvements. Shell buildings that are low-rise are inferior to those that are mid- and high-rise as they do not offer similar access to light, air and views. Additionally, buildings with elevators are considered superior to walk up buildings. All of these factors have been considered and each comparable has been adjusted accordingly.
Other This category accounts for any other adjustments not previously discussed. Based on our analysis of these sales, none required any additional adjustment.
CONCLUSION OF MARKET VALUE We used the Sales Comparison Approach to determine the value per square foot for the subject property. After adjustments the comparable improved sales reflect unit prices ranging from $347.84 to $474.24 per square foot of gross building area with an average adjusted price of $393.01 per square foot. The comparable building sales present a broad range of property specific risks/benefits.
After considering all of the available market data including the sales exhibited in conjunction with the characteristics of the property, it is our opinion that the appropriate unit price to apply to the existing improvements is $375 per square foot.
Applying this unit price to the total above grade gross building area of the building develops the following:
PERCENT ADJUSTMENT METHOD SUMMARY
Indicated Value per SF $375.00Gross Building Area x 3,840Indicated Value $1,440,000Rounded to nearest $100,000 $1,400,000
Per SF $364.58Compiled by Cushman & Wakefield, Inc.
Shell Building Value
Therefore, we have determined that the as is market value of the fee simple interest of the subject property is $1,400,000.
02172

82 AMITY STREET RECONCILIATION AND FINAL VALUE OPINION 37
R E C O N C I L I A T I O N A N D F I N A L V A L U E O P I N I O N
VALUATION METHODOLOGY REVIEW AND RECONCILIATION This appraisal employs the Sales Comparison Approach. Based on our analysis and knowledge of the subject property type and relevant investor profiles, it is our opinion that only this approach would be considered meaningful and applicable in developing a credible value conclusion.
The approaches indicated the following:
VALUATION INDICES Market Value As IsCOST APPROACHIndicated Value: N/A
SALES COMPARISON APPROACHIndicated Value: $1,400,000
INCOME CAPITALIZATION APPROACHIndicated Value: N/A
EXPOSURE TIMEExposure Time: 6 to 9 MonthsMarketing Time: 6 to 9 Months
The Sales Comparison Approach consists of the collection and analysis of data relevant to actual sales of properties deemed comparable to the subject property. Properties that have been sold are compared to the property under appraisal and adjustments to the sale prices are made based on differences between the subject property and the comparable sales. Adjustments are typically made for location, date of sale, building size, quality of construction and other relevant characteristics. This approach has been used as the sole determinant to estimate the market value of the subject property in its as is condition.
02173

82 AMITY STREET RECONCILIATION AND FINAL VALUE OPINION 38
M A R K E T V A L U E A S I S Based on our Appraisal as defined by the Uniform Standards of Professional Appraisal Practice, we have developed an opinion that the Market Value of the Fee Simple Interest of the subject property, subject to the assumptions and limiting conditions, certification, extraordinary assumptions and hypothetical conditions, if any, and definitions, “As-Is” on October 1, 2013, was:
ONE MILLION FOUR HUNDRED THOUSAND DOLLARS
$1,400,000
EXPOSURE TIME AND MARKETING TIME Based on our review of national investor surveys, discussions with market participants and information gathered during the sales verification process, a reasonable exposure time for the subject property at the value concluded within this report would have been approximately six to nine (6-9) months. This assumes an active and professional marketing plan would have been employed by the current owner.
We believe, based on the assumptions employed in our analysis, as well as our selection of investment parameters for the subject, that our value conclusion represents a price achievable within six to nine (6-9) months.
02174

82 AMITY STREET ASSUMPTIONS AND LIMITING CONDITIONS 39
A S S U M P T I O N S A N D L I M I T I N G C O N D I T I O N S "Report" means the appraisal or consulting report and conclusions stated therein, to which these Assumptions and Limiting Conditions are annexed.
"Property" means the subject of the Report.
"C&W" means Cushman & Wakefield, Inc. or its subsidiary that issued the Report.
"Appraiser(s)" means the employee(s) of C&W who prepared and signed the Report.
The Report has been made subject to the following assumptions and limiting conditions:
No opinion is intended to be expressed and no responsibility is assumed for the legal description or for any matters that are legal in nature or require legal expertise or specialized knowledge beyond that of a real estate appraiser. Title to the Property is assumed to be good and marketable and the Property is assumed to be free and clear of all liens unless otherwise stated. No survey of the Property was undertaken.
The information contained in the Report or upon which the Report is based has been gathered from sources the Appraiser assumes to be reliable and accurate. The owner of the Property may have provided some of such information. Neither the Appraiser nor C&W shall be responsible for the accuracy or completeness of such information, including the correctness of estimates, opinions, dimensions, sketches, exhibits and factual matters. Any authorized user of the Report is obligated to bring to the attention of C&W any inaccuracies or errors that it believes are contained in the Report.
The opinions are only as of the date stated in the Report. Changes since that date in external and market factors or in the Property itself can significantly affect the conclusions in the Report.
The Report is to be used in whole and not in part. No part of the Report shall be used in conjunction with any other analyses. Publication of the Report or any portion thereof without the prior written consent of C&W is prohibited. Reference to the Appraisal Institute or to the MAI designation is prohibited. Except as may be otherwise stated in the letter of engagement, the Report may not be used by any person(s) other than the party(ies) to whom it is addressed or for purposes other than that for which it was prepared. No part of the Report shall be conveyed to the public through advertising, or used in any sales, promotion, offering or SEC material without C&W's prior written consent. Any authorized user(s) of this Report who provides a copy to, or permits reliance thereon by, any person or entity not authorized by C&W in writing to use or rely thereon, hereby agrees to indemnify and hold C&W, its affiliates and their respective shareholders, directors, officers and employees, harmless from and against all damages, expenses, claims and costs, including attorneys' fees, incurred in investigating and defending any claim arising from or in any way connected to the use of, or reliance upon, the Report by any such unauthorized person(s) or entity(ies).
Except as may be otherwise stated in the letter of engagement, the Appraiser shall not be required to give testimony in any court or administrative proceeding relating to the Property or the Appraisal.
The Report assumes (a) responsible ownership and competent management of the Property; (b) there are no hidden or unapparent conditions of the Property, subsoil or structures that render the Property more or less valuable (no responsibility is assumed for such conditions or for arranging for engineering studies that may be required to discover them); (c) full compliance with all applicable federal, state and local zoning and environmental regulations and laws, unless noncompliance is stated, defined and considered in the Report; and (d) all required licenses, certificates of occupancy and other governmental consents have been or can be obtained and renewed for any use on which the value opinion contained in the Report is based.
The physical condition of the improvements considered by the Report is based on visual inspection by the Appraiser or other person identified in the Report. C&W assumes no responsibility for the soundness of structural components or for the condition of mechanical equipment, plumbing or electrical components.
The forecasted potential gross income referred to in the Report may be based on lease summaries provided by the owner or third parties. The Report assumes no responsibility for the authenticity or completeness of lease information provided by others. C&W recommends that legal advice be obtained regarding the interpretation of lease provisions and the contractual rights of parties.
02175
82 AMITY STREET ASSUMPTIONS AND LIMITING CONDITIONS 40
The forecasts of income and expenses are not predictions of the future. Rather, they are the Appraiser's best opinions of current market thinking on future income and expenses. The Appraiser and C&W make no warranty or representation that these forecasts will materialize. The real estate market is constantly fluctuating and changing. It is not the Appraiser's task to predict or in any way warrant the conditions of a future real estate market; the Appraiser can only reflect what the investment community, as of the date of the Report, envisages for the future in terms of rental rates, expenses, and supply and demand.
Unless otherwise stated in the Report, the existence of potentially hazardous or toxic materials that may have been used in the construction or maintenance of the improvements or may be located at or about the Property was not considered in arriving at the opinion of value. These materials (such as formaldehyde foam insulation, asbestos insulation and other potentially hazardous materials) may adversely affect the value of the Property. The Appraisers are not qualified to detect such substances. C&W recommends that an environmental expert be employed to determine the impact of these matters on the opinion of value.
Unless otherwise stated in the Report, compliance with the requirements of the Americans with Disabilities Act of 1990 (ADA) has not been considered in arriving at the opinion of value. Failure to comply with the requirements of the ADA may adversely affect the value of the Property. C&W recommends that an expert in this field be employed to determine the compliance of the Property with the requirements of the ADA and the impact of these matters on the opinion of value.
If the Report is submitted to a lender or investor with the prior approval of C&W, such party should consider this Report as only one factor, together with its independent investment considerations and underwriting criteria, in its overall investment decision. Such lender or investor is specifically cautioned to understand all Extraordinary Assumptions and Hypothetical Conditions and the Assumptions and Limiting Conditions incorporated in this Report.
In the event of a claim against C&W or its affiliates or their respective officers or employees or the Appraisers in connection with or in any way relating to this Report or this engagement, the maximum damages recoverable shall be the amount of the monies actually collected by C&W or its affiliates for this Report and under no circumstances shall any claim for consequential damages be made.
If the Report is referred to or included in any offering material or prospectus, the Report shall be deemed referred to or included for informational purposes only and C&W, its employees and the Appraiser have no liability to such recipients. C&W disclaims any and all liability to any party other than the party that retained C&W to prepare the Report.
Any estimate of insurable value, if included within the agreed upon scope of work and presented within this Report, is based upon figures derived from a national cost estimating service and is developed consistent with industry practices. However, actual local and regional construction costs may vary significantly from our estimate and individual insurance policies and underwriters have varied specifications, exclusions, and non-insurable items. As such, C&W strongly recommends that the Intended Users obtain estimates from professionals experienced in establishing insurance coverage for replacing any structure. This analysis should not be relied upon to determine insurance coverage. Furthermore, C&W makes no warranties regarding the accuracy of this estimate.
Unless otherwise noted, we were not given a soil report to review. However, we assume that the soil’s load-bearing capacity is sufficient to support existing and/or proposed structure(s). We did not observe any evidence to the contrary during our physical inspection of the property. Drainage appears to be adequate.
Unless otherwise noted, we were not given a title report to review. We do not know of any easements, encroachments, or restrictions that would adversely affect the site’s use. However, we recommend a title search to determine whether any adverse conditions exist.
Unless otherwise noted, we were not given a wetlands survey to review. If subsequent engineering data reveal the presence of regulated wetlands, it could materially affect property value. We recommend a wetlands survey by a professional engineer with expertise in this field.
Unless otherwise noted, we observed no evidence of toxic or hazardous substances during our inspection of the site. However, we are not trained to perform technical environmental inspections and recommend the hiring of a professional engineer with expertise in this field.
We did not inspect the roof nor did we make a detailed inspection of the mechanical systems. The appraisers are not qualified to render an opinion regarding the adequacy or condition of these components. The client is urged to retain an expert in this field if detailed information is needed.
02176

82 AMITY STREET ASSUMPTIONS AND LIMITING CONDITIONS 41
By use of this Report each party that uses this Report agrees to be bound by all of the Assumptions and Limiting Conditions, Hypothetical Conditions and Extraordinary Assumptions stated herein.
02177

82 AMITY STREET CERTIFICATION OF APPRAISAL 42
C E R T I F I C A T I O N O F A P P R A I S A L We certify that, to the best of our knowledge and belief:
The statements of fact contained in this report are true and correct.
The reported analyses, opinions, and conclusions are limited only by the reported assumptions and limiting conditions, and are our personal, impartial, and unbiased professional analyses, opinions, and conclusions.
We have no present or prospective interest in the property that is the subject of this report, and no personal interest with respect to the parties involved.
We have no bias with respect to the property that is the subject of this report or to the parties involved with this assignment.
Our engagement in this assignment was not contingent upon developing or reporting predetermined results.
Our compensation for completing this assignment is not contingent upon the development or reporting of a predetermined value or direction in value that favors the cause of the client, the amount of the value opinion, the attainment of a stipulated result, or the occurrence of a subsequent event directly related to the intended use of this appraisal.
The reported analyses, opinions, and conclusions were developed, and this report has been prepared, in conformity with the requirements of the Code of Professional Ethics & Standards of Professional Appraisal Practice of the Appraisal Institute, which include the Uniform Standards of Professional Appraisal Practice.
The use of this report is subject to the requirements of the Appraisal Institute relating to review by its duly authorized representatives.
Michael J. Garcia made an exterior inspection of the property that is the subject of this report. Robert S. Nardella, MAI, MRICS and John T. Feeney, Jr. did not make a personal inspection of the property that is the subject of this report.
The signatories of the report have performed a previous appraisal of the subject property within the three years prior to this assignment.
No one provided significant real property appraisal assistance to the persons signing this report.
02178

82 AMITY STREET CERTIFICATION OF APPRAISAL 43
As of the date of this report, Robert S. Nardella, MAI, MRICS has completed the continuing education program of the Appraisal Institute.
As of the date of this report, Michael J. Garcia and John T. Feeney, Jr., have completed the Standards and Ethics Education Requirements for Candidates/Practicing Affiliates of the Appraisal Institute.
Michael J. Garcia Director NY Certified General Appraiser License No. 46000049472
John T. Feeney, Jr. Executive Director NY Certified General Appraiser License No. 46000028659
Robert S. Nardella, MAI, MRICS Senior Managing Director NY Certified General Appraiser License No. 46000004620
02179

82 AMITY STREET ADDENDA CONTENTS 44
A D D E N D A C O N T E N T S ADDENDUM A: GLOSSARY OF TERMS & DEFINITIONS ADDENDUM B: QUALIFICATIONS AND LICENSES OF THE APPRAISERS
02180
82 AMITY STREET ADDENDA CONTENTS 45
A D D E N D U M A : G L O S S A R Y O F T E R M S & D E F I N I T I O N S
The following definitions of pertinent terms are taken from The Dictionary of Real Estate Appraisal, Fifth Edition (2010), published by the Appraisal Institute, Chicago, IL, as well as other sources.
AS IS MARKET VALUE The estimate of the market value of real property in its current physical condition, use, and zoning as of the appraisal date. (Proposed Interagency Appraisal and Evaluation Guidelines, OCC-4810-33-P 20%)
CASH EQUIVALENCY An analytical process in which the sale price of a transaction with nonmarket financing or financing with unusual conditions or incentives is converted into a price expressed in terms of cash.
DEPRECIATION 1. In appraising, a loss in property value from any cause; the difference between the cost of an improvement on the effective date of the appraisal and the market value of the improvement on the same date. 2. In accounting, an allowance made against the loss in value of an asset for a defined purpose and computed using a specified method.
EXPOSURE TIME 1. The time a property remains on the market. 2. The estimated length of time the property interest being appraised would have been offered on the market prior to the hypothetical consummation of a sale at market value on the effective date of the appraisal; a retrospective estimate based on an analysis of past events assuming a competitive and open market. See also marketing time.
FEE SIMPLE ESTATE Absolute ownership unencumbered by any other interest or estate, subject only to the limitations imposed by the governmental powers of taxation, eminent domain, police power, and escheat.
HYPOTHETICAL CONDITIONS A hypothetical condition is “that which is contrary to what exists but is supposed for the purpose of analysis. Hypothetical conditions assume conditions contrary to known facts about physical, legal, or economic characteristics of the subject property; or about conditions external to the property, such as market conditions or trends; or about the integrity of data used in an analysis.”
LEASED FEE INTEREST A freehold (ownership interest) where the possessory interest has been granted to another party by creation of a contractual landlord-tenant relationship (i.e., a lease).
MARKET VALUE As defined in the Agencies’ appraisal regulations, the most probable price which a property should bring in a competitive and open market under all conditions requisite to a fair sale, the buyer and seller each acting prudently and knowledgeably, and assuming the price is not affected by undue stimulus.
Implicit in this definition are the consummation of a sale as of a specified date and the passing of title from seller to buyer under conditions whereby:
Buyer and seller are typically motivated;
Both parties are well informed or well advised, and acting in what they consider their own best interests;
A reasonable time is allowed for exposure in the open market;
Payment is made in terms of cash in U.S. dollars or in terms of financial arrangements comparable thereto; and
The price represents the normal consideration for the property sold unaffected by special or creative financing or sales concessions
02181

82 AMITY STREET ADDENDA CONTENTS 46
granted by anyone associated with the sale.1
MARKETING TIME An opinion of the amount of time it might take to sell a real or personal property interest at the concluded market value level during the period immediately after the effective date of an appraisal. Marketing time differs from exposure time, which is always presumed to precede the effective date of an appraisal. (Advisory Opinion 7 of the Appraisal Standards Board of The Appraisal Foundation and Statement on Appraisal Standards No. 6, “Reasonable Exposure Time in Real Property and Personal Property Market Value Opinions” address the determination of reasonable exposure and marketing time.) See also exposure time.
SPECIAL, UNUSUAL, OR EXTRAORDINARY ASSUMPTIONS Before completing the acquisition of a property, a prudent purchaser in the market typically exercises due diligence by making customary enquiries about the property. It is normal for a Valuer to make assumptions as to the most likely outcome of this due diligence process and to rely on actual information regarding such matters as provided by the client. Special, unusual, or extraordinary assumptions may be any additional assumptions relating to matters covered in the due diligence process, or may relate to other issues, such as the identity of the purchaser, the physical state of the property, the presence of environmental pollutants (e.g., ground water contamination), or the ability to redevelop the property.
1 “Interagency Appraisal and Evaluation Guidelines.” Federal Register 75:237 (December 10, 2010) p. 77472.
02182

82 AMITY STREET ADDENDA CONTENTS 47
A D D E N D U M B : Q U A L I F I C A T I O N S A N D L I C E N S E S O F T H E A P P R A I S E R S
02183

A PROPOSAL FOR C&W BIOGRAPHY
CUSHMAN & WAKEFIELD 1
PROFESSIONAL QUALIFICATIONS
MICHAEL J. GARCIA DIRECTOR | VALUATION & ADVISORY CUSHMAN & WAKEFIELD, INC.
Mr. Garcia is an appraiser with the Valuation & Advisory group of Cushman & Wakefield, Inc. in New York. Prior to joining Valuation & Advisory in August 2005, Michael Garcia was a biology teacher. He also served as a Peace Corps Volunteer in Cameroon, Africa, where he taught biology and physical education in a rural village community. Upon returning to the U.S., Mr. Garcia continued to work in education as a teacher in Connecticut and New York City.
EXPERIENCE
Since joining the division, Mr. Garcia has worked on various appraisals of residential properties including cooperatives, condominiums, student housing, affordable housing, land, and shell buildings throughout New York City. He has also worked in the Los Angeles office on appraisals of casinos and hotels throughout the United States. Mr. Garcia works a colleague of John T. Feeney, Jr. who specializes in the valuation of residential properties in New York City and co-heads the national Multifamily Practice Group.
EDUCATION
Teachers College, Columbia University (New York, NY) – Graduated 2005 − Degree: Master of Art – Secondary Science Education
University of Evansville (Evansville, IN) – Graduated 1999 − Degree: Bachelor of Science – Biology
APPRAISAL EDUCATION
Mr. Garcia successfully completed all New York State appraisal courses required for licensing.
MEMBERSHIPS, LICENSES AND PROFESSIONAL AFFILIATIONS
Candidate for Designation, Appraisal Institute Certified General Real Estate Appraiser in the following state:
− New York – 46000049472
OTHER ACCOMPLISHMENTS AND AWARDS
Cushman & Wakefield Rising Star Award – 2012
02184

A PROPOSAL FOR C&W BIOGRAPHY
CUSHMAN & WAKEFIELD 2
PROFESSIONAL QUALIFICATIONS
NEW YORK
02185
A PROPOSAL FOR C&W BIOGRAPHY
CUSHMAN & WAKEFIELD 1
PROFESSIONAL QUALIFICATIONS
JOHN T. FEENEY, JR. EXECUTIVE DIRECTOR | VALUATION & ADVISORY PRACTICE GROUP LEADER | MULTIFAMILY CUSHMAN & WAKEFIELD, INC.
Mr. Feeney is a graduate of Manhattan College School of Business, Class of 1987, with a Bachelor of Science Degree in Finance. He entered the real estate business in 1985 with Cushman & Wakefield, Inc. Since that time, Mr. Feeney was promoted to Associate Director in October 1993 by the Executive Board of Cushman & Wakefield, Inc. He was subsequently promoted to Director in July 1996, to Senior Director in 2006 and to his current title of Executive Director in 2010.
EXPERIENCE
Since joining Cushman & Wakefield's Valuation & Advisory group, Mr. Feeney has worked on assignments including vacant land, air rights, office buildings, corporate headquarter facilities (both existing and proposed), shopping centers, industrial complexes, commercial properties, residential properties, hotels and investment properties throughout the United States.
Mr. Feeney is qualified as an expert witness in U.S. Bankruptcy Court, Southern and Eastern Districts of New York, and in the Supreme Court of the State of New York, County of New York, County of Queens and County of Nassau. Mr. Feeney has also been a guest speaker at Columbia University’s School of Business Real Estate Club, the Appraisal Institute Metropolitan District Chapter Number 4, the Real Estate Board of New York, and New York University’s Masters in Real Estate Program.
Since 1997, Mr. Feeney has headed the multifamily valuation team for New York’s Valuation Services. During this time, Mr. Feeney has prepared appraisals and consulted on hundreds of multifamily assets including premier developments such as the Residences at the Time Warner Center, Trump World Tower, the Residences at 50 Central Park South, and One Beacon Court. Appraisal and consultation services have been provided to Con Edison on its transaction for its sites along First Avenue, proposed to be developed with over 5,000,000 square feet of mixed use buildings. Mr. Feeney’s team was responsible for the appraisal of the first downtown residential buildings to be granted Liberty Bond Financing. Assignments have included properties in each borough of New York City, and include cooperatives, existing and proposed condominium developments, proposed and existing rental developments, 80/20 mixed use developments, Section 8 and Section 236 housing developments, Mitchell Lama developments, development sites, air rights, Low Income Housing Tax Credits, Inclusionary Housing, and benefits related to sub-market financing.
EDUCATION
Manhattan College (Riverdale, NY) – Graduated 1987 − Degree: Bachelor of Science – Finance
APPRAISAL EDUCATION
Mr. Feeney has successfully completed all required real estate courses required for the MAI designation offered by either the American Institute of Real Estate Appraisers or the Appraisal Institute.
02186

A PROPOSAL FOR C&W BIOGRAPHY
CUSHMAN & WAKEFIELD 2
PROFESSIONAL QUALIFICATIONS
MEMBERSHIPS, LICENSES AND PROFESSIONAL AFFILIATIONS
Candidate for Designation, Appraisal Institute Certified General Real Estate Appraiser in the following state:
− New York – 46000028659
02187

A PROPOSAL FOR C&W BIOGRAPHY
CUSHMAN & WAKEFIELD 3
PROFESSIONAL QUALIFICATIONS
NEW YORK
02188

A PROPOSAL FOR C&W BIOGRAPHY
CUSHMAN & WAKEFIELD 1
PROFESSIONAL QUALIFICATIONS
ROBERT S. NARDELLA, MAI, MRICS SENIOR MANAGING DIRECTOR | VALUATION & ADVISORY CUSHMAN & WAKEFIELD, INC.
Robert S. Nardella is a Senior Managing Director of Cushman & Wakefield, Inc., working within the Valuation & Advisory Group. Mr. Nardella joined Cushman & Wakefield, Inc. in February 1987 while still attending college. He graduated from Pace University's Lubin School of Business, Class of 1987, with a Bachelor of Business Administration in Finance, and earned a Masters in Real Estate from New York University in 1997.
In March of 1993, Mr. Nardella was named Associate Director of Cushman & Wakefield, Inc. He was further promoted to Director in December 1994 and to Senior Director in September 2006. Mr. Nardella has received the Excellence in Quality Service Award for the Valuation Advisory division in the New York region, and was named Quality Control Manager for the New York region in 2004. Other appointments include National Account Manager of several key Cushman & Wakefield relationships, as well as service on the Career Development Committee. In January 2007, Mr. Nardella was appointed Operations Manager of the New York office within Valuation & Advisory, and was named Managing Director in June 2008. In January 2010, Mr. Nardella was named Senior Managing Director and Regional Manager for New York and New Jersey V&A operations.
EXPERIENCE
Since joining Cushman & Wakefield, Inc., Mr. Nardella has performed appraisal, feasibility and consulting assignments involving vacant land, developable air rights, office buildings, proposed and existing regional malls, shopping centers, industrial and residential complexes, condominiums, and investment properties throughout 25 states.
EDUCATION
New York University – Graduated 1997 − Degree: Masters in Real Estate
Pace University – Graduated 1987 − Degree: Bachelor of Science – Finance
APPRAISAL EDUCATION
Mr. Nardella has successfully completed all courses and requirements to qualify for the MAI designation, and has currently completed the requirements under the continuing education program of the Appraisal Institute.
MEMBERSHIPS, LICENSES AND PROFESSIONAL AFFILIATIONS
Designated Member, Appraisal Institute − As of the current date, Robert Nardella, MAI has completed the requirements of the continuing
education program of the Appraisal Institute.
02189

A PROPOSAL FOR C&W BIOGRAPHY
CUSHMAN & WAKEFIELD 2
PROFESSIONAL QUALIFICATIONS
Member, Royal Institution of Chartered Surveyors (MRICS) Certified General Real Estate Appraiser in the following states:
− New Jersey – 42RG00230800 − New York – 46000004620
02190

A PROPOSAL FOR C&W BIOGRAPHY
CUSHMAN & WAKEFIELD 3
PROFESSIONAL QUALIFICATIONS
NEW JERSEY
NEW YORK
02191

02192