EXECUTIVE SUMMARY - Department of Agriculture
129
THE PHILIPPINE ABACA INDUSTRY ROADMAP 2018-2022 i EXECUTIVE SUMMARY This roadmap sets the direction for the Philippine abaca industry. It encompasses industry analyses, benchmarking and supply/value chain. This roadmap identified the potential areas intended for planting and treatment of diseases which are the two most important factors in abaca fiber production. A broad range of private and public sector groups contributed to the production of this document which sets forth new policy, capacity and capability priorities for the Philippine abaca industry. Coordination and analysis of the inputs, organization of the workshops, and preparation of this document were carried out by PhilFIDA. Stakeholders’ meetings and workshops were hosted and facilitated by PhilFIDA Regional Offices. Where are we now? Abaca, internationally known as Manila hemp, is endemic to the Philippines. The Philippines dominates the global abaca trade as the country supplies about 87.5 percent of the world’s abaca fiber requirements and Ecuador and Costa Rica the remaining 12.5 percent as of 2016. In 2016, abaca was planted on 180,302 hectares (ha) with production reaching 72,000 metric tons (MT). The abaca farm structure is classified as a small farm which is owned and managed by individual farmers. It has an average area of 1.6 hectare for every farmer. There are only few farms established and managed by cooperatives or associations with areas ranging from 10 to 100 hectares. Almost one third of the abaca areas can be found in Region V or the Bicol Region with 52,493 hectares. The land area is comparable to combined abaca areas of Regions XIII, XI, XII and VI. Most of the abaca areas in Bicol are heavily concentrated in Catanduanes, comprising more than 60 percent of the total area of the region. At present, Catanduanes is the biggest abaca producing province contributing 35 percent of the total production, followed by Davao Oriental with about 8.5 percent. Due to frequent typhoons in Bicol and Leyte, there are moves by some abaca factories and investors to look for alternative areas to plant abaca. Exports of abaca fiber and manufacture generated an average of US$97.1 million per year in the last ten years. Some US$84.9 million came from abaca manufactures such as pulp, cordage, yarns, fabrics and fibercrafts. The remaining US$12.2 million was from raw fiber exports. Europe, specifically, the United Kingdom, is the premier destination of abaca fiber followed by Asia,
Transcript of EXECUTIVE SUMMARY - Department of Agriculture

THE PHILIPPINE ABACA INDUSTRY ROADMAP 2018-2022 i
EXECUTIVE SUMMARY
This roadmap sets the direction for the Philippine abaca industry. It
encompasses industry analyses, benchmarking and supply/value chain. This
roadmap identified the potential areas intended for planting and treatment
of diseases which are the two most important factors in abaca fiber
production.
A broad range of private and public sector groups contributed to the
production of this document which sets forth new policy, capacity and
capability priorities for the Philippine abaca industry.
Coordination and analysis of the inputs, organization of the workshops,
and preparation of this document were carried out by PhilFIDA. Stakeholders’
meetings and workshops were hosted and facilitated by PhilFIDA Regional
Offices.
Where are we now?
Abaca, internationally known as Manila hemp, is endemic to the
Philippines. The Philippines dominates the global abaca trade as the country
supplies about 87.5 percent of the world’s abaca fiber requirements and
Ecuador and Costa Rica the remaining 12.5 percent as of 2016. In 2016, abaca
was planted on 180,302 hectares (ha) with production reaching 72,000 metric
tons (MT).
The abaca farm structure is classified as a small farm which is owned and
managed by individual farmers. It has an average area of 1.6 hectare for
every farmer. There are only few farms established and managed by
cooperatives or associations with areas ranging from 10 to 100 hectares.
Almost one third of the abaca areas can be found in Region V or the
Bicol Region with 52,493 hectares. The land area is comparable to combined
abaca areas of Regions XIII, XI, XII and VI. Most of the abaca areas in Bicol are
heavily concentrated in Catanduanes, comprising more than 60 percent of
the total area of the region. At present, Catanduanes is the biggest abaca
producing province contributing 35 percent of the total production, followed
by Davao Oriental with about 8.5 percent. Due to frequent typhoons in Bicol
and Leyte, there are moves by some abaca factories and investors to look for
alternative areas to plant abaca.
Exports of abaca fiber and manufacture generated an average of
US$97.1 million per year in the last ten years. Some US$84.9 million came from
abaca manufactures such as pulp, cordage, yarns, fabrics and fibercrafts. The
remaining US$12.2 million was from raw fiber exports. Europe, specifically, the
United Kingdom, is the premier destination of abaca fiber followed by Asia,

THE PHILIPPINE ABACA INDUSTRY ROADMAP 2018-2022 ii
with Japan as the leading buyer. All abaca pulp was exported for specialty
paper manufactures.
Since 1991, local pulp mills had been importing abaca and sisal fiber
from Ecuador except in 2005. The pulp processor resorted to importation to
address the deficiency in local supply of specific grades and meet buyers’
specifications.
On local benchmarking, a total of 1,000 abaca plants with a distance of
3.0x3.0m are planted to a hectare and intercropped with coconut, fruit trees
and leguminous plants. The typical farm uses suckers, corms, tissue culture
plantlets as planting materials. The good farm uses seeds, tissue culture
plantlets, suckers and corms. Care and maintenance of the plantation in
typical farming is minimal compared to good farming which is properly
managed.
Harvesting is done every six months for the typical farm and every three
to four months for the good farm. The first harvest is done on 18-24 months
after planting.
Local Benchmarking, Abaca Farming: Typical vs. Good (Qualitative Parameters)
PARAMETERS TYPICAL GOOD GAP
Planting Density (hills/ha) 1000 @ 3.0x3.0m 1000 @ 3.0x3.0m distance -
Plant Propagation Practice Suckers @ P15/pc. TC plantlets @ P25/pc (P10/pc)
Fiber Extraction Method Hand stripped Machine-stripped P3/kg fiber
Fiber Recovery 1.5 percent 1.5 percent -
Fertilizer Application No fertilization 3 times/year @ P1,300/bag P11,700a/Year
Weeding and
Underbrushing
Occasional regularly done every harvesting much healthier
plants
Pest and Disease Control Not conducted 2 times/year @ 1liter/app P 1,400b/year
First Harvest Year 2 Year 2 -
Harvesting Frequency @
peak
2 times/year 4 times/year twice as much
a Price of fertilizer @ Php 1,300/bag b Price of insecticide @ Php 700/liter
Source of basic data: Actual farmer’s field and Abaca Technoguide
The abaca varieties used in good (Maguindanao) and typical (Abuab)
farming have the characteristics of 1.5 percent fiber recovery. Farmers
undertake primary processing, which involves the extraction of fiber for
harvested tuxies. To extract the fibers, hand stripping is used by the typical
farm and mechanized stripping for the good farm. Drying is done through sun
and air.

THE PHILIPPINE ABACA INDUSTRY ROADMAP 2018-2022 iii
Local Benchmarking, Abaca Farming: Typical vs. Good (Quantitative Parameters) (in PhP per ha unless otherwise specified)
PARAMETERS* TYPICAL
FARM GOOD FARM
GAP
Average yield per ha (kg) 667 1,334 667
Peak yield per ha (kg)
750
1,700
750 Average establishment cost per ha (Year 1)
38,295 68,045 29,750
Average cash outflow per ha per year 22,610 51,930 29,320
Price per kg (farmer’s selling price) 60 60 0
Average cash inflow per ha per year 36,000 86,400 50,400
Average net cash flow per ha per Year
13,390 34,470 21,080
Average Area to get preferred net income of Php 94,000 (poverty threshold, 1st half 2012) (ha)
7.02 2.73 4.29
Average cost per kg (PhP/kg) 37.68 36.06 1.62
Payback period (years) 5.22 4.03 1.19
IRR (percent) 39 44 5 *Years 2-10 are considered in the average values Source of basic data: Actual farmer’s field and Abaca Technoguide
On international benchmarking, Ecuador and Costa Rica are the only
other commercial producers of abaca fiber aside from the Philippines based
on Food and Agriculture Organization (FAO) data. However, there are reports
that Indonesia has propagated abaca and harvesting will commence in 2018.
The average export price of representative grades (S2, G and JK) of Philippine
abaca ranges from US$170 per bale to US$212 per bale compared to
Ecuadorian abaca (all Grades) at US$169 per bale. This shows that Philippine
abaca is competitively priced with the Ecuadorian abaca.
In 2016, the country’s exports of raw abaca fiber to the UK reached 2,477
metric tons (MT) valued at US$ 3.54 M, which represented 56 percent of the
total exports of raw abaca fibers. The computed export parity price ratios to
the UK market for grades S2, I, G and JK are 1.04, 1.13, 1.25 and 1.71,
respectively, which indicates the price competitiveness of Philippine abaca
in the said fiber grades. Another important edge of Philippine abaca is that of
having more quality grades. The Philippines has nine grades/classifications of
abaca fiber compared to only five of Ecuador, making Philippine abaca more
versatile in applications. Philippine abaca has a wide range of utilization from
the traditional cordage/rope and fibercrafts to more sophisticated industrial
applications like specialty papers, textile and the emergent bio-composites
and nanocellulose. The different grades allow the specialty papermakers
flexibility to produce different types of paper and other by-products with the
desired quality.

THE PHILIPPINE ABACA INDUSTRY ROADMAP 2018-2022 iv
According to Glatfelter, the world’s biggest manufacturer of specialty
paper, the Philippine abaca fibers are deteriorating compared to Ecuador
and Costa Rica fibers. Pulp mills need to buy higher grade of abaca fiber to
produce quality pulp. The Philippine government will solve this problem
through strict enforcement of abaca grading standards and promoting good
agricultural practices among farmers during harvesting, post-harvest and
trading activities.
Where do we want to go?
The stakeholders’ consultations and workshops have set the vision,
mission, goals and targets for the industry.
The Vision:
A progressive Philippine fiber industry that produce the world’s best
quality fiber to supply global demands for renewable, sustainable and
environment-friendly products to achieve the country’s inclusive growth.
The Mission:
• Improve the socio-economic condition of farmers, create livelihood and
reduce poverty incidence through rural fiber-based enterprise
development and business; and
• Maintain the country’s status as the world’s number one producer and
supplier of quality abaca fibers.
Goals
• Produce sufficient quality abaca fiber to supply domestic and
international markets;
• Establish rural livelihood and economic businesses that improve farming
practices and land vegetation, rehabilitate the environment and
mitigate climate change;
• Establish disease free abaca plantations in all regions to provide
sustainable fiber supply for pulp millers, cordage companies and rural
enterprises;
• Set new direction and agenda for R & D to improve varieties, increase
fiber production, disease treatment, postharvest, processing, tensile
strengths and utilization towards production of fiber by-products for
industrial, commercial and other uses;

THE PHILIPPINE ABACA INDUSTRY ROADMAP 2018-2022 v
• Strengthen collaboration among industry stakeholders - international
investors, local and national governments, farmer cooperatives/
associations, private sectors, non-government organizations, academe
and corporations; and
• Promote an investment climate conducive for foreign and local direct
investors for upstream and downstream processing.
Objectives
• To expand/rehabilitate a total of 146,248 hectares of abaca areas from
2018 to 2022;
• To mass produce planting materials thru tissue culture,
micropropagation, conventional method and seeds;
• To increase fiber production by 36,482MT in 2020, 93,248MT in 2021 and
130,789MT in 2022 to address the projected 12% annual increase in
demand;
• To adopt abaca tuxy buying scheme in the production of quality abaca
fiber thru cooperative approach;
• To introduce new technologies in abaca production and treatment of
abaca diseases;
• To accredit private, government (LGUs), and commercial abaca
nurseries and distribute healthy planting materials;
• To train LGUs and NGOs agricultural technicians and farmers on new
and improved fiber production technologies;
• To upgrade and modernize/mechanize post-harvest equipment and
facilities to improve efficiency and increase fiber production;
• To strictly implement abaca grading standards;
• To conduct R&D for the production of quality and disease-free planting
materials, new technologies on plantation establishment, treatment of
diseases, production of by-products of abaca fibers, and processing
and utilization in partnership with universities, corporation and private
sectors; and
• Establish Monitoring and Evaluation Plan in partnership with abaca
stakeholders, LGU, AAPMI, NGOs and other groups.

THE PHILIPPINE ABACA INDUSTRY ROADMAP 2018-2022 vi
In terms of targets, a total of 69,364 hectares in 2018 and 44,167 hectares
in 2019 will be planted to reach an estimated total abaca fiber demand of
160,444MT in 2020 with an increase of 12% annually. Many private sectors,
corporations and farmers have committed to plant abaca in more areas
depending on the availability of planting materials. By 2022, with the targeted
farm expansion and rehabilitation of 146,248 hectares, an estimated abaca
fiber production of 216,761MT will be attained.
Physical Targets for Abaca, 2017-2022 (in ha unless otherwise specified)
Indicators 2017 2018 2019 2020 2021 2022 Total
Abaca Areas 180,302 181,302 220,666 230,666 239,666 239,666
New Area Planted 1,000 39,364 10,000 9,000 59,364
Area Rehabilitated 800 30,000 34,167 21,917 86,884
Number of Planting Materials Required (in million)
1.80 69.36 30.92 30.92 146.28
Fiber Production (MT) 74,160 76,385 79,576 117,519 176,715 216,761 Note: Yield assumption was based on the Abaca Statistical Bulletin, 2006 - 2015 and the National Abaca Survey, 2009
How do we get there?
Major Problems and Interventions
Lack of Planting Materials. This is the main problem of the PhilFIDA because of
its dependence to tissue culture planting materials, low seedbank
seedling production and disease infected planting materials. Currently,
the PhilFIDA can only produce maximum of 500,000 planting materials
versus demand deficit of 146.28M planting materials requirement. It
would take the industry about 292 years to acquire said requirement.
Solution 1: Use abaca seed-derived planting materials in response to the needs
of the clients. In order to cover the 146.28M planting material
requirement, a total of 4.17 tons of seeds are needed with an assumption
of 35,000 seeds per kilogram.
Solution 2. Increase number of nurseries per region that will be accredited by
the Bureau of Plant Industry and PhilFIDA and encourage local nursery
operators and LGUs to engage on abaca seedling production.
Accredited nurseries shall be established in each province. Agriculture
staff of LGUs and NGOs will be trained on seedling production and
nursery management.

THE PHILIPPINE ABACA INDUSTRY ROADMAP 2018-2022 vii
Prevalence of Abaca Diseases such as Bunchy-top, Bract Mosaic and
Mosaic.
Solution 1: Continuous eradication of infected abaca plants and replanting of
disease-freed areas.
Solution 2: Promotion of efficient farm management by intensive and
sustainable farmers’ training. Agricultural Training Institute (ATI) will be
tapped to support the trainings for farmers, LGU technicians and NGOs
to improve their technical knowledge and skills on abaca farming.
Solution 3: Conduct exploration of new pest management technology to
update the Integrated Pest Management Program for Abaca.
Low Fiber Production. Majority of abaca farms are far from the farmer’s
residences and harvesting is only done 2 times a year in some areas.
Century-old harvesting device and tools, and spindle machines are used
during post-harvest and needs to be improved to produce more quality
fibers.
Solution 1: Organize the farmers to form into cooperatives (minimum of 100
abaca farmers).
Solution 2: Increase yield per hectare by optimizing planting distance in current
abaca areas
Solution 3: Improve efficiency of postharvest equipment and facilities. The
PhilFIDA, PhilMECH and SUCs will collaborate to fabricate machines and
conduct researches to improve the performance of abaca fiber
extraction machineries.
Solution 4: Availability of good and high yielding variety planting materials to
support a reasonable increase in farm productivity of existing abaca
hectarage.
Low Fiber Quality. The quality of Philippine fiber has deteriorated over the past
years because of “all-in buying” practice and also because of the
existence of commercialized spurious abaca varieties.
Solution 1: Strict enforcement of abaca fiber grading standards.
Solution 2: Promote production of quality fibers.

THE PHILIPPINE ABACA INDUSTRY ROADMAP 2018-2022 viii
Solution 3: Implement the “Abaca Tuxy Buying Scheme”.
Solution 4: Eradication of commercialized spurious abaca areas.
Insufficient Supply of Abaca Fiber. Abaca production has to be increased in
various ways specifically through opening of new abaca areas and by
invigorating old and less productive farms and plantations.
Solution 1: Aggressive campaign to promote abaca farming. Encourage
private sectors, farmers’ association/cooperatives and corporations to
invest in abaca trading business and engage in farm service providers.
Solution 2: Active provision of technical assistance to industry players by
PhilFIDA.
Solution 3: Establishment of processing centers and drying facilities near abaca
farms and promote the production of spindle-stripped fibers. Farmers
organizations/cooperatives with huge abaca farms will be encouraged
to establish postharvest facilities with stripping machines and drying
centers.
Solution 4: Support in the rehabilitation of old and unproductive abaca farms
by providing them necessary inputs.
Solution 5: Support in the establishment of new abaca farms.
New Strategies
• The Abaca Tuxy Buying Scheme. This scheme will ensure the survival of
abaca which is indigenous to the Philippines. This aims to organize and
empower most of the abaca farmers nationwide as a cooperative,
produce their own abaca fibers as a group which will redound to better
competitive price, quality and quantity and sell their harvest directly to
Grading and Baling Establishments (GBEs) and local processors.
The traditional way of abaca fiber extraction/harvesting by the
abaca farmers has Twelve (12) stages. The project intends to lessen it to
only six (6) steps --Topping, Tumbling, Tuxying, Tuxy Bundling, Tuxy
Transporting/Hauling and Tuxy Trading /Selling -- thereby removing and
easing the burden of the abaca farmers of the other six (6) activities and
just let them continue producing all the abaca tuxies they want for the
day before selling it to their cooperative that same day. This will surely
increase abaca fiber production.

THE PHILIPPINE ABACA INDUSTRY ROADMAP 2018-2022 ix
• Disease-free and abaca seed-derived planting materials shall be
distributed to interested stakeholders who are members of a farmer’s
association or cooperative.
• Encourage more farmers, private sectors, NGOs, corporations and big
land owners to plant abaca in their areas identified under National
Color-Coded Agricultural Guide Map launched by AMIA.
The PhilFIDA under the management of the Executive Director (ED)
and a Deputy Executive Director (DED) will be the lead agency that will
implement the Philippine Abaca Industry Roadmap. The implementing units
within PhilFIDA are the nine regional offices, three regional satellite offices and
four technical divisions assisted by two support divisions.
The ED will be the prime mover that shall direct all operating units of the
agency to perform the planned programs, projects and activities stipulated
in the roadmap and agreed upon with the stakeholders during the various
consultations. The ED shall report to the DA Secretary regularly the
progress of implementation and accomplishments of the roadmap.
THE PHILIPPINE ABACA INDUSTRY ROADMAP 2018-2022 1
CHAPTER I
INTRODUCTION
A. Rationale
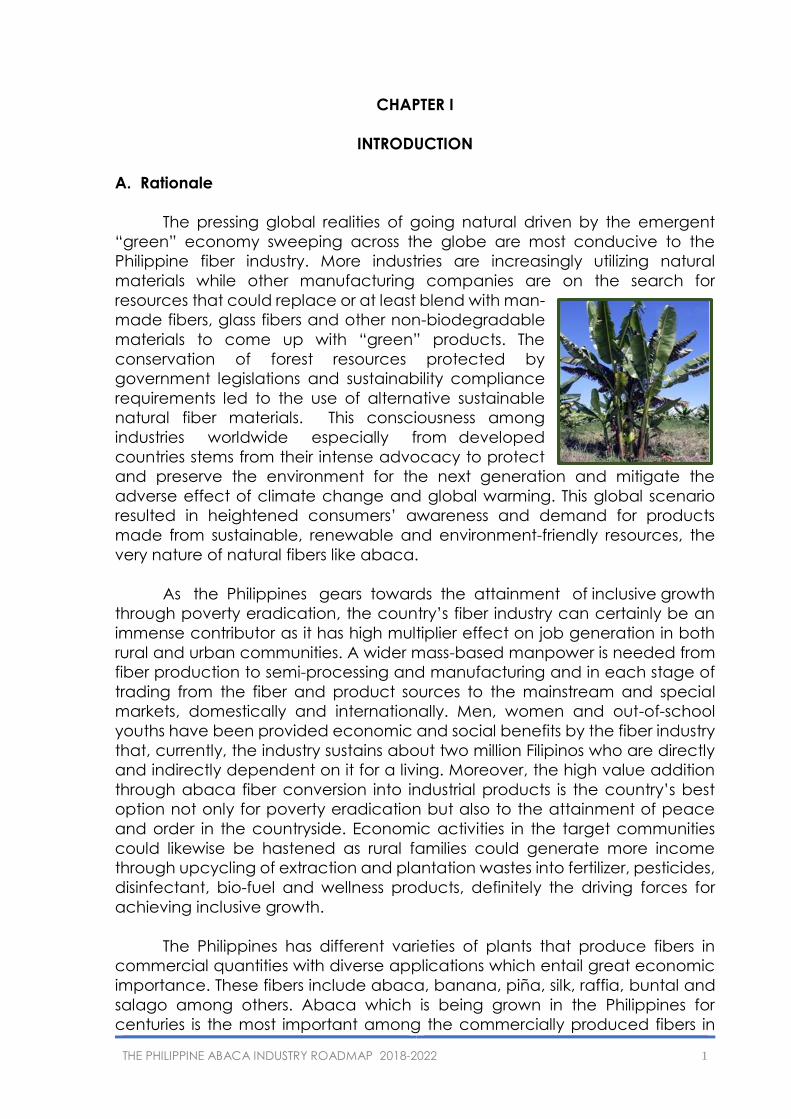
The pressing global realities of going natural driven by the emergent
“green” economy sweeping across the globe are most conducive to the
Philippine fiber industry. More industries are increasingly utilizing natural
materials while other manufacturing companies are on the search for
resources that could replace or at least blend with man-
made fibers, glass fibers and other non-biodegradable
materials to come up with “green” products. The
conservation of forest resources protected by
government legislations and sustainability compliance
requirements led to the use of alternative sustainable
natural fiber materials. This consciousness among
industries worldwide especially from developed
countries stems from their intense advocacy to protect
and preserve the environment for the next generation and mitigate the
adverse effect of climate change and global warming. This global scenario
resulted in heightened consumers’ awareness and demand for products
made from sustainable, renewable and environment-friendly resources, the
very nature of natural fibers like abaca.
As the Philippines gears towards the attainment of inclusive growth
through poverty eradication, the country’s fiber industry can certainly be an
immense contributor as it has high multiplier effect on job generation in both
rural and urban communities. A wider mass-based manpower is needed from
fiber production to semi-processing and manufacturing and in each stage of
trading from the fiber and product sources to the mainstream and special
markets, domestically and internationally. Men, women and out-of-school
youths have been provided economic and social benefits by the fiber industry
that, currently, the industry sustains about two million Filipinos who are directly
and indirectly dependent on it for a living. Moreover, the high value addition
through abaca fiber conversion into industrial products is the country’s best
option not only for poverty eradication but also to the attainment of peace
and order in the countryside. Economic activities in the target communities
could likewise be hastened as rural families could generate more income
through upcycling of extraction and plantation wastes into fertilizer, pesticides,
disinfectant, bio-fuel and wellness products, definitely the driving forces for
achieving inclusive growth.
The Philippines has different varieties of plants that produce fibers in
commercial quantities with diverse applications which entail great economic
importance. These fibers include abaca, banana, piña, silk, raffia, buntal and
salago among others. Abaca which is being grown in the Philippines for
centuries is the most important among the commercially produced fibers in

THE PHILIPPINE ABACA INDUSTRY ROADMAP 2018-2022 2
the country in terms of hectarage, production and contribution to the nation’s
economy. Abaca is endemic to the Philippines and has, for centuries, been
synonymous to the Philippines because it is known worldwide as Manila hemp.
The Philippines dominates the global abaca trade as the country supplies
about 87.5 percent of the world’s abaca fiber requirements and Ecuador the
remaining 12.5 percent as of 2015. A total area of 180,302 hectares was
devoted to abaca with production reaching 72,000 MT (PhilFIDA, 2016).
Although the bulk of the country’s abaca fiber production is processed
locally, most of these processed products, particularly abaca pulp,
cordage/rope and fibercrafts (lifestyle products) are also exported all over the
world. Foreign shipment of these products including raw fiber is one of the
major contributors to the Philippine economy that in 2014, export receipts
generated reached US$111 million. Being a dollar trade, the rapid
developments in technology and product innovations happening worldwide
are realities that the Philippine abaca industry is challenged to meet not only
to maintain its global presence but to also further strengthen its dominant
position in the international abaca trade. Along this context, there is an urgent
need to align the existing programs and projects on Philippine abaca industry
to the Medium Term Philippine Development Plan (MTPDP) and consistent with
the United Nations Millennium Development Goals with special focus on
eradicating extreme poverty and hunger; promoting gender equality and
empowering women; ensuring environmental sustainability; and creating a
global partnership for development.
B. Objectives
The general objective of this project is to develop
an industry Roadmap that will set new and
pro-active direction for a stronger and more dynamic
Philippine abaca industry responsive to global realities and
challenges.
Specifically, this roadmap aims to:
1. Present an industry analysis covering farm structure,
industry performance (2017-2022) and policies;
2. Present new approaches, direction and policy such technologies for farm
production, seedling production and treatment of diseases;
3. Conduct benchmarking analysis;
4. Analyze the supply/value chain from input supply, production up to final
sale of raw fibers;
5. Present the competitive analysis focusing on price differences and
technical advantage of Philippine abaca over Ecuadorian abaca;

THE PHILIPPINE ABACA INDUSTRY ROADMAP 2018-2022 3
6. Conduct SWOT analysis;
7. Craft an industry vision, mission, goals, objectives, strategies, action plan
and the required budget; and
8. Determine the development programs and budgetary requirements,
public and private initiatives (for possible local and global partnership for
development and local/foreign direct investments).
C. Data Sources and Methodology
1. Data Sources
The crafting of this roadmap was based on the prescribed format, data
and information provided by the PhilFIDA, High Value Crops Program of the
Department of Agriculture and consultants from the University of Asia and the
Pacific. The data for this expository study were gathered from both primary and
secondary sources. The new administration made revisions to update the
data.
Most of the information provided in this roadmap were obtained from
the fiber statistics data of the Philippine Fiber Industry Development Authority
(PhilFIDA), Bureau of Customs, Philippine Statistic Authority (PSA) and the
National Statistics Office’s Volume and Value of Exports/Imports Report from
2010 to 2016. Information particularly on production and baling were collected
from traders and grading and baling establishment (GBEs) through the Data
Monitoring System (DMS) of the agency.
Inputs were also collected from fiber processors/
manufacturers (local and foreign) and fiber exporters.
The 2009 National Abaca Survey of Areas Planted to
Abaca, a report by the Technical Assistance Division
of PhilFIDA, also served as an important primary source
for this paper. Various industry reports and
publications from the internet were used as secondary
source of data. These include Report on the
Conference on Sustainable Development, Rio De
Janeiro, Brazil by the United Nations (June 2012);
Opportunities in Natural Composites by Lucintel
(March 2011); Renewables 2010 Global Status Report
by the Renewable Energy Policy Network for the 21st Century; As Ethanol
Booms, Critics Warn of Environmental Effect by Erica Gies (2010); American
Energy: The Renewable Path to Energy Security by the Center for American
Progress; and other reports on Kafus Bio- Composites, World Draping Organic,
New Dimension to Organic Clothing, Present Directives for Product
Development, World Fiber Forecast 2030 and articles/publications from the
Food and Agricultural Organization (FAO) of the United Nations and the

THE PHILIPPINE ABACA INDUSTRY ROADMAP 2018-2022 4
International Documentation Center on Abaca of the University of the
Philippines at Los Banos.
Inputs were also gathered from various industry stakeholders during
consultation meetings and workshops organized by the PhilFIDA. Three (3)
consultation meetings were conducted on 4 October 2013 in Davao City
(Mindanao Cluster), 11 October 2013 in Cebu City (Visayas Cluster), and 15
November 2013 in Quezon City (Luzon Cluster). Additional inputs from the
report on the Cross-Visit of Abaca Farms in Iloilo done by PhilFIDA VIII, from the
2016 Stakeholders Forum in all regions and the recent Management
Conference of the agency held in Cagayan de Oro City last December 2016
were also collected. Moreover, some data were taken from the PhilFIDA 2016
Annual Report. Major industry players like farmers/producers, traders, private
sectors, processors and representatives from the academe, research
institutions, non- government organizations (NGOs), local government units
(LGUs) and concerned government agencies attended the meetings and
workshops. Views, insights, recommendations and commitments in the
finalization and implementation of the programs/activities in this Roadmap
were solicited from the different participants during the workshops and fora.
Analysis of data for all the chapters in this roadmap were done using the
available statistics. These data were explained using graphs and figures.
2. Area Coverage
This roadmap focused on the key producing abaca areas nationwide
such as Bicol Region and Mindoro in Luzon, Leyte, Samar, Negros Oriental, Iloilo
and Aklan in Visayas and all provinces in Mindanao. Davao and some parts
of Mindanao aims to become the major producer of abaca by 2022 as many
idle and unproductive lands of private sectors and Indigenous People will be
developed.
3. Analytics
This roadmap covered industry situationer, supply value chain analysis,
local benchmaking, competitive analysis, market analysis, SWOT analysis,
strategy settings, target planning and new policies for adaption of
technologies to improve the industry.
Industry Situationer. This covers the assessment of the abaca industry
structure and performance. The abaca industry situationer consisted of the
abaca farm structure and size, performance (covering production area and
yield, trade both exports and imports), production technology, local
consumption and prices.
Supply/Value Chain Analysis. The supply/value chain analysis discussed
the supply chain segments and players. It includes input supply, farm
production, primary processing, trade and final sale including the logistics

THE PHILIPPINE ABACA INDUSTRY ROADMAP 2018-2022 5
between each process. Similarly, it analyzes the cost build up along the supply
chain, including margins. It also dealt with the factors supporting growth of the
industry particularly key and main industries, programs, production support and
institutions. Finally, it identified the key constraints to value chain stability and
sustainability.
Benchmarking analysis. This portion compares the typical and good
farm practices in abaca fiber production. The analysis utilized both the
quantitative and qualitative measures. Qualitative analysis includes the
planting density, plant propagation or cultural management practices,
disease treatment, fiber extraction method and trading. On the other hand,
quantitative analysis includes the average yield per hectare, income,
payback period and IRR.
Competitive Analysis. The price competitiveness of the abaca industry
was analyzed as a highly exportable product. Analysis include the export
parity price, domestic whole sale price and export price ratio.
Market Trends and Prospects. The market trends and prospects
determine the glowing global interests and acceptability of the fiber products
emphasizing its role in the green economy. It includes discussion on the
potentials and markets of pulp and paper, composites for automotive,
construction and other purposes, textile, new product innovation and an
important component for sustainability certification of green products.
SWOT Analysis. This presented the industry’s advantages as strength and
opportunities and the constraints as the weaknesses and threats identified
according to the supply chain segments.
Target Setting. This portion includes the vision, mission, objectives and
targets (area, income and job generation).
Strategies and Policies. This covers the critical key result areas which
have to be addressed along the supply chain to enable the industry to meet
the targets.
4. Limitation
Abaca fiber is a raw material being used for industrial products such as
pulp and paper, cordage, fibercrafts, nanocellusoe and many others. As a
limitation, the value chain analysis covered only up to raw fiber or primary
processing.

THE PHILIPPINE ABACA INDUSTRY ROADMAP 2018-2022 6
CHAPTER II
INDUSTRY SITUATIONER
A. Abaca Farm Structure and Size
The development of an abaca plantation must take into consideration
the constraints of an industry that has several competitive substitutes which
include synthetics, sisal, maguey, kenaf, bamboo, wood products and others.
Plantation must be highly efficient and even from the start, plantation
development must already be planned towards maximum efficiency in
production. Elements for a good farm site are climate and soil, accessibility to
transport, manpower, and available financing services. With the advent of
new technology, topography is no longer a prime consideration since abaca
can now be planted in all types of terrains as long as the area is not water-
logged. For efficiency of production, field preparation, planting, maintenance
and postharvest facilities must be greatly considered.
The abaca farm structure in the Philippines is classified as a small farm
which was owned and managed by individual farmer. It has an average area
of 1.6 hectare for every farmer. There are only few abaca farms being
established and managed by cooperatives or associations. In 2016, many
private sectors with vast landholdings committed to venture in abaca
production in different regions, particularly in Mindanao.
Statistics shows that total farm area dedicated for
abaca farming in our country is almost 180,302 hectares.
The ratio of the total land area for abaca planting over
the total land area of the country reveals that only a
small portion of the country’s land area is utilized for
growing abaca because abaca farms are
concentrated in isolated and mountainous areas.
The region with the highest expansion potential is
Davao. Although, record shows that Davao Region only ranks
fourth at 13 percent or 15,880 hectares in terms of the current land area, it has
the highest potential for expansion at 20 percent of the total national land
area with 27,381 hectares capable of being expanded and converted into
abaca areas. When this amount of land is fully converted to abaca farming,
this will make the total area for Davao Region to some 41,000 hectares which
is slightly a little higher compared to the combined and current land areas of
Eastern Visayas.
Region V or the Bicol Region has a total land area of 49,531 hectares.
This land area is comparable to combined abaca areas of Regions CARAGA,
Davao, SOCCSKSARGEN and Western Visayas. Most of the areas planted with
abaca in Bicol Region are heavily concentrated in Catanduanes comprising
47 percent of the total area for the region. However, 33,136 hectares of abaca

THE PHILIPPINE ABACA INDUSTRY ROADMAP 2018-2022 7
in Catanduanes were damaged by Typhoon Niña in December 2016. It is
expected that fiber production will reduce significantly. To illustrate, the total
land area for Northern Samar alone is already comparative to a little more
than the total land areas planted to abaca in SOCCSKSARGEN and Western
Visayas. Second to Bicol Region is Eastern Visayas with a total land area of
45,527 hectares dedicated to growing abaca.
In 2013, Glatfelter was already looking for alternative sites for planting of
abaca as its main supplier, Catanduanes, is always visited by typhoon.
Glatfelter was recommending Panay to be developed because of its quality
fiber. The target expansion areas are concentrated mainly in less-typhoon
visited provinces where abaca is suitable.
The concentration of abaca farming is skewed toward the Visayas and
Mindanao areas specifically on the Eastern part of the country as manifested
with the top three regions. On the other hand, the three regions having the
least land area in terms of abaca farming can be found within Luzon. Pulp
companies are focused in Leyte and Bicol. They are concentrating on
establishing abaca farms in Mindanao and Western Visayas due to frequent
typhoons that damage abaca farms in Eastern Visayas and Bicol.
In terms of tenurial status of abaca farmers, 63 percent of the total
abaca farmer population own their respective farms and another 13 percent
obtained the land they are currently toiling from ancestral domains and
timberlands. Some ten thousand farmers or 9 percent of the population are
tenants of their respective farms.
Data revealed that only 13 percent of the abaca farmers use fertilizer in
growing abaca. Majority of the farmers or 87 percent do not apply fertilizer at
all and they depend only on the available soil nutrients. To those farmers who
apply fertilizer, 11 percent use organic fertilizer while 2 percent use the
inorganic ones.
Noting for a fact that farming is one of the major livelihood in the
Philippines, land areas for abaca farming are most, if not all, are being shared
with some intercrops. Record shows that a combination of banana and
coconut are the most common intercrops of abaca with 44
percent. This can be logically traced since these crops are
grown in almost the same condition with abaca thus farmers
tend to do intercropping to provide alternative sources of
income. Next to the combination of banana and coconut,
dominantly banana comes as the second most common
intercrop at 16 percent. Only 2 percent of the abaca farms
are intercropped with root crops.
Two of the most significant demographics that measure productivity of
farms are the frequency of harvest which determine the annual farm
productivity. The frequency of weeding which indicates the conscious effort
THE PHILIPPINE ABACA INDUSTRY ROADMAP 2018-2022 8
on the part of the farmers to clean their respective farms to avoid infestation
of diseases and thus, result to higher yield. Both annual harvest and weeding
frequencies show that in general, abaca farmers harvest and weed their
respective farms once to twice a year.
As part of the normal farming process, the specific market to which the
abaca farmers sell their abaca fiber is also determined. Study reveals that 85
percent of farmers sell their fibers in barangay and town traders. Only 2 percent
sell their produce to GBE’s and less than 1 percent to abaca processors.
B. Performance
1. Production, area and yield
From 2006 through 2016, production of abaca fiber averaged at 67,329
MT and had been decreasing at a moderate rate of 0.8 percent per annum.
There was a sharp drop in production in 2006, 2007 and 2013 caused by the
devastating typhoons that hit the Bicol, Leyte, Samar, Panay and some parts
of Mindanao, especially Typhoons Yolanda and Pablo. Production recovered
in 2008, reaching its peak at 77,389 MT as outputs of all producing regions,
particularly Bicol, Davao and Caraga, substantially increased during the
period. This was primarily the effect of the incremental production from the
abaca plantations established starting 2005 under FIDA’s program Goal I
“Development of New Agri-Business Lands” and the continued strong
demand and attractive prices offered for the fiber by local traders,
processors/manufacturers and exporters. The abaca industry, however,
suffered a setback in 2009 when fiber output slumped to its lowest level of
54,584 MT due to the weakened market demand and falling prices as a
consequence of the worldwide financial crisis. It was considered as the most
severe downturn since the Great Depression of the 1930s. Furthermore, many
abaca farms were still infected with viral diseases such as Bunchy-Top, Bract
Mosaic and Mosaic which hampered abaca fiber production. In 2012, the
production of 64,806 MT is still below the average annual production.
Typhoons Yolanda and Pablo contributed much to the very low production in
2013 at 55,958 MT but continuous effort in the opening of new abaca areas
and rehabilitation of diseased abaca farms, a 15.0 % increase in production
was reached in 2014 at 66,004.

THE PHILIPPINE ABACA INDUSTRY ROADMAP 2018-2022 9
Figure 1. Abaca fiber production, 2006-2016.
Source: PhilFIDA DMS Report 2016
From 2006-2008, Eastern Visayas had been the leading abaca
producing region with an average of 23,560 MT. The last six years however,
was dominated by the Bicol region contributing an average of 20,082 MT or 35
percent. Eastern Visayas followed with an average of 14,623 MT or 25 percent
while Davao Region, supplied 13 percent or an average of 4,376 MT ranked
Figure 2. Top abaca fiber producing provinces (in MT), 2006-2015.

THE PHILIPPINE ABACA INDUSTRY ROADMAP 2018-2022 10
third. Catanduanes consistently remained as the biggest abaca- producing
province.
The top five abaca producers from 2006-2015 were Catanduanes, Leyte,
Northern Samar, Davao Oriental and Surigao del Sur. In 2015, the leading
producers of abaca were the provinces of Catanduanes, Davao Oriental,
Northern Samar, Lanao del Sur and Davao del Sur.
Driven by the improving
demand for abaca, in 2005,
PhilFIDA implemented its abaca
plantation expansion program,
“Development of New Agri-
Business Lands” where farmers
were encouraged to open new
abaca plantations. In 2006, abaca
hectarage reached 141,711
hectares and further increased to
176,793 hectares in 2012 capable
of meeting increased fiber
demand. In 2013, however, a
decrease in abaca areas was
attributed to typhoons and
phased out areas due to disease eradication activity. The plantation area has
increased to 179,858 hectares in 2015 and 180,302 hectares in 2016.
Figure 3. Top abaca producing regions, 2006-2015
Source: Abaca Statistics 2006-2015
Figure 4. Area planted to abaca, 2006-2016.

THE PHILIPPINE ABACA INDUSTRY ROADMAP 2018-2022 11
In terms of regional
distribution of abaca farms,
the Bicol Region has a total
land area of 49,531 hectares
or 29% of abaca areas
nationwide. Most of the
areas planted with abaca in
Bicol Region are heavily
concentrated in
Catanduanes comprising 47
percent of the total area for
the region. Second to Bicol
Region is Eastern Visayas
with a total land area of
45,527 or 26% hectares
dedicated to growing
abaca. CARAGA and
Davao Regions ranked third
and fourth with areas of
19,087 (13%) hectares and
15,880 (11.8%) hectares,
respectively.
As shown in Figure 6a, the ARMM has the highest yield for the past ten
years with 718 kilogram per hectare per year followed by Davao Region with
509 kilogram per hectare;
Bicol Region with 455
kilogram per hectare and
Eastern Visayas with 358
kilogram per hectare.
Likewise, Figure 6b shows
that Northern Mindanao is
the highest producing
region in terms of yield for
the year 2015 with 1,255.2
kilogram per hectare
followed by ARMM with
981.6 kilogram per
hectare which is higher
than the 10-year average
yield.
Figure 5. Regional Distribution of Abaca Farms, 2006-2015.
Figure 6a. Top Regions in terms of yield,
2006-2015

THE PHILIPPINE ABACA INDUSTRY ROADMAP 2018-2022 12
2. Prices
The price of abaca fiber depends on the manner of extraction, whether
hand- stripped or spindle-stripped, and on the fiber grade based on cleaning.
As a traded commodity, the price of abaca fiber is also dependent on
market forces. The strong demand for abaca, particularly for pulp starting in
early years until 2005, and the tight supply situation due to the effects of
typhoons in 2006, which continued to be felt until the early part of 2008, caused
the escalation of abaca prices, reaching their peak in 2008. The weakened
global demand due to recession especially in the country’s major trading
partners also caused prices to fall slightly in 2009 and 2010 but improved in the
succeeding years (Figures 7 and 8). In 2016, the prices of fiber escalated to its
highest peak because of lack of fiber supply in the market. This was due to
limited farm production, rampant infestation of diseases in abaca farms and
inefficient post-harvest machineries and facilities. S2 Grade is decreasing but
commands a higher price among abaca traders.
Figure 6b. Abaca fiber yield per region, 2016.
Fiber Grade Excellent AD, EF, S1, S2 Good I, G, H Fair JK, M1 Course L Residual Y1, Y2, O, T, WS Decorticated Fibers AD1, AD2, AD3 and AD4

THE PHILIPPINE ABACA INDUSTRY ROADMAP 2018-2022 13
Figure 7. Weighted average export prices of hand-stripped abaca by grade, 2006-2015
Source: Abaca Statistics, 2006-2015
Figure 8. Weighted average export prices of spindle-stripped abaca by grade,
2006-2015
Source: Abaca Statistics, 2006-2015

THE PHILIPPINE ABACA INDUSTRY ROADMAP 2018-2022 14
3. Local Consumption
Domestic processors used an average of 49,260 MT or 76.51 percent of
the country’s average yearly production of abaca fiber during the past
decade. Abaca fiber is being processed locally into pulp, cordage and
various fibercrafts items including furniture.
The pulp sector consistently remained as the growth area of the abaca
industry utilizing an average of 37,043 MT or 75.2 percent of the annual
average local consumption and increasing at a minimal rate of 0.4 percent
per annum. The pulp millers’ utilization level is highly dependent on the
demand for pulp by the specialty paper manufacturers abroad as abaca pulp
is the raw material used in meat and sausage casings, tea/coffee bags, k-
cups, bags, cigarette paper, currency paper, nancocelluse, polyester and
other specialty papers. Processing of pulp into specialty papers is done in
Europe, the US, Japan and China as there is no available processing facility in
the country.
The cordage sector, on the other hand, consumed an average of 8,493
MT of abaca fiber per annum or about 17.2 percent of the yearly average
usage of domestic manufacturers. Utilization decreased by 6.4 percent per
year from 2006 to 2015. Cordage and allied products have continuously been
facing stiff competition from synthetics and other cheaper natural materials.
Major cordage companies in the Philippines are the Manila Cordage and
Pacific Cordage.
Figure 9. Domestic consumption of abaca, 2006-2015
Source: Abaca Statistics, 2006-2015

THE PHILIPPINE ABACA INDUSTRY ROADMAP 2018-2022 15
Fiber utilization of fibercraft processors who are mostly cottage-based,
exhibited a decreasing trend of 10.6 percent and consuming an average of
3,724 MT or 7.6 percent of the annual average domestic consumption. These
figures, however, may not reflect the actual situation in the fibercraft industry,
as purchases of other fibercraft makers were in loose form and therefore
difficult to monitor. Unlike the other sectors, the fibercraft processors are
numerous, not well-organized and are scattered throughout the country
(Figure 9).
In 2012, abaca domestic consumption declined by 4.6 percent
compared to the average of 10-year period of 49,260 MT. From 2006 to 2015,
pulp accounted for the biggest share of consumption at 75.2 percent or 37,043
MT. It was distantly followed by cordage, yarns and twines with only 8,493 MT
and fibercrafts with 3,724 MT. The domestic consumption for pulp significantly
increased in 2014 with 30,639 MT almost comparable to the 10-year average
of 37,043 MT from 2006 to 2015.
4. Trade
Exports
For the past ten years, the Philippines generated an average of US$100
million per year from the exports of abaca fiber and manufactures. Some 87
percent or an average of US$87 million came from abaca manufactures such
as pulp, cordage, yarns, fabrics and fibercrafts. The rest (13 percent) was from
raw fiber exports with yearly average earnings of US$12.94 million.
Among the abaca manufactures, pulp continued to lead exports.
Shipments averaged US$63.1 million, equivalent to a 65 percent share of the
average export earnings per year. Meanwhile, fibercrafts and cordage/allied
products generated US$7.7 million (7.9 percent) and US$13.0 million (13.45
percent) per annum, respectively, while yarns and fabrics accounted for
US$0.98 million (1.0 percent) of the yearly average. In 2016, abaca fiber
export earnings increased to $51.4 million, from 2015 with US$ $36.8 million
earnings from January to May (philstar.com).

THE PHILIPPINE ABACA INDUSTRY ROADMAP 2018-2022 16
Abaca Fiber
Exports of fiber averaged 9,841.4 MT per annum from 2006 to 2015.
Growth decreased at 0.8 percent per annum during the period. The demand
of the country’s major trading partners, the United Kingdom (UK) and Japan,
had been erratic since the financial crisis hit the global economy. In 2010,
however, there was a substantial increase in abaca imports of the major buyers
including emerging market, China, following their gradual recovery from the
global economic recession. In the succeeding years though, the purchases of
the UK and Japan and the rest of the European and Asian countries slowed
down by 42.7 percent as some specialty papermakers abroad shifted to the
importation of abaca pulp instead of the usual raw fiber.
Europe, specifically the UK and Germany, is the premier destination of
abaca fiber, absorbing an average of 4,485 MT or 45.6 percent of the ten-year
average exports. Exports remained at practically the same level in 2006-2008
but further slumped to 3,329 in 2009 due to global economic downturn. In 2010,
abaca exports to UK made an upturn to 4,216 MT but only to decline in the
succeeding two years but rebounded to 5,817 MT in 2015. Because of the
slowdown, fiber exports to the country declined at a rate of 1.6 percent during
the 10-year period.
Figure 10. Export earnings from abaca fiber and manufactures, 2006-2015
Source: Abaca Statistics, 2006-2015

THE PHILIPPINE ABACA INDUSTRY ROADMAP 2018-2022 17
The Asian market was the
second most important
destination of abaca fiber,
with Japan as the leading
buyer. Japan continued to
influence abaca trade in the
region accounting for the
biggest market of 3,651 MT or
37 percent of the 5,000MT
annual average Asian imports.
From 2006 through 2008,
imports of Japan rebounded
due to the printing of the
Japanese yen that has new
designs and sophisticated
security features as protection.
Furthermore, businesses in Japan have picked up supported by its strong
exports to the United States (US) and Asian countries, especially China. In 2009,
however, the Japanese market slowed down following the global economic
recession. Fiber imports severely contracted to 1,502 MT but rebounded in 2010
when demand picked up by as much as 4,680 MT. Imports, however, dropped
to only 3,867 MT in 2011 and further dipped to 1,297 MT and 960 MT in 2012 and
2013 due to the continuing effects of the financial downturn. Fiber exports in
2014 exponentially increased gaining a 277 percent increase to 3,625 MT
compared to previous year and further increased in 2015 at 4,846 MT.
On the other hand, India and Indonesia had consistently been buying
abaca fiber although the shares were very minimal at one percent each.
Abaca fiber is used as raw material in the manufacture of cordage and
fibercrafts in these countries. China’s share accounted for 11.4 percent (1,122
MT) of the overall Asian trade and is presently the second biggest Asian market
for Philippine abaca fiber. It is now using the fiber in the manufacture of tea
bag, capacitor paper and fibercrafts.
The importation of North America averaged 32.7 MT from 2006 to 2008
with the US as the sole market destination. Imports of the US consistently
remained low because its biggest abaca pulp mill ceased to operate in 2004
to concentrate in the UK. From 2009 to 2015, the US market was seriously hit by
recession which led to its non- importation of abaca from the Philippines.
In 2013, export of abaca fiber recorded its lowest value of 4,456 MT far
from the 10-year average of 9,841 MT. In that year, UK was the highest importer
with 1,936 MT or 57.88 percent of the total volume.
THE PHILIPPINE ABACA INDUSTRY ROADMAP 2018-2022 18
Abaca Pulp
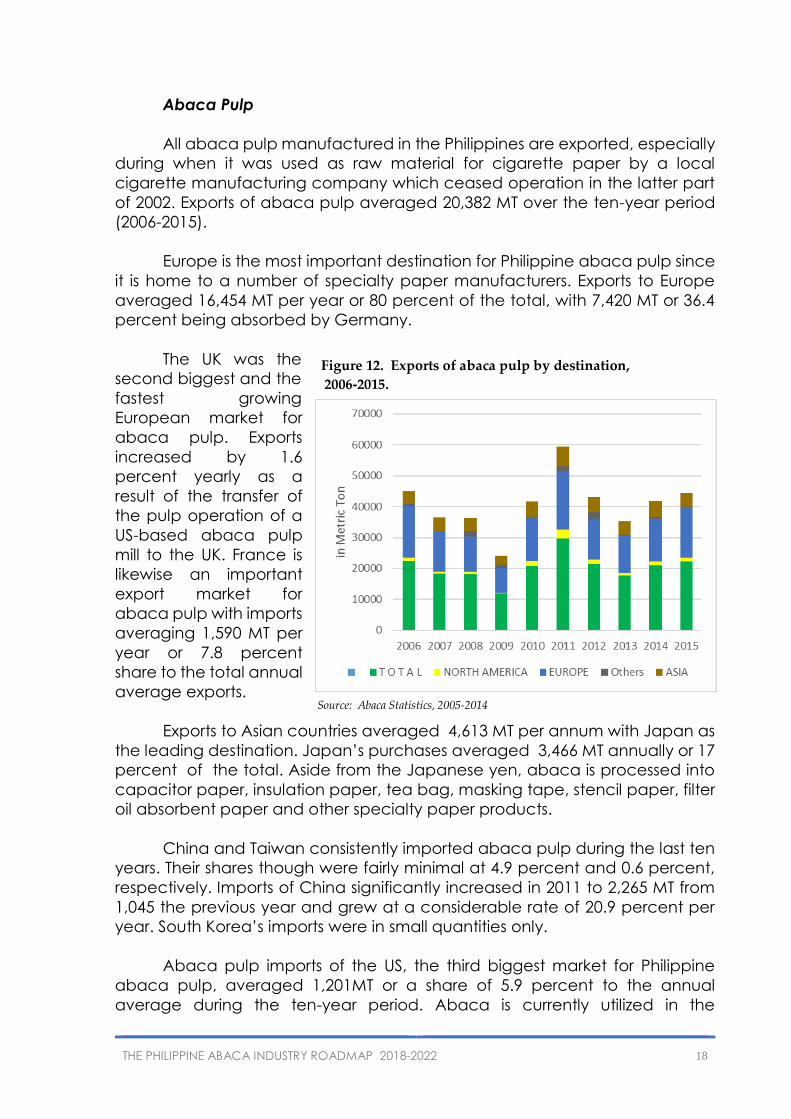
All abaca pulp manufactured in the Philippines are exported, especially
during when it was used as raw material for cigarette paper by a local
cigarette manufacturing company which ceased operation in the latter part
of 2002. Exports of abaca pulp averaged 20,382 MT over the ten-year period
(2006-2015).
Europe is the most important destination for Philippine abaca pulp since
it is home to a number of specialty paper manufacturers. Exports to Europe
averaged 16,454 MT per year or 80 percent of the total, with 7,420 MT or 36.4
percent being absorbed by Germany.
The UK was the
second biggest and the
fastest growing
European market for
abaca pulp. Exports
increased by 1.6
percent yearly as a
result of the transfer of
the pulp operation of a
US-based abaca pulp
mill to the UK. France is
likewise an important
export market for
abaca pulp with imports
averaging 1,590 MT per
year or 7.8 percent
share to the total annual
average exports.
Exports to Asian countries averaged 4,613 MT per annum with Japan as
the leading destination. Japan’s purchases averaged 3,466 MT annually or 17
percent of the total. Aside from the Japanese yen, abaca is processed into
capacitor paper, insulation paper, tea bag, masking tape, stencil paper, filter
oil absorbent paper and other specialty paper products.
China and Taiwan consistently imported abaca pulp during the last ten
years. Their shares though were fairly minimal at 4.9 percent and 0.6 percent,
respectively. Imports of China significantly increased in 2011 to 2,265 MT from
1,045 the previous year and grew at a considerable rate of 20.9 percent per
year. South Korea’s imports were in small quantities only.
Abaca pulp imports of the US, the third biggest market for Philippine
abaca pulp, averaged 1,201MT or a share of 5.9 percent to the annual
average during the ten-year period. Abaca is currently utilized in the
Figure 12. Exports of abaca pulp by destination,
2006-2015.
Source: Abaca Statistics, 2005-2014

THE PHILIPPINE ABACA INDUSTRY ROADMAP 2018-2022 19
manufacture of cigarette filters of the Winston and Marlboro Lights cigarettes,
among others.
Exports of abaca pulp averaged at 20,382 MT for the ten-year period. The two
top importers were Germany and the UK with 7,420 MT and 4,686 MT,
respectively.
Tea Bags
The provinces of Catanduanes, Aklan and Iloilo are supplying the
certified abaca fibers to Glatfelter Gmbh that are made into tea bags of
Lipton Tea. The 2013 demand of tea bags is 206 Billion annually. Some
processors are also producing tea bags. By 2020, the Unilever will only procure
certified fibers.
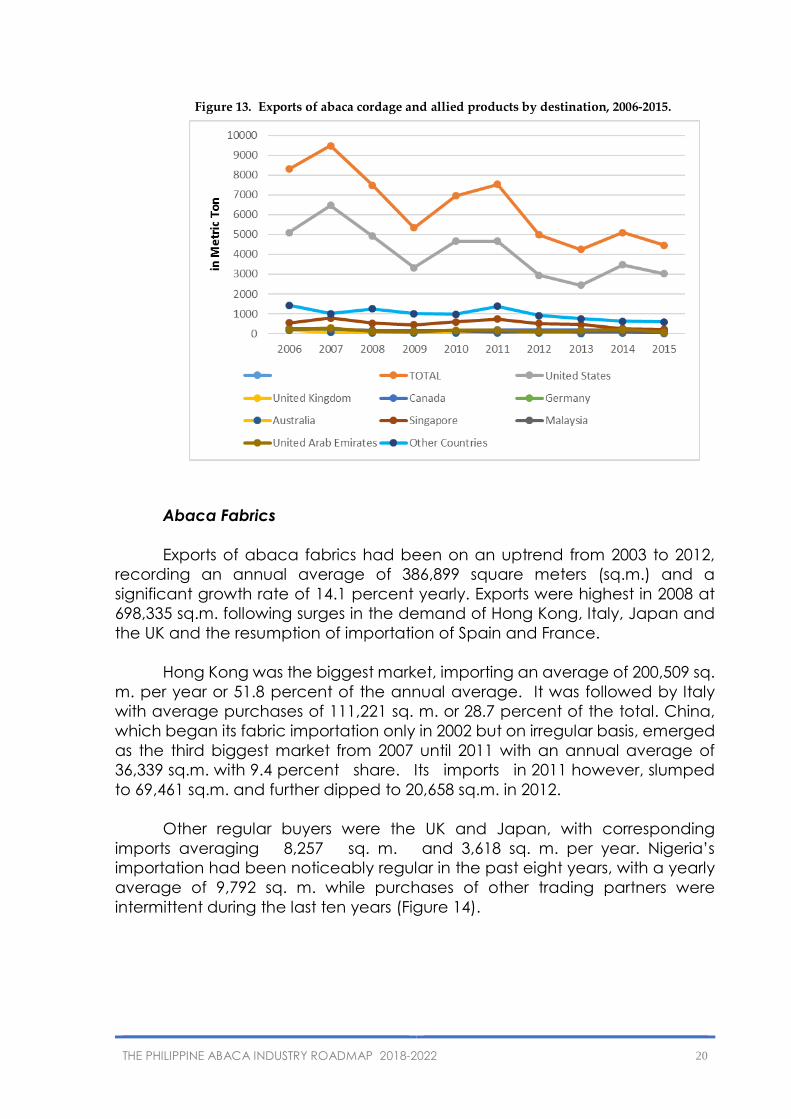
Abaca Cordage and Allied Products
From 2006 through 2015, exports of abaca cordage and allied products such
as ropes, cables and twines averaged 6,355 MT per year. Shipments were
decreasing at 6.7 percent annually. The stiff competition posed by cordage
products made of synthetics and other cheaper natural materials continued
to affect the country’s abaca cordage industry.
The US absorbed the bulk of the exports accounting for 64.2 percent or
an average of 4,100 MT. Singapore, Canada, the United Arab Emirates, the UK,
Germany, Malaysia and Australia consistently remained as the other major
markets for Philippine cordage (Figure 13).
In 2013, exports of abaca cordage and allied products slid to their
lowest in the past seven years to 4,240 MT or only 66 percent of the average
6,385 MT. The US absorbed the bulk with 2,443 MT or 58 percent of the total
while Australia had the lowest at only 7.4 MT or 0.17 percent share.
THE PHILIPPINE ABACA INDUSTRY ROADMAP 2018-2022 20
Abaca Fabrics
Exports of abaca fabrics had been on an uptrend from 2003 to 2012,
recording an annual average of 386,899 square meters (sq.m.) and a
significant growth rate of 14.1 percent yearly. Exports were highest in 2008 at
698,335 sq.m. following surges in the demand of Hong Kong, Italy, Japan and
the UK and the resumption of importation of Spain and France.
Hong Kong was the biggest market, importing an average of 200,509 sq.
m. per year or 51.8 percent of the annual average. It was followed by Italy
with average purchases of 111,221 sq. m. or 28.7 percent of the total. China,
which began its fabric importation only in 2002 but on irregular basis, emerged
as the third biggest market from 2007 until 2011 with an annual average of
36,339 sq.m. with 9.4 percent share. Its imports in 2011 however, slumped
to 69,461 sq.m. and further dipped to 20,658 sq.m. in 2012.
Other regular buyers were the UK and Japan, with corresponding
imports averaging 8,257 sq. m. and 3,618 sq. m. per year. Nigeria’s
importation had been noticeably regular in the past eight years, with a yearly
average of 9,792 sq. m. while purchases of other trading partners were
intermittent during the last ten years (Figure 14).
Figure 13. Exports of abaca cordage and allied products by destination, 2006-2015.

THE PHILIPPINE ABACA INDUSTRY ROADMAP 2018-2022 21
Generally, the demand for abaca fabrics and other fiber-based
products is largely dictated by fads and fashion. However, other consumers
patronize natural-based materials not only due to their unique appeal but also
due to environmental considerations.
In 2012, exports of abaca fabrics declined by 31 percent as compared
to the 10-year period average of 386,899 sq.m. Hong Kong had the highest
import of 169,217 sq.m. or 63.5 percent of the total.
Imports
Since 1991, local pulp manufacturers had been importing abaca fiber
from Ecuador except in 2005. The pulp processors resorted to imports to
address the deficiency in local supply of specific grades and meet pulp
buyers’ specifications. In 2012, abaca imports fell by 68.3 percent against
the 10- year period average to only 103 MT valued at US$ 105,147. Imports
gained a peak in 718.3 MT valuing at US$1,078,342 million. Imports continued
to increase in 2014 at 1,039.5 MT being the highest record in 10 years having a
value of US$1,773,803 million.
Source: Abaca Statistics, 2006-2015

THE PHILIPPINE ABACA INDUSTRY ROADMAP 2018-2022 22

THE PHILIPPINE ABACA INDUSTRY ROADMAP 2018-2022 23
CHAPTER III
FARM INCOME ANALYSIS
Cash flows are compared between typical and modern farming at
every step of production of abaca fiber. Typical farming requires less farmer
intervention and material inputs than modern or good farming. The data for
typical farm was based on abaca farm in Bicol Region planted with Abuab
variety. The data for modern farm was based on Maguindanao variety
planted in Davao.
A. Production Costs
Establishment cost is PhP 38,295 for the typical and PhP 68,045 for the
modern farm including 10 percent allowance for mortality of planting
materials. The planting densities are at 1,000 hills per hectare both for typical
and modern farm. An average labor and material cost of PhP14,700 and
PhP19,075 for typical farming and PhP 19,250 and PhP 43,075 for modern
farming, respectively will be incurred. Additionally, logistics and land lease
amounts to PhP 4,520 and PhP 5,720 for typical farm and good farm,
respectively.
Total maintenance cost is PhP3,775 for the typical farm and PhP 22,425
for the modern farm. On the typical farming, weeding and under brushing are
done only once during harvesting of abaca. No fertilizer application and pest
control are being performed by the farmer. While on the good/modern
farming, weeding and under brushing are done three times a year.
Pesticide/insecticide application at the rate of one liter per hectare is done
twice a year to prevent the occurrence of pest and diseases. Three bags of
urea fertilizer are being applied three times a year.
Average harvesting cost per year for typical farming is PhP 16,450 while
good farming has an average harvesting cost of P 12,250. At the farm level,
only primary processing is undertaken. This involves the extraction of fiber from
the harvested tuxies. The two methods of extraction are being used hand
stripping for typical farming and mechanized stripping for good farming. Drying
is done through air drying. The abaca fiber recovery of 1.5 percent is used using
“0” serration standard stripping both in hand hagutan and mobile spindle
machine.
THE PHILIPPINE ABACA INDUSTRY ROADMAP 2018-2022 24
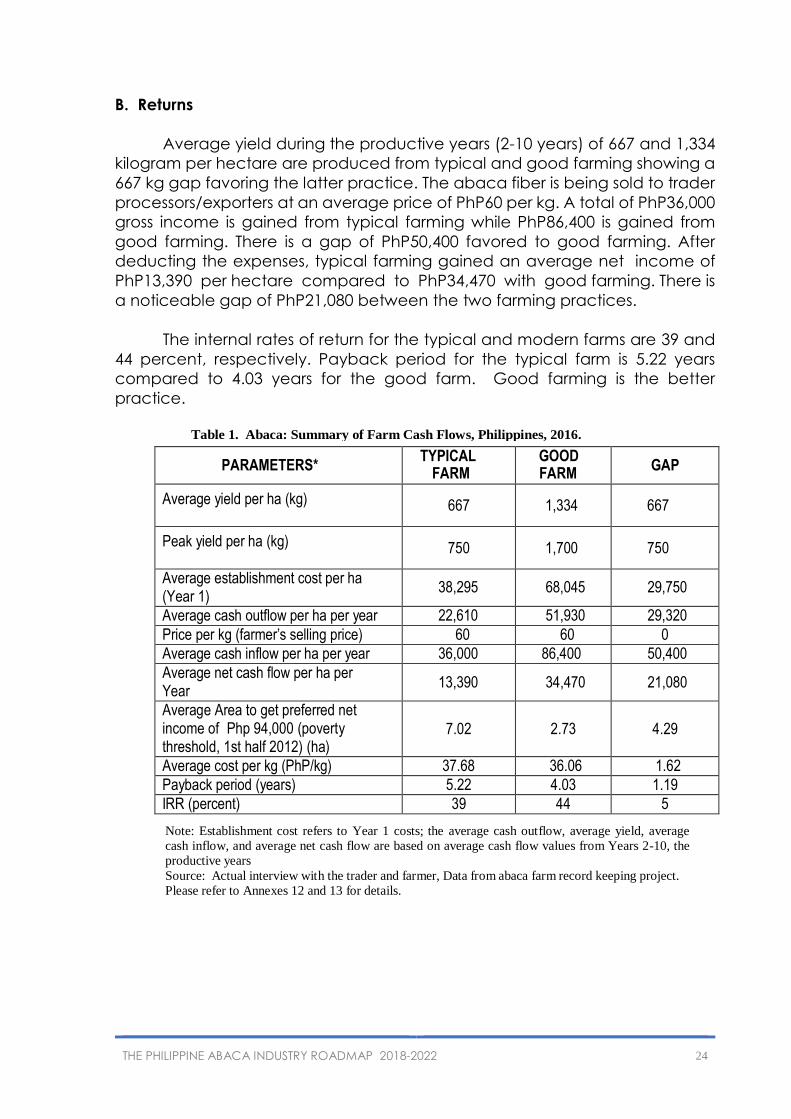
B. Returns
Average yield during the productive years (2-10 years) of 667 and 1,334
kilogram per hectare are produced from typical and good farming showing a
667 kg gap favoring the latter practice. The abaca fiber is being sold to trader
processors/exporters at an average price of PhP60 per kg. A total of PhP36,000
gross income is gained from typical farming while PhP86,400 is gained from
good farming. There is a gap of PhP50,400 favored to good farming. After
deducting the expenses, typical farming gained an average net income of
PhP13,390 per hectare compared to PhP34,470 with good farming. There is
a noticeable gap of PhP21,080 between the two farming practices.
The internal rates of return for the typical and modern farms are 39 and
44 percent, respectively. Payback period for the typical farm is 5.22 years
compared to 4.03 years for the good farm. Good farming is the better
practice.
PARAMETERS* TYPICAL
FARM GOOD FARM
GAP
Average yield per ha (kg)
667
1,334
667
Peak yield per ha (kg)
750
1,700
750
Average establishment cost per ha (Year 1)
38,295
68,045
29,750
Average cash outflow per ha per year 22,610 51,930 29,320
Price per kg (farmer’s selling price) 60 60 0
Average cash inflow per ha per year 36,000 86,400 50,400
Average net cash flow per ha per Year
13,390
34,470
21,080
Average Area to get preferred net income of Php 94,000 (poverty threshold, 1st half 2012) (ha)
7.02
2.73
4.29
Average cost per kg (PhP/kg) 37.68 36.06 1.62
Payback period (years) 5.22 4.03 1.19
IRR (percent) 39 44 5
Note: Establishment cost refers to Year 1 costs; the average cash outflow, average yield, average
cash inflow, and average net cash flow are based on average cash flow values from Years 2-10, the
productive years
Source: Actual interview with the trader and farmer, Data from abaca farm record keeping project.
Please refer to Annexes 12 and 13 for details.
Table 1. Abaca: Summary of Farm Cash Flows, Philippines, 2016.
THE PHILIPPINE ABACA INDUSTRY ROADMAP 2018-2022 25
CHAPTER IV
SUPPLY/VALUE CHAIN ANALYSIS
This chapter discusses the supply/value chain of abaca fiber in typical
and good farms. The value chain involves the processes of production,
marketing and sale of abaca fiber in both farms. The supply/value chain for
these two types of farms will be differentiated through the technology being
applied by the farmers, particularly in fiber production, in order to efficiently
address market demand. The sequence of abaca business activities from
the provision of inputs to primary production, transformation and marketing,
up to the final sale; the players, key institutions and support industries
involved in all the processes; and the costs, value added and margins
prevailing in the abaca fiber industry will be presented in this chapter.
A. Supply Chain Segments and Players
The segments along the supply chain are identified by players and their
main functions.
A.1. Inputs Supply
Planting Materials. Abaca planting materials come from nurseries of
abaca farmers or PhilFIDA seedbanks, private sector-owned tissue culture
laboratories and the existing PhilFIDA tissue culture laboratories.
Tools and Equipment. Tools and equipment such as bolo, rake, spade,
power sprayer, grass cutter and others will be supplied from the accredited
dealers of farm tools and machinery equipment, hardware stores and
agricultural supply stores in the locality.
Fertilizers and Pesticides. This will be procured from the agricultural
supply dealers and stores in the locality.
A.2. Farm Production
Farmers cultivate land, fertilize, maintain and harvest abaca stalks for
primary processing of producing abaca fiber. It involves farm activities such as
area selection, land preparation (underbrushing, digging of holes, and
layouting), planting, farm management (weeding, pest and disease control,
fertilization and trimming of dry leaves) and harvesting (topping of leaves,
tumbling, hauling and piling).
A.3. Primary Processing
This process includes extraction of abaca fiber from the stalks (tuxying,
stripping by manual or machine operated, decorticating), drying of fibers and

THE PHILIPPINE ABACA INDUSTRY ROADMAP 2018-2022 26
bundling. This will be done by the farmers, skilled strippers and laborers. Hand
hagutan tools will be used for manual extraction while spindle-stripping
machine and decorticating machine for mechanized extraction process.
These will be all procured from accredited fabricators in the locality.
A.4. Trade
Trading is done directly in the farm or local barangay, municipal/town
and provincial traders/buyers. Traders buy dried abaca fiber from the farmers
all-in (not yet segregated according to grade). In the case of cooperatives/
associations, they sell directly to the processors or Grading and Baling
Establishments (GBEs). Activities involved in this segment are consolidating,
hauling, grading and classification, baling and transporting. Traders, GBEs,
warehouse and transport firms are among the players involved in this segment.
A.5. Market
This involved the buying/selling of classified and graded abaca fibers for
processing into end products. Players involved are exporters and local
processors (for pulping, cordage, fibercrafts, etc.)
A.6. Logistics
Logistics covers services for the transport of graded and baled abaca
fibers to end- users, processors and exporters.
The processes and players in the value chain map for good farms are
totally different from the typical farms. There are some crucial factors that are
added/changed in some segments enumerated in the value chain map. For
good farms, farmers will use suckers or corms and seeds as planting materials
as part of their inputs, their production activities will involve the application
of organic liquid fertilizers and farmers observe good agricultural practices in
improving their farms with regards to growth and treating diseases. Also, in the
primary processing, fibers will be mechanically stripped using high capacity
machines. And with the use of stripping machines, accredited fiber extraction
machine fabricators will be one of the important players in the value chain
map for good farms. With these crucial factors, farmers will have a modern
system of farming that will greatly increase the volume of abaca fiber
production.

THE PHILIPPINE ABACA INDUSTRY ROADMAP 2018-2022 27
Figure 17. Typical farm: Value chain map of abaca (Processes and Players)
Figure 18. Intensive farm: Value chain map of abaca (Processes and Players)

THE PHILIPPINE ABACA INDUSTRY ROADMAP 2018-2022 28
Industry Players
The abaca industry is made up of six major groups of industry players:
farmers, strippers, classifiers, traders, fiber exporters and processors/
manufacturers.
Farmers
As of 2016, there are about 128,958 abaca farmers cultivating a total
area of 180,302 hectares or an average of 1.43 hectares per farmer.
Strippers
Strippers extract the fibers, either by hand or mechanical means.
Included in the stripping work are harvesting of stalks, tuxying and drying of
fibers. The strippers are paid on a pre-determined system wherein they
receive 50, 60 or 70 percent of the harvest depending on the practice agreed
upon and depending on the region. In 2014, some farmers or farmer groups
bought or availed decorticating and spindle machines from the government,
NGOs and pulp manufacturers.
Classifiers
Classifiers sort and grade the fiber based on the standards set by the
government. They are trained by the PhilFIDA.
Traders
Trading of abaca fiber is done at different levels depending on the
location of the farmers and where the accumulation of fiber is done. Hence,
there are traders in the barangay, town, province, city and region. In each
level, the pricing system includes mark-up attributable to the service provided
by the traders.
Traders are classified depending on the volume of fibers being traded.
A Class A trader sells more than 75,000 kg of fiber per year; Class B trader, more
than 50,000 kg up to 75,000 kg per year; Class C trader, more than 25,000 kg
up to 50,000 kg per year and Class D trader, 25,000 kilos and below.
As of 2016, there are about 750 licensed traders and 23 licensed trader-
exporters.
Fiber Exporters
The fiber exporters, also known as grading and baling establishments
(GBEs), operate in major abaca-producing regions and usually maintain liaison
offices in Metro Manila. It is in this sector where abaca fiber, whether for local
or foreign consumption, are graded and baled, using high density presses, into

THE PHILIPPINE ABACA INDUSTRY ROADMAP 2018-2022 29
125 kgs of 100 cm x 55 cm x 60 cm bundles per specific fiber grade. There are
ten licensed grading and baling establishments operating in the country. The
best bailing machine can be found in Davao which is owned by a trader that
export fibers to China and Spain.
Processors/Manufacturers/Pulp Millers
As of 2016, four abaca pulp companies are expanding operations in the
country: one in Bicol, two in Leyte and one in Iligan. The companies have well-
established international market networks for their pulp.
Cordage Manufacturers
There are currently six cordage firms operating in the various parts of the
country: two in Metro Manila, one each in Laguna, Albay, Cebu and Davao.
They use abaca fiber as the principal raw material for rope, cordage and twine
manufacturing. Blending with other natural fibers like maguey is done
depending on the specifications of the buyers.
Fibercraft Processors
The fibercraft sector, which includes manufacturers of handmade
paper, rugs and carpet and handloom weavers, is primarily a cottage-based
industry. Operating mostly in the countryside, the sector is a major source of
livelihood especially among women and out-of-school youths. Several of these
manufacturers, particularly the Tinalak Foundation based in Tagum, Davao,
have successfully established their markets abroad especially with their unique,
functional and creative designs.
The handloom weaving sector produces abaca fabrics being utilized as
raw material for making novelty and household items, as décor and wrapping
material as well as for high fashion wear and accessories. Some abaca
weaves are blended with metallic threads or polyester while others have
printed, striped and ethnic designs to suit the varying needs of the market. The
industry is mainly found in Bicol, Western Visayas, Eastern Visayas, Central
Visayas and in Southern Mindanao, wherein particularly in the latter,
indigenous people are actively engaged in tinalak, nabel and dagmay
weaving. Production of new product lines for fashion wear, accessories and
specialty/novelty items is mostly based in Metro Manila.
In 2016, about 156 licensed fibercraft processors have been recorded
who used abaca as their raw material for their processing activities.
Other Processors
Other processors include manufacturers of machine-woven carpet,
dartboard pads, soap and lotion (from enzymes) as well as the makers of

THE PHILIPPINE ABACA INDUSTRY ROADMAP 2018-2022 30
furniture who are now using fiber and “bacbac”, the dried outer skin of the
abaca leafsheath.
B. Costs, Value Added and Margins
The cost builds up from inputs, production, processing up to exporting of
abaca is summarized in Figure 20 and 21. Average values for the peak
productive years (year 4-10) are considered. Value-added and profit
margins were calculated for both farming practices. No inputs were further
added during the fourth up to tenth production year for a typical farm
therefore entailing no input supply cost in its supply value chain. The farmer’s
value-added margin is computed by adding the cost of labor, processing,
land lease and profit margin for typical and good farm alike. Delivery cost of
fiber from farm gate to trader was included in the total farmer’s cost while the
cost of delivery from trader to importer was charged to the trader.
Figure 19. Typical farm: Value addition of abaca (Abaca Fiber Production)

THE PHILIPPINE ABACA INDUSTRY ROADMAP 2018-2022 31
Figure 20. Typical farm: Abaca value chain, (PhP/kg fiber) Philippines 2015.
Figure 21. Intensive farm: Abaca value chain, (PhP/kg fiber) Philippines 2015.
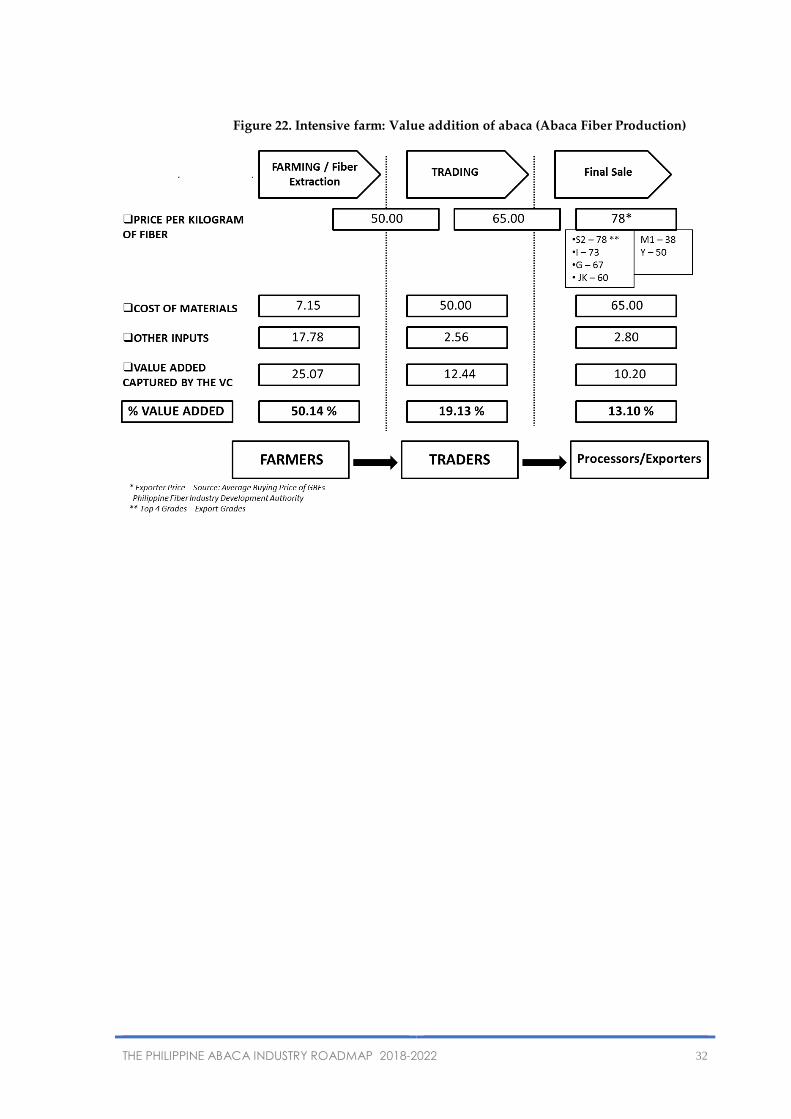
THE PHILIPPINE ABACA INDUSTRY ROADMAP 2018-2022 32
Figure 22. Intensive farm: Value addition of abaca (Abaca Fiber Production)

THE PHILIPPINE ABACA INDUSTRY ROADMAP 2018-2022 33
Figure 23. Typical farm: Schematic diagram of the Value chain of abaca (PhP/kg fiber)
2016.

THE PHILIPPINE ABACA INDUSTRY ROADMAP 2018-2022 34
Figure 24. Intensive farm: Schematic diagram of the Value chain of abaca (PhP/kg fiber)
2016.

THE PHILIPPINE ABACA INDUSTRY ROADMAP 2018-2022 35
CHAIN NODE COST PhP/kg VALUE ADDED PhP/kg PROFIT MARGIN PhP/kg
Input Supply Cost of inputs 1.00
Logistics Cost of delivery of inputs to farmgate -
Farm Production Cost of material inputs 1.00 Farmgate selling price 50.00
Labor cost 12.79 cost of inputs 1.00
maintenance 1.04 cost of farm labor 12.79
topping, tumbling and piling 2.50 land lease 2.08
tuxying and hauling 7.50
farm tools (depreciation) 1.74 15.87
Land lease 2.08
= Total production cost 15.87 = Profit Margin 34.13
Primary Processing Farmgate selling price 50.00
Stripping 10.00 cost of inputs 1.00
Drying and bundling 0.83
= Total primary processing cost 10.83
= Value Added 49.00
Table 2. Typical farm: Cost structure, value-added and margin
for each segment of abaca value chain, Philippines
2016.

THE PHILIPPINE ABACA INDUSTRY ROADMAP 2018-2022 36
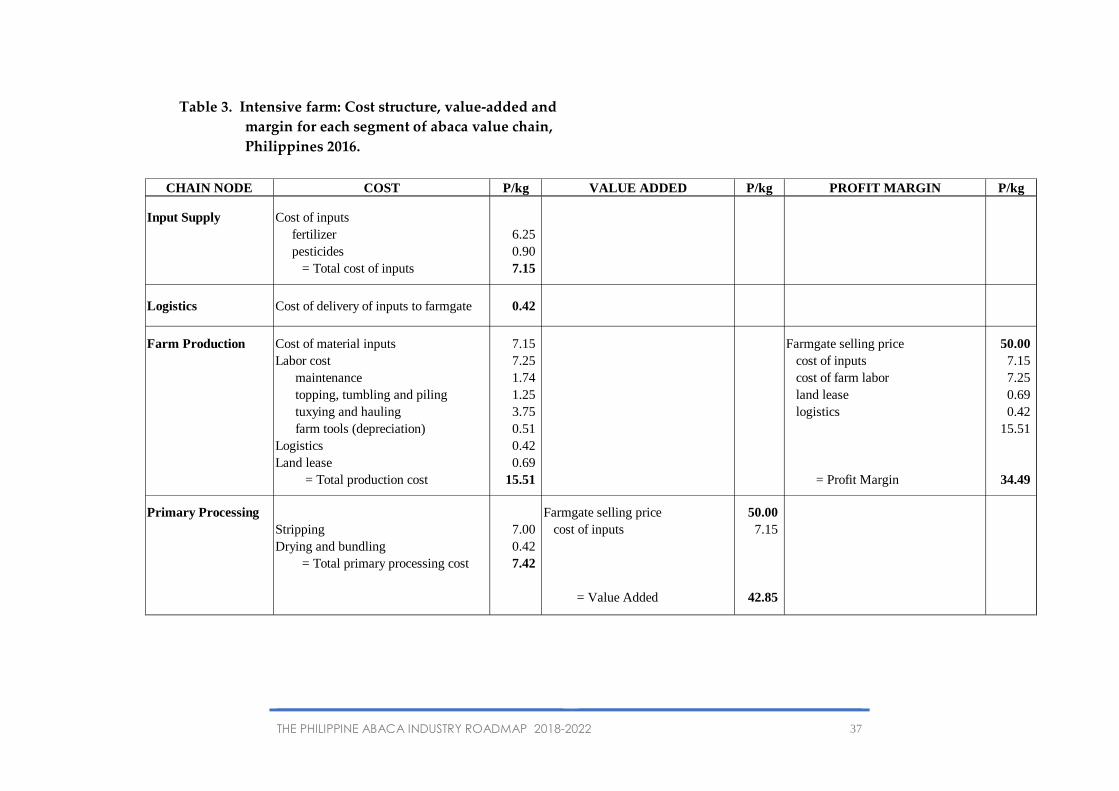
THE PHILIPPINE ABACA INDUSTRY ROADMAP 2018-2022 37
CHAIN NODE COST P/kg VALUE ADDED P/kg PROFIT MARGIN P/kg
Input Supply Cost of inputs
fertilizer 6.25
pesticides 0.90
= Total cost of inputs 7.15
Logistics Cost of delivery of inputs to farmgate 0.42
Farm Production Cost of material inputs 7.15 Farmgate selling price 50.00
Labor cost 7.25 cost of inputs 7.15
maintenance 1.74 cost of farm labor 7.25
topping, tumbling and piling 1.25 land lease 0.69
tuxying and hauling 3.75 logistics 0.42
farm tools (depreciation) 0.51 15.51
Logistics 0.42
Land lease 0.69
= Total production cost 15.51 = Profit Margin 34.49
Primary Processing Farmgate selling price 50.00
Stripping 7.00 cost of inputs 7.15
Drying and bundling 0.42
= Total primary processing cost 7.42
= Value Added 42.85
Table 3. Intensive farm: Cost structure, value-added and
margin for each segment of abaca value chain,
Philippines 2016.

THE PHILIPPINE ABACA INDUSTRY ROADMAP 2018-2022 38

THE PHILIPPINE ABACA INDUSTRY ROADMAP 2018-2022 39
C. Support Industries
All abaca production projects and fiber marketing activities will
be effectively accomplished through the support of big industries involved in
the abaca business like the Association of Abaca Pulp Millers, Inc., a major
processor and exporter. These support industries contribute in productively
carrying out the chain of abaca business activities starting from the making,
marketing and up to the sale of abaca fibers. Support industries in the abaca
production level also involve suppliers of organic fertilizers, manufacturers
of stripping machines and fabricators of manual stripping devices and other
abaca extraction tools. The marketing and sale of abaca fibers are executed
through the support of available transportation and communication systems
in every abaca producing region. These include transport firms, hauling
services and telecommunications and internet networks that would capably
link the producers and end users of abaca fibers. These support industries are
necessary business partners to ensure the success of the delivery of fibers to all
local and foreign buyers of abaca.
D. Key Institutions and Programs
Various institutions will serve as important partners of the agency in the
implementation of the programs enumerated in this Roadmap. These
institutions will aid PhilFIDA in carrying out the targeted activities for all industry
stakeholders especially the farmers. The agency will continue to have close
partnership with concerned local government units (LGUs) and non-
government organizations (NGOs), private sectors and private companies in
all abaca producing regions. These groups will provide support in the
implementation of projects in the regions especially in the mobilization of
farmers and in the provision of planting materials, land for the establishment of
abaca nurseries and other fiber production facilities. Cooperatives are also
considered key partners of the agency. Farmers who become part of a certain
cooperative are made more efficient in marketing their fibers and in
demanding higher price for their commodity. Established cooperatives can
eliminate middlemen since organized farmers can directly sell their
accumulated produce to potential buyers. Cooperatives also extend financial
assistance to individual farmers and make aids and provisions more accessible
to their members. Funding Institutions are strategic partners in helping farmers
to increase their income and in creating more livelihood opportunities for
them. Some of the important financial institutions are the Philippine Crop
Insurance Corporation (PCIC), Land Bank of the Philippines, Development
Bank of the Philippines (DBP) and agencies and programs under the
Department of Agriculture (DA) that provide financial support to farmers
which include the Agricultural Competitiveness Enhancement Fund (ACEF),
Agricultural Credit Policy Council (ACPC), High Value Crops Development
Program (HVCDP) and the Philippine Rural Development Program (PRDP). The
DA Agribusiness and Marketing Assistance Service (AMAS) will serve as the
industry’s marketing and promotional arm while the DA's regional field units
(RFUs) and Local Government Units will play a crucial role in supporting all

THE PHILIPPINE ABACA INDUSTRY ROADMAP 2018-2022 40
abaca fiber production projects in assisting the PhilFIDA since they will be in
charge of all the extension activities and will be directly providing technical
assistance to farmers in the field. State Universities and Colleges (SUCs) will also
be essential partners in performing extension work and especially in
conducting research on sustainable abaca production techniques. More
collaborative undertakings will be done with other key government agencies
like the Bureau of Plant Industry (BPI), Department of Science and Technology
(DOST), Department of Environment and Natural Resources (DENR),
Department of Agrarian Reform (DAR), Department of Trade and Industry (DTI)
and its export marketing arm, the Center for International Trade Expositions and
Missions (CITEM).

THE PHILIPPINE ABACA INDUSTRY ROADMAP 2018-2022 41
Table 4. Key institutions of the abaca industry.
Key Institution Abaca-related Functions/Objectives
Department of Agriculture (DA)
and AMAS
To help promote the production, processing, marketing and
distribution of high value crops such as abaca. It also provides funds
for special projects.
DA Regional Field Units To provide assistance and finding support in the implementation of
various agricultural policies and programs related to the production,
processing, marketing and distribution of high value crops such as
abaca.
Local Government Units (LGUs) To take charge of all the extension activities and will be directly providing technical assistance to farmers in the field. Some LGU provide counterpart funds for nursery establishment and abaca planting.
Non-government Organizations
(NGOs)
To provide funding support in the implementation of programs
and projects in the regions especially in the mobilization of farmers,
provision of land for the establishment of abaca nurseries and other
fiber production facilities.
Credit cooperatives and other
government financial institutions
(LBP, ACEF, ACPC, & HVCDP)
To provide financial support to farmers and help them increase their
income, support marketing and construction of access roads to
mountainous areas and in creating more livelihood opportunities.
State Universities and Colleges
(SUCs) and Department of
Science and Technology (DOST)
To help in performing extension work and especially in
conducting research on sustainable abaca production techniques.
Department of Environment and
Natural Resources (DENR) and
Department of Agrarian Reform
(DAR)
To help in the expansion of abaca farm on areas covered by the
National Convergence Initiative (NCI) Programs and National Greening
Program.
Department of Trade and Industry
(DTI) and CITEM
To oversee the implementation of abaca agreements between the Philippines and other countries and to also act as the marketing and promotional arm of the abaca industry.
Bureau of Plant Industry Provides assistance in the regulation of quality standards for the abaca industry.
Philippine Statistics Authority,
Bureau of Customs
Provide foreign trade and export statistics.

THE PHILIPPINE ABACA INDUSTRY ROADMAP 2018-2022 42
CHAPTER V
BENCHMARKING ANALYSIS
This chapter covers global and local benchmarking and compares the
performance of typical and modern farming using qualitative and quantitative
parameters. The qualitative parameter mainly describes farm practices
instead of cropping system, planting materials, pests and disease control
and fiber extraction method. The quantitative analysis focused on
measurable aspects such as density of planting, input usage and financial
indicators.
A. Global Benchmarking
A.1. Philippine Abaca vs. Ecuadorian
Abaca reportedly thrives in Ecuador, Costa Rica, Panama, Guatemala,
Indonesia and other countries, the origin of which could be traced to the
Philippines by indexing through finger printing. Nevertheless, records from
the Food and Agriculture Organization (FAO) of the United Nations (UN)
showed that Ecuador is the only other commercial producer of abaca fiber
aside from the Philippines. In the 2011 FAO Report, about 89.2 percent of the
world demand for abaca fiber was supplied by the Philippines and the rest
came from Ecuador.
In the same FAO Report, the average export price of representative
grades (S2, G and JK) of Philippine abaca ranged from US$170 per bale to
US$212 per bale (of 125 kg f.o.b. Manila port) compared to Ecuadorian abaca
(all grades) at US$169 per bale. This shows that Philippine abaca is
competitively priced with the Ecuadorian abaca (Table 5).
Notwithstanding the slightly higher price, the Philippines’ share to the
global abaca trade continued to improve. From an average 84 percent share
in the previous years, its contribution increased to 89.2 percent in 2011 per
FAO Report. Consumers around the world continue to patronize locally-
produced abaca primarily because of the reliability of Philippine supply due
to sustained substantial fiber production owing to the expansion of abaca
plantation. In 2012, the 176,793 ha is capable of producing at least 97,204 MT
of fiber yearly. Although abaca farming in the Philippines is generally for
income augmentation only and farmers usually prioritize cultivating and
harvesting these other agricultural crops than abaca, farmers will nevertheless
respond to the needs of the market. This was evidenced by the increased
production of abaca to an all-time high of 73,274 MT in 2011 due to the bullish
market following the intensified demand. While abaca cultivation in Ecuador
is of plantation type, its production has not gone beyond 12,000 MT per year

THE PHILIPPINE ABACA INDUSTRY ROADMAP 2018-2022 43
since it started producing abaca. This level is expected to slow down, in fact
in 2011 its production fell to 9,600 MT from 10,200
MT the previous year, as some plantation owners are gradually shifting to
African palms.
Table 5. Abaca: Prices of representative grades, 2011
PHILIPPINES ECUADOR Average export
unit value (all grades)
Hand-cleaned non-Davao
S2 G JK
f.o.b. Manila port USD per 125 kg bale f.o.b. USD/bale
2011 Average 211.9 192.1 170.2 168.8
January 202.0 185.0 162.0 156.1
February 202.0 185.0 162.0 150.0
March 202.0 185.0 162.0 155.5
April 204.0 187.0 163.0 162.0
May 207.0 189.0 163.0 163.1
June 211.0 192.0 163.0 172.0
July 215.0 197.0 171.0 170.6
August 220.0 197.0 177.0 170.4
September 220.0 197.0 180.0 176.8
October 220.0 197.0 181.0 178.9
November 220.0 197.0 180.0 182.3
December 220.0 197.0 178.0 187.9
Source of data: Food and Agriculture Organization, 2012

THE PHILIPPINE ABACA INDUSTRY ROADMAP 2018-2022 44
Another important edge of Philippine abaca is that of having several
different grades. The Philippines has nine grades/classifications of abaca fiber
compared to only five of Ecuador making Philippine abaca more versatile
in applications. Philippine abaca has a wide range of utilization from the
traditional cordage/rope and fibercrafts to more sophisticated industrial
applications like specialty papers, textile and the emergent composites. The
availability of the different grades of the Philippine abaca allows the specialty
papermakers flexibility enabling them to produce different types of paper with
the desired quality. Ecuadorian abaca, on the other hand, with only five
grades, does not have the full spectrum of the quality of abaca the specialty
paper manufacturers need. Each particular end-product requires different
quality of raw material and because of its fewer grades, only limited products
can be manufactured out of Ecuadorian abaca.
On another issue relating to indicative price arrangement for Philippine
abaca set by the Inter-governmental Group on Hard Fibres (IGHF) of the FAO,
the indicator price or the average of the monthly export prices of S2, J and JK
still falls within the indicative price range. The indicator price of the
representative grades of Philippine abaca in 2011 was US$191 per bale (FAO
Report) which is within the indicative price arrangement ranging from US$160
to US$232 per bale. The same FAO Report recorded that the monthly 2011
indicator price of the three representative grades ranged from US$183 to a
high of US$199 per bale.
The IGHF, composed of representatives from both the fiber-
producing and consuming countries, regularly meets to set and review
the indicative price arrangement for abaca. The objectives of the indicative
price arrangement when first conceived in 1968 were to raise ruling market
prices above a minimum level and to reduce abaca price fluctuations.
FAO further cited that it was agreed that indicative prices should not be so
high as to defend inefficient producers nor should they be so high as to
encourage research into synthetic substitutes; conversely, they should not be
so low as to discourage efficient producers & the range chosen should be
reasonably wide.
A.2. Philippine abaca versus other natural fibers (jute and sisal)
The closest competitors of abaca particularly in pulp and cordage
applications, the present major markets for abaca, are jute and sisal. Jute is
primarily produced in Bangladesh and India while sisal originates from African
and Latin American countries as well as from China. The major producing
countries of sisal are Brazil, China, Tanzania and Kenya. Based on the 2011
FAO Report, the average export prices per metric ton of the two grades of jute
namely, BWC and BWD, from Bangladesh were US$742 for BWD to US$831 for
BWC. On the other hand, the export price of the three representative grades
of sisal averaged US$791 to US$1,435 per metric ton. The three grades
indicated in the FAO Report are East African EL, East African UG and Brazil
No.3 with East African EL priced the highest and Brazil No. 3 as the lowest.

THE PHILIPPINE ABACA INDUSTRY ROADMAP 2018-2022 45
Following this price scenario, Philippine abaca is not competitive with jute and
sisal (Tables 6 & 7).
Admittedly, the price of abaca is much higher than other natural fibers
like jute and sisal and is actually the envy of other fiber producers as
acknowledged during the Eight International Conference of the European
Industrial Hemp Association (EIHA) held in 2011 in Wesseling, Germany. The
biggest advantage, however, of abaca over its competitors is its superior
qualities. Quality considerations play a predominant role in the choice of fiber
for the major specialty end-uses and technical properties provided by
abaca outweigh price advantages of other natural fibers.
In the pulp and specialty paper industry, abaca is the most sought after
and is actually the principal raw material because of its desirable qualities
which meet the requirements in the manufacture of specialty paper
products. Most specialty papers require high porosity and excellent tear,
bursting and tensile strength, all of which abaca can impart. Specifically, in the
production of meat/sausage casings and coffee/tea bags there are very
stringent specifications on strength, elongation and formation required to
ensure correct performance on automatic filling machines that these casings
must be made entirely of abaca. Furthermore, sisal, the closest competitor of
abaca in specialty paper manufacturing, has shorter and thinner cells,
and, therefore, produces paper with lower tensile strength than abaca-based
paper of the same weight per area. Sisal likewise gives rise to knots which
makes it unsuitable for the production of very thin papers and, therefore,
cannot replace abaca in uses like meat/sausage casings. These casings and
coffee/tea bags are the two major markets for abaca pulp.
Table 6. Representative monthly export prices of jute fiber, 2010/2011
Bangladesh Export Prices
BWC BWD
2010/11 Season 830.8 741.7
2010 July 750.0 660.0
August 800.0 700.0
September 900.0 820.0
October 900.0 800.0
November 880.0 800.0
December 880.0 800.0
2011 January 750.0 660.0
February 800.0 700.0
March 900.0 820.0
April 900.0 800.0
May 880.0 800.0
June 880.0 800.0
Source of data: Food and Agriculture Organization, 2012

THE PHILIPPINE ABACA INDUSTRY ROADMAP 2018-2022 46
Table7. Sisal : Prices of representative grades, 2011
East African Brazil No.3
3L UG
2011, Avg. 1435 1327 791
January 1250 1150 735
February 1270 1170 714
March 1300 1200 711
April 1300 1200 750
May 1300 1200 743
June 1350 1250 769
July 1550 1450 818
August 1550 1450 794
September 1550 1450 848
October 1600 1450 845
November 1600 1475 860
December 1600 1475 902
Source of data: Food and Agriculture Organization, 2012
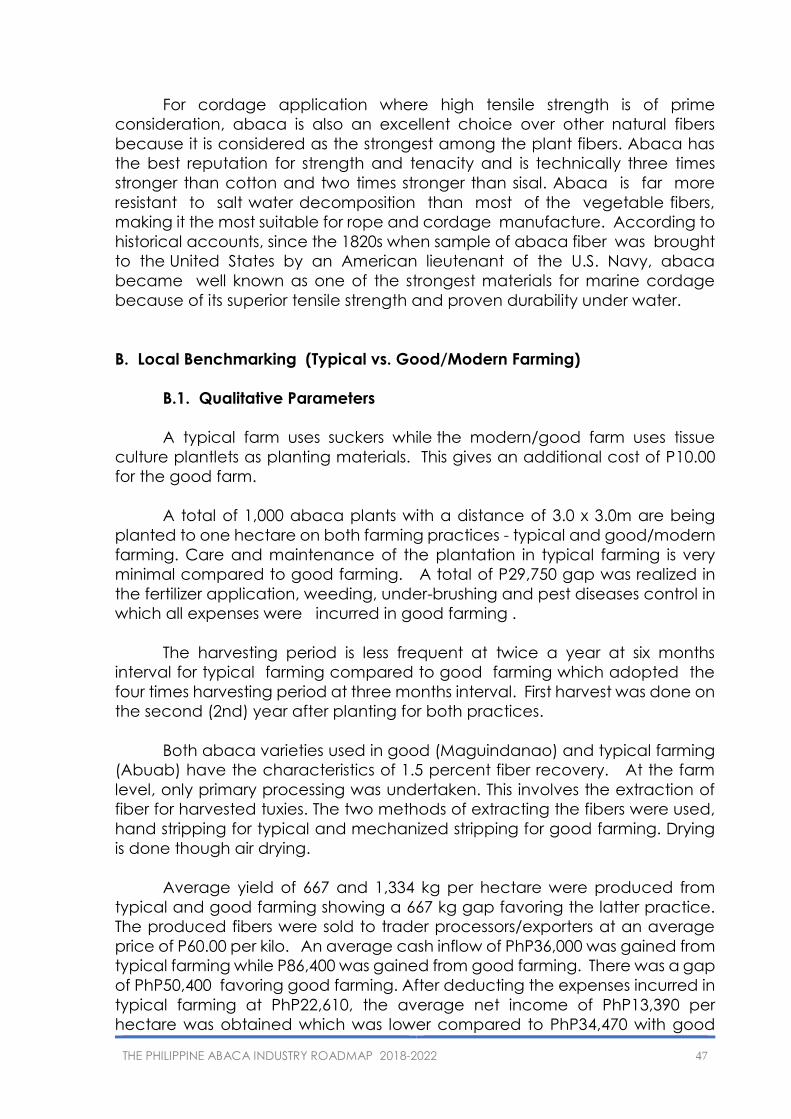
THE PHILIPPINE ABACA INDUSTRY ROADMAP 2018-2022 47
For cordage application where high tensile strength is of prime
consideration, abaca is also an excellent choice over other natural fibers
because it is considered as the strongest among the plant fibers. Abaca has
the best reputation for strength and tenacity and is technically three times
stronger than cotton and two times stronger than sisal. Abaca is far more
resistant to salt water decomposition than most of the vegetable fibers,
making it the most suitable for rope and cordage manufacture. According to
historical accounts, since the 1820s when sample of abaca fiber was brought
to the United States by an American lieutenant of the U.S. Navy, abaca
became well known as one of the strongest materials for marine cordage
because of its superior tensile strength and proven durability under water.
B. Local Benchmarking (Typical vs. Good/Modern Farming)
B.1. Qualitative Parameters
A typical farm uses suckers while the modern/good farm uses tissue
culture plantlets as planting materials. This gives an additional cost of P10.00
for the good farm.
A total of 1,000 abaca plants with a distance of 3.0 x 3.0m are being
planted to one hectare on both farming practices - typical and good/modern
farming. Care and maintenance of the plantation in typical farming is very
minimal compared to good farming. A total of P29,750 gap was realized in
the fertilizer application, weeding, under-brushing and pest diseases control in
which all expenses were incurred in good farming .
The harvesting period is less frequent at twice a year at six months
interval for typical farming compared to good farming which adopted the
four times harvesting period at three months interval. First harvest was done on
the second (2nd) year after planting for both practices.
Both abaca varieties used in good (Maguindanao) and typical farming
(Abuab) have the characteristics of 1.5 percent fiber recovery. At the farm
level, only primary processing was undertaken. This involves the extraction of
fiber for harvested tuxies. The two methods of extracting the fibers were used,
hand stripping for typical and mechanized stripping for good farming. Drying
is done though air drying.
Average yield of 667 and 1,334 kg per hectare were produced from
typical and good farming showing a 667 kg gap favoring the latter practice.
The produced fibers were sold to trader processors/exporters at an average
price of P60.00 per kilo. An average cash inflow of PhP36,000 was gained from
typical farming while P86,400 was gained from good farming. There was a gap
of PhP50,400 favoring good farming. After deducting the expenses incurred in
typical farming at PhP22,610, the average net income of PhP13,390 per
hectare was obtained which was lower compared to PhP34,470 with good
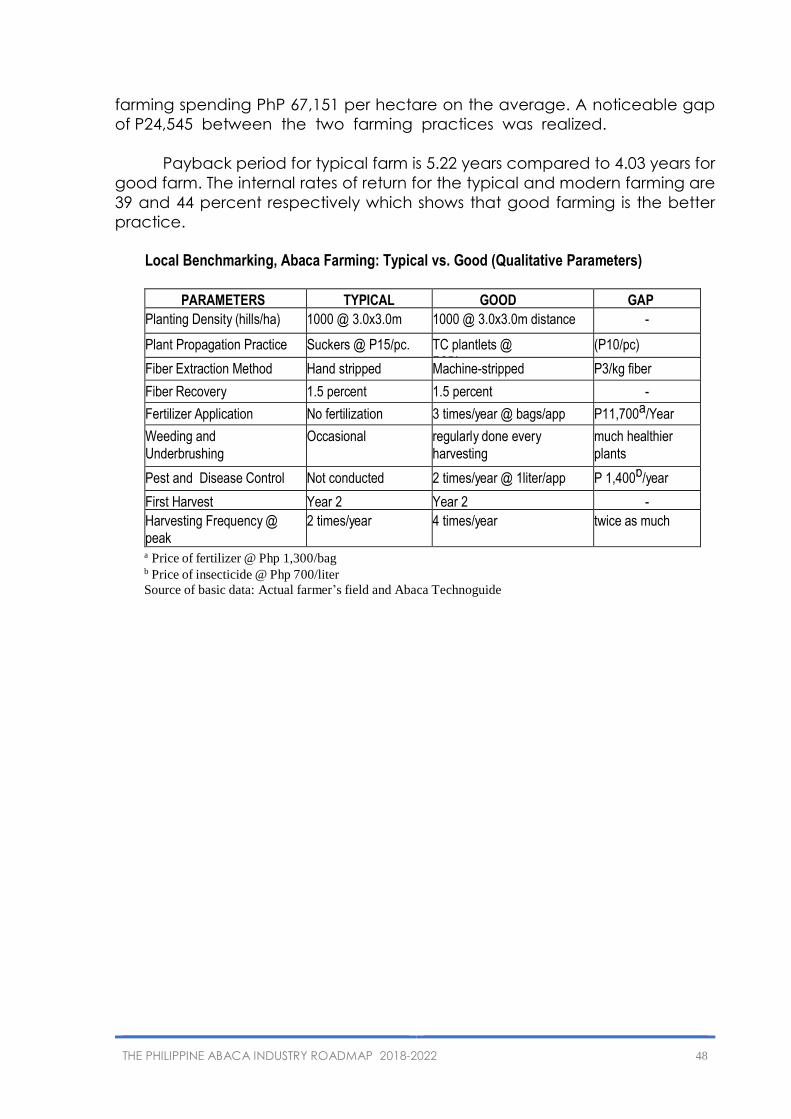
THE PHILIPPINE ABACA INDUSTRY ROADMAP 2018-2022 48
farming spending PhP 67,151 per hectare on the average. A noticeable gap
of P24,545 between the two farming practices was realized.
Payback period for typical farm is 5.22 years compared to 4.03 years for
good farm. The internal rates of return for the typical and modern farming are
39 and 44 percent respectively which shows that good farming is the better
practice.
Local Benchmarking, Abaca Farming: Typical vs. Good (Qualitative Parameters)
PARAMETERS TYPICAL GOOD GAP
Planting Density (hills/ha) 1000 @ 3.0x3.0m 1000 @ 3.0x3.0m distance -
Plant Propagation Practice Suckers @ P15/pc. TC plantlets @
P25/pc
(P10/pc)
Fiber Extraction Method Hand stripped Machine-stripped P3/kg fiber
Fiber Recovery 1.5 percent 1.5 percent -
Fertilizer Application No fertilization 3 times/year @ bags/app P11,700a/Year
Weeding and
Underbrushing
Occasional regularly done every
harvesting
much healthier
plants
Pest and Disease Control Not conducted 2 times/year @ 1liter/app P 1,400b/year
First Harvest Year 2 Year 2 -
Harvesting Frequency @
peak
2 times/year 4 times/year twice as much
a Price of fertilizer @ Php 1,300/bag b Price of insecticide @ Php 700/liter
Source of basic data: Actual farmer’s field and Abaca Technoguide

THE PHILIPPINE ABACA INDUSTRY ROADMAP 2018-2022 49
Local Benchmarking, Abaca Farming: Typical vs. Good (Quantitative Parameters) (in PhP per ha unless otherwise specified)
PARAMETERS* TYPICAL
FARM GOOD FARM
GAP
Average yield per ha (kg)
667
1,334
667
Peak yield per ha (kg)
750
1,700
750
Average establishment cost per ha (Year 1)
38,295
68,045
29,750
Average cash outflow per ha per year 22,610 51,930 29,320
Price per kg (farmer’s selling price) 60 60 0
Average cash inflow per ha per year 36,000 86,400 50,400
Average net cash flow per ha per Year
13,390
34,470
21,080
Average Area to get preferred net income of Php 94,000 (poverty threshold, 1st half 2012) (ha)
7.02
2.73
4.29
Average cost per kg (PhP/kg) 37.68 36.06 1.62
Payback period (years) 5.22 4.03 1.19
IRR (percent) 39 44 5 *Years 2-10 are considered in the average values Source of basic data: Actual farmer’s field and Abaca Technoguide
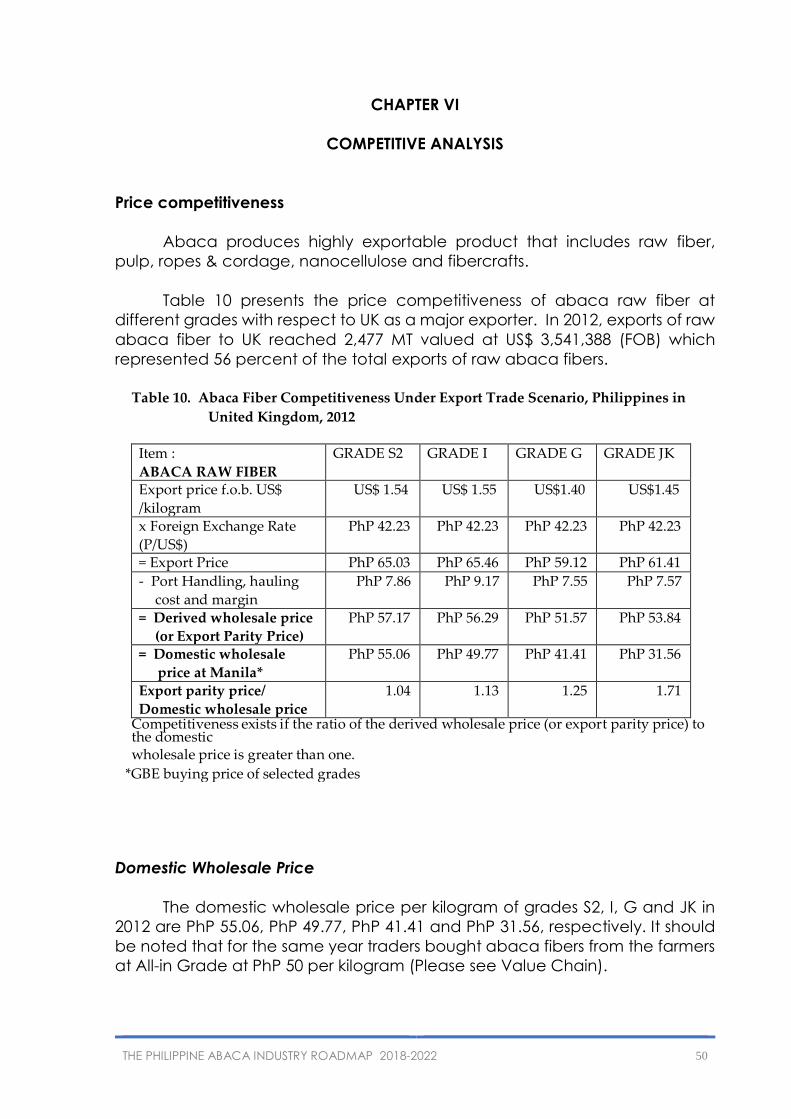
THE PHILIPPINE ABACA INDUSTRY ROADMAP 2018-2022 50
CHAPTER VI
COMPETITIVE ANALYSIS
Price competitiveness
Abaca produces highly exportable product that includes raw fiber,
pulp, ropes & cordage, nanocellulose and fibercrafts.
Table 10 presents the price competitiveness of abaca raw fiber at
different grades with respect to UK as a major exporter. In 2012, exports of raw
abaca fiber to UK reached 2,477 MT valued at US$ 3,541,388 (FOB) which
represented 56 percent of the total exports of raw abaca fibers.
Domestic Wholesale Price
The domestic wholesale price per kilogram of grades S2, I, G and JK in
2012 are PhP 55.06, PhP 49.77, PhP 41.41 and PhP 31.56, respectively. It should
be noted that for the same year traders bought abaca fibers from the farmers
at All-in Grade at PhP 50 per kilogram (Please see Value Chain).
Table 10. Abaca Fiber Competitiveness Under Export Trade Scenario, Philippines in
United Kingdom, 2012
Item :
ABACA RAW FIBER
GRADE S2 GRADE I GRADE G GRADE JK
Export price f.o.b. US$
/kilogram
US$ 1.54 US$ 1.55 US$1.40 US$1.45
x Foreign Exchange Rate
(P/US$)
PhP 42.23 PhP 42.23 PhP 42.23 PhP 42.23
= Export Price PhP 65.03 PhP 65.46 PhP 59.12 PhP 61.41
- Port Handling, hauling
cost and margin
PhP 7.86 PhP 9.17 PhP 7.55 PhP 7.57
= Derived wholesale price
(or Export Parity Price)
PhP 57.17 PhP 56.29 PhP 51.57 PhP 53.84
= Domestic wholesale
price at Manila*
PhP 55.06 PhP 49.77 PhP 41.41 PhP 31.56
Export parity price/
Domestic wholesale price
1.04 1.13 1.25 1.71
Competitiveness exists if the ratio of the derived wholesale price (or export parity price) to the domestic wholesale price is greater than one.
*GBE buying price of selected grades

THE PHILIPPINE ABACA INDUSTRY ROADMAP 2018-2022 51
Price Competitiveness of Abaca
Based on the 2012 exportation of grade S2 abaca raw fibers to UK which
stood at 303.75 MT and valued at US$ 467,640 (FOB), the corresponding export
price per kg to UK was US$1.54 which is equivalent to PhP 65.03 at an exchange
rate of PhP42.23 = US $1. Deducting the cost of port handling and margin
which is computed at PhP 7.86 per kg, the derived wholesale price of grade
S2 abaca raw fibers to UK was PhP 57.17. Meanwhile, the domestic wholesale
price or the GBE buying price of grade S2 fibers in 2012 was PhP 55.06 per kg.
It should be noted that for the same year traders bought abaca fibers from the
farmers at all-in grade at PhP 40.00 per kg (Please see Value Chain).
The export parity price to domestic wholesale price ratio was calculated
to determine price competitiveness. The computed ratio of UK market for
grade S2 was greater than one at 1.04 which would indicate price
competitiveness.
The results for grades I, G and JK are the same with export parity price
ratio of 1.13, 1.25 and 1.71, respectively indicating price competitiveness in all
fiber grades.

THE PHILIPPINE ABACA INDUSTRY ROADMAP 2018-2022 52
CHAPTER VII
MARKET TRENDS AND PROSPECTS
The growing global interest and acceptability for “green” products open
urgent and endless opportunities for natural fibers as these are alternative
resources that can be utilized for a wide range of applications especially for
the pulp and paper industry, in the composite market, textile and even in
lifestyle products and other industries. The emergent green economy is
creating a global demand of an estimated three million metric tons of natural
fibers and in support to this, various international industry report revealed the
following trends and prospects which favor the Philippine fiber industry:
A. PULP AND PAPER
A report on the United Nations Conference on Sustainable Development
indicated that Kimberly Clark, the biggest consumer of wood fiber for tissue
paper production, is one of the 24 major companies that committed to
sustainable development and commits transition of 50 percent of its wood fiber
consumption from natural forests to alternate natural fiber sources. The report
further stated that in 2011, the company
used nearly 750,000 MT of primary wood
fiber for the manufacture of billions of its
toilet paper and is now exploring
alternative sources of fiber for its
products. This presents an entry point for
the Philippine natural fibers especially for
abaca considering that it has a high
tensile strength characteristic that
manufacturers require in the production
of tissue papers.
In Barcelona, Spain, a newly-
established specialty paper
manufacturing company, Terranova
Papers, is into the production of various types of tea bags for high speed tea
bag machines and coffee pods, pads and capsule grades made of
abaca fiber. The company’s representatives have been to the Philippines to
evaluate the abaca fiber supply chain to ensure sustainability of the right
grade, quality and quantity of Philippine abaca fiber. Likewise, negotiations
with prospective suppliers are ongoing.
In the Philippines, Newtech Pulp Inc., the biggest abaca pulp mill, will increase
its demand for abaca fiber to produce an additional four metric tons of abaca
pulp. At present, the company’s yearly production is 14,000 metric tons
which, following the additional requirement of its specialty paper
manufacturing partner based in Germany, plans to expand its output to 18,000

THE PHILIPPINE ABACA INDUSTRY ROADMAP 2018-2022 53
metric tons. Translated to fiber, demand for abaca fiber will expand to 8,000
metric tons per annum.
B. COMPOSITES FOR AUTOMOTIVE AND CONSTRUCTION
A report on Lucintel Brief: Opportunities in Natural Fiber Composites,
about 20 to 25 kgs of natural fibers are indicated to be used as automotive
component substrates in each of the 60 to 70 billion vehicles being produced
globally each year. Even if 5 to 10 kgs will be used per vehicle, this would mean
a requirement of 265,000 to 530,000 MT of natural fibers offering possibilities for
our natural fibers. The Lucintel Brief further indicated that the total global
natural fiber composite market is expected to grow to US$531.1 million in
2017 with an 11 percent compounded annual growth rate over the next
five years. The natural fiber composites are currently utilized in automotive
(door panels, seat backs, headliners, dash boards, trunk liners, spare wheel
pan cover), electrical and electronics (mobile phone cases, laptop cases),
sporting goods (tennis racket, bicycle frames, snowboards), construction
(door panels, decking, railing, window frames), furniture and other products
like cosmetic packaging (lipstick casing), funeral urns, etc. The automotive
industry is expected to remain the largest market through 2017.
Currently, Daimler-Chrysler is using abaca fiber for the spare wheel pan
cover for all models of their A- and B-class passenger cars and the yearly
consumption for this purpose, according to its External Affairs and P ublic Policy
Director, amounts to approximately 100 to 150 metric tons of abaca fiber.
General Motors is another prospective market for natural fibers as part of
its commitment during the United Nations Conference on Sustainable
Development.
According to the Lucintel Brief, demand for natural fiber composites is
expected to be high in automotive and construction applications due to
awareness towards “green” products and increasing acceptability; reduction
of global warming effect; need for light weight materials; greater emphasis on
sustainability, biodegradability and recyclability; lower price; and,
governmental support (tax credits are given on renewable resources).
Europe is the largest region for automotive applications and is expected
to remain strong with the passage of the End-of-Life-Vehicle (ELV)
Regulation. Car manufacturing companies in the European Union are
expected to use natural fibers as material for their car parts in compliance with
the ELV Regulation. The said Regulation requires them to design and make their
car components easier to recycle and safer to dispose of at the end of life of
every vehicle.
Asia is emerging as a big market for natural fiber composites due to the
rapidly increasing demand particularly from China and India. Auto parts
manufacturing companies based in the ASEAN specifically, in Malaysia,
Indonesia and Thailand could be the target markets for Philippine natural fibers
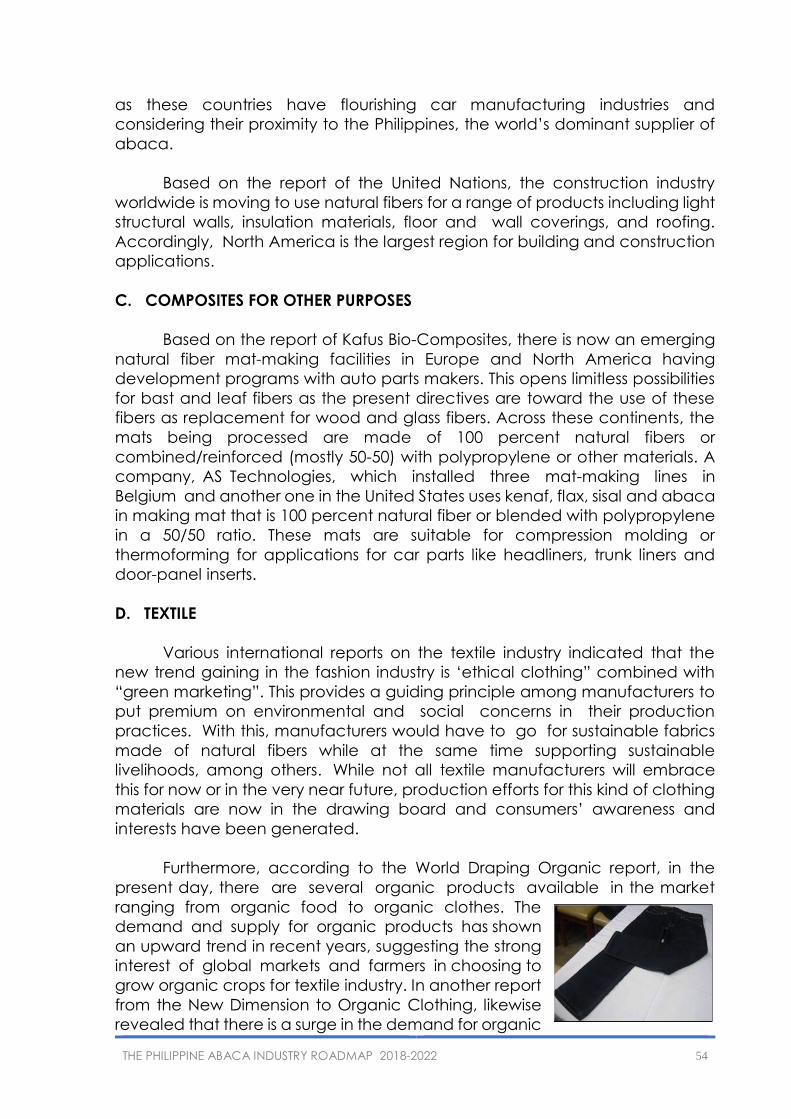
THE PHILIPPINE ABACA INDUSTRY ROADMAP 2018-2022 54
as these countries have flourishing car manufacturing industries and
considering their proximity to the Philippines, the world’s dominant supplier of
abaca.
Based on the report of the United Nations, the construction industry
worldwide is moving to use natural fibers for a range of products including light
structural walls, insulation materials, floor and wall coverings, and roofing.
Accordingly, North America is the largest region for building and construction
applications.
C. COMPOSITES FOR OTHER PURPOSES
Based on the report of Kafus Bio-Composites, there is now an emerging
natural fiber mat-making facilities in Europe and North America having
development programs with auto parts makers. This opens limitless possibilities
for bast and leaf fibers as the present directives are toward the use of these
fibers as replacement for wood and glass fibers. Across these continents, the
mats being processed are made of 100 percent natural fibers or
combined/reinforced (mostly 50-50) with polypropylene or other materials. A
company, AS Technologies, which installed three mat-making lines in
Belgium and another one in the United States uses kenaf, flax, sisal and abaca
in making mat that is 100 percent natural fiber or blended with polypropylene
in a 50/50 ratio. These mats are suitable for compression molding or
thermoforming for applications for car parts like headliners, trunk liners and
door-panel inserts.
D. TEXTILE
Various international reports on the textile industry indicated that the
new trend gaining in the fashion industry is ‘ethical clothing” combined with
“green marketing”. This provides a guiding principle among manufacturers to
put premium on environmental and social concerns in their production
practices. With this, manufacturers would have to go for sustainable fabrics
made of natural fibers while at the same time supporting sustainable
livelihoods, among others. While not all textile manufacturers will embrace
this for now or in the very near future, production efforts for this kind of clothing
materials are now in the drawing board and consumers’ awareness and
interests have been generated.
Furthermore, according to the World Draping Organic report, in the
present day, there are several organic products available in the market
ranging from organic food to organic clothes. The
demand and supply for organic products has shown
an upward trend in recent years, suggesting the strong
interest of global markets and farmers in choosing to
grow organic crops for textile industry. In another report
from the New Dimension to Organic Clothing, likewise
revealed that there is a surge in the demand for organic

THE PHILIPPINE ABACA INDUSTRY ROADMAP 2018-2022 55
clothing owing to fashion designers choosing more environment friendly
fabrics on the ramp and retailers promoting such products. Organic clothes
and apparels have now entered the mainstream, consumer-driven fashion.
Natural fibers especially abaca can be easily considered organic because
their production in the Philippines does not involve application of chemicals or
if there is any due to disease, only green labels are being used at the farm
level.
Abaca is among the natural fibers not traditionally known as textile
fiber but is now being utilized in the textile industry. According to Mr. Mathew
Lazaro, Vice President and Chief Executive Officer of Asia Textile Mills Inc.
(Asiatex) located in Calamba City, Laguna, abaca fiber can be used for
weaving abaca denim fabrics because it is very strong and has very porous
property making it not only versatile but also very durable, breathable and very
comfortable to use. This abaca-based denim, composed of 40 percent
abaca and 60 percent recycled polyester, is so uniquely “Pinoy” considering
that abaca is the only truly Filipino fiber. The abaca denims are initially being
exported to Japan. Aside for denims, Asiatex has also developed fabrics made
of 10 percent to 40 percent abaca that can be used for everyday wear such
as shirts and blouses. Asiatex is continuing its research to make the fabrics anti-
microbial and to develop a “stay cool and fresh” textile before commercial
production. The company plans to use the stretch denim into fashionable
jackets, skirts, vests, etc. and to produce abaca yarns for knitted fabrics like
cardigans and socks. For their plans, Asiatex will need 15 metric tons of abaca
fiber annually.
In order to boost the utilization of Philippine natural fibers in textiles,
Republic Act No. 9242 otherwise known as “An Act Prescribing the Use of the
Philippine Tropical Fabrics for Uniform of Public Officials and Employees and for
Other Purposes” was enacted. The essence of the law is to strengthen the
demand for our natural fibers, specifically abaca, silk, pineapple and banana
fibers and with its full implementation, additional requirement per year for
abaca fiber is around 101 metric tons.
In Japan, a textile company named OJI FIBER presents a new comfy
touch of paper yarn called OJO+, a super natural filament fiber made of
abaca. This yarn served as their contribution to the fashion and lifestyle
material industries. They intends to create a worldwide paper yarn industry
in the years ahead. The paper yarn OJO+ is very fine, light, fuzz free, easy to
dye, inexpensive, and eco-friendly. The plus part of OJO+ connotes that
this yarn is suitable to be combined with other fibers. It could be applied to
various fields, like apparel, interior decorations, beddings and other
applications.

THE PHILIPPINE ABACA INDUSTRY ROADMAP 2018-2022 56
E. NEW PRODUCT INNOVATIONS
Product development leads toward exploring ways to integrate
product innovations with affirmative and proactive action directly
incorporating socio- economic and environmental issues.
Concepts and designs involved in product development are shaped by
the integration of environmental management systems specifically Life
Cycle Analysis (LCA) interventions to produce environmentally sound,
renewable and sustainable materials. According to a report on the Present
Directives for Product Development, the leading contenders for replacement
for wood and glass fibers are bast and leaf fibers which include abaca.
In home furnishings, results of the survey sponsored by the American
Home Furnishings Alliance revealed that there is growing demand among
U.S population for home furnishings made of environment-friendly materials
and US consumers are willing to pay up to 10 percent more for furniture made
from “green” materials. More than half of the consumers surveyed are currently
taking steps to make their homes more environment friendly from furniture
to upholstery fabrics and foam. The survey
further revealed that buying environmentally-
friendly home products ranked in the top three
most important practices in US households,
after conserving energy and recycling. The
World Fiber Forecast 2030 pointed out that
carpet usage will increase and its industry will
dominate the market for home interiors. These
indicate greater awareness and acceptance
among consumers to patronize eco-friendly
products.
F. OTHER PRODUCTS
Production of bio-ethanol using abaca stripping wastes is being looked
into as part of zero waste management in abaca farms. A number of industry
reports indicated that ethanol can be used as a fuel for vehicles in its pure
form. Currently, it is usually used as a gasoline additive to increase octane and
improve vehicle emissions. Bio-ethanol is now widely used in the United States
and in Brazil and other parts of the globe. The use of bio-ethanol is expected
to expand further due to the continuous increase in the prices of petroleum-
based products. Based on Renewable Global Status Report, bio-fuels from
renewable sources have contributed to a significant decline in oil
consumption in the United States since 2006. The 93 billion liters of bio-fuels
produced worldwide displaced an equivalent of an estimated 68 billion liters
of gasoline, equal to about 5 percent of world gasoline production. According
to articles, “As Ethanol Booms, Critics Warn of Environmental Effect” and
"American Energy: The Renewable Path to Energy Security", nearly all the
gasoline sold in the United States today are mixed with 10 percent ethanol, a
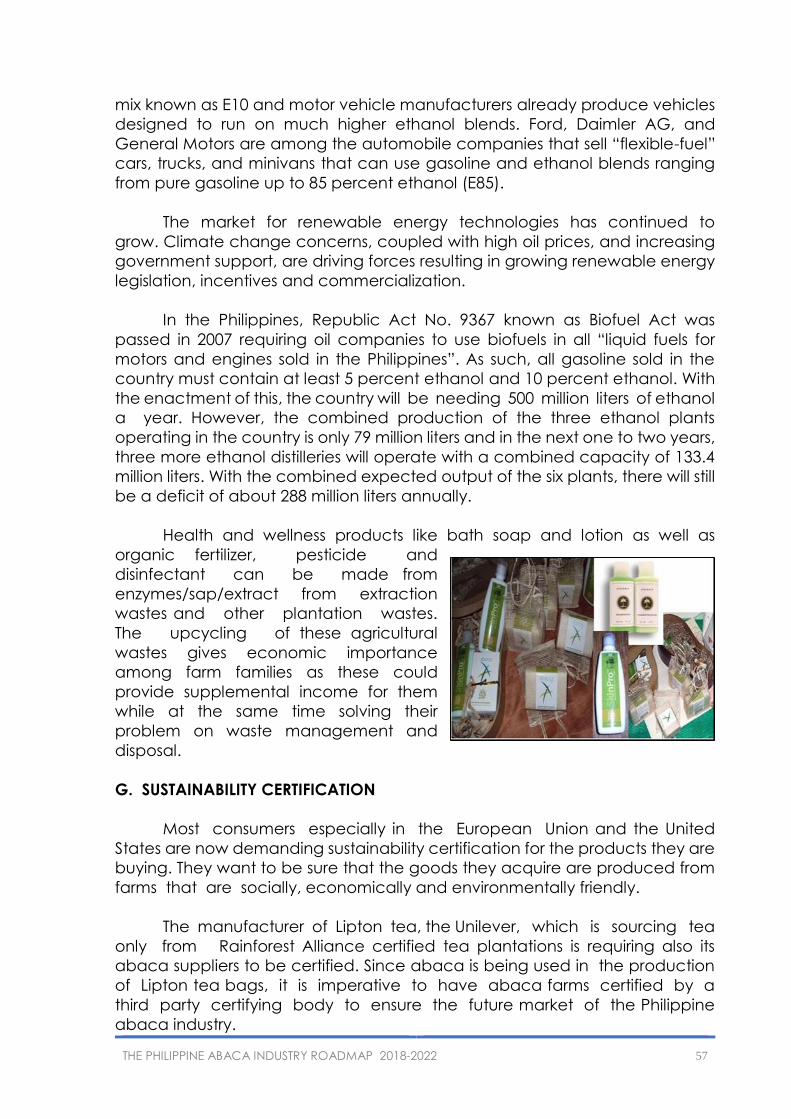
THE PHILIPPINE ABACA INDUSTRY ROADMAP 2018-2022 57
mix known as E10 and motor vehicle manufacturers already produce vehicles
designed to run on much higher ethanol blends. Ford, Daimler AG, and
General Motors are among the automobile companies that sell “flexible-fuel”
cars, trucks, and minivans that can use gasoline and ethanol blends ranging
from pure gasoline up to 85 percent ethanol (E85).
The market for renewable energy technologies has continued to
grow. Climate change concerns, coupled with high oil prices, and increasing
government support, are driving forces resulting in growing renewable energy
legislation, incentives and commercialization.
In the Philippines, Republic Act No. 9367 known as Biofuel Act was
passed in 2007 requiring oil companies to use biofuels in all “liquid fuels for
motors and engines sold in the Philippines”. As such, all gasoline sold in the
country must contain at least 5 percent ethanol and 10 percent ethanol. With
the enactment of this, the country will be needing 500 million liters of ethanol
a year. However, the combined production of the three ethanol plants
operating in the country is only 79 million liters and in the next one to two years,
three more ethanol distilleries will operate with a combined capacity of 133.4
million liters. With the combined expected output of the six plants, there will still
be a deficit of about 288 million liters annually.
Health and wellness products like bath soap and lotion as well as
organic fertilizer, pesticide and
disinfectant can be made from
enzymes/sap/extract from extraction
wastes and other plantation wastes.
The upcycling of these agricultural
wastes gives economic importance
among farm families as these could
provide supplemental income for them
while at the same time solving their
problem on waste management and
disposal.
G. SUSTAINABILITY CERTIFICATION
Most consumers especially in the European Union and the United
States are now demanding sustainability certification for the products they are
buying. They want to be sure that the goods they acquire are produced from
farms that are socially, economically and environmentally friendly.
The manufacturer of Lipton tea, the Unilever, which is sourcing tea
only from Rainforest Alliance certified tea plantations is requiring also its
abaca suppliers to be certified. Since abaca is being used in the production
of Lipton tea bags, it is imperative to have abaca farms certified by a
third party certifying body to ensure the future market of the Philippine
abaca industry.

THE PHILIPPINE ABACA INDUSTRY ROADMAP 2018-2022 58
There are a number of third party
certifying bodies like Forest Stewardship
Council, Rainforest Alliance, World Wildlife
Fund, Sustainable Forestry Initiative and
Fair Trade among others but Rainforest
Alliance is the most appropriate and
preferred by foreign buyers of abaca. In
response to the request of PH Glatfelter and
Ahlstrom, two of the biggest foreign buyers
and consumers of Philippine abaca fibers and
pulp, PhilFIDA is now working toward
certification of abaca farms in the Bicol,
Panay, Eastern Visayas and Mindanao
Regions. PhilFIDA, Department of Agriculture,
Agricultural Training Institute and the German
International Cooperation (GIZ) have closely
partner to work on certification of abaca
farms with support of the Glatfelter.
THE PHILIPPINE ABACA INDUSTRY ROADMAP 2018-2022 59
CHAPTER VIII
SWOT ANALYSIS
This chapter presents the industry’s advantages as strengths and
opportunities and the constraints as weaknesses and threats identified
according to the supply chain segment.
On Input Supply
On input supply, the strength of the industry lies on the available
technologies and facilities related to fiber production, extraction and
postharvest. There are several government agencies, SUCs and research
institutions involved in abaca R&D. PhilFIDA, in pursuit of its mandate to
promote the accelerated growth and development of the abaca industry
operates and maintains five tissue culture laboratories, three diagnostic
laboratories, one immunology laboratory, one fiber processing and utilization
laboratory and six experiment stations in carrying out its R&D activities in the
upstream, mid-stream and downstream levels in all research disciplines
including product development. The Agency also works closely with the Local
Government Units (LGUs) for the maintenance of abaca nurseries. In addition,
the National Abaca Research Center of the Visayas State University (VSU-
NARC) conducts researches on abaca in the areas of crop breeding, crop
production, pest management, engineering, among others. The University of
the Philippines in Los Baños and in Diliman campuses are also engaged in
abaca researches especially in the area of crop improvement, biotechnology
and product utilization. Other service providers of the industry include
accredited seed growers and machine/tool fabricators.
The high cost of labor, utilities, farm inputs such as fertilizers and
pesticides, farm implements such as stripping devices serve as weaknesses to
inputs of production. The limited access to credit is also a weakness. The
stringent documentary bank requirements compels farmers to resort to local
informal lenders who provide easy access to loans but at high interest rates.
On production
As of 2016, the total abaca production area is 176,548 hectares located
in the hilly lands and mountains of Bicol (Catanduanes, Sorsogon, Albay,
Catanduanes); Visayas (Leyte, Southern Leyte, Northern Samar, Samar, Aklan);
Mindanao (Davao Oriental, Davao del Sur, Surigao del Sur, Sulu, Lanao del Sur,
Bukidnon). Potential areas for abaca are in Palawan and in the Mindanao
areas. Efforts to meet the market requirements for seal of sustainability of
product for tea bags had been initiated by PhilFIDA in partnership with two
abaca exporters. As of 2013, a total of 53 farmers in Catanduanes cultivating
334 hectares of abaca had been awarded certification on sustainable

THE PHILIPPINE ABACA INDUSTRY ROADMAP 2018-2022 60
agriculture by an international third party, the Rainforest Alliance.
Application for sustainability certification is also in the process in Aklan and
Iloilo for some 500 hectares which is being spearheaded by the German
Government together with the Deutsche Gesselshaft for International
Zusammenarbeit, Germany.
One of the major problems of the industry is the presence of virus
diseases, namely: bunchy top, mosaic and bract mosaic. In spite of
government efforts to eradicate these diseases, there is still disease prevalence
because not all farmers have the initiative and willingness to control the
disease even at the initial/minimal stage of infection. This is because farmers
treat abaca only as an augmentation crop; they do not regularly maintain
their farm but would only visit and harvest abaca whenever they need cash.
Furthermore, the implementation of the Comprehensive Agrarian reform
Program (CARP) limits ownership of landholdings; abaca, being a plantation
crop is profitable when cultivated in vast tract of lands.
In response to the growing demand for abaca, the private
manufacturing companies like the Newtech Pulp, Inc. is contemplating on
establishing plantation type of abaca either as a company plantation or a
cluster of farms owned by individual farmers. Corporate Social Responsibility
(CSR) is also gaining popularity among private companies and as a way of
giving back, these companies are providing funding support. A Japanese firm,
Itochu Inc., in celebration of its centennial operation, granted PhP 1M
assistance to a farmers’ group based in Gubat, Sorsogon for the establishment
of abaca nursery and provision of planting materials to replant abaca farms
subjected for eradication.
Like other crops abaca is also affected by climate change specifically
prolonged drought and strong typhoons that has adverse effect on fiber
production. Likewise, the peace and order situation especially in Mindanao
and some parts of Bicol and Eastern Visayas where insurgents are present
poses threat to fiber production and limits abaca trading.
On Processing
The superior quality of abaca fibers in terms of strength and porosity
makes it suitable raw materials for a diverse application especially for new
emerging products. Abaca, being a natural fiber also offers zero-waste
utilization. Stripping wastes can be converted into fertilizers and bio-ethanol.
The extracts from the sap can also be utilized for wellness products.
The major problem in the processing and manufacturing sector such as
the pulp mills and the cordage group is the high cost of investment in the
equipment/machineries and utilities.
THE PHILIPPINE ABACA INDUSTRY ROADMAP 2018-2022 61
On Trade
There is an existing fiber quality standards that is acceptable to both the
domestic and international markets. In addition, the industry has stable
domestic and global markets. At present, the domestic markets include four
pulp companies, six cordage companies, hundreds of handloom weavers,
fibercraft and furniture makers, 58 GBEs, 522 local traders and 29 trader-
exporters. Major foreign markets include for raw fibers and manufactures
include UK, Germany, France, Spain, USA, Italy, Canada, Japan, China, UAE
and South Africa. An opportunity to take advantage for the abaca industry is
the implementation of R.A. 9242 otherwise known as an “Act Prescribing the
Use of the Philippine Tropical Fabrics for Uniform of Public Officials and
Employees and for Other Purposes”. Its full implementation would entail
additional requirement of 101MT per year of abaca fiber.
The increasing global awareness on green economy augurs well for the
abaca industry; abaca, being a natural fiber can be used to an array of
emergent applications such as panel boards of automobiles and yachts;
needle-punched denims and in pharmaceutical products.
As the lead agency, PhilFIDA works closely with the farmers and the
private sector to ensure strong linkages among the players in the supply chain.
Regular stakeholders meeting with the farmers and private sector are being
conducted by PhilFIDA.
As a natural fiber, abaca competes with other hard fibers such as sisal,
kenaf and other bast fibers that are cheaper in the global market.
Cross-cutting
Abaca as an agro-industrial industry has both forward- and backward-
linkages that promote a multiplier effect in terms of job generation in all
segments of the value chain. With respect to the backward linkage, direct
and indirect employment in the inputs segment would include suppliers of farm
inputs and implements, abaca planting material propagators and their
respective suppliers of laboratory chemicals and supplies. In the mainstream
farming, there is the family labor and contract labor for harvesters, strippers
and haulers. At the GBEs, workforce include tip cutters/sorters, classifiers,
haulers aside from the indirect employees of the facility such as the security
and janitorial and office staff. There are also people involved in the trading
from the farm to the local traders to the GBEs then to the local processors or to
the exporters.
For the forward linkage that is composed of the processors and
manufacturers, employment opportunities are open to machine operators
and plant maintenance. Meanwhile, the community-based livelihood
industries such as the weavers and handicraft makers also provide
employment to the women-folk and out-of-school youth in the rural areas.

THE PHILIPPINE ABACA INDUSTRY ROADMAP 2018-2022 62
Supply Chain Segment
Advantages Constraints Advantages Constraints
STRENGTHS WEAKNESSES OPPORTUNITIES THREATS
INPUT SUPPLY Available new and improved
technologies particularly on planting materials
High cost of labor, farm inputs, machineries and utilities
Introduction of abaca seeds can support the needed planting materials
Distribution of tissue cultured and other materials that produce poor quality fibers.
Limited access to credit LBP is reviewing it policy to support abaca establishment. PRDP and other agencies provided grants in production and trading.
The government has to fulfill its obligation to support affordable credit
PRODUCTION Existing and potential areas for abaca
Farmers treat abaca as augmentation crop
Growing need for plantation type approach to production
Climate change
Third party certification on sustainability
Presence of pests and diseases
Introduce new approach in treatment of pest and diseases Increasing social consciousness for CSR by some private companies
Peace and order situation
CARP limits land Ownership
DAR support projects for abaca in suitable areas
PROCESSING High cost of investment Superior quality of abaca fiber
Use of chemicals in processing of fibers in the factories.
Offers zero-waste utilization

THE PHILIPPINE ABACA INDUSTRY ROADMAP 2018-2022 63
TRADE Existing fiber quality standards Poor farm to market roads Far and crossing rivers
Increasing awareness on green economy
Emergent substitute fibers for abaca
Stable domestic and global markets
Lack of collective marketing System
Emerging new markets
Strong linkage between and among industry players
Abaca is not well promoted in the lowland areas.
R.A. 9242: “Act Prescribing the Use of the Philippine Tropical Fabrics for Uniform of Public Officials and Employees and for Other Purposes”
Imported fibers are cheaper compared to local fibers which hindered promotion of Philippine fibers.
Cross cutting High multiplier effect on job generation
Abandonment of abaca farms by young farmers
Responsive to promoting gender equality & women empowerment

THE PHILIPPINE ABACA INDUSTRY ROADMAP 2018-2022 64
CHAPTER IX
TARGET SETTING (WHERE DO WE WANT TO GO?)
A. Mission, Vision, Goals and Objectives
Based on the stakeholders’ consultations and workshops, the vision,
mission, goals and objectives of the Philippine abaca industry are as follows:
The Vision:
A progressive Philippine fiber industry that produce the world’s best
quality fiber to supply global demands for renewable, sustainable and
environment-friendly products to achieve the country’s inclusive growth.
The Mission:
• Improve the socio-economic condition of farmers, create livelihood and
reduce poverty incidence through rural fiber-based enterprise
development and business; and
• Maintain the country’s status as the world’s number one producer and
supplier of quality abaca fibers.
Goals
• Produce sufficient quality abaca fiber to supply domestic and
international markets;
• Establish rural livelihood and economic businesses that improve farming
practices and land vegetation, rehabilitate the environment and
mitigate climate change;
• Establish disease free abaca plantations in all regions to provide
sustainable fiber supply for pulp millers, cordage companies and rural
enterprises;
• Set new direction and agenda for R & D to improve varieties, increase
fiber production, disease treatment, postharvest, processing, tensile
strengths and utilization towards production of fiber by-products for
industrial, commercial and other uses;
• Strengthen collaboration among industry stakeholders - international
investors, local and national governments, farmer cooperatives/
associations, private sectors, non-government organizations, academe
and corporations; and
• Promote an investment climate conducive for foreign and local direct
investors for upstream and downstream processing.

THE PHILIPPINE ABACA INDUSTRY ROADMAP 2018-2022 65
Objectives
• To expand/rehabilitate a total of 146,248 hectares of abaca areas from
2017 to 2022;
• To mass produce planting materials thru tissue culture,
micropropagation, conventional method and seeds;
• To increase fiber production by 36,482MT in 2020, 93,248MT in 2021 and
130,789MT in 2022 to address the projected 12% annual increase in
demand;
• To adopt abaca tuxy buying scheme in the production of quality abaca
fiber thru cooperative approach;
• To introduce new technologies in abaca production and treatment of
abaca diseases;
• To accredit private, government (LGUs), and commercial abaca
nurseries and distribute healthy planting materials;
• To train LGUs and NGOs agricultural technicians and farmers on new
and improved fiber production technologies;
• To upgrade and modernize/mechanize post-harvest equipment and
facilities to improve efficiency and increase fiber production;
• To strictly implement abaca grading standards;
• To conduct R&D for the production of quality and disease-free planting
materials, new technologies on plantation establishment, treatment of
diseases, production of by-products of abaca fibers, and processing
and utilization in partnership with universities, corporation and private
sectors; and
• Establish Monitoring and Evaluation Plan in partnership with abaca
stakeholders, LGU, AAPMI, NGOs and other groups.
B. Targets
The demand for abaca fiber both in the local and international market
is increasing exponentially because of the shifting in preference for natural
rather than synthetic fiber materials. The utilization of natural fibers have also
diversified from food packaging, textiles, furniture, stuffing material and many
more.

THE PHILIPPINE ABACA INDUSTRY ROADMAP 2018-2022 66
To remain as the world top supplier of abaca, production has to be
increased in various ways specifically through opening of new abaca areas
and by invigorating old and less productive farms and plantations. There is
also a need to control the spread of diseases which has become more
prevalent in different abaca locations in the country.
Area Targets
In order to increase area planted to abaca, four major activities are
targeted to be achieved. These are (1) use seeds as planting materials in
addition to suckers, corms and tissue culture, (2) opening of new abaca areas
from identified suitable agricultural lands and conversion of idle and
unproductive lands, (3) rehabilitation of abaca areas, and (4) treatment of
disease infected areas.
Based on inputs from various stakeholders during the three consultative
meetings conducted in Mindanao, Visayas, and Luzon, and on the reported
demands by our stakeholders, the targeted area to be rehabilitated is 86,884
hectares and area for expansion is 59,364 hectares or a total area planted to
abaca of 239,666 hectares in 2022. The huge increase in abaca plantation
area is aimed to accommodate the demands on abaca fiber especially the
pulp sector.
To cater the increasing demand for abaca fibers, vast hectare of abaca
farms which were cleaned from abaca diseases, old and less productive
abaca farms, are targeted to be rehabilitated nationwide. A total of 69,364
and 44,167 hectares are aimed to be rehabilitated in 2018 and 2019,
respectively. Further, disease management activities will likewise be
conducted.
Abaca Areas for Expansion and Rehabilitation by Region (2017-2021)
2017 2018 2019 2020 2021 Total
CAR/Ilocos - - - - - -
Central Luzon - 250 175 - 425
Southern Tagalog 10 45 955 669 - 1,679
Bicol Region (Region V) 200 68,347 12,477 8,734 - 89,758
Western Visayas (Region Vl) 100 70 2,120 1,484 - 3,774
Central Visayas (Region Vll) 50 50 723 506 - 1,329
Eastern Visayas (Region Vlll) 300 342 11,101 7,771 - 19,514
Zamboanga Peninsula (Region lX) 300 50 858 601 - 1,809
Northern Mindanao (Region X) 200 145 994 696 - 2,035
Davao Region (Region Xl) 290 80 5,476 3,833 - 9,679
SOCCSKARGEN (Region Xll) 100 70 1,800 1,260 - 3,230
Caraga Region 200 140 5,674 3,972 - 9,986
Autonomous Region of Muslim Mindanao (ARMM) 50 25 1,739 1,217 - 3,031
TOTAL 1,800 69,364 44,167 30,917 - 146,248
LocationExpansion and Rehabilitation Areas ( in hectares)

THE PHILIPPINE ABACA INDUSTRY ROADMAP 2018-2022 67
Production Targets
With all the targeted hectares for abaca farm establishment,
rehabilitation and expansion, farms are estimated to produce around 76,385
metric tons in 2018 and 79,576 metric tons in 2019. Increased production will be
achieved from 2020 to 2022 with 117,519 metric tons, 176,715 metric tons and
216,761 metric tons, respectively.
Extensive abaca expansion and rehabilitation efforts will be undertaken
from 2018-2019 to meet the targeted 239,666 total abaca areas by 2022. Bulk
of the expansion and rehabilitation activities will be conducted in Regions V
and VIII and in the regions of Mindanao. For the targeted expansion and
rehabilitation areas, a total of 146.28 million planting materials will be
distributed nationwide. By 2022, a total of 216,761 MT of fibers is expected to
be produced from all the new and rehabilitated abaca areas.
Physical Targets for Abaca, 2017-2022 (in ha unless otherwise specified)
Indicators 2017 2018 2019 2020 2021 2022 Total
Abaca Areas 180,302 181,302 191,000 220,666 239,666 239,666
New Area Planted 1,000 39,364 10,000 9,000 59,364
Area Rehabilitated 800 30,000 34,167 21,917 86,884
Number of Planting Materials Required (in million)
1.80 69.36 44.20 30.92 146.28
Fiber Production (MT) 74,160 76,385 79,576 117,519 176,715 216,761 Note: Yield assumption was based on the Abaca Statistical Bulletin, 2006 - 2015 and the National Abaca Survey, 2009
Income Targets
A farmer needs an average of 7.02 ha using the typical farming practice
and 2.73 ha with good farming to get the preferred net income of
PhP94,000.00 (poverty threshold, 1H 2012). A gap of negative 4.29 hectares
between the two farming practices was realized.
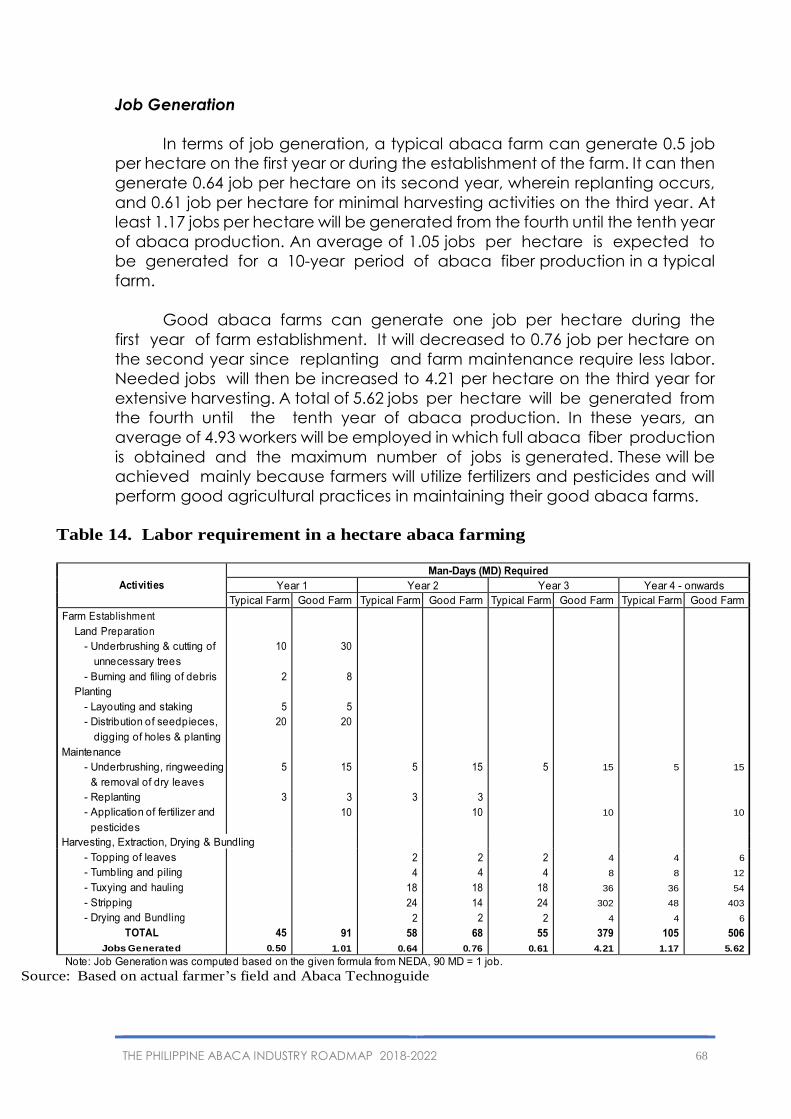
THE PHILIPPINE ABACA INDUSTRY ROADMAP 2018-2022 68
Job Generation
In terms of job generation, a typical abaca farm can generate 0.5 job
per hectare on the first year or during the establishment of the farm. It can then
generate 0.64 job per hectare on its second year, wherein replanting occurs,
and 0.61 job per hectare for minimal harvesting activities on the third year. At
least 1.17 jobs per hectare will be generated from the fourth until the tenth year
of abaca production. An average of 1.05 jobs per hectare is expected to
be generated for a 10-year period of abaca fiber production in a typical
farm.
Good abaca farms can generate one job per hectare during the
first year of farm establishment. It will decreased to 0.76 job per hectare on
the second year since replanting and farm maintenance require less labor.
Needed jobs will then be increased to 4.21 per hectare on the third year for
extensive harvesting. A total of 5.62 jobs per hectare will be generated from
the fourth until the tenth year of abaca production. In these years, an
average of 4.93 workers will be employed in which full abaca fiber production
is obtained and the maximum number of jobs is generated. These will be
achieved mainly because farmers will utilize fertilizers and pesticides and will
perform good agricultural practices in maintaining their good abaca farms.
Table 14. Labor requirement in a hectare abaca farming
Activities
Man-Days (MD) Required
Year 1 Year 2 Year 3 Year 4 - onwards
Typical Farm Good Farm Typical Farm Good Farm Typical Farm Good Farm Typical Farm Good Farm
Farm Establishment
Land Preparation
- Underbrushing & cutting of
unnecessary trees
- Burning and filing of debris
Planting
- Layouting and staking
- Distribution of seedpieces,
digging of holes & planting
Maintenance
- Underbrushing, ringweeding
& removal of dry leaves
- Replanting
- Application of fertilizer and
pesticides
10
2
5
20
5
3
30
8
5
20
15
3
10
91
1.01
5
3
2
4
18
24
2
58
0.64
15
3
10
2
4
18
14
2
68
0.76
5
2
4
18
24
2
55
0.61
15
10
4
8
36
302
4
379
4.21
5
4
8
36
48
4
105
1.17
15
10
6
12
54
403
6
506
5.62
Harvesting, Extraction, Drying & Bundling
- Topping of leaves
- Tumbling and piling
- Tuxying and hauling
- Stripping
- Drying and Bundling
TOTAL
Jobs Generated
45
0.50
Note: Job Generation was computed based on the given formula from NEDA, 90 MD = 1 job.
Source: Based on actual farmer’s field and Abaca Technoguide
THE PHILIPPINE ABACA INDUSTRY ROADMAP 2018-2022 69
CHAPTER X
STRATEGIES AND POLICIES (HOW DO WE GET THERE?)
There are a number of critical key results areas which have to be
addressed to enable the industry to meet the targets.
A. On Input Supply
• Adequate supply of disease free and high yielding abaca planting
materials
In support to the opening of new abaca areas as well as rehabilitation
of old, typhoon- damaged and disease-freed farms, disease-free planting
materials of recommended abaca varieties will be made available to farmers.
Abaca planting materials derived from the different methods of propagation
such as seeds, seedpieces, corms and suckers will be sourced from the
seedbanks of PhilFIDA and accredited nurseries of LGUs, private sectors,
corporation, NGOs and farmers associations. Tissue culture laboratories of
SUCs (UPLB, VSU, NORSU, LSU, UEP, CSU), national government (PhilFIDA) and
private companies will be tapped for the supply of abaca plantlets. Support
facilities like diagnostic laboratories and immunology laboratory shall likewise
be operated to assist in testing planting materials for freeness of viruses.
The active involvement of the LGUs in planting material production and
distribution for the benefit of their farmer-constituents as mandated by the
Local Government Code shall be enlisted by encouraging them to establish
abaca nurseries in their locality. In line with this, LGU MAOs and agricultural
technicians will be trained on hardening of abaca plantlets and nursery
establishment. In addition, screenhouses for hardening abaca plantlets shall
be distributed to LGUs.
Certification of tissue culture laboratories, seedbanks and nurseries as
reliable producers of abaca planting materials by BPI-PQS shall also be
pursued.
Parallel to this, dynamic research undertaking will be pursued by
research agencies and institutions to develop, innovate and improve
technologies on clonal propagation of abaca to include antiserum
production, virus detection techniques and diagnostic kits to achieve
greater efficiency and effectiveness in the production of disease-free
abaca plantlets.
• Introduction of new improved abaca varieties
To address the problem of the abaca industry on virus diseases the
development and introduction of new abaca varieties possessing resistance
THE PHILIPPINE ABACA INDUSTRY ROADMAP 2018-2022 70
to virus diseases shall be pursued through conventional breeding and modern
biotechnology. On-going research projects of UPLB-IPB and VSU on multi-
locational trial of newly developed disease-resistant abaca hybrids will
be continued and so with the the on-going project of PhilFIDA on the
development of transgenic abaca possessing resistance to bunchy- top
disease. Other research studies related to molecular biology and
biotechnology to gain deeper understanding on the abaca as a crop, the
insect vector and virus pathogens shall likewise be conducted. Further,
establishment and upgrading of R&D laboratories and facilities coupled with
the development of human capital will be undertaken to strengthen R&D
capability.
B. On Farm Production
• Available production technologies for improved fiber yield, higher farm
productivity and increased farm income
Dynamic research for the generation and dissemination of abaca
production technologies that are climate-smart and resilient with the end view
of improving fiber yield, enhancing farm productivity and increasing farm
income shall be pursued especially in the areas of abaca-based sloping
agriculture, farming systems, pest & disease management, bio-control
agents, organic fertilizer application as well as indigenous knowledge, among
others.
• Eradication of disease infected areas
A lot of abaca farms are infected with bunchy top, abaca mosaic and
abaca bract mosaic. These are viral diseases caused by aphids. Infected
abaca plants stay stunted thus no fiber can be harvested. The disease
incidence ranges from 2-71 percent. Eastern Visayas is the hardest hit with 66-
71 percent rate. To control the rapid spread of the disease, PhilFIDA (then FIDA)
has implemented a 5-year “Abaca Disease Management Project “(ADMP)
starting in 2009 in coordination with the concerned Local Government
Units. The objective is to bring down the disease incidence to less than five
percent, a level that is manageable by farmers to control by rouging.
The eradication process makes use of green label insecticide spray to control
the vector and by piercing glyphosate-soaked bamboo sticks into infected
plants. Monitoring of the effectiveness of the treatment is conducted to
provide information as bases for decision for retreatment if needed or to
account for disease-freed abaca farms and consider for rehabilitation/
replanting.
• Trainings
Some farms are under harvested either due to low price or lack of
manpower to do the harvest. In case of the latter, the employment of
harvester brigade can also bring increased production especially in locations

THE PHILIPPINE ABACA INDUSTRY ROADMAP 2018-2022 71
where abaca is quite new. A harvester brigade is a group of experienced
harvesters and fiber strippers from provinces that has long been producing
abaca such as in Bicol or in Leyte who can be hired by plantation owners such
as in Zamboanga or in relatively new abaca areas in the Regions.
• Information, Education and Communication (IEC)
The adoption of what is latest in production technologies is essential in
improving quantity and quality of fiber produce. Here, capability building
starts with the field personnel of PhilFIDA who will in turn train LGU
Agricultural Extension Worker (AEW) and farmer leaders who will share the
knowledge to the abaca farmers to level up their knowledge and skills to
improve their production. The continued updating of the farmers and other
stakeholders on the technology will be supported by distribution of IEC
materials and through on-line technology access in areas with available
internet service.
• On Fiber Quality Competitiveness
Maintained consistency of fiber quality makes our product
competitive. Consistent best quality raw material produces the best product
and the best product are the ones patronized by consumers. That at any
market situation, whether supply and/or demand is low or high, fiber quality
must be consistent.
C. On processing
• Establishment of Fiber Stripping Center & Abaca Drying Shed as
Common Service Facilities (CSF) and Distribution of Stripping Knives
and PhilFIDA- designed Improved Handstripping Devices
The production of abaca fiber is dependent on the processing
techniques done manually using the traditional stripping knives or
mechanically through the use of fiber extraction machines. Based on 2012
fiber statistics, the present level of mechanization computed as percent (%)
machine-extracted fiber to total baling is 13.6 percent. To increase fiber
production, the Roadmap shall establish 1,996 units of abaca stripping center
and drying shed as CSF which will require a budget of PhP 399,200 million. By
year 2020, additional 3,114 units will be established with budgetary
requirement of P 622,800 million.
Moreover, stripping knives and improved handstripping devices totaling
620 and 840 units will be distributed by 2018 and 2020, respectively. This will
require an amount of PhP 7.095 million for 2016 and 10.7 million for 2020.
• Researches on Fiber Processing/Extraction (Primary Processing)

THE PHILIPPINE ABACA INDUSTRY ROADMAP 2018-2022 72
Improvement of existing fiber extraction machines (three-series spindle
stripping machines, autofed decorticating machine and tandem multi-fiber
decorticating machine) shall be undertaken.
• Conduct of Training of Trainers
Trainings of farmers on pre-classification, safe use and maintenance of
fiber extraction machines totaling to 400 trainings targeted by 2018 and
additional 420 trainings by 2020 shall be conducted, which will require a
budget of P 15.5 million and P 21.0 million, respectively. (Please refer to Annex
15 for details)
D. On Trade
• Ensure conformity with the established government standards
In order to supply the processor’s and exporter’s requirements with the
right quantity and quality of fibers and to sustain the country’s credibility as a
responsible and reliable supplier of quality fibers. License issuances to traders,
exporters, processors and classifiers ensure that all fibers coming the
establishments are properly classified, graded, baled, inspected and certified
as to established government prescribed standards. Permit to transport will
eliminate mis-declaration of the district of production, kind and volume of
fibers.
• Enforce and maintain a uniform and standard classification of abaca
fibers
Strict monitoring of different grading and baling establishments (GBEs),
trader’s warehouses and processor’s establishments shall be done by the
PhilFIDA Regulatory personnel.
E. On Market
• Implementation of Republic Act 9242 or the Philippine Tropical Fabrics
The law was implemented through the issuance of the Implementing
Rules and Regulations (IRR) stipulating the use of Philippine Tropical Fabrics or
PTF with 5% fiber content of abaca, banana, pineapple and 15% silk for the
uniforms of public officials and employees. The law is both significant and
relevant as it will provide impetus for the growth of the Philippine tropical fabric
industry and at the same time will contribute to the development of an
environment-friendly agricultural and industrial sector.
• Provision of infrastructure facilities and automated machines/devices to
promote our very own Philippine Handwoven Fabrics

THE PHILIPPINE ABACA INDUSTRY ROADMAP 2018-2022 73
The PhilFIDA in coordination with the private sector and local
government units shall establish 16 units of Livelihood Training and Processing
Centers in identified areas by 2018 in the amount of P 10.6 M. Along with the
infrastructure is the provision of automated loom weaving machine that was
developed by JRD Systems Incorporated with the view of helping the weaving
industry cope with the increasing demand for indigenous fabrics by the
growing wear and apparel market. A total of 12 units of automated loom
weaving machines amounting to P 4.8 M will be fabricated by the company
by 2018 and will be distributed to identified weaving communities.
• R & D on Market/Fiber Utilization
Development of different technologies to improve marketability of fiber
products and value adding (i.e. simple machines/device for production of
knotted fibers, ethanol production from abaca stripping waste) shall be
undertaken.
• Conduct of trainings
Transfer of developed technologies and continuous training on value
adding such as macramé-, handmade paper-and scrunch-making, and other
fibercraft shall be done.

THE PHILIPPINE ABACA INDUSTRY ROADMAP 2018-2022 74
Table 15. Action Programs and KRAs for the abaca industry. INPUTS: Improve quality and availability of planting material
Supply Chain
Segment Key Result Areas
Performance Indicator
Action Programs Time
Frame/ Working Group
INPUT SUPPLY
Adequate supply of disease-free and high yielding abaca planting materials 2018
Establishment, Maintenance and operationalization of facilities for the production of high yielding and disease- free abaca planting materials Development of clonal propagation protocols for disease-free abaca planting materials
# of technicians trained - @ least 15 technicians per training and 4 trainings per year starting 2017
# of accredited producers - @ least 2 per year starting 2017
# of technicians trained - @ least 15 technicians per training and 4 trainings per year starting 2017
# of accredited producers
- @ least 2 per year starting 2017
Investment in the establishment and operationalization of tissue culture laboratories, seedbank-cum- experiment stations, screen houses, nurseries, diagnostic laboratories and immunology laboratory Abaca planting material production
and distribution
PhilFIDA, SUCs, LGUs,
Farmers Associations

THE PHILIPPINE ABACA INDUSTRY ROADMAP 2018-2022 75
Development of
clonal propagation
protocols for
disease-free abaca
planting materials
# of technicians trained - @ least 15 technicians per training and 4 trainings per year starting 2017
# of accredited producers - @ least 2 per year starting 2017
# of researches conducted
Training on abaca plantlets acclimatization and nursery management Accreditation of abaca planting
materials producers Investment in R&D for abaca
micropropagation techniques and
virus detection
PhilFIDA, SUCs, LGUs Farmers Associations PhilFIDA, SUCs, LGUs
Farmers Associations
BPI-PQS PhilFIDA, DA- Biotech
PIU, DA-BAR, SUCs DOST- PCAARRD
Introduction of improved
abaca
varieties
# of abaca cross breeding researches PhilFIDA and SUCs
Improvement of abaca varieties possessing resistance to virus diseases and other traits of interest
# of improved abaca varieties developed
Investment on abaca improvement R & D covering both conventional breeding and modern biotechnology to
PhilFIDA, DA-Biotech PIU, DA-
BAR, SUCs DOST-
PCAARRD

THE PHILIPPINE ABACA INDUSTRY ROADMAP 2018-2022 76
include genebanking, molecular biology, confined screening and field trials of abaca; studies on insect vectors, pathogens; as well as bioinformatics.
# of researches on abaca improvement conducted
Investment on strengthening R & D capability of research institutions and agencies by establishing and upgrading
laboratories and facilities and
development of human assets
PhilFIDA, DA-Biotech PIU, DA- BAR, SUCs DOST- PCAARRD
Investment and maintenance of R & D facilities
Available production technologies for improved fiber yield, higher
farm productivity and increased farm income
Generation and dissemination of cost-effective package of technology for fiber production especially on climate change adaptation
# of researches conducted
Investment on Rand D on abaca-based sloping agriculture land, integrated farming/cropping system, on pest and disease
management, bio-control agents,
organic fertilizers as well as
indigenous knowledge.
PhilFIDA, SUCs DA- BAR, DOST-
PCARRD
PhilFIDA - Philippine Fiber Industry Development Authority
DA-BAR - Bureau of Agricultural Research of the Department of Agriculture
DOST-PCAARRD - Philippine Council for Agriculture, Aquatic and Natural Resources Research and Development of the Department of
Science and Technology
DA-Biotech PIU - Biotech Program Implementing Unit of the Department of Agriculture
BPI-PQS - Plant Quarantine Service of the Bureau of Plant Industry SUCs - State universities & colleges
LGUs - Local Government Units

THE PHILIPPINE ABACA INDUSTRY ROADMAP 2018-2022 77
PRODUCTION: To increase fiber production.
Supply
Chain
Segment
Key Result
Area
Performance
Indicators
Action
Programs
Time
Frame/
Working
Group
Budget (PhP'000)
PRODUCTION 2018 2019 2020 2021 2022
New abaca area No. of hectares
2018 – 10,000
2019 – 9,000
2020 – 0
2021 – 0
2022 – 0
Support in the opening of
new abaca farms
2018-2022
PhilFIDA,
LGUs,
SUCs,
DENR
70,956
1,958,131
1,554,299
1,479,367
1,507,233
Restored old
and disease-
freed abaca
farms
No. of hectares
2018 – 34,167
2019 – 21,917
2020 – 0
2021 – 0
2022 – 0
Support for rehabilitation of
old and disease- freed abaca
farms
2018-2022
PhilFIDA,
LGUs
Disease-
freed
abaca
farms
No. of hectares
treated 2018 – 4,350 2019 – 7,700
2020 – 8,700
2021 – 7,200
2022 – 5,800
Abaca Disease
Management Program
2018-2022
PhilFIDA,
LGUs,
SUCs, ATI
43,500
77,000
87,000
72,000
58,000
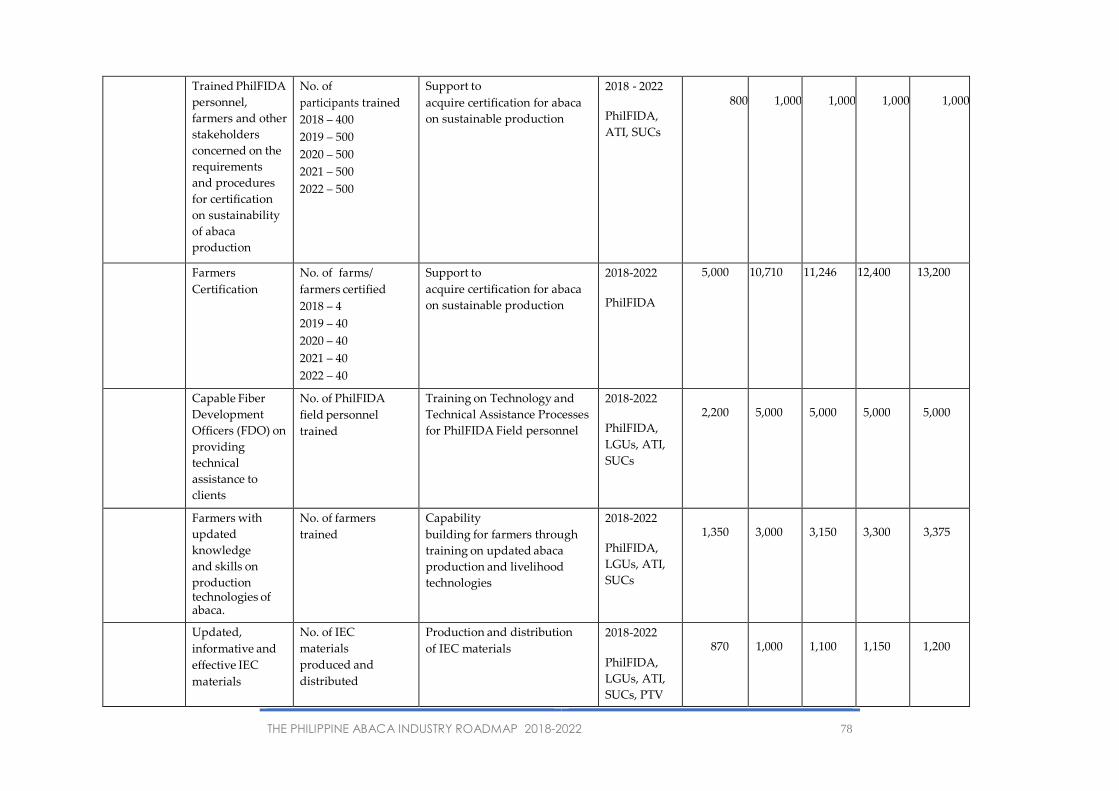
THE PHILIPPINE ABACA INDUSTRY ROADMAP 2018-2022 78
Trained PhilFIDA
personnel,
farmers and other
stakeholders
concerned on the
requirements
and procedures
for certification
on sustainability
of abaca
production
No. of
participants trained
2018 – 400
2019 – 500
2020 – 500
2021 – 500
2022 – 500
Support to
acquire certification for abaca
on sustainable production
2018 - 2022
PhilFIDA,
ATI, SUCs
800
1,000
1,000
1,000
1,000
Farmers
Certification
No. of farms/
farmers certified
2018 – 4
2019 – 40
2020 – 40
2021 – 40
2022 – 40
Support to
acquire certification for abaca
on sustainable production
2018-2022
PhilFIDA
5,000 10,710 11,246 12,400 13,200
Capable Fiber
Development
Officers (FDO) on
providing
technical
assistance to
clients
No. of PhilFIDA
field personnel
trained
Training on Technology and
Technical Assistance Processes
for PhilFIDA Field personnel
2018-2022
PhilFIDA,
LGUs, ATI,
SUCs
2,200
5,000
5,000
5,000
5,000
Farmers with
updated
knowledge
and skills on
production technologies of abaca.
No. of farmers
trained
Capability
building for farmers through
training on updated abaca
production and livelihood
technologies
2018-2022
PhilFIDA,
LGUs, ATI,
SUCs
1,350
3,000
3,150
3,300
3,375
Updated,
informative and
effective IEC
materials
No. of IEC
materials
produced and
distributed
Production and distribution
of IEC materials
2018-2022
PhilFIDA,
LGUs, ATI,
SUCs, PTV
870
1,000
1,100
1,150
1,200

THE PHILIPPINE ABACA INDUSTRY ROADMAP 2018-2022 79
Established
On-line
technology
Access Facility
No. of facility
established
e Fiber Online Technical
Information Services
2018-2022
PhilFIDA,
LGUs, ATI,
SUCs
350
3,000
1,000
1,000
1,000
Refurbished
PhilFIDA
Farmers'
Training
Center in
Catanduanes
No. of farmers
training Center
refurbished
Repair/renovatio n of
PhilFIDA Farmers Training
Center in Catanduanes
2018
PhilFIDA
-
5,000
-
-
Sub-total
125,026
2,063,841
1,663,795
1,575,217
1,590,008

THE PHILIPPINE ABACA INDUSTRY ROADMAP 2018-2022 80
PROCESSING: To develop and improve processing and utilization of fibers.
Supply
Chain Segment
Key Result
Area
Performance
Indicators
Action Programs Time Frame/
Working Group
Budget (P '000)
2018 2019 2020 2021 2022
PROCESSING
Provision of Fiber Stripping Centers (with MSSM and drying shed) (10 units per cluster)
1996 units Piloting/ Commercialization of developed stripping machine housed in Fiber Stripping Center with a Drying Shed
2019-2020 PhilFIDA-
FUTD, LGUs
PPP-
collaboration
with private
sectors
195,200 204,000
3114 units Piloting/ Commercialization
of developed stripping
machine housed in Fiber
Stripping Center with a
Drying Shed
2021-2022 PhilFIDA-
FUTD, LGUs
PPP-
collaboration
with private
sectors
205,800 207,600
Provision of
Standard
Stripping
Knives/ Improved
Handstripping
Device (IHSD)
620 units Identification of
farmer, beneficiaries with
LGUs, fabrication of the
device and distribution to farmer- beneficiaries
2018-2020 PhilFIDA- FUTD, LGUs
PPP-
collaboration
with private
sectors
2,365 2,365 2,365

THE PHILIPPINE ABACA INDUSTRY ROADMAP 2018-2022 81
840 units Identification of farmer, beneficiaries with LGUs, fabrication of the device and distribution to farmer- beneficiaries
2021-2022 PhilFIDA-
FUTD, LGUs
PPP-
collaboration
with private
sectors
3,567 3,567
Provision of
Fiber Extraction
Facilities needed
for fiber
production to be
degummed,
spun and woven
to produce
Philippine
Tropical Fabrics
(DA-DOST-
PTRI- TRC) in
compliance to
Republic Act
9242
75 units of MFDM and other facilities
Fabrication of
extraction machines
machines for selected
fibers in collaboration
with LGU and the private sector
2018-2019 DA-
PhilFIDA-
FUTD DOST-
PTRI-TRC
PPP-
collaboration
with private
sectors
35,000 1,000
Provision of degumming facility for selected fibers and transfer of technology on degumming
2 common service facilities
Establishment of degumming facilities as CSF in coordination with LGU and private sector
2018-
2019
PhilFIDA-
FUTD, PRDP,
LGUs PPP
collaboration
Non- woven
Philippines
25,000 25,000

THE PHILIPPINE ABACA INDUSTRY ROADMAP 2018-2022 82
Establishment of livelihood training centers in coordination with LGUs
4 centers/year 16 centers 25 participants/ session
Establishment
of livelihood processing
and training centers with
LGUs for organized
cooperatives/associations
2018-2021
PhilFIDA-
FUTD LGUs
2,650 2,650 2,650 2,650
Development of automatic handloom weaving machine
3 units/year 12 units
Fabrication and identification of beneficiaries prior to distribution to farmers' associations'/ cooperatives
2018-2021
PhilFIDA-
FUTD PPP-
collaboration
with private
sectors
1,200 1,200 1,200 1,200
Improvement of
existing fiber
extraction
machines for
fuel efficiency
(series-type
stripping
machine
driven
by a single
diesel engine)
1 unit Prototype 1 unit Final Model
Design and fabrication Testing and evaluation
2018-2020
PhilFIDA-
FUTD LGUs
PPP-
collaboration
with
private
sectors
1,300 1,300 1,300
Improved
tools/devices/ma
chines
fabricated
distributed for
semi-processing
of fibers
like twining,
braiding and
tinagak making
Three prototypes
Design and
Fabrication of Prototype
Units Commercialization
of the final model
2018-2020
PhilFIDA-
FUTD
PPP- collaboration
with private sectors
500 500 500

THE PHILIPPINE ABACA INDUSTRY ROADMAP 2018-2022 83
Production of natural dyes for fibers, yarn, pulp, fabrics, and other fiber products
powdered natural dyes
Piloting/ Commercialization of developed dyeing technologies using natural source for application to pulp, fibers, fabrics and other products
2018-2020 PhilFIDA- FUTD DOST- PTRI
PPP- collaboaration
with
private sectors
500 500 500
Improved dyeing process through Low Temperature Plasma Treatment and minimization of wash water utilization
LTP-treated fibers Improved dyeing technology
Laboratory experiments/trials to validate results for verification
2019-2020
PhilFIDA-
FUTD
weavers PPP-
collaboaration
with
private
sectors
500 500
Development of non-woven materials for abaca
Developed technology for non- woven products Produced non- woven products
Laboratory
experiments/tria ls to
develop non- woven
products as prototype Piloting/Commercialization
of prototype for investment forum
2018-2022
PhilFIDA-
FUTD PPP-
collaboaration
with private
sectors
(Processors/ Manufacturers
5,000 5,000 5,000
1,000
1,000

THE PHILIPPINE ABACA INDUSTRY ROADMAP 2018-2022 84
Development of biocomposites using low grade abaca fiber and polymers for panel- boards and monoblock chairs
Number of developed technology on biocomposites
Piloting/Commercialization
of developed technology thru establishment of manufacturing plant with the private sector
2018-2020
PhilFIDA-
FUTD
UPLB- CFNR
PPP-
collaboration
with private
sectors
(Processors/
Manufacturers)
40,000 10,000 10,000
Development of biocomposites using low grade abaca fiber and polyester as reinforce- ment for Swiss- type E+E cab (Egg + Egli) and other products
Number of developed technology on biocomposites
Piloting/Commercialization
of developed technology in collaboration with the private sector
2018-2021
PhilFIDA-
FUTD- Torrex
Development
Corp.
4,000 2,000 2,000 2,000
Conduct of study on the use of abaca of stripping wastes for bioethanol
Number of developed processes and technology
Laboratory experiments/tria ls to develop extraction of bioethanol from abaca stripping wastes
2018-2022
PhilFIDA-
FUTD, BAR
DOE, PPP-
collaboration
with private
sectors
5,000 3,000 2,000 1,000 1,000
Development of cellulose acetate using abaca fiber for industrial application
Number of developed processes and technology
Laboratory experiments/trials for technology application
2018-2020 1,000 500 500

THE PHILIPPINE ABACA INDUSTRY ROADMAP 2018-2022 85
Identification of phytochemicals in abaca and its applications to initiate local manufacture of developed products
Number of Developed technology
Laboratory experiments/trials in the extraction of phytochemicals and identification of possible applications
2018-2020
PhilFIDA-
FUTD PPP- collaboration
with private sectors
500 500 200
Characterization
of fatty acids from abaca and utilization as additive in industrial paints
Number of developed processes
Laboratory experiments/trials in
characterizing fatty acid
from abaca extracts and its
utilization in industrial
paints
2018-2020 PhilFIDA-
FUTD PPP- collaboration
with private sectors
1,000 500 500
Chemical modification of natural fibers (abaca) for minimum water uptake
Number of developed technology and information
Laboratory experiments/trials to modify surface of fibers to reduce moisture absorption
2019-2021
PhilFIDA-
FUTD PPP-
collaboration
with
private
sectors
500 500 500
Electrospinning
process developed for nanofibers from abaca
Number of developed processes and technology
Laboratory experiments/tria ls to come-up with nano fibers for special products
2018-2021
PhilFIDA-
FUTD PPP-
collaboration
with
private
sectors
1,000 1,000 500 500
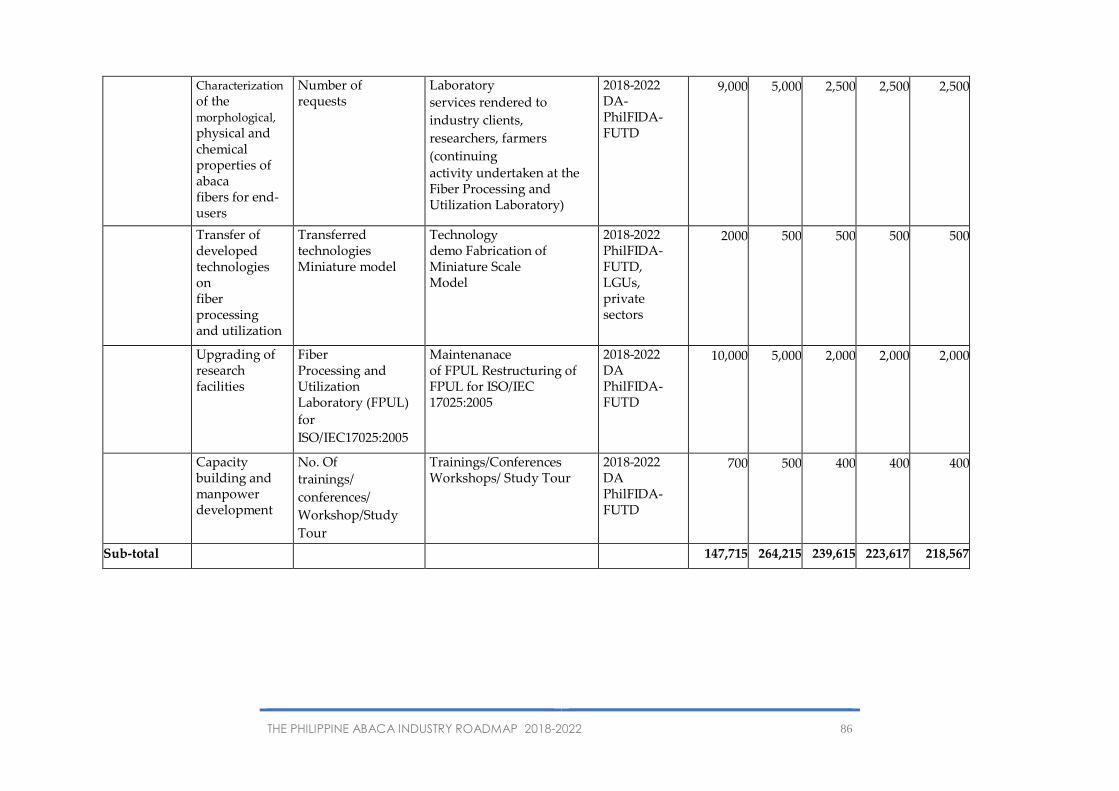
THE PHILIPPINE ABACA INDUSTRY ROADMAP 2018-2022 86
Characterization of the morphological, physical and chemical properties of abaca fibers for end- users
Number of requests
Laboratory
services rendered to
industry clients,
researchers, farmers
(continuing
activity undertaken at the Fiber Processing and Utilization Laboratory)
2018-2022 DA- PhilFIDA- FUTD
9,000 5,000 2,500 2,500 2,500
Transfer of developed technologies on fiber processing and utilization
Transferred technologies Miniature model
Technology demo Fabrication of Miniature Scale Model
2018-2022 PhilFIDA- FUTD, LGUs, private sectors
2000 500 500 500 500
Upgrading of research facilities
Fiber Processing and Utilization Laboratory (FPUL)
for
ISO/IEC17025:2005
Maintenanace of FPUL Restructuring of FPUL for ISO/IEC 17025:2005
2018-2022 DA PhilFIDA- FUTD
10,000 5,000 2,000 2,000 2,000
Capacity building and manpower development
No. Of
trainings/
conferences/
Workshop/Study
Tour
Trainings/Conferences Workshops/ Study Tour
2018-2022 DA PhilFIDA- FUTD
700 500 400 400 400
Sub-total 147,715 264,215 239,615 223,617 218,567

THE PHILIPPINE ABACA INDUSTRY ROADMAP 2018-2022 87
TRADE: To enhance fiber quality competitiveness
Supply
Chain Segment
Key Result Area Performance Indicators
Action Programs Time Frame/
Working
Group
Budget ('000)
TRADE 2018 2019 2020 2021 2022
Fiber Industry Regulation Services
1. Permit Issuance
2,400
1,540
2,194
1,863
3,249
Number of
permits, licenses
and accreditation
acted upon
- licenses (Trader Exporters, Processors, Classifiers)
No. licenses issued
Inspection
Traders2018-2022 , Exporters, Processors, Classifiers
- Permit to
transport Fiber
No.of permit to transport fibers
Inspection
2018-2022
Traders,
Exporters
- Primary Certificates of Fiber inspection (PCFI)
No.of primary certificates
Certification
2018-2022
Traders,
Exporters

THE PHILIPPINE ABACA INDUSTRY ROADMAP 2018-2022 88
percent of authorized/ accredited entities without detected violations of licenses or accreditation conditions (PTF and Primary Certificates)
Percent Accredited Entities
Inspection
2018-2022 Traders, Exporters, Processors, Classifiers
percent of
applications for
permits, licenses,
or accreditations
acted upon
within
3 weeks of application
Percent Application Acted (percent)
Verification / Inspection
2018-2022 Traders, Exporters, Processors, Classifiers
2. Monitoring 3,820 1,650 2,415 1,996 4,195
- No. of sites and facilities monitored and/or inspected with reports issued (inspected and approved bales)
Number of facilities inspected
Inspection of facilities
2018-2022
Traders, Exporters, Processors
- Number of products monitored and/or inspected with reports issued (inspected and approved bales)
Number of bales inspected/ verified
Inspection of approved bales
2018-2022 Traders, Exporters

THE PHILIPPINE ABACA INDUSTRY ROADMAP 2018-2022 89
- percent of submitted reports that resulted in the issuance of notice of violations and penalties imposed
Percent submitted reports (percent)
Investigation
- percent of recommendations for prosecution that are acted upon
Percent recommendation acted upon (percent)
Investigation
2018-2022 Traders, Exporters, Processors
- percent of sites and products that have been inspected more than twice in last 2 years
Inspection
2018-2022 Traders, Exporters, Processors
3. Enforcement
3,400
3,190
3,909
3,860
5,246
Number of enforcement actions undertaken
- facilities of participants
No. of inspection reports issued
Monitoring and Inspection
2018-2022
Traders, Exporters, Processors
- fiber bales inspected
No. of inspection reports issued
Monitoring and Inspection
2018-2022
Traders, Exporters

THE PHILIPPINE ABACA INDUSTRY ROADMAP 2018-2022 90
- percent of submitted reports that resulted in the issuance of notice of violations and/or cases filed/litigated
Investigation
Traders, Exporters, Processors, Classifiers
- percent of permit/licenses holders of accredited agencies/ establishments with 2 or more violations over last 3 years
Percent detected violations
Investigation
2018-2022
Traders, Exporters, Processors, Classifiers
- percent of detected violations that are resolved or referred for prosecution within 7 working days
Percent detected violations
Investigation
Sub-Total
9,620
6,380
8,518
7,719
12,690

THE PHILIPPINE ABACA INDUSTRY ROADMAP 2018-2022 91
F. Major Problems and Solutions with New Approaches
1. Lack of Planting Materials. This is the main problem of the PhilFIDA because of
its dependence to tissue culture planting materials, low seedbank seedling
production and disease infected planting materials. Private sectors,
Indigenous People and upland farmers need millions of planting materials for
their farms.
Solution 1: Use abaca seeds as planting materials in response to the needs of
the clients. The Regional Directors, Division Chiefs, Researches, Technicians and
Extension workers were trained on seed propagation and nursery
establishment. PhilFIDA Regional offices are now collecting seeds for nursery
propagation and will give seeds to farmers and private sectors for their
nurseries. A seed protocol was already developed.
Solution 2. Increase number of nurseries per region that will be accredited by
the Bureau of Plant Industry and PhilFIDA. Accredited nurseries shall be
established in each municipality. Agriculture staff of LGUs and NGOs will be
trained on seedling production and nursery management.
Solution 3: PhilFIDA shall tap Land Bank of the Philippines and other financial
institutions for possible financing for abaca plant production with low interest
rate of less than 7 percent and long gestation payment of 5-7 years so more
farmer groups and private sectors can benefit. Eligibility of farmers groups must
also be changed and with no collateral. Farmers organizations must be
responsible for collection and payment of loans.
2. Prevalence of Abaca Diseases such as Bunchy-top, Bract Mosaic and Mosaic.
Solution 1: Introduce a zero percent virus disease incidence in all abaca farms.
Solution 2: Promotion of efficient farm management by intensive and
sustainable farmers’ training. Agricultural Training Institute (ATI) will be tapped
to support the trainings for farmers, LGU technicians and NGOs to improve their
technical knowledge and skills on abaca farming.
Solution 3: Conduct exploration of new pest management technology and
establish an Integrated Pest Management Program for Abaca.
3. Low Farm and Fiber Production. Majority of abaca farms are far from the
farmer’s residences and harvesting is only done 2 times a year in some areas.
Century-old harvesting device and tools, spindle and decorticating machines
are used during post-harvest and needs to be improved to produce more
quality fibers.
Solution 1: Increase yield per hectare by optimizing planting distance in
current abaca areas.
Solution 2: Improve efficiency and fiber recovery of post-harvest equipment
and facilities. The PhilFIDA, PhilMECH and SUCs will collaborate to fabricate

THE PHILIPPINE ABACA INDUSTRY ROADMAP 2018-2022 92
machines and conduct researches to improve the performance of abaca fiber
extraction machineries.
Solution 3: Availability of good and high yielding variety planting materials to
support a reasonable increase in farm productivity of existing abaca
hectarage.
Solution 4: Distribution of spindle stripping machines, knives and improved
hand-stripping devices and conduct more researches on fiber
processing/extraction.
4. Low Fiber Quality. According to Germany’s Glatfelter, the world’s biggest
manufacturer of specialty paper from abaca pulp, the quality of Philippine
fiber has deteriorated compared to fibers from Ecuador and Puerto Rico.
Solution 1: Strict enforcement of abaca fiber grading standards.
Solution 2: Promote production of quality fibers.
5. Insufficient Supply of Abaca Fiber. Abaca production has to be increased in
various ways specifically through opening of new abaca areas and by
invigorating old and less productive farms and plantations.
Solution 1: Establishment of abaca nurseries and model abaca farms.
Solution 2: Establishment of stripping centers and drying facilities near abaca
farms and promote the fabrication of spindle-stripped fibers. Farmers
organizations with huge abaca farms will be encouraged to established post-
harvest facilities with stripping machines and drying centers.
Solution 3: Active provision of technical assistance to industry players by
PhilFIDA.
Solution 4: Aggressive campaign for abaca farming. Encourage private
sectors, farmers’ associations/cooperatives and corporations to invest in
abaca trading business and engage in farm service providers. Land Bank of
the Philippines must support financing of abaca producers with low interest rate
and payable in long years.
G. New Policies
PhilFIDA will introduce new directives and policies to increase fiber production,
improve fiber quality, and strengthen partnership with all sectors of the industry.
• The Abaca Tuxy Buying Project. This will ensure the survival of abaca which is
indigenous to the Philippines. This project aims to organize and empower most of
the abaca farmers nationwide as a cooperative, produce their own abaca fibers
as a group which will redound to better competitive price, quality and quantity
and sell their harvest directly to GBEs and local processors.

THE PHILIPPINE ABACA INDUSTRY ROADMAP 2018-2022 93
The traditional way of abaca fiber extraction/harvesting by the abaca farmers
has Twelve (12) stages. The project intends to lessen it to only six (6) steps --
Topping, Tumbling, Tuxying, Tuxy Bundling, Tuxy Transporting/Hauling and Tuxy
Trading /Selling -- thereby removing and easing the burden of the abaca farmers
of the other six (6) activities and just let them continue producing all the abaca
tuxies they want for the day before selling it to their cooperative that same day.
This will surely increase abaca fiber production.
This will also strengthen the cooperativism approach which is an effective tool in
the implementation of government projects and interventions. This will create
additional benefits and advantages to all members.
• Provision of disease-free abaca planting materials shall be given and distributed
only to those interested stakeholder who are member of a farmer’s association or
cooperative.
• Encourage more farmers, private sectors, NGOs, corporations and big land owners
to plant abaca in their areas identified under National Color-Coded Agricultural
Guide Map launched by AMIA.
• Introduce an intensified disease management program that will revive and nurture
abaca plants. An improved approach in the treatment of abaca diseases such as
bunchy-top, bract mosaic and mosaic through prevention and medication.
• Introduce a Disease-Free Abaca Plantation. The X Method was used in several
years to decide pursuing disease eradication based on the degree of infestation.
In this roadmap, all abaca areas infected with the disease shall be geotagged
periodically to effectively monitor the progress of infection and provide immediate
action under the Integrated Pest Management Program.
• Finalize the “Plant-Now-Pay-Later” Scheme to abaca planting to be supported by
the Land Bank of the Philippines and other financial institutions.
• Conduct research (PhilFIDA, PhilMECH and other actors) to come-up with
improved and efficient machineries that can sufficiently increase the production
of quality fibers. Other researches mentioned in partnership with SUCs, private
sectors needs support from DOST, PCIERD, BAR and other donor agencies.
• In terms of seedling supply, at present, very few planting materials are available
for abaca farms and there are few commercial nurseries that are accredited by
PhilFIDA and Bureau of Plant Industry (BPI). With the large number of interested
groups to plant abaca this 2018, private sectors, NGOs and farmer groups are
encouraged to undertake early planting so that many suckers will be produced.
There must be adequate planting materials that are of disease-free and high
yielding varieties derived from tissue culture and seeds. New and improved nursery
management technologies, quality abaca varieties, new technologies to improve
fiber yield and increase farm productivity will also be introduced.
• For processing, the focus will be on the establishment of fiber stripping centers and
abaca drying sheds as Common Service Facilities (CSF); Conduct training of
farmers on fiber pre-classification, safe use and maintenance of fiber extraction
machines; and harvesting brigades will be organized.

THE PHILIPPINE ABACA INDUSTRY ROADMAP 2018-2022 94
H. Required Investment and Funding Support
The total investments for the input supply, fiber production, fiber processing,
fiber quality competitiveness and fiber trade aspects of the abaca industry are
estimated at PhP5.63 billion from 2018-2022.
Table 16. Estimated Investment Cost, 2018-2022 (Php)
2018 2019 2020 2021 2022 TOTAL
Fiber
Production 1,515,486,520 964,965,000 885,821,000 224,112,000 70,000,000 3,660,384,520
Fiber
Processing and Utilization
229,235,000 170,465,000 10,000,000 10,000,000 10,000,000 429,700,000
Research and
Development 6,344,000 6,344,000 6,344,000 6,344,000 6,344,000 31,720,000
Fiber Trade - 750,000,000 - 750,000,000 - 1,500,000,000
Fiber Quality Competitiveness
2,261,000 2,261,000 2,261,000 2,261,000 2,261,000 11,305,000
TOTAL 1,753,326,520 1,894,035,000 904,426,000 992,717,000 88,605,000 5,633,109,520
Investment amounting to PhP750 million in 2019 and 2021 or PhP1.50
billion from 2018-2022 on the fiber trade to improve the quality and sustain the
availability of high-grade abaca raw fibers, the “Abaca Tuxy Buying Project”
shall be adopted which include the following:
✓ Establishment and operationalization of abaca farmers cooperatives in
strategic location nationwide;
✓ Technical assistance in the establishment and operationalization of
cooperatives;
✓ Capability building for cooperative officers and members through
training on 4Ws and 1H of abaca tuxy buying project and how to be a
successful cooperative, updated abaca production and livelihood
technologies, etc;
✓ Procurement of inputs, equipment, warehouse, logistics and other tools
necessary in the operationalization of cooperative activities; and
✓ Development of systematic Information System (IS) prior to the
operationalization of the project.
Investment amounting to PhP6.34 million in 2018 or PhP31.72 million from
2018-2022 on the research and development to improve the quality and
sustain the availability of clean planting materials include the following:
✓ Establishment and operationalization of TCLs, immunology& diagnostic
laboratories, seedbank cum experiment stations, and screenhouses;
✓ R&D for abaca micropropagation techniques and virus detection;

THE PHILIPPINE ABACA INDUSTRY ROADMAP 2018-2022 95
✓ Abaca varietal improvement and R&D by conventional breeding and
modern biotechnology inclusive of gene-banking, molecular
biotechnology, confined screening and field trials;
✓ Strengthening of R&D capability of research institutions and agencies by
establishing/upgrading laboratories/facilities and capability building of
human assets; and
✓ R&D on abaca-based sloping agriculture land, integrated
farming/cropping system, on pest and disease management, bio-
control agents, organic fertilizers as well as indigenous knowledge.
Investment amounting to PhP1.51billion in 2018 or PhP3.66 billion from
2018-2022 to increase fiber production consist of the following:
✓ Provision of required diseased-free abaca planting materials;
✓ Technical and production support in the opening of new abaca areas;
✓ Technical assistance and production support in the rehabilitation of old
and disease-freed abaca farms;
✓ Abaca Disease Management Project;
✓ Support to acquire certification for abaca on sustainable production;
✓ Training on Technology and Technical Assistance Processes for PhilFIDA
Field personnel;
✓ Capability building for farmers through training on updated abaca
production and livelihood technologies;
✓ Production and distribution of IEC materials; and
✓ eFiber Online Technical Information Services;
Investment amounting to PhP229.23 million in 2018 or PhP429.70 million
from 2018-2022 to improve fiber extraction techniques, fiber utilization and
technology development consist of the following:
✓ Piloting/Commercialization of developed stripping machine housed in
Fiber
✓ Stripping Center with a Drying Shed;
✓ Fabrication of extraction machines for selected fibers in collaboration
with LGU and the private sector;
✓ Establishment of degumming facilities as Common Service Facility in
coordination with LGU and private sector;
✓ Establishment of livelihood processing and training centers with LGUs for
organized cooperatives/associations;
✓ Fabrication of automatic handloom weaving machine and
identification of beneficiaries prior to distribution to farmers'
associations/cooperatives;
✓ Design and fabrication of improved fiber extraction machines for fuel
efficiency and testing and evaluation;

THE PHILIPPINE ABACA INDUSTRY ROADMAP 2018-2022 96
✓ Design and fabrication of prototype units of improved
tools/devices/machines for semi processing of fibers for twining, braiding
and tinagak making and commercialization of the final model;
✓ Piloting/ Commercialization of developed dyeing technologies using
natural source and applicable to pulp, fibers, fabrics and other
products;
✓ Laboratory experiments/trials of improved dyeing process through low
temperature plasma treatment and minimization of wash water
utilization to validate results for verification;
✓ Laboratory experiments/trials to develop non-woven products as
prototype;
✓ Piloting/Commercialization of prototype for investment forum;
✓ Piloting/Commercialization of developed technology thru establishment
of manufacturing plant with the private sector;
✓ Piloting/Commercialization of developed technology of the
development of biocomposites using low grade abaca fiber and
polyester as reinforcement material in collaboration with the private
sector;
✓ Laboratory experiments/trials to develop extraction of bioethanol from
abaca stripping wastes;
✓ Laboratory experiments/trials on the development of cellulose acetate
using abaca fiber for industrial application;
✓ Laboratory experiments/trials in the extraction of phytochemicals in
abaca and identification of possible applications;
✓ Laboratory experiments/trials in characterizing fatty acid from abaca
extracts and its utilization as additives in industrial paints;
✓ Laboratory experiments/trials to chemically modify the surface of abaca
fibers to reduce moisture absorption;
✓ Laboratory experiments/trials to come-up with nano fibers from abaca
for special products;
✓ Laboratory services rendered to industry clients, researchers, farmers
(continuing activity undertaken at the Fiber Processing and Utilization
Laboratory);
✓ Technology transfer/demo through the fabrication of Miniature Scale
Model;
✓ Maintenance of FPUL and upgrading/restructuring of FPUL for ISO/IEC
✓ 17025:2005; and
✓ Capacity building and manpower development through
trainings/conferences/workshops/study tour.

THE PHILIPPINE ABACA INDUSTRY ROADMAP 2018-2022 97
Investment amounting to PhP2.26 million in 2018 or PhP11.30 million from
2018-2022 to enhance fiber quality competitiveness are on the following:
✓ Issuance of Primary Certificate of Fiber Inspection and Permit to Transport
Fibers to traders, classifiers, exporters and processors;
✓ Monitoring of sites and facilities of traders, exporters and processors; and
✓ Enforcement of rules and regulations governing fiber quality standards
and permits/licenses of participating establishments.

THE PHILIPPINE ABACA INDUSTRY ROADMAP 2018-2022 98
CHAPTER XI
IMPLEMENTATION AND MONITORING
A. Implementation of the Roadmap
The Philippine Fiber Industry Development Authority (PhilFIDA) under the
management of the Executive Director and a Deputy Executive Director is
the lead agency in the implementation of the Fibercrop Roadmap. The
implementing units within PhilFIDA are nine Regional Offices and four Technical
Divisions assisted by two (2) Support Divisions as shown in Figure 22.
The Executive Director (ED) is the prime mover that shall direct all
operating units of the agency to perform the innovative planned programs,
project and activities stipulated in the roadmap and agreed upon with the
stakeholders during the various consultations. The ED shall report to the
Secretary of the Department of Agriculture and the USEC of the High Value
Commercial Crops regularly the progress of the implementation and the
accomplishment of the plans in the roadmap.
The Technical Divisions are composed of the following:
1. Research Division;
2. Technical Assistance Division;
3. Regulatory Division; and
4. Fiber Utilization and Technology Division.
The technical division shall oversee the implementation of the
various programs, projects and activities (PPA) of the Fibercrop Roadmap.
The regional offices shall implement the PPAs in coordination and cooperation
with the various players and stakeholders of the country’s fiber industry both
in the public and private sectors of the economy.
The Regional Offices and their geographical coverage are composed
of the following:
1. Region I - covering the political regions I, II and CAR;
2. Region IV - covering regions III, IV-A, IV-B and NCR;
3. Region V for region V;
4. Region VII - covering also region VI;
5. Region VIII for region VIII;
6. Region IX - including ARMM;
7. Region X for region X;
8. Davao Region - including SOCCSKSARGEN; and
9. CARAGA

THE PHILIPPINE ABACA INDUSTRY ROADMAP 2018-2022 99
The cooperating and collaborating institutions are the following:
1. National and Local Government
a. Department of Agriculture (DA), its concerned bureaus and
attached agencies such as BPI, BAR, BSWM, BAFS, PhilMech, PCA,
ITCAF,PCIC, NIA, among others;
b. Department of Budget and Management (DBM);
c. Department of Agrarian Reform (DAR);
d. Department of Trade and Industry (DTI);
e. Department of Science and Technology-Philippine Council for
Agriculture, Aquatic, and Natural Resources Research and
Development (DOST-PCAARD)
f. Institute of Plant Breeding, University of the Philippines Los Baños
(UPLB);
g. University of the Philippines Diliman (UP Diliman);
h. National Convergence Initiative for Sustainable Rural Development
(NCISRD);
i. Philippine Textile Research and Development (DOST-PTRI);
j. Sericulture Research and Development Institute (SRDI)-Don Mariano
Marcos State University (DMMSU);
k. National Abaca Research Center (NARC)-Visayas State University
(VSU); and
l. Local government units at the barangay, municipal, city and
provincial levels.
2. Industry Mainstream Players
a. Fibercrop farmers and fiber producers;
b. Fiber Traders;
c. Fiber Exporters;
d. Grading and Baling Establishments (GBEs); and
e. Fiber based product processors and manufacturers, namely,
Cordage Manufacturers, Pulp Millers, Fibercraft Manufacturers, Fiber
Weavers, Fiber Reinforced Composite Manufacturers, among others.
3. Public Private Partnership Entrepreneurs
a. Fibercrop tissue culture producers;
b. Several international importers such as Glatfelter, Ahstrom, Celesa,
etc;
c. Philippine Chamber of Handicraft Industries;
d. JRD Systems Technology, Inc;
e. Torrex Development Corporation;
f. FF Cruz Construction;
g. Lynx Media Laboratories;
h. Non-wovens Philippines, Inc.;
i. CFNR;
j. Several other clients (individual/organizations); and
k. Farmer cooperatives and abaca private sectors
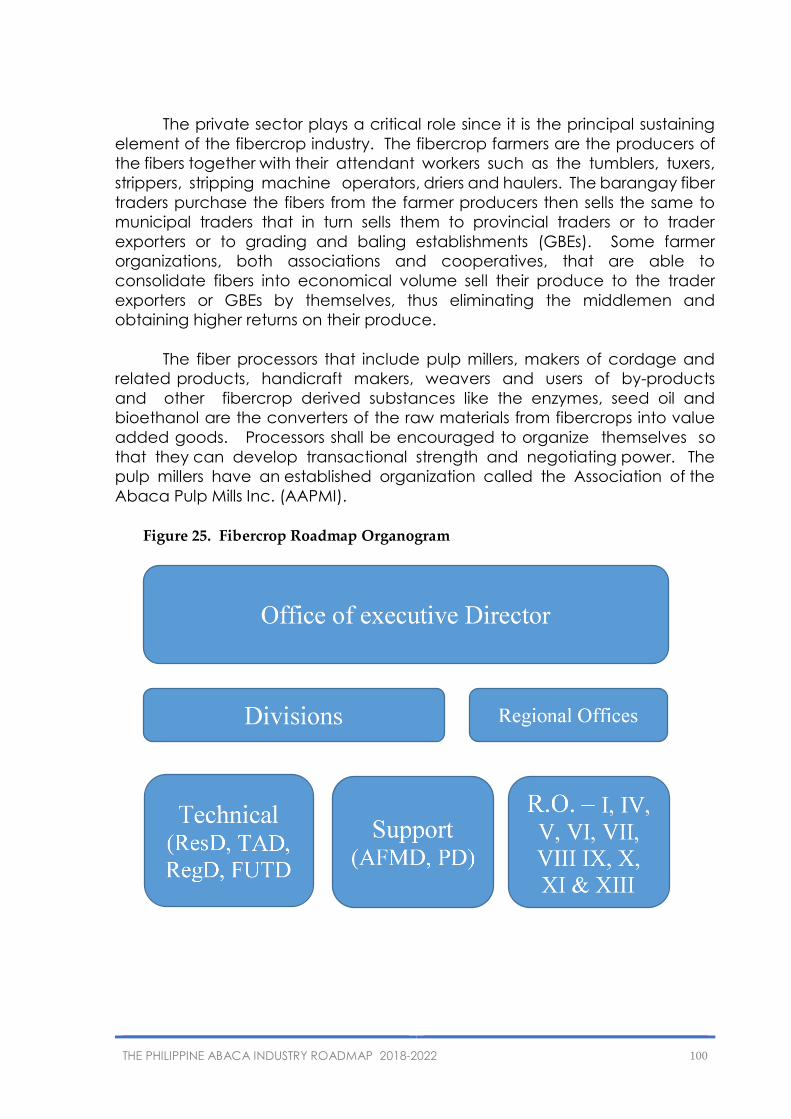
THE PHILIPPINE ABACA INDUSTRY ROADMAP 2018-2022 100
The private sector plays a critical role since it is the principal sustaining
element of the fibercrop industry. The fibercrop farmers are the producers of
the fibers together with their attendant workers such as the tumblers, tuxers,
strippers, stripping machine operators, driers and haulers. The barangay fiber
traders purchase the fibers from the farmer producers then sells the same to
municipal traders that in turn sells them to provincial traders or to trader
exporters or to grading and baling establishments (GBEs). Some farmer
organizations, both associations and cooperatives, that are able to
consolidate fibers into economical volume sell their produce to the trader
exporters or GBEs by themselves, thus eliminating the middlemen and
obtaining higher returns on their produce.
The fiber processors that include pulp millers, makers of cordage and
related products, handicraft makers, weavers and users of by-products
and other fibercrop derived substances like the enzymes, seed oil and
bioethanol are the converters of the raw materials from fibercrops into value
added goods. Processors shall be encouraged to organize themselves so
that they can develop transactional strength and negotiating power. The
pulp millers have an established organization called the Association of the
Abaca Pulp Mills Inc. (AAPMI).
Figure 25. Fibercrop Roadmap Organogram

THE PHILIPPINE ABACA INDUSTRY ROADMAP 2018-2022 101
B. Internal Monitoring
The Support Divisions are composed of the following:
1. Administrative, Financial and Management Division; and
2. Planning Division.
The roles of the support divisions are to assist the technical divisions and
to undertake internal monitoring of the implementation of the roadmap’s
planned programs, projects and activities.
C. External Monitoring
The Presidential Management Staff of the Office of the President, DA,
DBM, National Economic and Development Authority and Commission on
Audit shall conduct monitoring of the implementation of the action plans of
the Fibercrop Roadmap (FR).
Impact assessment by external assessors shall be conducted three years
after the implementation of the roadmap considering that the abaca starts
commercial fiber production only after two years from planting.
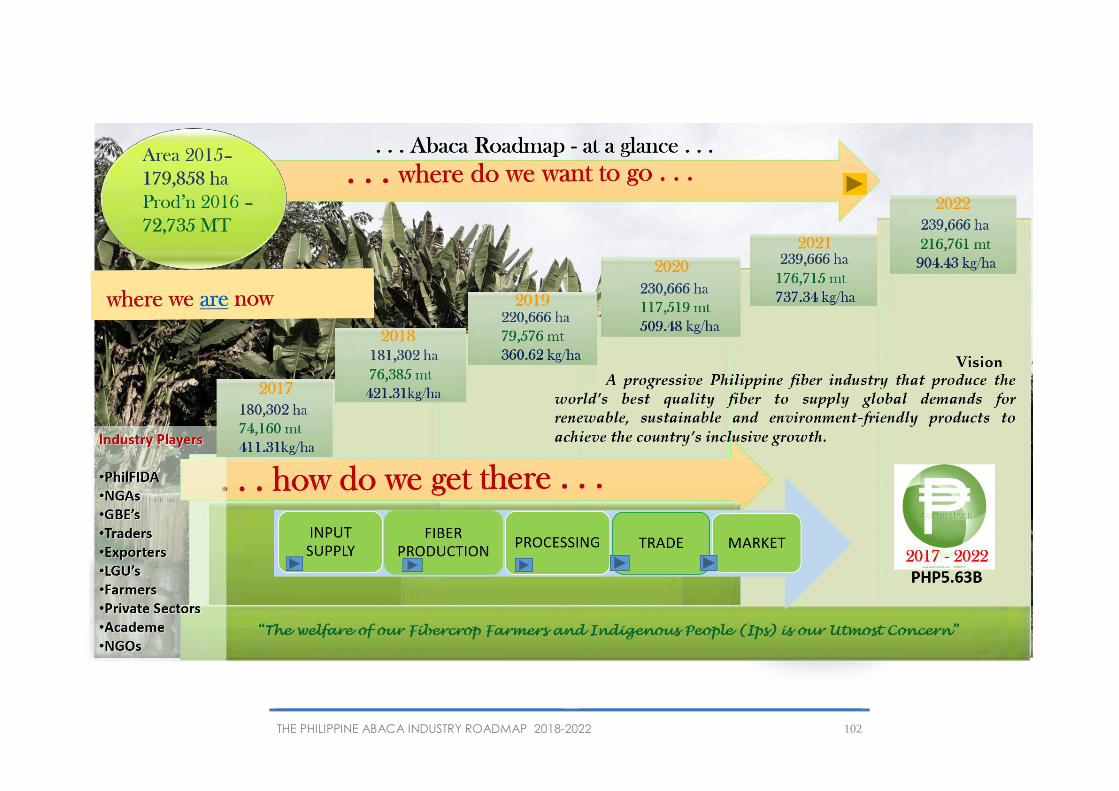
THE PHILIPPINE ABACA INDUSTRY ROADMAP 2018-2022 102

THE PHILIPPINE ABACA INDUSTRY ROADMAP 2018-2022 103
ANNEXES
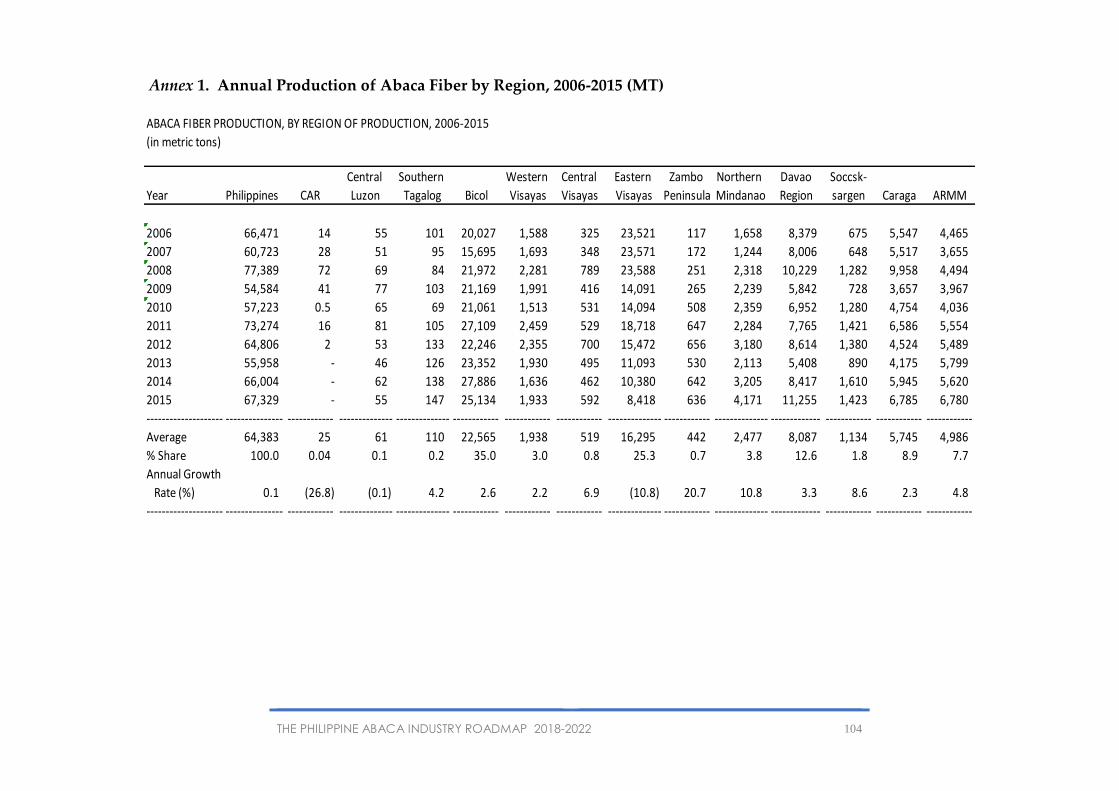
THE PHILIPPINE ABACA INDUSTRY ROADMAP 2018-2022 104
Annex 1. Annual Production of Abaca Fiber by Region, 2006-2015 (MT)
ABACA FIBER PRODUCTION, BY REGION OF PRODUCTION, 2006-2015
(in metric tons)
Central Southern Western Central Eastern Zambo Northern Davao Soccsk-
Year Philippines CAR Luzon Tagalog Bicol Visayas Visayas Visayas Peninsula Mindanao Region sargen Caraga ARMM
2006 66,471 14 55 101 20,027 1,588 325 23,521 117 1,658 8,379 675 5,547 4,465
2007 60,723 28 51 95 15,695 1,693 348 23,571 172 1,244 8,006 648 5,517 3,655
2008 77,389 72 69 84 21,972 2,281 789 23,588 251 2,318 10,229 1,282 9,958 4,494
2009 54,584 41 77 103 21,169 1,991 416 14,091 265 2,239 5,842 728 3,657 3,967
2010 57,223 0.5 65 69 21,061 1,513 531 14,094 508 2,359 6,952 1,280 4,754 4,036
2011 73,274 16 81 105 27,109 2,459 529 18,718 647 2,284 7,765 1,421 6,586 5,554
2012 64,806 2 53 133 22,246 2,355 700 15,472 656 3,180 8,614 1,380 4,524 5,489
2013 55,958 - 46 126 23,352 1,930 495 11,093 530 2,113 5,408 890 4,175 5,799
2014 66,004 - 62 138 27,886 1,636 462 10,380 642 3,205 8,417 1,610 5,945 5,620
2015 67,329 - 55 147 25,134 1,933 592 8,418 636 4,171 11,255 1,423 6,785 6,780
-------------------- --------------- ------------ -------------- -------------- ------------ ------------ ------------ -------------- ------------ -------------- ------------- ------------ ------------ ------------
Average 64,383 25 61 110 22,565 1,938 519 16,295 442 2,477 8,087 1,134 5,745 4,986
% Share 100.0 0.04 0.1 0.2 35.0 3.0 0.8 25.3 0.7 3.8 12.6 1.8 8.9 7.7
Annual Growth
Rate (%) 0.1 (26.8) (0.1) 4.2 2.6 2.2 6.9 (10.8) 20.7 10.8 3.3 8.6 2.3 4.8
-------------------- --------------- ------------ -------------- -------------- ------------ ------------ ------------ -------------- ------------ -------------- ------------- ------------ ------------ ------------

THE PHILIPPINE ABACA INDUSTRY ROADMAP 2018-2022 105
Annex 2. Area Planted to Abaca by Region, 2006-2015 (in ha)
AREA PLANTED TO ABACA, BY REGION, 2006-2015
(in hectares)
CAR/ Central Southern Western Central Eastern Zambo Northern Davao Soccsk-
Year Philippines Ilocos Luzon Tagalog Bicol Visayas Visayas Visayas Peninsula Mindanao Region sargen Caraga ARMM
2006 141,711 801 428 1,528 43,591 4,640 3,523 44,099 2,007 5,674 12,104 4,453 10,536 8,327
2007 146,273 801 654 1,748 44,216 5,114 3,692 44,717 2,749 6,288 13,380 5,112 10,890 6,912
2008 152,707 814 682 2,006 44,968 4,905 3,920 45,928 3,435 6,878 14,538 5,606 11,971 7,057
2009 162,576 787 627 2,391 51,352 7,668 1,785 44,024 1,942 4,572 14,782 5,999 20,026 6,621
2010 167,145 848 730 2,670 50,212 8,183 2,023 45,122 2,217 5,369 15,414 6,193 21,205 6,959
2011 172,528 862 853 2,885 51,884 8,463 2,078 45,708 2,397 5,761 15,699 6,337 22,470 7,131
2012 176,793 860 861 3,058 52,032 8,616 3,014 46,148 2,630 6,115 16,240 6,533 23,476 7,210
2013 172,934 774 827 3,129 52,214 8,728 3,041 46,367 2,819 2,694 16,444 6,683 23,653 5,560
2014 176,548 776 800 2,826 52,352 8,830 3,073 46,481 2,953 3,195 18,994 6,277 23,270 6,721
2015 179,858 775 809 2,880 52,493 8,927 3,045 46,680 3,117 3,323 21,204 6,327 23,372 6,906
Average 164,907 810 727 2,512 49,531 7,407 2,919 45,527 2,627 4,987 15,880 5,952 19,087 6,940
% Share 100.0 0.5 0.4 1.5 30.0 4.5 1.8 27.6 1.6 3.0 9.6 3.6 11.6 4.2
AGR (%)
2006-2015 2.7 (0.4) 7.3 7.3 2.1 7.5 (1.6) 0.6 5.0 (5.8) 6.4 4.0 9.3 (2.1)
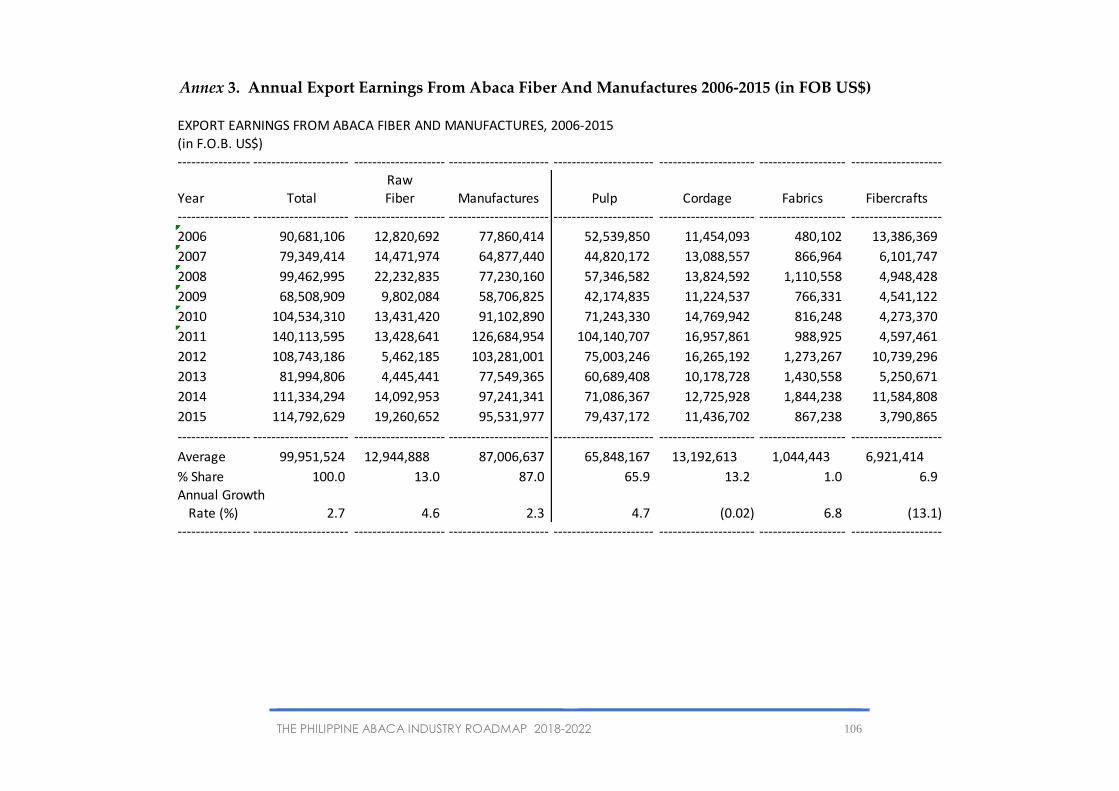
THE PHILIPPINE ABACA INDUSTRY ROADMAP 2018-2022 106
Annex 3. Annual Export Earnings From Abaca Fiber And Manufactures 2006-2015 (in FOB US$)
EXPORT EARNINGS FROM ABACA FIBER AND MANUFACTURES, 2006-2015(in F.O.B. US$)
---------------- --------------------- -------------------- ---------------------- ---------------------- --------------------- ------------------- --------------------Raw
Year Total Fiber Manufactures Pulp Cordage Fabrics Fibercrafts
---------------- --------------------- -------------------- ---------------------- ---------------------- --------------------- ------------------- --------------------
2006 90,681,106 12,820,692 77,860,414 52,539,850 11,454,093 480,102 13,386,369
2007 79,349,414 14,471,974 64,877,440 44,820,172 13,088,557 866,964 6,101,747
2008 99,462,995 22,232,835 77,230,160 57,346,582 13,824,592 1,110,558 4,948,428
2009 68,508,909 9,802,084 58,706,825 42,174,835 11,224,537 766,331 4,541,122
2010 104,534,310 13,431,420 91,102,890 71,243,330 14,769,942 816,248 4,273,370
2011 140,113,595 13,428,641 126,684,954 104,140,707 16,957,861 988,925 4,597,461
2012 108,743,186 5,462,185 103,281,001 75,003,246 16,265,192 1,273,267 10,739,296
2013 81,994,806 4,445,441 77,549,365 60,689,408 10,178,728 1,430,558 5,250,671
2014 111,334,294 14,092,953 97,241,341 71,086,367 12,725,928 1,844,238 11,584,808
2015 114,792,629 19,260,652 95,531,977 79,437,172 11,436,702 867,238 3,790,865
---------------- --------------------- -------------------- ---------------------- ---------------------- --------------------- ------------------- --------------------
Average 99,951,524 12,944,888 87,006,637 65,848,167 13,192,613 1,044,443 6,921,414
% Share 100.0 13.0 87.0 65.9 13.2 1.0 6.9
Annual Growth Rate (%) 2.7 4.6 2.3 4.7 (0.02) 6.8 (13.1)---------------- --------------------- -------------------- ---------------------- ---------------------- --------------------- ------------------- --------------------

THE PHILIPPINE ABACA INDUSTRY ROADMAP 2018-2022 107
Annex 4. Annual Exports of Abaca Fiber By Country of Destination, 2006-2015 (in MT)
EXPORTS OF ABACA FIBER, BY MAJOR COUNTRY OF DESTINATION, 2006-2015
(in metric tons)
---- -------------------- ------------------- ------------- --------------- --------------- ------------- ------------- ----------------- --------------- ---------------
Destination/ United United South Other
Year Total States Kingdom Japan Korea India China Countries
---- -------------------- ------------------- ------------- --------------- --------------- ------------- ------------- ----------------- --------------- ---------------
2006 12,886.9 25.7 6,731.1 5,171.9 9.4 208.7 67.5 562.9 109.7
2007 13,731.0 50.0 6,328.4 5,277.0 - 135.7 138.8 1,627.5 173.6
2008 13,385.5 22.5 6,325.8 5,287.5 - 78.8 75.0 1,383.8 212.1
2009 7,397.6 - 3,329.0 1,501.6 - 146.3 77.5 1,770.1 573.1
2010 11,293.1 - 4,216.2 4,680.0 12.1 174.8 20.6 2,068.1 121.3
2011 9,792.1 - 3,578.7 3,866.5 - 90.0 - 2,093.5 163.4
2012 4,456.2 - 2,477.0 1,296.5 - 56.0 82.8 406.3 137.6
2013 3,344.9 - 1,936.1 960.5 1.0 33.8 76.3 77.8 259.4
2014 9,762.8 - 4,107.5 3,625.0 - 125.0 83.8 825.4 996.1
2015 12,009.9 - 5,817.5 4,846.6 - 134.1 25.3 411.9 774.5
---- -------------------- ------------------- ------------- --------------- --------------- ------------- ------------- ----------------- --------------- ---------------
Average 9,841.4 32.7 4,484.7 3,651.3 7.5 118.3 72.0 1,122.7 352.1
% Share 100.0 0.3 45.6 37.1 0.1 1.2 0.7 11.4 3.6
Annual Growth
Rate (%) (0.8) - (1.6) (0.7) - (4.8) - (3.4) 24.3
---- -------------------- ------------------- ------------- --------------- --------------- ------------- ------------- ----------------- --------------- ---------------
Indonesia

THE PHILIPPINE ABACA INDUSTRY ROADMAP 2018-2022 108
Annex 5. Annual Exports of Abaca Pulp By Country of Destination, 2006-2015 (in MT)
EXPORTS OF ABACA PULP BY DESTINATION, 2006-2015
(in metric tons)
---- ---------------------- ------------------ ---------------- ---------------- --------------- -------------- -------------- --------------- ------------------ --------------- ---------------
Destination / United South United Other
Year Total Japan Germany Kingdom France Korea Taiwan China States Countries
---- ---------------------- ------------------ ---------------- ---------------- --------------- -------------- -------------- --------------- ------------------ --------------- ---------------
2006 22,526.3 3,610.9 9,348.6 5,522.5 1,885.4 46.7 223.7 247.1 957.3 684.1
2007 18,260.2 3,931.3 7,672.8 2,941.1 2,072.9 6.9 203.0 483.8 778.5 169.9
2008 18,102.9 3,595.1 7,293.2 2,679.7 1,477.6 1.2 140.8 351.8 846.2 1,717.3
2009 12,025.3 2,664.9 4,564.7 2,112.9 1,317.7 21.5 69.0 153.7 112.9 1,008.0
2010 20,879.0 4,024.9 7,116.8 5,175.8 1,542.6 16.2 95.4 1,045.3 1,498.0 364.0
2011 29,772.7 4,002.7 9,000.1 7,796.8 1,945.1 37.9 122.3 2,264.8 2,837.1 1,765.9
2012 21,524.8 3,179.2 6,001.4 5,992.2 1,221.9 37.3 51.2 1,686.1 1,413.9 1,941.6
2013 17,617.6 3,255.6 6,815.5 3,505.1 1,753.6 43.9 72.7 968.1 914.9 288.2
2014 20,915.7 3,521.7 7,755.8 4,750.7 1,240.9 95.0 91.6 1,406.2 1,436.7 617.1
2015 22,200.0 2,870.6 8,630.6 6,385.4 1,437.8 16.2 107.4 1,365.2 1,216.7 170.1
---- ---------------------- ------------------ ---------------- ---------------- --------------- -------------- -------------- --------------- ------------------ --------------- ---------------
Average 20,382.5 3,465.7 7,420.0 4,686.2 1,589.5 32.3 117.7 997.2 1,201.2 872.6
% Share 100.0 17.0 36.4 23.0 7.8 0.2 0.6 4.9 5.9 4.3
Annual Growth
Rate (%) (0.2) (2.5) (0.9) 1.6 (3.0) (11.1) (7.8) 20.9 2.7 (14.3)
---- ---------------------- ------------------ ---------------- ---------------- --------------- -------------- -------------- --------------- ------------------ --------------- ---------------
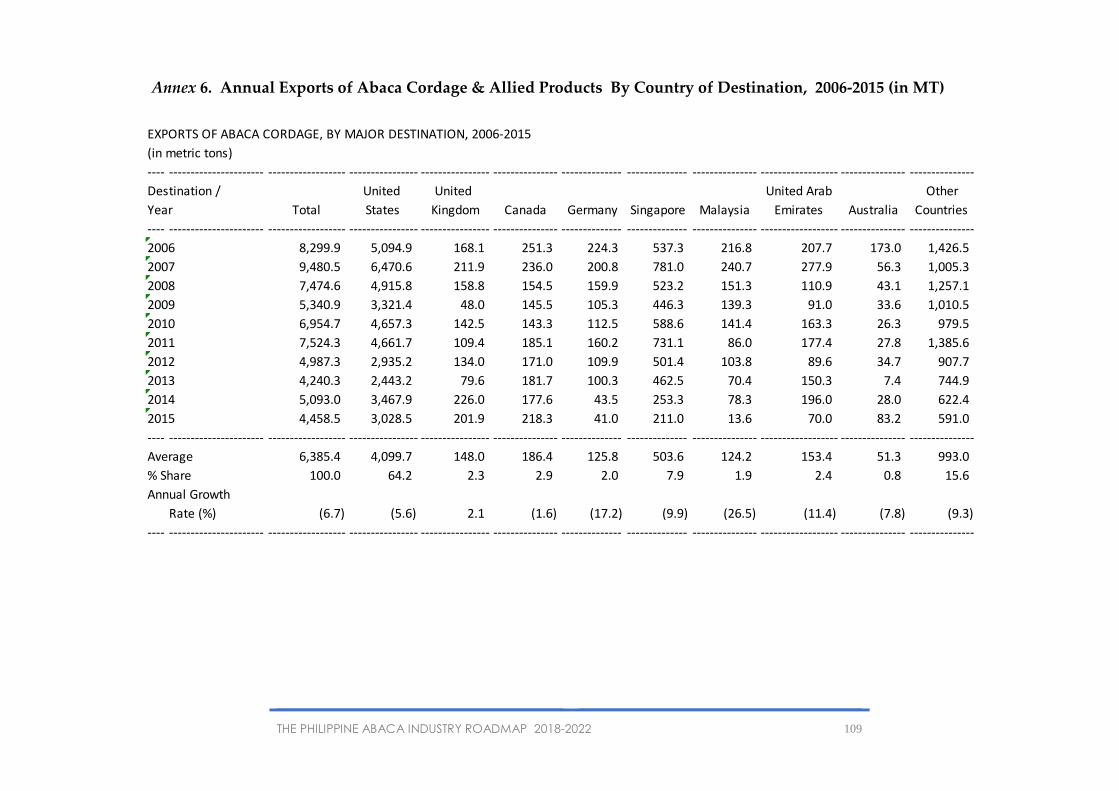
THE PHILIPPINE ABACA INDUSTRY ROADMAP 2018-2022 109
Annex 6. Annual Exports of Abaca Cordage & Allied Products By Country of Destination, 2006-2015 (in MT)
EXPORTS OF ABACA CORDAGE, BY MAJOR DESTINATION, 2006-2015
(in metric tons)
---- ---------------------- ------------------ ---------------- ---------------- --------------- -------------- -------------- --------------- ------------------ --------------- ---------------
Destination / United United United Arab Other
Year Total States Kingdom Canada Germany Singapore Malaysia Emirates Australia Countries
---- ---------------------- ------------------ ---------------- ---------------- --------------- -------------- -------------- --------------- ------------------ --------------- ---------------
2006 8,299.9 5,094.9 168.1 251.3 224.3 537.3 216.8 207.7 173.0 1,426.5
2007 9,480.5 6,470.6 211.9 236.0 200.8 781.0 240.7 277.9 56.3 1,005.3
2008 7,474.6 4,915.8 158.8 154.5 159.9 523.2 151.3 110.9 43.1 1,257.1
2009 5,340.9 3,321.4 48.0 145.5 105.3 446.3 139.3 91.0 33.6 1,010.5
2010 6,954.7 4,657.3 142.5 143.3 112.5 588.6 141.4 163.3 26.3 979.5
2011 7,524.3 4,661.7 109.4 185.1 160.2 731.1 86.0 177.4 27.8 1,385.6
2012 4,987.3 2,935.2 134.0 171.0 109.9 501.4 103.8 89.6 34.7 907.7
2013 4,240.3 2,443.2 79.6 181.7 100.3 462.5 70.4 150.3 7.4 744.9
2014 5,093.0 3,467.9 226.0 177.6 43.5 253.3 78.3 196.0 28.0 622.4
2015 4,458.5 3,028.5 201.9 218.3 41.0 211.0 13.6 70.0 83.2 591.0
---- ---------------------- ------------------ ---------------- ---------------- --------------- -------------- -------------- --------------- ------------------ --------------- ---------------
Average 6,385.4 4,099.7 148.0 186.4 125.8 503.6 124.2 153.4 51.3 993.0
% Share 100.0 64.2 2.3 2.9 2.0 7.9 1.9 2.4 0.8 15.6
Annual Growth
Rate (%) (6.7) (5.6) 2.1 (1.6) (17.2) (9.9) (26.5) (11.4) (7.8) (9.3)
---- ---------------------- ------------------ ---------------- ---------------- --------------- -------------- -------------- --------------- ------------------ --------------- ---------------

THE PHILIPPINE ABACA INDUSTRY ROADMAP 2018-2022 110
Annex 7. Annual Exports of Abaca Fabrics By Country of Destination, 2006-2015 (in sq. m.)
Destination 2005 2006 2007 2008 2009 2010 2011 2012 2013 2014 2015 Average % Share
TOTAL 185,450.0 350,078.0 629,656.0 698,335.0 575,668.0 545,113.0 393,474.0 266,632.0 240,862.0 81,539.0 38,504.0 400,531.1 100
-
United
States - 226.0 29,706.0 80.0 439.0 - 910.0 4,477.0 1,620.0 656.0 3,811.4 1.0
Japan 182.0 2,226.0 2,984.0 15,044.0 2,403.0 684.0 104.0 - 17,158.0 52.0 1,033.0 4,187.0 1.0
United
Kingdom 5,687.0 49.0 1,179.0 7,203.0 2,269.0 11,732.0 8,274.0 24,003.0 17,900.0 30,557.0 4,614.0 11,346.7 2.8
France 1,467.0 4,034.0 - 3,554.0 5,442.0 3,226.0 3,127.0 3,321.0 4,524.0 295.0 185.0 2,917.5 0.7
Hong Kong 14,284.0 145,249.0 406,514.0 455,051.0 361,033.0 270,643.0 181,228.0 169,217.0 92,804.0 47,269.0 26,633.0 216,992.5 54.2
Spain 4,111.0 15,390.0 - 15,837.0 2,992.0 - 5,094.0 503.0 387.0 777.0 4,509.1 1.1
Italy 133,445.0 156,169.0 96,869.0 160,872.0 136,496.0 111,839.0 112,657.0 34,035.0 70,828.0 131.0 445.0 101,378.6 25.3
Lebanon - - - - - - - - - - - -
China 5,715.0 - 68,656.0 27,019.0 57,207.0 114,671.0 69,461.0 20,658.0 32,435.0 239.0 5,594.0 40,165.5 10.0
Nigeria 19,892.0 25,089.0 13,716.0 13,675.0 5,960.0 4,981.0 4,374.0 890.0 3,206.0 1,563.0 9,334.6 2.3
Other
Countries 667.0 1,646.0 10,032.0 - 1,427.0 27,337.0 8,245.0 9,528.0 5,888.2 1.5
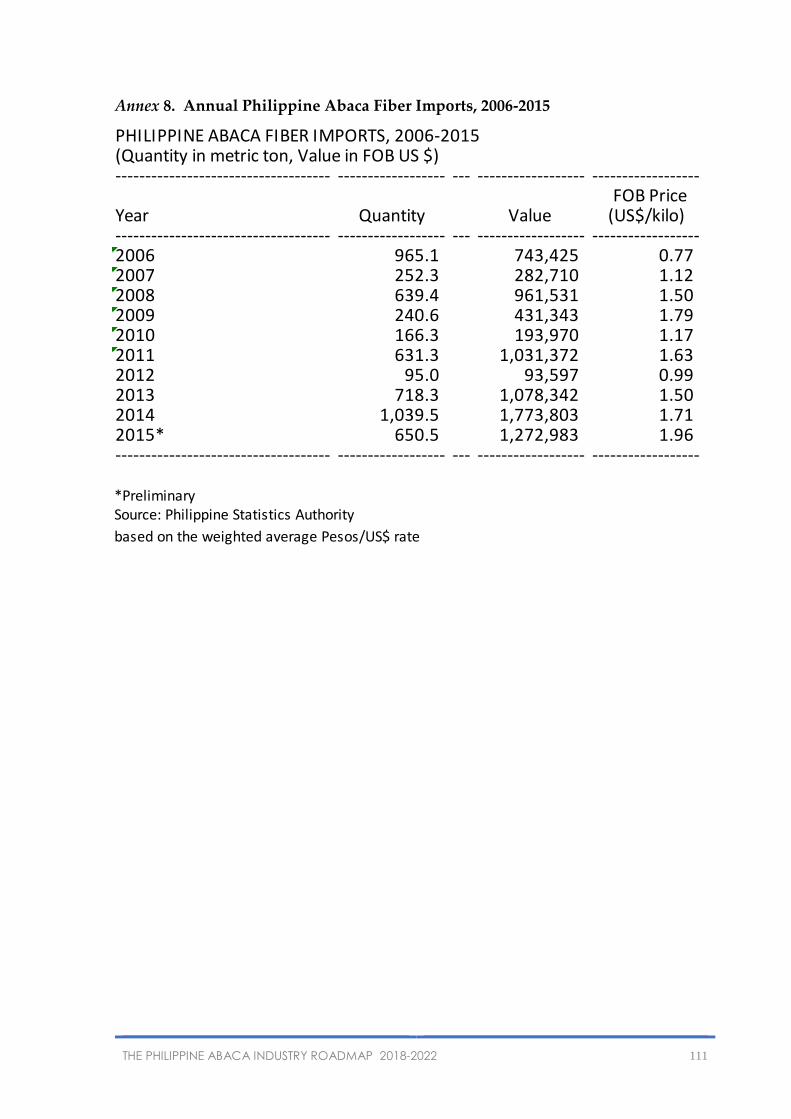
THE PHILIPPINE ABACA INDUSTRY ROADMAP 2018-2022 111
Annex 8. Annual Philippine Abaca Fiber Imports, 2006-2015
PHILIPPINE ABACA FIBER IMPORTS, 2006-2015
------------------------------------ ------------------ --- ------------------ ------------------ FOB Price
Year Quantity Value (US$/kilo)------------------------------------ ------------------ --- ------------------ ------------------2006 965.1 743,425 0.772007 252.3 282,710 1.122008 639.4 961,531 1.502009 240.6 431,343 1.792010 166.3 193,970 1.172011 631.3 1,031,372 1.632012 95.0 93,597 0.992013 718.3 1,078,342 1.502014 1,039.5 1,773,803 1.712015* 650.5 1,272,983 1.96------------------------------------ ------------------ --- ------------------ ------------------
*PreliminarySource: Philippine Statistics Authority
based on the weighted average Pesos/US$ rate
(Quantity in metric ton, Value in FOB US $)

THE PHILIPPINE ABACA INDUSTRY ROADMAP 2018-2022 112
Annex 9. Annual Domestic Consumption of Abaca Fiber By Sector, 2006-2015
(in MT)
DOMESTIC CONSUMPTION OF ABACA FIBER, 2006-2015
(in metric tons)
------------ ------------ ------------ ------------------ --------------- --------------- --------------
Ropes & Fiber-
Year\Sector Total Pulp Cordage crafts
------------ ------------ ------------ ------------------ --------------- --------------- --------------
2006 56,175 40,200 10,625 5,350
2007 47,362 30,312 12,950 4,100
2008 51,722 38,702 10,120 2,900
2009 40,684 31,074 7,435 2,175
2010 47,107 35,306 9,151 2,650
2011 63,972 51,779 9,900 2,293
2012 49,546 37,435 6,601 5,510
2013 40,865 30,639 5,579 4,647
2014 48,783 36,375 6,701 5,707
2015 46,383 38,608 5,866 1,909
------------ ------------ ------------ ------------------ --------------- --------------- --------------
Average 49,260 37,043 8,493 3,724
% Share 100.0 75.2 17.2 7.6
Annual Growth Rate (%) (2.1) (0.4) (6.4) (10.8)
------------ ------------ ------------ ------------------ --------------- --------------- --------------

THE PHILIPPINE ABACA INDUSTRY ROADMAP 2018-2022 113
Annex 10. Weighted Average Export Prices Of Abaca Fiber By Grade 2006 – 2015 (in F.O.B. US$/BALE)
HAND-STRIPPED------------------ --------------- --------------- --------------- --------------- --------------- --------------- ---------------Year EF S2 S3 I G H JK------------------ --------------- --------------- --------------- --------------- --------------- --------------- ---------------2006 196.67 140.59 110.95 145.73 127.73 87.95 119.042007 188.00 154.13 107.75 157.32 135.69 116.70 125.462008 - 239.08 181.02 235.17 221.93 168.79 202.222009 - 183.16 149.52 205.30 160.93 122.19 165.372010 - 172.73 97.04 159.53 153.87 106.34 134.292011 - 188.02 154.93 189.70 170.55 144.36 157.432012 - 196.69 148.00 195.10 173.98 117.79 117.622013 - 220.54 141.21 184.69 174.14 135.20 152.422014 - 210.26 180.96 193.40 189.28 178.07 168.112015 - 249.48 199.60 195.67 206.09 199.34 192.49------------------ --------------- --------------- --------------- --------------- --------------- --------------- ---------------

THE PHILIPPINE ABACA INDUSTRY ROADMAP 2018-2022 114
Annex 11. Weighted Average Export Prices of Abaca Fiber By Grade 2006 – 2015 (in F.O.B. US$/BALE)
SPINDLE-STRIPPED------------------ --------------- --------------- --------------- --------------- --------------- --------------- ---------------Year EF S2 S3 I G H JK------------------ --------------- --------------- --------------- --------------- --------------- --------------- ---------------2006 205.00 143.22 112.70 141.47 125.97 106.18 121.982007 225.00 157.69 127.03 158.32 137.05 120.16 143.752008 - 238.94 214.70 227.28 211.50 - -2009 337.51 183.77 - 193.07 160.00 158.00 -2010 - 164.56 155.68 170.06 154.00 140.00 -2011 - 189.87 161.33 202.04 181.50 151.00 -2012 - 192.25 - - 174.00 - -2013 - 171.23 166.87 236.26 188.17 - -2014 - 223.86 169.96 228.14 - - -2015 - 270.12 195.00 - 238.12 - ------------------- --------------- --------------- --------------- --------------- --------------- --------------- ---------------* replaced Y1 & Y2 which were abolished** replaced O & T which were abolished

THE PHILIPPINE ABACA INDUSTRY ROADMAP 2018-2022 115
Annex 12. Attendance sheet during the Roadmap Consultative Meetings
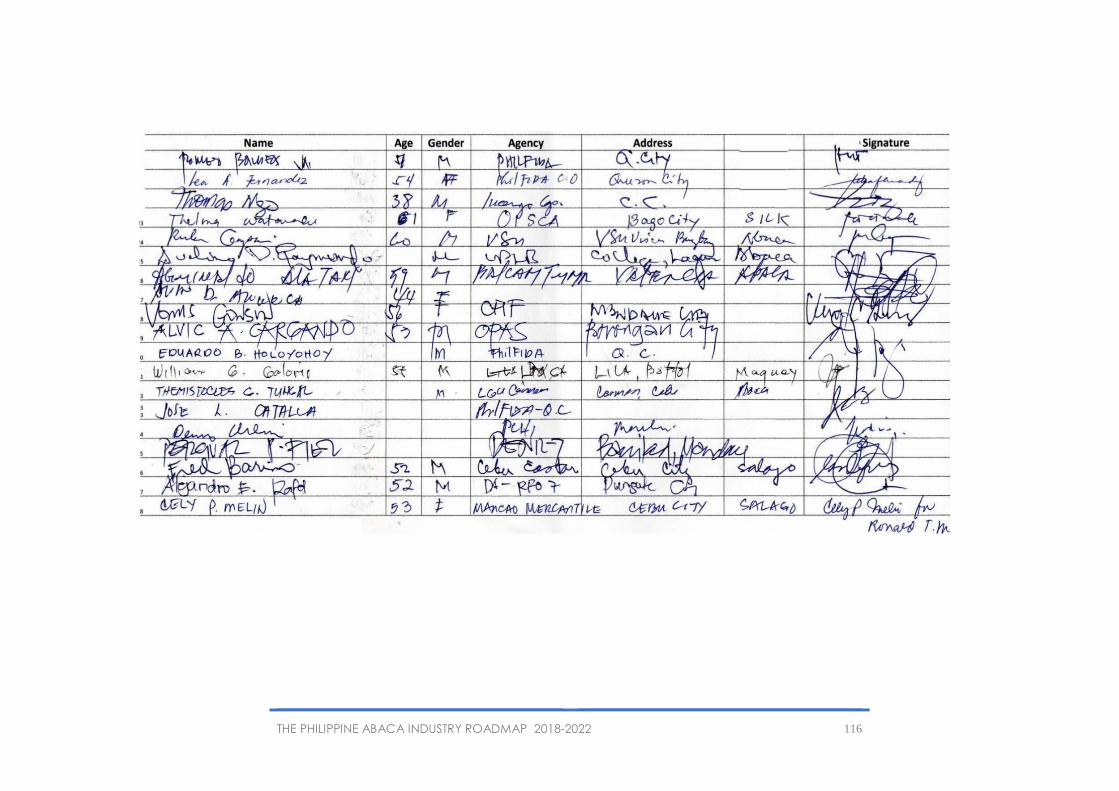
THE PHILIPPINE ABACA INDUSTRY ROADMAP 2018-2022 116

THE PHILIPPINE ABACA INDUSTRY ROADMAP 2018-2022 117

THE PHILIPPINE ABACA INDUSTRY ROADMAP 2018-2022 118
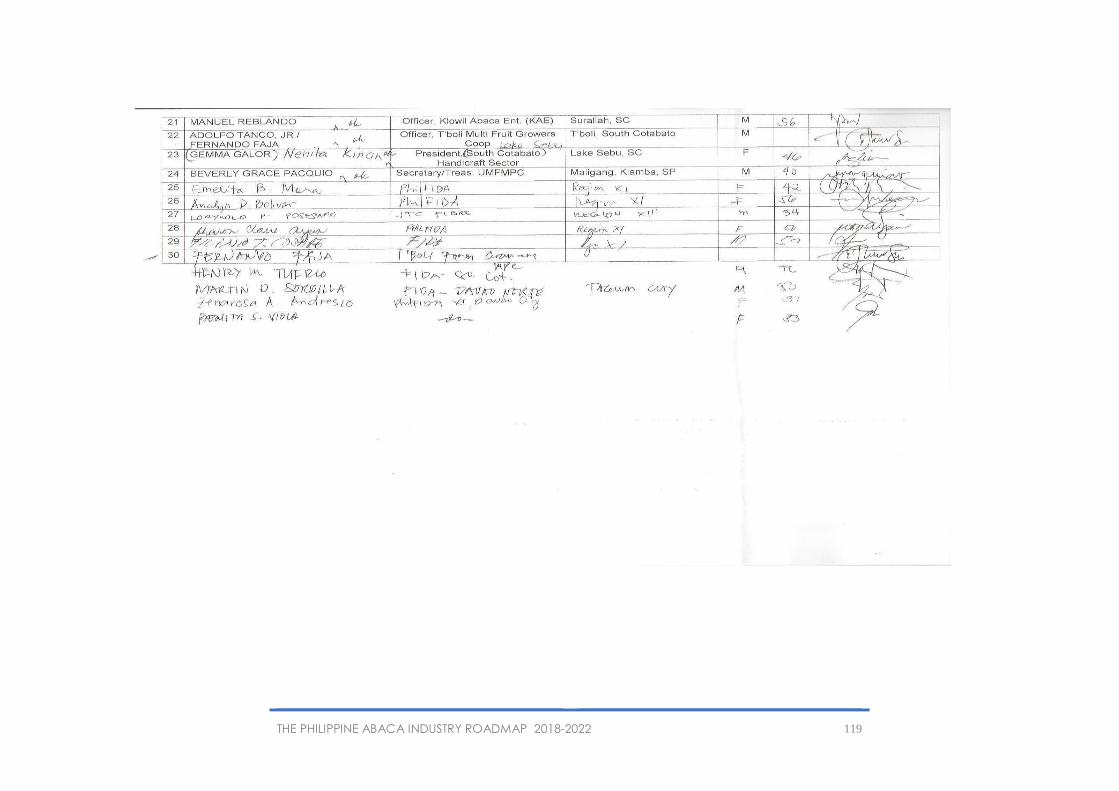
THE PHILIPPINE ABACA INDUSTRY ROADMAP 2018-2022 119

THE PHILIPPINE ABACA INDUSTRY ROADMAP 2018-2022 120


![EXECUTIVE SUMMARY · 2018-09-22 · PLP 2016-17 Champhai District [1] EXECUTIVE SUMMARY "Accelerating the pace of capital formation in agriculture and allied sector” Champhai district](https://static.fdocuments.in/doc/165x107/5e8f7bbec604bb50706c007e/executive-summary-2018-09-22-plp-2016-17-champhai-district-1-executive-summary.jpg)