Agriculture Food Sector - Pacific Communitypafpnet.spc.int/pafpnet/attachments/article/478/Food...
86
Healthy soils, healthy foods - sustaining our common livelihoods Agriculture & Food Sector Draft Document January 2015 Government of the Cook Islands Ministry of Agriculture Development Coordination Division, Ministry of Finance & Economic Management
Transcript of Agriculture Food Sector - Pacific Communitypafpnet.spc.int/pafpnet/attachments/article/478/Food...
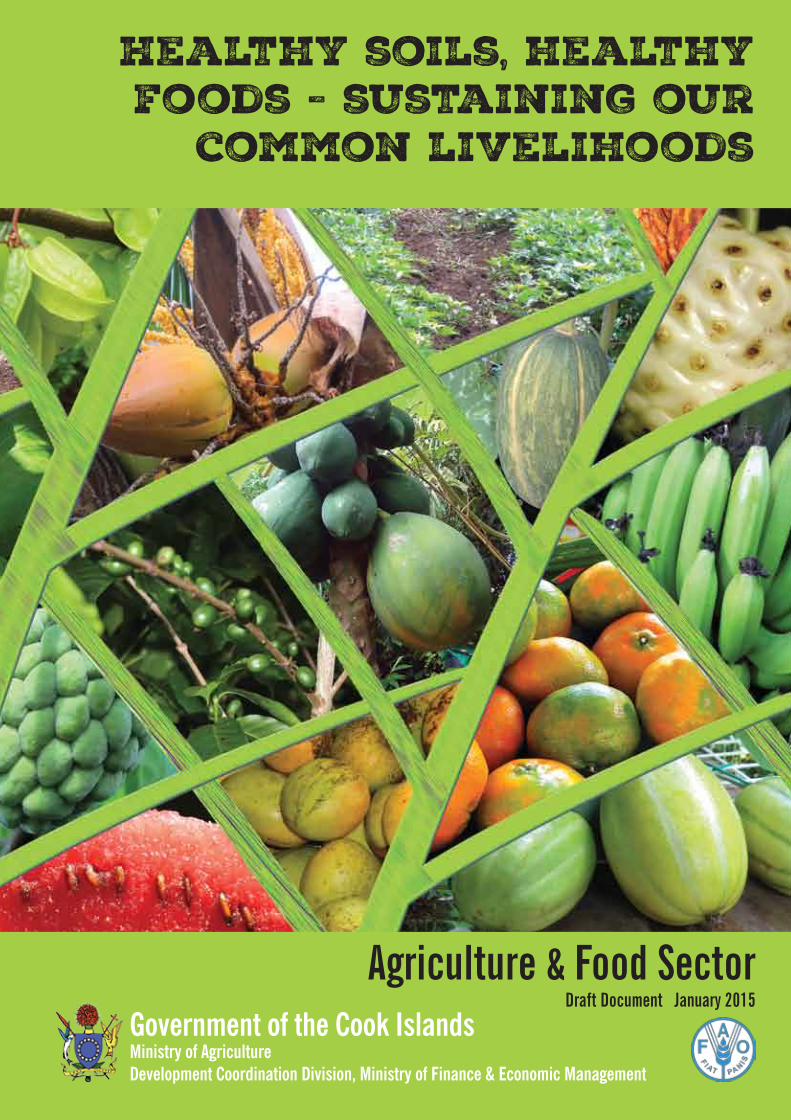
Healthy soils, healthy foods - sustaining our
common livelihoods
Agriculture & Food SectorDraft Document January 2015
Government of the Cook IslandsMinistry of AgricultureDevelopment Coordination Division, Ministry of Finance & Economic Management

DISCLAIMER
The Agricultural and Food sector in the Cook Islands has been extensively studied and various
documents suggesting ways to strengthen and develop the sector have been circulated over the years.
The present document’s intention is to compile essential baseline information from all these different
sources, and to confront it with the findings and suggestion from a participatory planning process
with the various stakeholders of the sector. It therefore draws heavily (i.e. when needed copies) on
these documents by summarizing the information available and cross‐referencing so that further data
on specific issues can be readily accessed.
The document was prepared at the request from the MOA and with the direct support of FAO and
the DCD/MFEM. It is based on the field work of an independent consultant. During the mission, the
consultant met with various private stakeholders (farmers and businesses) and would like to thank
all those would took the time either to answer or to attend and share their views during the various
mission events. Furthermore, the consultant would like to express his gratitude to the MOA, and
especially its PS, and the team of the DCD for their regular support; and patience in waiting for the
document; a special mention also for the statistics and customs team of the MFEM which compiled
all the recent trade data regarding the agricultural and food sector.
The findings of this report and the proposed after MDG Vision for the agricultural and food sector
are the Consultant’s Mission’s best possible analysis and recommendations. The document is a
contribution to the on‐going process and is open to comments and suggestions The views it contains
thus only represent the his own view and are in no way to be considered as representing either the
view of the Government of the Cook islands and of the FAO.

Cook Islands Agricultural & Food Sector ‐ After MDG Vision
Draft – January 2015
a
TABLE OF CONTENT
Disclaimer Table of content............................................................................................................................ a Major Acronyms ........................................................................................................................... c Executive summary ........................................................................................................................ i Introduction & Methodology ......................................................................................................... 1 1. Cook‐Islands’ agricultural sector rEVIEW ................................................................................. 5
1.1 Contribution to the Economy ................................................................................................................. 6 1.1.1 Contribution of the sector to GDP ..................................................................................................... 6 1.1.2 Contribution to the CKI’s trade .......................................................................................................... 6 1.1.3 Agricultural Activity, Holdings and Employment ............................................................................... 7
1.2 Overall productive performance ............................................................................................................ 9 1.2.1 Crops ...................................................................................................................... 9 1.2.2 Livestock .................................................................................................................... 11
2. Challenges and opportunities ............................................................................................... 13
2.1 Food security ........................................................................................................................................ 13 2.2 Market challenges and opportunities .................................................................................................. 14
2.2.1 Gradual decline of agricultural/food exports .................................................................................. 14 2.2.2 Import dependence and substitution .............................................................................................. 15 2.2.3 Fragmented value/marketing chains ............................................................................................... 17 2.2.4 Linkage and interaction with Hospitality sector .............................................................................. 18 2.2.5 The livestock sector .................................................................................................................... 19
2.3 Challenge of the Outer Islands ............................................................................................................. 21 2.4 Demography Paradigm ......................................................................................................................... 23 2.5. Labour Dynamics of the sector............................................................................................................ 24 Lack of contract/associative farming tradition.................................................................................................. 25 2.6 Land Use ............................................................................................................................................... 26 2.7 Capital & Business environment .......................................................................................................... 29 2.8 Health and NCD .................................................................................................................................... 31 2.9 Environment and climate change......................................................................................................... 32
2.9.1 Environmental impact 32 2.9.2 Climate change & cyclones .............................................................................................................. 33 2.9.3 Climate risk insurance 36
2.10 Agricultural water and management ................................................................................................... 37 2.11 Conclusions – AGRICULTURAL SECTOR IN AN AKARI .......................................................................... 41
3. Agriculture & Food strategic intent or after mdg vision .......................................................... 43
3.1 Strategic intent ..................................................................................................................................... 45 3.2 The four key elements of the strategic intent...................................................................................... 46
3.2.1 Healthy soils & Healthy foods .......................................................................................................... 46 3.2.2 Small and local & Sustaining the cook islanders livelihoods ........................................................... 49
3.3 Consistency of the After MDG Vision .................................................................................................. 58 3.3.1 Consistency with other major national policies .............................................................................. 58 3.3.2 Consistency with the recommendations of the previous FAO report ............................................. 60
3.4 Driving the Vision towards a Pragmatic Action Plan ............................................................................ 61 3.4.1 Initiating a sector council driven by the farmers and private –sector............................................. 61 3.4.2 Engaging in clustering and cluster building ..................................................................................... 63 3.4.3 Creating an enabling environment .................................................................................................. 63
Cook Islands Agricultural & Food Sector ‐ After MDG Vision
Draft – January 2015
b
4 From intent to operational sector plan ................................................................................. 64 4.1 Strategic objective 1 : ........................................................................................................................... 65 Agricultural production moves form high chemical inputs to agro‐ecological production modes ..... 65 4.2 Strategic objective 2 : .......................................................................................................................... 65 More efficient livestock activities for niche markets underpins the green value chain ...................... 65 4. 3 Strategic objective 3 : .......................................................................................................................... 65 Healthy food habits contribute to reduced NCD incidence ................................................................. 65 4.4 Strategic objective 4 : ........................................................................................................................... 66 Small and local geared agri‐ventures are commercial reality in the Cook Islands .............................. 66 4. 5 Strategic objective 5 : .......................................................................................................................... 66 The demography paradigm is addressed ............................................................................................. 66 4.6 Strategic objective 6: ............................................................................................................................ 66 The overall governance of the agricultural sector is sector driven...................................................... 66 4.7 Strategic objective 7: ........................................................................................................................... 67 The institutional framework is supportive of the agricultural sector development. .......................... 67
Technical appendixes – PLEASE REFER TO www.mfem.gov.ck FOR THE COMPLETE REPORT .... Error! Bookmark not defined. Appendix 1 Major agricultural figures ...................................................................................... 73 Appendix 2 National population census – 2011 – major Findings ............................................... 81 Appendix 3 agricultural census – 2011 – Major Findings ........................................................... 87 Appendix 4 Climate change – possible impacts ....................................................................... 105 Appendix 5 NSDP and Previous FAO mission recommendations .............................................. 107 Appendix 6 Value chain and supply chain concepts for the cKI ................................................ 111 Appendix 7 Food security and healthy food – NDC risks .......................................................... 117 Administrative appendixes ........................................................................................................ 125 Appendix 8 Mission’s terms of reference ............................................................................... 127 Appendix 9 four pillars discussed at round tables ................................................................... 129 Appendix 10 Mission Calendar and perrons met ................................................................... 135
Cook Islands Agricultural & Food Sector ‐ After MDG Vision
Draft – January 2015
c
MAJOR ACRONYMS
ARDA Adventist Development and Relief Agency
BCI Bank of the Cook Islands
BITB Business Trade Investment Board
BMI Body Mass Index
BTS Baker Tree Services
CC Chamber of Commerce
CI DE‐TF Cook Islands Disaster Emergency Trust Fund
CITC Cook Islands Trading Corporation
CITTI Cook Islands Tertiary Training Institute
CKI Cook Islands
DCD Development Coordination Division
DRFI Disaster Risk Financing and Insurance
EEZ Exclusive Economic Zone
ENSO El Nino Southern Oscillation
FAO Food and Agriculture Organisation
FAOSTAT Statistical data base of the Food and Agriculture Organisation
FTP Financial and Technical Partner
GAP Good Agricultural Practices
GDP Gross Domestic Product
GEF Global Environmental Fund
GFDRR Global Facility for Disaster Reduction and rceovery
HTFA High Temperature Forces Air
INTAFF Internal Affairs
IPCC Intergovernmental Panel for Climate Change
MOA Ministry of Agriculture
MFEM Ministry of Finance and Economic Management
mt Metric Tons
NCD Non Communicable Disease
NZAID New Zealand Aid
NZ$ New Zealand Dollar
PCRAFI Pacific Catastrophe Risk Assessment and Financing Initiative
PIC Pacific Island Countries
PGS Participative Guarantee System
PMO Prime Minister’s Office
RCC Recovery Coordinator and Committee
RTF Reserve Trust Fund
SME Small & Medium Enterprise
SPC Secretariat of the Pacific Council
STEPS WHO’s STEPwise chronic disease surveillance programme
TA Technical Assistance
TF Trust Fund
TGA Titikavaka Growers Association
VSA Volunteer Services Abroad (New Zealand)
UNDP United Nations’ Development Programme
US$ United States Dollar
WHO World Health Organisation
Cook Islands Agricultural & Food Sector ‐ After MDG Vision
Draft – January 2015
i
StrategicAgriculture&FoodSectorPlanCookIslands
EXECUTIVE SUMMARY
INTRODUCTION & METHODOLOGY
At the request of the Government of the Cook Islands the Food and Agriculture Organization (FAO)
fielded an initial policy scoping mission in March 2014. As a direct follow‐up to report’s
recommendation: “that a Food Policy Council, with assistance from other Financial and Technical
Partners (FTP), develop a new long‐term strategic plan and policy for the Cook Islands Ministry of
Agriculture (MOA)”, the MOA was mobilized to initiate thus process, with the support of FAO.
A second field mission by FAO was mobilized in November 2014 and its major objectives are to: (i)
collect and analyze necessary data to assist with policy and planning; and (ii) to assist the MPO in
conducting the consultations in order to draft a National Agriculture Sector Strategic Plan. After start‐
up, it soon became evident that a stepwise approach to developing the strategic sector plan would need to
be implemented. Four phases were thus envisaged to complete the preparation of the Sector Strategic
Plan: (i) phase one ‐ stakeholder consultations and designing an overall Vision or overall framework with
a number of priorities; (ii) phase two ‐ continued stakeholder buy‐in leading up to the Vth Development
Partners’ meeting in early February 2015; (iii) phase three ‐ revisiting the Vision and elaborating a short
and medium term action plan in time for the coming 2015/2016 budget planning; and (iv) phase four ‐
official endorsement by all stakeholders of the Vision and abovementioned action plan and official
launching of the various councils/clusters and actions envisaged in this plan.
The second FAO field mission thus focused on completing the first phase. Work combined: (i) completion
of data and background documentation gathering; and (ii) a participatory planning process alternating
individual meetings with public and private stakeholders, various field visits, round tables open to all
stakeholders and advertised in the presses, two ‘food’ task force meetings and one open forum where a
preliminary Vision was presented and debated.
After the field mission, the present report was completed. The document tries to reflect as honestly as
possible the views and suggestions received. It remains thus an open scoping and working paper.
1. COOK‐ISLANDS’ AGRICULTURAL SECTOR REVIEW
The Cook Islands (CKI) consists of 15 islands in free association with New Zealand. The climate is a
typical tropical climate with two distinct seasons and an average rainfall between 2,000 and 3,000 mm
per year. Rarotonga is also the only island that has an abundant water supply. The other islands,
particularly the atolls in the northern group suffer from water loss, thus agriculture is limited. Most of
the available good agricultural land is located in the Southern group of Islands and it is therefore not
Cook Islands Agricultural & Food Sector ‐ After MDG Vision
Draft – January 2015
ii
surprising that these islands have traditionally supplied various agricultural products to the capital
islands and to the once buoyant fruit export markets of the CKI.
Land availability, limited water resources and inter‐island communications & transport logistics are
major determinants which directly impact the agricultural sector in the CKI.
1.1 ContributiontotheEconomy
The gradual market liberalization of the agricultural sector (beginning the 1980’s) has led to a steady
decline of the competitiveness of Cook Islands products in export markets, which were heavily dependent
on trading networks with New Zealand. The loss of these export markets has significantly contributed to
the overall reduction and stagnation of the contribution of the agricultural sector to the CKI’s GDP
which has now reached a mere 2%.
Imports have consistently outstripped the exports in and from the CKI. Since the turn of the millennium,
total imports have increased by over 32%, to reach a total of 110 million US$ for 2011. Exports however
have witnessed an important decrease over the same period, dropping to around 3.2 million US$ in 2011.
The share of food imports remains at around 20‐25% of total imports, whilst exports have significantly
dropped.
According to the 2011 agricultural census, out of the 2334 households (HH) that took part in the census:
(i) 1275 HH declared to be active in agriculture either as subsistence type agricultural (67.5%) or as
geared primarily geared at sales (32.5%); and (ii) 1061 HH declared to be keeping livestock either for
subsistence (68.6%) or for sale (31.4%).
A major characteristic of the agricultural sector in the CKI is thus that the sector is essentially a part‐
time and‐or subsistence driven one (± 875 HHs); whilst those that are engaged in agriculture for sales
represent more or less 400 HH. When further zooming in on this latter group of HHs, the number of
effective commercial actors has dropped from 153 to 311 between 2006 and 2011, suggesting that a
significant move from commercial farming to subsistence with cash.
1.2 Overallproductiveperformance
Crops
The 2011 agricultural census identifies 2028.8 acres (±820 ha) as agricultural land of which only 1233.7
acres (± 500 ha) are at present under crops, leaving more than 795.1 acres (± 320 ha) fallow or under
bush. In 2011, tree crops accounted for the major soil occupation (880 acres or 356 ha) followed by root
crops (270 acres or 109 ha) and vegetables (71 acres or 29 ha). However trees planted as orchards only
account for 261 acres (101 ha), whereas coconut trees (mostly scattered or individual trees) account for
397 acres (161 ha).
In 2012, crop farming in the CKI produced an estimated total of 7 971 metric tonnes of produce
(excluding figures for Noni production) of which 1 329 mt of tropical fruits (of which 64% are grown in
orchards), 1 820 mt of coconuts, 1 672 mt of various vegetables and 3 150mt of root crops.
1 Out of the 27 farmers that declare deriving all their income from farming, 19 are on Rarotonga, 6 in Atiutaki and 2 in
Mauke.

Cook Islands Agricultural & Food Sector ‐ After MDG Vision
Draft – January 2015
iii
Livestock
The 2011 agricultural census confirms the predominance of the pork, poultry and goat production
livestock sub‐sectors as already evidenced in previous censuses. In 2011, a total of ± 14 000 pigs, ± 4 400
goats and ± 34 000 chicken were reported. Indigenous species 2 or low productive species seem to
predominate.
When assessing numbers of HH and numbers of stock, major production areas of pork and goats are
concentrated on the other Southern Islands and to a lesser degree on Rarotonga. Goats are absent from the
Northern Islands.
Disposal of animals is low. According to the 2011 agricultural census, only 20% of total numbers are
disposed of, of which 76% were slaughtered3. Sales of slaughtered animals remain the exception (±
10%). The informal market (household direct consumption and gifts) seems to absorb the majority of the
slaughtered animals.
In addition to the meat sales, one important sub‐sector for poultry is the egg sub‐sector. The latter is
predominantly established on the Rarotonga Island and streamlined around one major egg producer and a
limited number of smaller operators. Imports of eggs have been increasing over the past years as and since
2014 imports tariff on eggs have been discontinued.
2. CHALLENGES AND OPPORTUNITIES
2.1 Foodsecurity
Food security is more than just ensuring that sufficient food is
available so that nobody is underfed.
The CKI ensure an average diet of 3185 Kcal/day, of which
83.4% is imported. Local food availability has been declining
from 250 US$ per person to 114 US$ (and even less if tourists
figures are taken into account). Stability of the food security has
been gradually eroded as this index now reaches 5.4 times the
value of the country’s exports.
2.2 Marketchallengesandopportunities
Marketing of agricultural products and food is confronted to:
Gradual decline of agricultural/food exports ‐ Over the last decade these exports have
represented a total average quantity of 283 metric tonnes, decreasing from 594 tonnes in 2005 to
136 in 2011; value wise these exports represent on average an income of 1.23 Million NZ$,
decreasing from 2.3 million NZ$ to around 564 thousand NZ$ in 2011. In 2011, fruits (Noni)
juices were the only significant remaining agricultural export, amounting to 531 thousand NZ$.4
2 No detailed study of the breeds (importance, performances and improved husbandry techniques) present in the various CKI
seems to have been conducted and the potential to improve these three important sub‐sectors remains to be verified. 3 Most of these slaughters are performed at HH or farm level; the small pig/sheep/goat abattoir is no more operational. 4 + An estimated yearly small export of 50 000 NZ$ of Maire leaves.
Moreover, high profits and rents earned
on large import operations typically
become embedded, and so constitute a
strong deterrent to the eventual (re‐
)establishment of local production
operations.
Milford Bateman (2010)
Cook Islands Agricultural & Food Sector ‐ After MDG Vision
Draft – January 2015
iv
Import dependence and substitution ‐ The Cook Islands major agricultural imports as identified
in the import statistics provided by the Customs department of MFEM are by order of importance:
(i) meat products (inclusive of poultry and offal) ; (ii) other livestock products (dairy, eggs, …);
(iii) cereals and vegetables (inclusive of potatoes); (iv) refined sugar; (v) fruits (inclusive of melons)
and oil/fats. According to the customs statistics, average imports of agricultural products and foods
have been around 16.3 million NZ$ (2005‐2013) have been around NZ$. Import substitution
opportunities, import however limited to those that are locally amount over the same decade to
livestock products (3.6 million NZ$) followed by vegetables (1.1 million NZ$) and tropical fruits
(0.13 million NZ$).
Fragmented value/marketing chains ‐ Local markets for agricultural products and food remain
very fragmented. There are few major producers (31 ‘commercial farmers’ and no significant
livestock commercial farmers with the exception of the egg sub‐sector) and most of the agricultural
activity is part‐time on small plots < 2 acres, with low crop volumes and low consistency over time.
The only value added exported agricultural crop is noni juice. Some limited local value adding
exists such as papaya juice/nectar production (Hugh Baker, Raro‐Pacific), chilli and tomato pastes
(Blue Pacific/Trader Jack) and the odd fresh smoothies, juices, salads available at the Punauga Nui
market. There are no middle men that operate as links between retail and the producers. The retail
sector is dominated by one major local supermarket chain.
Linkage and interaction with Hospitality sector ‐ Tourism remains the largest industry in the
Cook Islands, accounting for around 60 per cent of the
economy. Arrivals have soared over the past years to reach
well over 120 000 annual visitors. Interestingly, almost an
equal number of tourists cite their food and beverage
experience as the least appealing aspect of their say (12 per
cent) as those that cite it has the most appealing (11 percent).
The ‘food’ or ‘cuisine’ experience is however an important
marketing theme of the Cook Islands Tourism Council and Board. It is therefore essential to ensure
as far as possible that this ‘food‐cuisine’ experience draws on local products and food traditions.
The food hospitality (i.e. hotels, restaurants, cafes) sector is a significant consumer of local fresh
produce. The previous FAO report suggests that for vegetables approximately 192 tonnes of
selected vegetables are required, at a value of over NZ$ 765 thousand; and that for fruits there is
demand for 294 tonnes of fruit valued at around NZ$ 867 thousand, every year.
Whilst some of the hotel/resorts have established preferred supplier arrangements and do provide
limited forward indication of their produce demand, formal contracts are not the norm. A
consequence of these uncoordinated supply chains for local farmers’ produce has been summed up
by the food hospitality sector as a situation of ‘feast or famine’.
The livestock sector ‐ Direct competition from other Pacific countries reducing viable commercial
options seems to have justified the gradual decline and abandonment of this important import
Welcome to the paradise of
the Cook Islands.
Dare to experience the unique
culture, food, and lifestyles
http://instagram.com/cookislands

Cook Islands Agricultural & Food Sector ‐ After MDG Vision
Draft – January 2015
v
substitution opportunity; and the recent discontinuation of the protective import tariffs5. Other
major reasons for this situation are: (i) the cost of imported animal feed and the little use of local
available or produced feed; (ii) breeds (mostly indigenous) and the present production and animal
husbandry techniques (open air and wandering) are viewed as presenting a major health
/consumption hazard; (iii) the environmental concerns regarding animal wastes and production
conditions; and (iv) the lack of appropriate local value adding ventures, as small local butchering
and pork workshops operating in the early 2000 and the existing abattoir have closed down.
Nevertheless, there is scope to try and regain some market shares for livestock ‘quality’ or ‘local
labelled’ products.
2.3 Otherissueschallengingproduction
In addition to the above‐mentioned markets weaknesses and constraints Challenge, the agriculture and
food sector faces a number of other major challenges:
The present contribution of the outer islands to the agricultural/food sector is limited by a
number of major constraints which represent the major challenges: (i) Transport and
communications links are semi‐regular; and (ii) Present inadequate capturing of island specific
Tourist developments have increased the demand of food which in part is provided locally.
The CKI’s Demography Paradigm – 74% of the population is concentrated on the Rarotonga
Island. The age pyramid of the 2011 population and housing census reflects an important
indent in the 15–29 year age groups, showing a sign of outward‐migration at the young
ages. More than 70% of ‘farmers’ are over 40 years in age. Strong urbanization (more than
70%) has major implications in regards to the food consumption and overall quality of life.
Labour Dynamics of the sector ‐ According to the 2011 agricultural census a total of 1661
people are working in the agricultural sector, of which 365 are women. This represents 1.30
labour force per agriculture active household. The sector employs some 66 paid labour (of
which 14 women). Paid labour is expensive as the minimum wage is set at NZ$ 6 per day
and the commercial/part‐time ‘selling’ farmers are thus the ones confronted with these high
labour costs and requesting more flexible conditions to mobilize temporary overseas labour.
The major constraint facing the agricultural sector is that most young people are escaping
agriculture, preferring other employments or migration. They do not view it as an ‘innovative”,
“actual” and interesting income generating activity.
Lack of contract/associative farming tradition ‐ Cook Islands experience with farmers’
associations is rather limited and needs to be revisited. There have been a number of village level
associations which were basically set‐up on a demand driven approach, i.e. to access equipments
(tractors, …) or specific services (inputs, seeds, …). Most are not business driven and are
5 Other pacific islands maintain high levels of protection of their national livestock productions. For example Fiji maintains a
32% duty on most livestock products. It is thus ironical that an important share of the “duty free” imported eggs in 2014
originates from the “duty” protected Fiji.
Cook Islands Agricultural & Food Sector ‐ After MDG Vision
Draft – January 2015
vi
ineffective in developing common development plans or promoting grouped contract farming
arrangements with the hospitality sector or SME value‐adding businesses.
Land Use ‐ Land used for agricultural purposes has been on the decline on all the major
agricultural islands (Rarotonga, Atuitaki, Mangaia, Atiu, Muake and Mitiaro) since 1988. Total
figures have shrunk from 6934 acres in 19886 to 2029 acres in 201122. Two major factors
contribute to this: (i) the continual and gradual decrease of the performance of the agricultural
sector; and (ii) the increased competition for land on Rarotonga from the tourism sector and
housing sectors. According to the 2011 agricultural census, only 7 % of the land area used for farming is under freehold lease or license. An estimated 65 % of the land being used by
commercial farmers is borrowed or customary, with the largest portion being borrowed.
Capital & Business environment ‐ The previous FAO report describes this sector in more
detail. Its review covers : (i) loans and interst rates (on the one hand high rate of interest charged
on loans to the agriculture sector; & on the other the existance of the special finacncail window at
Bank of Cook Islands (BCI), in partnership with the Business Trade Investment Board (BTIB)
for small and low interets loans for the sector); (ii) the importance of providing adequate market
information tools and of providing technical support and business mentoring services 7 on
business planning and modern farming methods; and (iii) the need to reduce the tax burden on
the primary sector in order to encourage a higher level of investment (making capital asset
investments 100% depreciable over 2‐3 years, tax holidays for specific agribusinesses, and an
eventual dual rate VAT system, …)
Health and Non Communicable Diseases (NCD) – NCDs represent a growing burden in the
Cook Islands which subsequently challenges its healthcare system and resources (infrastructure,
human, laboratory and pharmacy.) There are 3 725 patients currently registered in the Ministry
of Health’s NCD registry. Even if food is not the only cause of the NCD crisis, it remains a
crucial contributor, as unhealthy diets directly challenge the vision of what food and which
agriculture is to be pursued in the CKI. Healthy diets and quality of life depends directly on the
production of locally available quality food products made from healthy farm products.
Environment and climate change ‐ The agricultural sector in the CKI operates in a sensitive
environmental environment and will need to prepare to cope with the longer‐term effects of
climate changes. At present the prevailing monoculture/plantation type agricultural system is a
high input driven model which has major impacts on the environment and is directly impacted by
the on‐going climate changes. On average these imports of fertilizers and chemicals represent an
average total value of 670 thousand NZ$ per year (since 2005) or 285 thousand NZ$ in fertilisers
and 385 thousand NZ$ in various agri‐chemicals.
Since 1955 the Cook Islands has experienced a total of 38 natural disasters (of which 34 cyclones)
which have resulted in 34 deaths and cost in the region of US$ 47.6 million, equivalent to
6 Including 1429 acres fallow in 1988 and 795 acres fallow or under bush in 2011. 7 The Chamber of Commerce (CC) is currently implementing a business mentoring programme (with support from New
Zealand) and would be keen to see this extended to the agriculture sector

Cook Islands Agricultural & Food Sector ‐ After MDG Vision
Draft – January 2015
vii
approximately NZ$ 65.4 million8. In May 2011 the Cook Islands Disaster Emergency Trust
Fund (CI DE‐TF) was established; and joined the Pacific Catastrophe Risk Insurance Pilot in
2013. In order to provide greater security to investment in capital equipment, the government of
Cook Islands should investigate the feasbility of establishing a public‐private agricultural
insurance facility.
Agricultural water and management ‐ Agriculture is estimated to be the largest single sector
user of water on Rarotonga with approximately 40% of overall water usage on the island. Crops
are exposed to regular dry spells. Surface water catchment facilities exist but need to be
rehabiliated or developed in order to intercept rain water and store it or infiltrate it as much as
possible. Appropriate water sources should also be explored for the provision of water,
particularly on Rarotonga where treated, reticulated water may be more costly. Improved water
management techniques (drip and farming systmes that favour consistent crop coverage of the
soil together with mulching and use of compost) need to be developed and extended to farmers.
A national water policy is under preparation and is articulated around 9 objectives, of which the
three following are directly related to agricultural activities: (i) Reliable, potable water for all
who reside in the Cook Islands and the establishment of standards for water quality and resource
management; (ii) sustainable management of both inland and coastal water resources; and (iii)
Equitable systems for controlling demand and appropriate usage
3. AGRICULTURE & FOOD STRATEGIC INTENT OR AFTER MDG VISION
To turn the sector round, it is important that all stakeholders (private and public stakeholders) agree on
three major prerequisites:
The first, which is conceptual, is that the agricultural sector is a little more complex than just
production. Agriculture is more than just an economic earning sector producing primary
inputs for others. It is a sector where many other societal elements play major roles or interact.
It concerns food, it concerns sustainable natural resources management and it concerns quality of
island life. It requires a wide approach whereby other stakeholders need to come on board and
interact with the farming community and the Ministry of Agriculture.
The second that will be developed in the subsequent sections is that one needs to know and agree
on what is expected from and for this important sector; or in other words “What agriculture
does Cook Islands want?”. Before developing more detailed actions plans, policy frameworks
and combining it all into a sectoral development plan, all stakeholders need to come together on a
strategic intent, in a similar way as the tourism sector has done.
The third derives from the simple finding that this is not the first attempt at revitalizing the
sector. Several other missions and reports have suggested different ways forward. But the major
problem remain: (i) real and pragmatic commitment to support the sector’s turn around by all
stakeholders; and (ii) who will be in the driver’s seat to impulse and mentor the
implementation of the Vision.
8 In 2005 in the 2 months February and March, cyclones Meena, Nancy, Olaf, Percy, and Rae swept the country. Four of
these cyclones reached the maximum category five rating causing massive damage to infrastructure and agriculture
(Cyclone Recovery Committee 2006).
Cook Islands Agricultural & Food Sector ‐ After MDG Vision
Draft – January 2015
viii
3.1 Strategicintent
The after MDG vision statement will focus on turning the sector round from a high‐level chemical inputs
farming system9 and struggling against imported foods towards ‘agro‐ecological’ driven farming systems
geared mainly towards regaining the local markets and engaging with the future generations.
It is composed of four short but strong statements:
Healthy Soils
Healthy Foods
Local and appropriate
Sustaining our common livelihoods
It is also reflects the overall commitments made by the Cook Islands in its various environmental and
climate change programmes towards implementing ‘sustainable agriculture’.
3.2 Thefourkeyelementsofthestrategicintent
To implement the four key elements of the strategic intent or vision, a number of new approaches or major
issues will need to guide the various objectives and activities that will form part of the future sector action
plan(s).
Healthysoils&Healthyfoods
Healthy soils and healthy foods are two key elements of the Vision that go hand in hand. They both imply
greater care to the way in which food is produced and processed. The starting point however lies in
addressing the soils and the farming techniques. Usage of high rates of chemicals and fertilizers need to be
brought under control and radically reduced, if not banned.
Agro‐ecological farming practices and systems need to be pursued in the CKI with determination, as a
major approach to fulfil the country’s commitment in the Reef to Ridge GEF programme of “sustainably
managing its productive landscape”.
Agro‐ecology is an integrated approach whereby more attention is paid to diversified cropping systems
and‐or integrated crops‐livestock systems. More extension and adaptive research focused on developing
and promoting such approaches will need to be part of the Vision.
CKI has already started with activities that have contributed to the awareness raising of the existing soil
conditions and the possibilities of integrated pest management through soil schools and farmers’ field
schools. In Titikaveka the TGA has been engaged since a couple of years, in composting of green waste
from the Muri area. In Arorangi, Baker Tree Services (BTS) produces basic shredded mulch from its own
green waste which farmers collect for mulching their fields.
The major challenge of the agricultural producers will be to negotiate this 180° turn around. Specific
mixes of crops, intercropping and rotations, combined agro‐forestry and composting techniques (and
formulas) all need to be developed and extended. Improving soil health and quality will imply overall
improvements in soil coverage (mulching) which in turn will lead to improved water management and if
9 Based essentially on ‘monoculture’ plantations
Cook Islands Agricultural & Food Sector ‐ After MDG Vision
Draft – January 2015
ix
drip irrigation and other modern shading techniques (shade‐houses,…) are promoted will further improve
the effectiveness of these modern and more costly techniques.
Agro‐ecology is a knowledge intensive farming approach, as it implies constant observation and
interactions with networks of other practitioners.
Local organic farming trials are on‐going on some individual farms, but still need mentoring and
observation in order to contribute significantly to this turn around. All these initiatives require support;
continued coaching and the development (and agreement) on a number of crop standards and‐or Good
Agricultural Practices (GAP). These in turn should enable both producers (commercial or part‐time
farmers) to eventually receive a “differentiated” price for their crop according to their GAP or standard;
and consumers to be able to access and buy produce that they ‘can trust’. To develop these standards will
require stakeholders to come together and engage in a Participatory Guarantee System’s (PGS) approach.
Supporting the emergence of an agro‐ecological farming model, will need to proceed hand in hand with a
more effective implementation of the chemical act and with water quality standards (and levels of
polluting agents in rivers, sources, water tables and marine areas), when they will have been defined in
the national water strategy. This will require a transitional period during which restrictions will need to
be gradually introduced in addition to a number of front‐up bans (especially in the field of some agri‐
chemicals).
Ensuring Healthy foods implies in addition to the standard food safety procedures in relation to
collecting, processing, preparing and distributing food products and the definition of the abovementioned
GAP or crop standards, the promotion of healthy diets and eating habits. This will require working on:
Promoting specific NCD less risky diets and conducting joint campaigns on healthy foods and
NCD avoidance together with a number of civil society associations.
Reintroducing a number of traditional crops/livestock breads in the framing systems.
‘Extending’ agricultural extension to small ‘hobby’ or ‘household’ gardeners.
‘Extending’ agricultural extension to schools
Smallandlocal&Sustainingthecookislanderslivelihoods
Ensuring that the engagement with healthy soils and healthy food is sustained in the long‐run requires a
concomitant engagement to fulfil the second part of country’s commitment in the Reef to Ridge GEF
programme of “taking into account food security and livelihoods”. This further widens the group of
stakeholders, as it involves the ‘what to do with the agro‐ecological products’ and ‘the longer‐term
sustainability’ of the entire sector and this in turn points back to its interrelations with its surroundings
(both physical and cultural).
Present agricultural markets’ fragmentation needs to be addressed and the prevailing “wait and see
attitude” between producers and consumers/buyers changed. Both sides are partners to common value or
supply chains; this is a simple concept acknowledged by all; but it is only when effective groups or
clusters within these chains come together to develop common win‐win operations, that sufficient impulse
can be given to ensure consistency in supplies (both quantity and quality); but also sustained and fair
revenues to producers.

Cook Islands Agricultural & Food Sector ‐ After MDG Vision
Draft – January 2015
x
The level of organisation of such clustering needs to be driven from local to top, i.e. by in initiating a
number of small groups/clusters around either one crop or one supply (contract) and in due time
federating local cluster initiatives to develop and share a number of services. Top‐down clustering does
often not work, as it then becomes similar to the ‘opportunity’ associations that come together to benefit
from an equipment or instant market opportunity.
In line with the healthy soil and healthy food approach, there are at present three possible major lines of
value‐supply chain promotion in the CKI:
1. The ‘rapid commercial’ clusters – which are driven directly as supply chains through contract
agreements combined with co‐investment build up, or through direct coaching or providing
mentoring services, or through specific other investments between a number of local producers and
one or several buyers (hospitality and‐or retailers).
There are at present in the CKI a number of pilot operations, such as the operational framework
between TGA and Pacific Resorts or the recently started operational framework between the Atiutaki
Fruit farm, Air Rarotonga Atiutaki one day tour and the Manea Nui Plantations in Rarotonga.
2. The ‘slow health‐green’ clusters – which would aim at facilitating short circuit deliveries and
focus more on promoting ‘healthy foods‐diets’ within the local communities and residents. This
approach would need to be implemented gradually as it first needs to build trust relationships and
traditional/improved diets/cuisine using existing or traditional crops (vegetables, roots, fruits, fish,
livestock etc) will need to de identify and redesigned. It can be implemented either through one
producer for a group of consumers.
In CKI, adapting such a model might be an interesting way forward to strengthen a number of part‐
time farmers (subsistence selling part of their crop). Various initiatives exist elsewhere and are often
referred to as ‘home vegetable/fruit boxes or baskets’; most of these short circuits initiatives originate
from the 1960 Teikei groups in Japan.
3. The value adding clusters ‐ which are more process oriented and require incorporating more
complex procedures as the end product is a processed quality food (that has a significant shelf live)
and not so much a fresh primary product that will be consumed rapidly. These clusters are usually
difficult to set‐up. In view of the few existing overseas’ markets for value added products, in the
short term, thinking local market and local hospitality sector might be a strong starting point.
Value adding clusters may of course combine a number of operations, as the papaya value/tropical
fruits chain or the livestock sectors can illustrate. CKI papaya have for years been primarily either
consumed locally with little local processing or exported mainly to New Zealand. Turned away crop
has at present but little alternatives to a differentiated price (value added juice or jams or
chutneys…) and the local ’export’ market (the hospitality sector) is not seen as the major ‘export
market’ by the various actors and thus undersupplied by local crops. Papaya remains a major CKI
crop and it would need to come together as a value chain, and not just as a producers cum exporters
chain and gradually develop and offer other options to the papaya crop in the CKI.
In the livestock sector clusters would however need to be based on a quality product (small piglets,
special hams, cuts, …) and‐or a specific local production technique (appropriate use of local feeds and
husbandry). These clusters would have to address in addition the selection (and improvement) of
local breeds, the support to ensure proper animal health support services. One way forward would be
to take example on the poultry and egg sector in Fiji, where one of the major producers, operates with

Cook Islands Agricultural & Food Sector ‐ After MDG Vision
Draft – January 2015
xi
a number of smaller out‐growers. Establishing a cluster run (or cluster shared) hatching facility,
which requires adequate technological skills, could serve as an incentive to a number of out‐growers,
members of the cluster and the group in turn could market together either the eggs or live animals,
and gradually move further up the value chain, to prepare or market specific CKI products. This
could be repeated in due time with the pork or goats sectors.
CKI needs to give support to this clustering of agricultural/food sector by initiating specific support tools
(TA for establishment, mentoring and coaching during the various stages of cluster development, specific
financial/macro‐economic packages to accompany the scaling up phase of a number of selected ‘viable’
priority clusters, close monitoring and the provision of wider framework kind support such as combined
involvement of health/tertiary education/agriculture/civil society/tourism council in accompanying the
development of these clusters)
Sustaining common livelihoods will be a direct consequence of the above small and appropriate clustering
endeavours, but it will also need to draw on a series of mutual reinforcing initiatives:
By resolutely opting for a 180° turn in farming practices and focusing more on agro‐ecologically
sound farming techniques, the various clusters will have to be open and engage with for the various
environmental programmes and projects planned and on‐going in the CKI. This will in turn require
a 180° turn from the various environmental agencies that have a tendency to consider agriculture as
a damaging activity and not as a sector that can provide environmental services in addition and in
combination with environmentally friendly productive activities. Sustainable agriculture is often a
major theme in these various projects and can be effectively implemented if small grants from these
various programmes can be mobilised to support combined actions and appropriate mitigation plans
(inclusive of improved soil & water management) developed together with the clusters.
Trying to address the demographic paradigm through cluster specific private‐public partnerships.
These specific PPP could build on the present tertiary education/ apprenticeship framework being
implemented by the Government through the Cook Islands Tertiary Training Institute. This
apprenticeship programme could eventually include a special funding window for special agro‐
apprenticeship agreements with a specific cluster. These cluster‐agreements would concern a number
of part‐time employees or young unemployed that would have an apprenticeship type contract with
the lead partner of a cluster. The apprenticeship contract would include part‐time service work
(direct income earner) and part‐time farming activities.
3.3 ConsistencyoftheAfterMDGVision
Consistencywithothermajornationalpolicies
The after MDG vision for the agriculture/food with its four major focus areas is consistent with this
national vision or the National Sustainable Development Plan (NSDP). The MDG vision for the
agriculture sector is however defined as larger than just being a part of the National Goal One ‘A vibrant
CKI economy’. The MDG vision sees the sector as a crossroads or cross‐cutting sector where production
of food, local economy, livelihoods, health and diets, education, management of natural resources all
interact.

Cook Islands Agricultural & Food Sector ‐ After MDG Vision
Draft – January 2015
xii
During the preparation of the after MDG Vision for the agricultural/sector, a number of other policies
and sector plans were still in their own process of discussion and finalisation: (i) the outer islands
devolution policy and the various outer island development plans and agricultural opportunities; (ii) the
NCD policy; (iii) the Education policy and more particularly its apprenticeship and tertiary education
elements; (iv) the labour policy; and (v) the land use policy.
ConsistencywiththerecommendationsofthepreviousFAOreport
The previous FAO mission’s report made 16 practical/general recommendations under three overarching
objectives: (i) facilitating increased investment in the adoption of more efficient farming; (ii) improved
marketing and market information capacity; and (iii) improved co‐ordination of policy and regulatory
framework. The major drive behind the report was to facilitate investment in the sector and to highlight a
number of policy or macro‐economic framework issues that needed addressing.
Healthy foods and the need to focus more on quality and agro‐ecological farming are not addressed as
such, but are clearly underpinning the overall thrust of the previous FAO document. Most
recommendations do in fact pertain to the overall business and investment environment facilitation. They
are in fact relating more to the “how of things” than to “what things need to be encouraged” and will
need to be addressed when preparing the detailed 2015‐2020 action plan.
3.4 DrivingtheVisiontowardsaPragmaticActionPlan
During the various discussions, face to face interviews and round tables conducted during the November
2014 field work, a major and recurrent concern of all has been “who will be the driver” or as a previous
box concludes “Agriculture needs a ‘champion’ a leader, is there anyone waiting in the wings?”.
The previous FAO report suggested the establishments of a Food Policy Council in order to help achieve
the implementation of policy and regulatory reforms required to achieve improved food security. It was
envisaged to attach this high level, multi‐sector (public and private sector stakeholders) statutory body
within the NSDC at the Prime Minsiter’s Office.
In order to emphasize even more that the sector is essentially a sector fully driven in last resort by the
private sector, with the public sector providing services to facilitate and support the sector, it might be
worth reconsidering the establishment of a Food Policy Council and prefer instead a model comparable in
its concept to the one operating for the tourism and hospitality, sector, where there is a Tourism Council
which drives the sector, which is in turn supported by a specialized board.
The sector needs first to be technically re‐oriented and marketing/value/supply chain cluster groups
initiated. This will require consultations between potential partners and groups, development of ad‐hoc
strategic partnerships and initiating a number of basic services that will be beneficial to the sector as a
whole (intelligence, but also knowledge networking and sharing, grouped access to ‘new’ inputs, etc).
Policies and regulatory frameworks are of course part of this effort, but they need to be responsive to the
sector and it is therefore proposed in the after MDG vision that an independent private sector driven
council be set up. This might equally be a way to bring people of different political backgrounds
(Rarotonga and outer islands, majority and opposition) to work together on long‐term sector defined
priorities.

Cook Islands Agricultural & Food Sector ‐ After MDG Vision
Draft – January 2015
xiii
Initiatingasectorcouncildrivenbythefarmersandprivate–sector
It is suggested that this council be gradually established during the coming two or three years. Before
formalising a council, it is suggested to spin the council off as a special task force within the Chamber of
Commerce. Within this informal task force, a number of thematic groups would be gradually set up to
investigate and prepare a number of concrete actions that will mobilize sufficient and dedicated partners
to drive these actions through. The motto is “to grow gradually (walk before running)” and to be
“professional” in preparing and documenting proposals, suggestions and actions.
Engaginginclusteringandclusterbuilding
A specific thematic group of the sector council will need to engage in supporting the emergence of a
number of specialise clusters: i) to start at least 2 to 3 ‘rapid economic ‘clusters driven by a major supply
contract or specific technical activity such as composting; ii) to establish at least one livestock focused
cluster; iii) establishing one or two small ‘slow green’ cluster or short circuit test groups together with
the NCD group within the MOH; iv) examine how to consolidate the existing commodity value chains
(Noni, papaya products) and v) support a strategic small scale women in business partnership to support
short circuit simple value adding activities.
Cluster development would proceed stepwise, after each step is reviewed by an internal mentoring group:
(i) cluster establishment (sensitisation, group formation and initial activity planning); (ii) technical
design of the cluster package with the various partners and business plan development (inclusive
wherever possible of ad‐hoc environmental mitigation plans); (iii) after approval of support,
implementation of the first business plan with constant coaching and business and technical mentoring;
and (iv) on‐going monitoring and development of subsequent activity plans and monitoring of business
development.
4 FROM INTENT TO OPERATIONAL SECTOR PLAN
An operational sector action plan will be developed with the various stakeholders during the second
quarter of 2015 after the 50 year CKI celebrations and the partner meeting planned in February 2015. An
indicative template for this plan is presented in the report to serve as general guideline when developing
this more detailed plan. It is articulated around 5 ‘productive’ strategic objectives and 2 more ‘structural’
strategic objectives:
(i) Agricultural production moves form high chemical inputs to agro‐ecological production
modes;
(ii) More efficient livestock activities for niche markets underpins the green value chain;
(iii) Healthy food habits contribute to reduced NCD incidence;
(iv) Small and local geared agri‐ventures are commercial reality in the Cook Islands;
(v) The demography paradigm is addressed;
(vi) The overall governance of the agricultural sector is sector driven;
(vii) The institutional framework is supportive of the agricultural sector development.
Cook Islands Agricultural & Food Sector ‐ After MDG Vision
Draft – January 2015
1
StrategicAgriculture&FoodSectorPlanCookIslands
INTRODUCTION & METHODOLOGY
At the request of the Government of the Cook Islands the Food and Agriculture Organization
(FAO) fielded an initial policy scoping mission in March 2014. The subsequent report issued in
May 2014 ‘Linking farmers to markets: Realizing opportunities for locally produced food on
domestic and tourist markets in Cook Islands’ identified a number of core thematic: (i) land; (ii)
labour; (ii) capital; (iv) fragmentation or markets and lack of information; vi) streamlining a
local ‘cuisine experience’& enhancing synergies with health; vii) a number of framework issues
such as tariffs and taxes, water, inputs; and (viii) lack of strategic planning and of institutional
support. It made 16 recommendations (see in section 3.3.2 and Appendix 5) which indicate a
number of policy levels that would need to be implemented. It is essentially focused on
improving the business and investment environment to revitalize agricultural production.
As a direct follow‐up to the recommendation: “that a Food Policy Council, with assistance from
other Financial and Technical Partners (FTP), develop a new long‐term strategic plan and policy
for the Cook Islands Ministry of Agriculture (MOA)”, the MOA was mobilized to initiate thus
process, with the support of FAO.
A second field mission by FAO was mobilized in November 2014, see terms of reference in
Appendix 8. The overall approach adopted for this mission was to build on a findings and
recommendations of the first FAO mission and to engage in wide consultations with all
stakeholders involved in the agricultural and food sector and; in order to try and come to an
overall consensus on a vision before developing a detailed strategic sector plan.
After start‐up discussions with the PS of MOA, the planning department of the Prime Minister’s
Office (PMO) and the Development Coordination Division (DCD), it soon became evident that
the a stepwise approach to developing the strategic sector plan would need to be implemented,
bearing in mind the deadlines of the next budget presentation, the planning of the last step
(2015‐2020) of the National Sustainable Development Plan and the Vth Development Partners’
meeting.
Four phases (see graphs on following page) were envisaged:
Phase one Stakeholder consultations and designing an overall Vision or overall
framework with a number of priorities
Phase two: Continued stakeholder buy‐in and continued public information
campaign leading up to the Vth Development Partners’ meeting in early
February 2015

Cook Islands Agricultural & Food Sector ‐ After MDG Vision
Draft – January 2015
2
Phase three: Revisiting the Vision and elaborating a short and medium term action
plan as a first step in implementing the Vision, leading to a draft
proposal in time for the coming 2015/2016 budget planning
Phase four: Official endorsement by all stakeholders of the Vision and
abovementioned action plan and official launching of the various
councils/clusters and actions envisaged in this plan
W 45
W 46
W 47
W 48
W 49
W 50
W 51
W 52
W 1
W 2
W 3 Continuation Phase 2 & PRW 4
W 5
W 6
W 7
Weeks 8 to 20/22
June to August 2015
Phase 3 - Developing an agricultural/food sector action plan
Pilot pahse (2015/2016/2017) & upscaling for the medium term
(2017/2018/2019/2020)
drafting a number of detailed projects, framwrok&
institutional measures, implementation guidelines, budgets,
M&E, etc
Weeks 22/23 to 38
Phase 4 - Endorsement of Action Plan by all stakeholders and
official launching
Vth Development Partners Meeting
Journey to Development ‐ 50 years in the Cook islandsFebruary
March to M
ay 2015
2015
January
2014
November Phase 1
Overall Framework & priorities
December Phase 2
Stakeholder Buy-in
Draft frameworkdocument ‐‐‐ for donor
Final Master Action Plan
Interim project formats and background compilation
Cook Islands Agricultural & Food Sector ‐ After MDG Vision
Draft – January 2015
3
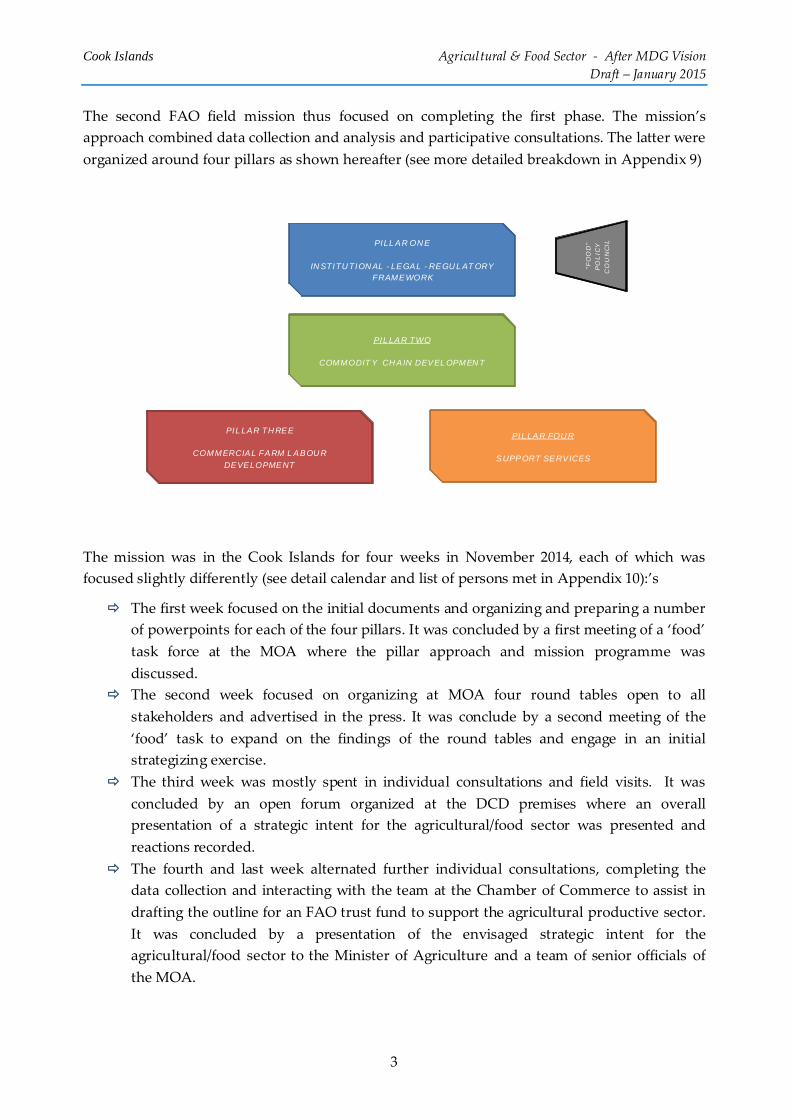
The second FAO field mission thus focused on completing the first phase. The mission’s
approach combined data collection and analysis and participative consultations. The latter were
organized around four pillars as shown hereafter (see more detailed breakdown in Appendix 9)
The mission was in the Cook Islands for four weeks in November 2014, each of which was
focused slightly differently (see detail calendar and list of persons met in Appendix 10):’s
The first week focused on the initial documents and organizing and preparing a number
of powerpoints for each of the four pillars. It was concluded by a first meeting of a ‘food’
task force at the MOA where the pillar approach and mission programme was
discussed.
The second week focused on organizing at MOA four round tables open to all
stakeholders and advertised in the press. It was conclude by a second meeting of the
‘food’ task to expand on the findings of the round tables and engage in an initial
strategizing exercise.
The third week was mostly spent in individual consultations and field visits. It was
concluded by an open forum organized at the DCD premises where an overall
presentation of a strategic intent for the agricultural/food sector was presented and
reactions recorded.
The fourth and last week alternated further individual consultations, completing the
data collection and interacting with the team at the Chamber of Commerce to assist in
drafting the outline for an FAO trust fund to support the agricultural productive sector.
It was concluded by a presentation of the envisaged strategic intent for the
agricultural/food sector to the Minister of Agriculture and a team of senior officials of
the MOA.
PILLAR ONE
INSTITUTIONAL - LEGAL - REGULATORY FRAMEWORK
"FO
OD
" P
OL
ICY
C
OU
NC
IL
PILLAR TWO
COMMODITY CHAIN DEVELOPMENT
PILLAR THREE
COMMERCIAL FARM LABOUR DEVELOPMENT
PILLAR FOUR
SUPPORT SERVICES

Cook Islands Agricultural & Food Sector ‐ After MDG Vision
Draft – January 2015
4
After the field mission, the present report was completed. It is based on: (i) a number of
additional trade data compiled especially for the mission by the Customs department of the
Ministry of Finance and Economic Management (MFEM); (ii) complementary data research on
the web (FAOSTAT, WorldBank and others); (iii) the consultants own findings and the
suggestions, comments and reactions from the various stakeholders recorded during the
mission; and (iv) various case studies completed for the MOA and DCD and that will be
circulated during the Vth Development Partners’ Meeting in February 2015.
The document is articulated in four sections:
Section one which provides a rapid review of the sector as it stands now
Section two that takes a closer look at ten major challenges that the sector has to confront
Section three which develops a strategic intent or an “after Millennium Development
Goals (MDG) Vision” for the agricultural and food sector
Section four which present an preliminary template action framework help in
streamlining the work envisaged during the third phase of the strategic action plan
The document tries to reflect as honestly as possible the views and suggestion whilst posting
them against the present data regarding the sector, and remains thus an open scoping and
working paper. Hopefully it will contribute to the future discussions and prompt the various
stakeholders to come together and form an independent sector council and thus take the main
driver’s seat in the entire process.

Cook Islands Agricultural & Food Sector ‐ After MDG Vision
Draft – January 2015
5
1. COOK-ISLANDS’ AGRICULTURAL SECTOR REVIEW
The Cook Islands (CKI) consists of 15 islands in free association with New Zealand, located
northeast of New Zealand, between French Polynesia and American Samoa. They represent a
total land area of 237 square kilometres scattered over the Cook Islandsʹ Exclusive Economic
Zone (EEZ) which covers 2 million square kilometres of the South Pacific Ocean.
The islands are split geographically into:
The Southern Group consisting mainly of islands of volcanic origin (Islands of Rarotonga,
Aitutaki, Mangaia, Atiu, Mauke, Manuae, Tukutea and Mitiaro) lies within 150 nautical
miles of Rarotonga and thus has semi‐regular transport and communications links with
the capital island of Rarotonga.
The Northern Group of low consisting of atolls (Palmerston, Pukapuka, Nassau, Manihiki,
Rakahanga, Penrhyn and Suwanow) lies between 1200 to 1500 km away from Rarotonga
and are smaller in size. Transport and communications are much less developed and
their agricultural production potential is low and directly affected by their remoteness.
The climate is a typical tropical climate with two distinct seasons and an average rainfall
between 2,000 and 3,000 mm per year. Rarotonga is also the only island that has an abundant
water supply. The other islands, particularly the atolls in the northern group suffer from water
loss, thus agriculture is limited.
In 1953, the New Zealand Soil Bureau classified 58% of the total area of the Cook Islands as
arable land (33 826 acres or ± 13 700 ha). The major share of this arable land is located on the
other southern islands (67%). Rarotonga and the Northern Islands more or less share the
remaining area equally (respectively 15.4% and 17.6%). The northern islands’ arable land is
more limited in suitability and was classified in 1953 as for ‘tree crops only’.
Most of the available good agricultural land is located in the Southern group of Islands and it is
therefore not surprising that these islands have traditionally supplied various agricultural
products to the capital islands and to the once buoyant fruit export markets of the CKI.
Land availability, limited water resources and inter‐island communications & transport logistics
are major determinants which directly impact the agricultural sector in the CKI.
In 2011, an agricultural census was conducted in parallel with the national population and
housing census. This census indicates that the present area which is actually under agricultural
usage is 2 026 acres (less than 3.6% of the entire available arable land), of which 795 acres are
fallow or under bush.
.

Cook Islands Agricultural & Food Sector ‐ After MDG Vision
Draft – January 2015
6
1.1 CONTRIBUTION TO THE ECONOMY10
1.1.1 ContributionofthesectortoGDP
Ever since 1970, the contribution of the various primary industries in the CKI Gross Domestic
Product (GDP) has been slipping from 25% to a narrower band between 5 and 10 % from the
early 1980 onwards. The contribution of the agricultural sector itself has been even more limited
as shown in the following graph.
Source: www.kushnirs.org/macroeconomics/agriculture/agriculture_cook_islands
The combination of significant disadvantages of small agricultural areas & population size,
combined with distance from its principal trading partner (New Zealand), has meant that the
gradual market liberalization of the agricultural sector (beginning the 1980’s) has led to a steady
decline of the competitiveness of Cook Islands products in export markets, which were heavily
dependent on trading networks with New Zealand. The loss of these export markets has
significantly contributed to the overall reduction and stagnation of the contribution of the
agricultural sector to the CKI’s GDP which has now reached a mere 2%.
1.1.2 ContributiontotheCKI’strade
Imports have consistently outstripped the exports in and from the CKI. Since the turn of the
millennium, total imports have increased by over 32%, to reach a total of 110 million US$ for
2011. Exports however have witnessed an
important decrease over the same period,
dropping to around 3.2 million US$ in 2011.
Trade in food, agricultural products and
vegetables have followed trends that are
even more marked as shown in the opposite
table. Most significant are the major drops in
10 See more detailed tables and graphs in appendices 1 and 3
0.0%
2.0%
4.0%
6.0%
8.0%
10.0%
2001 2002 2003 2004 2005 2006 2007 2008 2009 2010 2011 2012
Share of the agricultural & primary productionin the GDP
Share ag sector ‐ real prices Share ag sector ‐ 2006 Constant Prices
Share primary sector ‐ real prices Share primary sector ‐ 2006 constant prices
Average 2001-2007
Average 2009-2011
Indicative trend
Imports CKI 71 312.81 93 834.14 32%
Total food imports 15 958.19 20 648.66 29%Agricultural products 9 746.04 15 899.23 63%Vegetable imports 2 506.54 4 052.53 62%
Exports CKI 6 585.32 3 678.15 -44%
Total food imports 3 348.23 745.45 -78%Agricultural products 1 019.27 600.75 -41%Vegetable imports 200.27 48.68 -76%
Source : wits.worldbank .org/country/profile/country/COK
In 1000 US$

Cook Islands Agricultural & Food Sector ‐ After MDG Vision
Draft – January 2015
7
vegetable and food exports and increases in imports of vegetable and other agricultural
products. The evolution of their respective share of total imports and exports since 2001 are
illustrated in the following graph.
Source: wits.worldbank.org/country/profile/country/COK
The share of food imports remains at around 20‐25% of total imports, whilst exports have
significantly dropped. The share of vegetable imports remains rather constant at slightly below
10%.
1.1.3 AgriculturalActivity,HoldingsandEmployment
According to the 2011 agricultural census, out of the 2334 households (HH) that took part in the
census:
1275 HH declared to be active in agriculture either as subsistence type agricultural
(67.5%) or as geared primarily geared at sales (32.5%).
1061 HH declared to be keeping livestock either for subsistence (68.6%) or for sale
(31.4%).
In Rarotonga, in addition to these ‘active’ HH one needs to also consider an important share of
HH that declare engaging in minor agricultural activities (house‐gardening or ‘hobby’
gardening). This is also a common feature in the Northern Islands.
0.0%
5.0%
10.0%
15.0%
20.0%
25.0%
30.0%
35.0%
2001 2002 2003 2004 2005 2006 2007 2008 2009 2010 2011
Shares of Total Imports ‐ Cook Islands
Total Food Share Agricultural products' share Vegetables' share
0.0%
10.0%
20.0%
30.0%
40.0%
50.0%
60.0%
70.0%
80.0%
2001 2002 2003 2004 2005 2006 2007 2008 2009 2010 2011
Shares of Total Exports ‐ Cook Islands
Total Food Share Agricultural products' share Vegetables' share
Cook Islands Agricultural & Food Sector ‐ After MDG Vision
Draft – January 2015
8
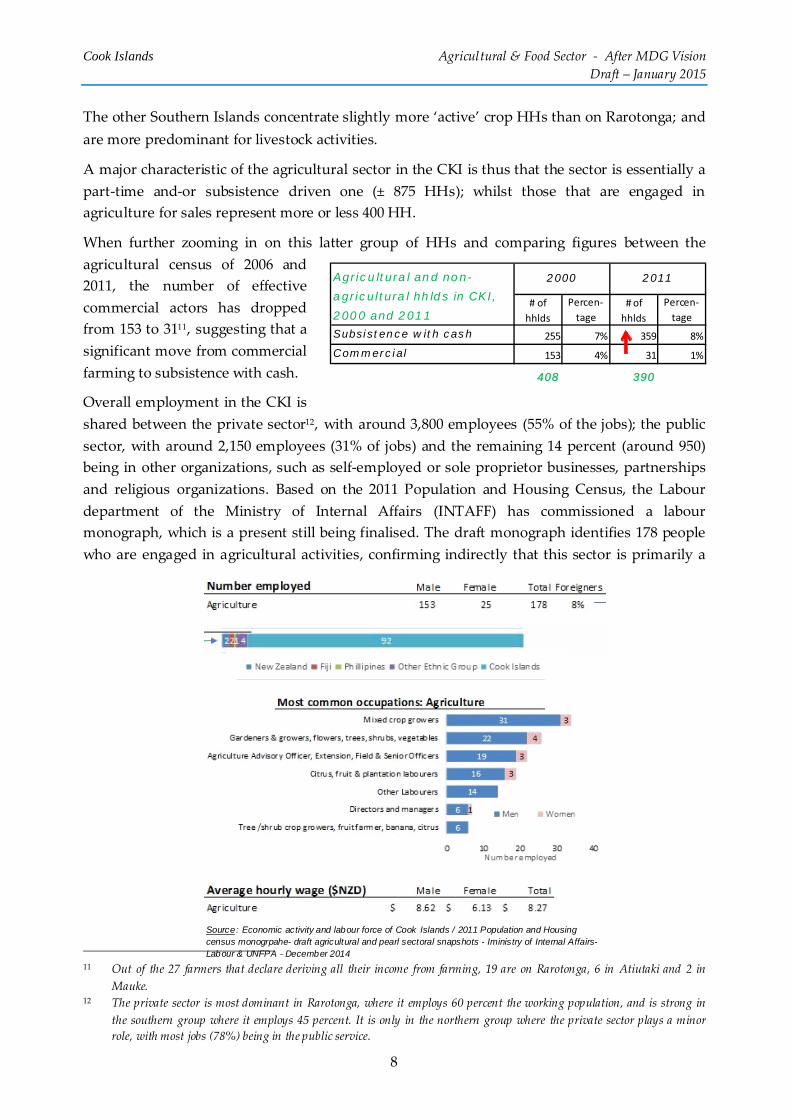
The other Southern Islands concentrate slightly more ‘active’ crop HHs than on Rarotonga; and
are more predominant for livestock activities.
A major characteristic of the agricultural sector in the CKI is thus that the sector is essentially a
part‐time and‐or subsistence driven one (± 875 HHs); whilst those that are engaged in
agriculture for sales represent more or less 400 HH.
When further zooming in on this latter group of HHs and comparing figures between the
agricultural census of 2006 and
2011, the number of effective
commercial actors has dropped
from 153 to 3111, suggesting that a
significant move from commercial
farming to subsistence with cash.
Overall employment in the CKI is
shared between the private sector12, with around 3,800 employees (55% of the jobs); the public
sector, with around 2,150 employees (31% of jobs) and the remaining 14 percent (around 950)
being in other organizations, such as self‐employed or sole proprietor businesses, partnerships
and religious organizations. Based on the 2011 Population and Housing Census, the Labour
department of the Ministry of Internal Affairs (INTAFF) has commissioned a labour
monograph, which is a present still being finalised. The draft monograph identifies 178 people
who are engaged in agricultural activities, confirming indirectly that this sector is primarily a
11 Out of the 27 farmers that declare deriving all their income from farming, 19 are on Rarotonga, 6 in Atiutaki and 2 in
Mauke. 12 The private sector is most dominant in Rarotonga, where it employs 60 percent the working population, and is strong in
the southern group where it employs 45 percent. It is only in the northern group where the private sector plays a minor
role, with most jobs (78%) being in the public service.
Source: Economic activity and labour force of Cook Islands / 2011 Population and Housing census monogrpahe- draft agricultural and pearl sectoral snapshots - Iministry of Internal Affairs- Labour & UNFPA - December 2014
# of
hhlds
Percen‐
tage
# of
hhlds
Percen‐
tage
Subsistence with cash 255 7% 359 8%
Commercial 153 4% 31 1%
408 390
2000 2011Agricultural and non-
agricultural hhlds in CKI,
2000 and 2011

Cook Islands Agricultural & Food Sector ‐ After MDG Vision
Draft – January 2015
9
part‐time and subsistence driven sector.
1.2 OVERALL PRODUCTIVE PERFORMANCE
1.2.1 Crops
a) Productionareas
The 2011 agricultural census identifies 2028.8 acres (±820 ha) as agricultural land of which only
1233.7 acres (± 500 ha) are at present under crops, leaving more than 795.1 acres (± 320 ha)
fallow or under bush.
Major crops are root crops, tree crops (fruits+coconut) and vegetables. All three show persistent
downward trends since 1990.
In 2011, tree crops accounted for the major soil
occupation (880 acres or 356 ha) followed by root
crops (270 acres or 109 ha) and vegetables (71 acres
or 29 ha).
However tree crop areas include orchards (pure
stand), and scattered trees within or outside
agricultural plots or individually planted; thus trees
planted as orchards only account for 261 acres (101
ha), whereas coconut trees (mostly scattered or
individual trees) account for 397 acres (161 ha).
Furthermore the farm size pyramid is characterized
by the predominance of small farms or plantations.
Around 40% of all farms are smaller than half an
acre and just over 80% of all farms are smaller than
2 acres (0.8 ha). Most of the bigger farms (the
remaining 17%) are concentrated in the other
Southern Islands and Rarotonga Island.
880.0
71.2
269.912.6
402.1
393.0
Areas earmarked for cropsin acres
Tree crops Vegetables
Roots Other crops
Fallow Bush/livestock
0
500
1 000
1 500
2 000
2 500
3 000
3 500
4 000
1988 2000 2011
Crop Areas (acres) 1988, 2000, 2011CoAg 1988‐2000‐2011
Tree crops Vegetables Root Crops
Cumulated
Less than 2 acres ± 0.8 ha 82.7%
Less than 1 acre ± 0.4 ha 62.4%
Less than 0.5 acre ± 0.2 ha 39.5%
More Than 2 acres = 17.3%
Farm size distribution (active HH)
0.0%
10.0%
20.0%
30.0%
40.0%
50.0%
60.0%
70.0%
80.0%
90.0%
100.0%
Farm size
>5.00
4.00‐4.99
3.00‐3.99
2.00‐2.99
1.00‐1.99
0.50‐0.99
0.25‐0.49
<.0.25

Cook Islands Agricultural & Food Sector ‐ After MDG Vision
Draft – January 2015
10
b) AverageCropproduction(quantities)
In 2012, crop farming in the CKI produced an estimated total of 7 971 metric tonnes of produce
(excluding figures for Noni production) of which 1 329 mt of tropical fruits (of which 64% are
grown in orchards), 1 820 mt of coconuts, 1 672 mt of various vegetables and 3 150mt of root
crops.
Even though no Noni production
estimates are available at the time of
reporting, Noni is an important export
crop as it enjoys organic certification
allowing it significant penetration of the
Chinese market for Noni juice.
Over the past decade, production of root
crops has declined, coconut more or less
maintains itself, whereas vegetable
production has increased and fruits
Production estimate
Production estimate
acres ha metric tons acres ha metric tons
Major fruits 1 329 Coconut 397.2 161 1 820
Papaya 47.2 19 600 Vegetables 1 672
Noni 58.6 24 na Tomatoes 10.2 4 170
Banana 87.5 35 95 Chillies & peppers 0.6 0 2Oranges 59.1 24 65 Other 24.1 10 1 500
Pineapple 4.5 2 25
Mangoes 97 39 190 Root crops 3 150Avocado 16.7 7 26 Taro 156.7 63 naLimes/Lemons 18.1 7 12 Casava 66.3 27 1 000Melon 31.8 13 60 Other 46.9 19 na
Other 98.6 40 256 Mostly pure stand or orchard
Sources Areas Production estimate
Cropped area Cropped area
2011 Agricultural census FAOSTAT 2012 estimates
0
1 000
2 000
3 000
4 000
5 000
6 000
2005 2006 2007 2008 2009 2010 2011 2012
Metric tons per year
Agricultural Productionin the Cook Islands
Vegetables & Melons Roots/tubers Fruits without melons Coconuts
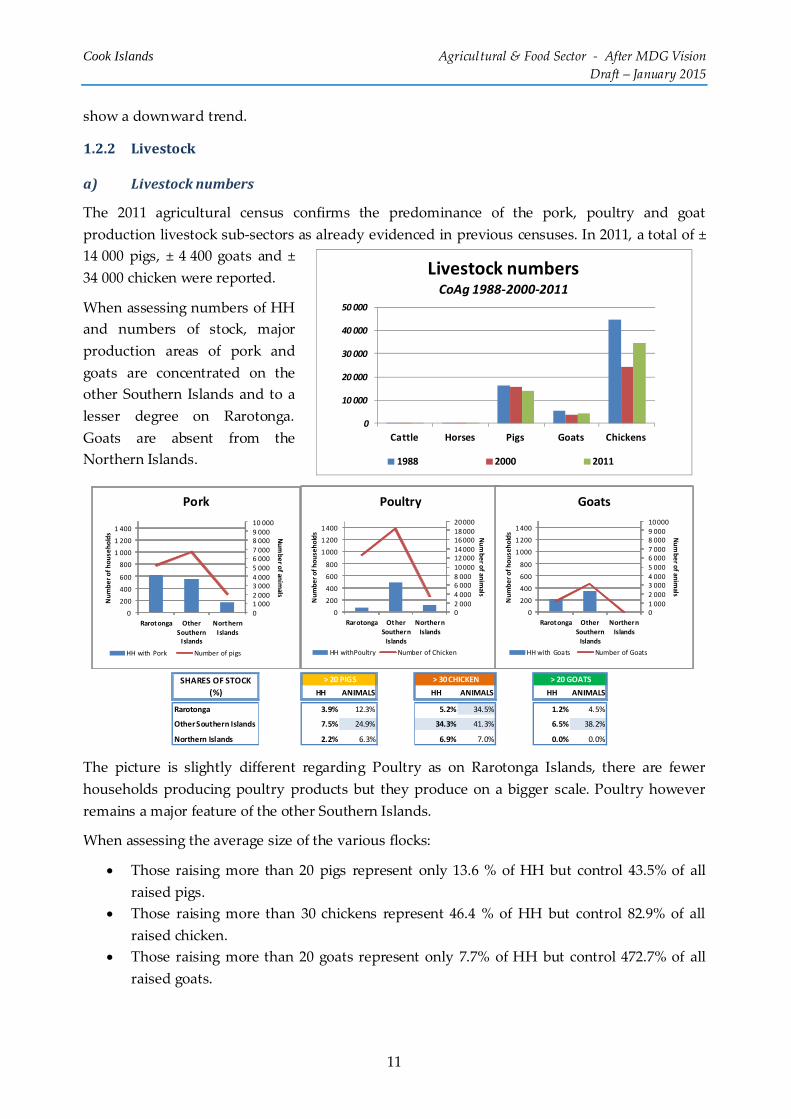
Cook Islands Agricultural & Food Sector ‐ After MDG Vision
Draft – January 2015
11
show a downward trend.
1.2.2 Livestock
a) Livestocknumbers
The 2011 agricultural census confirms the predominance of the pork, poultry and goat
production livestock sub‐sectors as already evidenced in previous censuses. In 2011, a total of ±
14 000 pigs, ± 4 400 goats and ±
34 000 chicken were reported.
When assessing numbers of HH
and numbers of stock, major
production areas of pork and
goats are concentrated on the
other Southern Islands and to a
lesser degree on Rarotonga.
Goats are absent from the
Northern Islands.
The picture is slightly different regarding Poultry as on Rarotonga Islands, there are fewer
households producing poultry products but they produce on a bigger scale. Poultry however
remains a major feature of the other Southern Islands.
When assessing the average size of the various flocks:
Those raising more than 20 pigs represent only 13.6 % of HH but control 43.5% of all
raised pigs.
Those raising more than 30 chickens represent 46.4 % of HH but control 82.9% of all
raised chicken.
Those raising more than 20 goats represent only 7.7% of HH but control 472.7% of all
raised goats.
HH ANIMALS HH ANIMALS HH ANIMALS
Rarotonga 3.9% 12.3% 5.2% 34.5% 1.2% 4.5%
Other Southern Islands 7.5% 24.9% 34.3% 41.3% 6.5% 38.2%
Northern Islands 2.2% 6.3% 6.9% 7.0% 0.0% 0.0%
> 20 PIGS > 30 CHICKEN > 20 GOATSSHARES OF STOCK
(%)
0
1 0002 000
3 0004 000
5 000
6 0007 000
8 0009 000
10 000
0
200
400
600
800
1 000
1 200
1 400
Rarotonga Other
Southern Islands
Northern
Islands
Number o
f anim
als
Number of households
Pork
HH with Pork Number of pigs
02 000
4 000
6 0008 000
10 000
12 00014 000
16 00018 000
20 000
0
200
400
600
800
1 000
1 200
1 400
Rarotonga Other
Southern
Islands
Northern
Islands
Number o
f anim
alsNumber of households
Poultry
HH withPoultry Number of Chicken
01 000
2 000
3 0004 000
5 000
6 0007 000
8 0009 000
10 000
0
200
400
600
800
1 000
1 200
1 400
Rarotonga Other
Southern
Islands
Northern
Islands
Number o
f anim
als
Number of householdsGoats
HH with Goats Number of Goats
0
10 000
20 000
30 000
40 000
50 000
Cattle Horses Pigs Goats Chickens
Livestock numbersCoAg 1988‐2000‐2011
1988 2000 2011
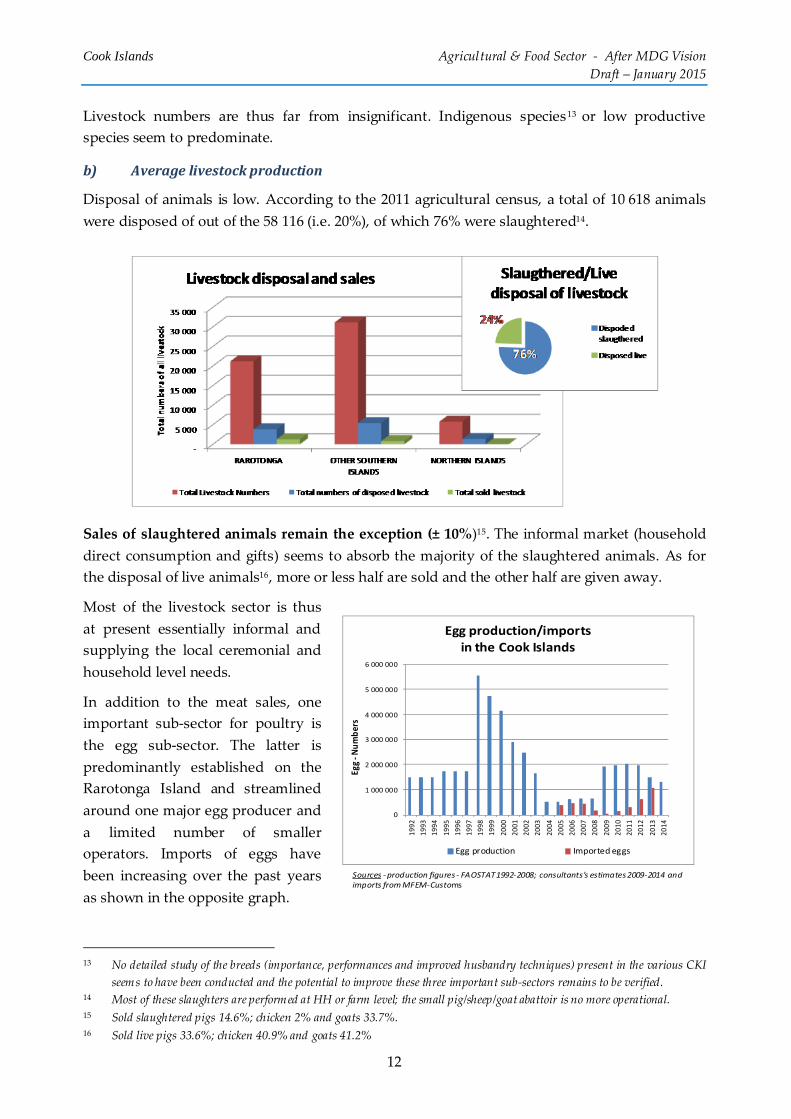
Cook Islands Agricultural & Food Sector ‐ After MDG Vision
Draft – January 2015
12
Livestock numbers are thus far from insignificant. Indigenous species13 or low productive
species seem to predominate.
b) Averagelivestockproduction
Disposal of animals is low. According to the 2011 agricultural census, a total of 10 618 animals
were disposed of out of the 58 116 (i.e. 20%), of which 76% were slaughtered14.
Sales of slaughtered animals remain the exception (± 10%)15. The informal market (household
direct consumption and gifts) seems to absorb the majority of the slaughtered animals. As for
the disposal of live animals16, more or less half are sold and the other half are given away.
Most of the livestock sector is thus
at present essentially informal and
supplying the local ceremonial and
household level needs.
In addition to the meat sales, one
important sub‐sector for poultry is
the egg sub‐sector. The latter is
predominantly established on the
Rarotonga Island and streamlined
around one major egg producer and
a limited number of smaller
operators. Imports of eggs have
been increasing over the past years
as shown in the opposite graph.
13 No detailed study of the breeds (importance, performances and improved husbandry techniques) present in the various CKI
seems to have been conducted and the potential to improve these three important sub‐sectors remains to be verified. 14 Most of these slaughters are performed at HH or farm level; the small pig/sheep/goat abattoir is no more operational. 15 Sold slaughtered pigs 14.6%; chicken 2% and goats 33.7%. 16 Sold live pigs 33.6%; chicken 40.9% and goats 41.2%
0
1 000 000
2 000 000
3 000 000
4 000 000
5 000 000
6 000 000
1992
1993
1994
1995
1996
1997
1998
1999
2000
2001
2002
2003
2004
2005
2006
2007
2008
2009
2010
2011
2012
2013
2014
Egg ‐N
umbers
Egg production/importsin the Cook Islands
Egg production Imported eggs
Sources ‐production figures ‐ FAOSTAT 1992‐2008; consultants's estimates 2009‐2014 and imports from MFEM‐Customs

Cook Islands Agricultural & Food Sector ‐ After MDG Vision
Draft – January 2015
13
2. CHALLENGES AND OPPORTUNITIES
2.1 FOOD SECURITY
Food security is more than just ensuring that sufficient food is available so that nobody is
underfed. Food security is thus multi‐dimensional and takes into account at least four major
dimensions:
Food availability (sufficient quantities, appropriate quality),
Access to food (adequate resources for acquiring appropriate foods for a nutritious diet),
Stability of food availability (no risk of losing access to food as a consequence of events
such as economic or climatic crisis)
Food utilization (essential non‐food factors such as clean water, sanitation and health
care).
The CKI ensure an average diet of 3185 Kcal/day, of which 83.4% is imported. Local food
availability has been declining from 250 US$ per person17 to 114 US$ (and even less if tourists
figures are taken into account). Physical access to food is not a major problem, but
communications and transport remain irregular to the most outer islands.
Stability of the food security has been gradually eroded as this index now reaches 5.4 times the
value of the country’s exports18. This is in part mitigated
by the development of the service sector through the
present tourist boom19, but still remains a major concern
for the CKI.
In addition utilization of sufficient, safe and nutritious
food depends on a number of factors such as the
17 Indicator derived by FAO using the population figures and thus ignoring the tourist effect that has increased to presently
doubling the population present on the islands (see data in section that show that on average there are more or less every
month as many tourists as inhabitants since 2010) 18 The CKI has never been totally able to cover their food imports by their exports as already in 1990 this indicator was 1.4. 19 Which benefits from important market support from the Government (the tourist board and air‐seat capacity investments
…)
Moreover, high profits and rents earned
on large import operations typically
become embedded, and so constitute a
strong deterrent to the eventual (re‐
)establishment of local production
operations.
Milford Bateman (2010)
0
100
200
300
400
500
600
(percent) ‐three ye
ar m
obile average
Value of food imports in total merchandise exports
Value of food imports in total merchandise exports
0
50
100
150
200
250
300
(I$ per capu
t) ‐three year mobile
average
Average value of food production
Average value of food production
Source: FAO food security indicators ‐FAOSTAT 1990‐2012
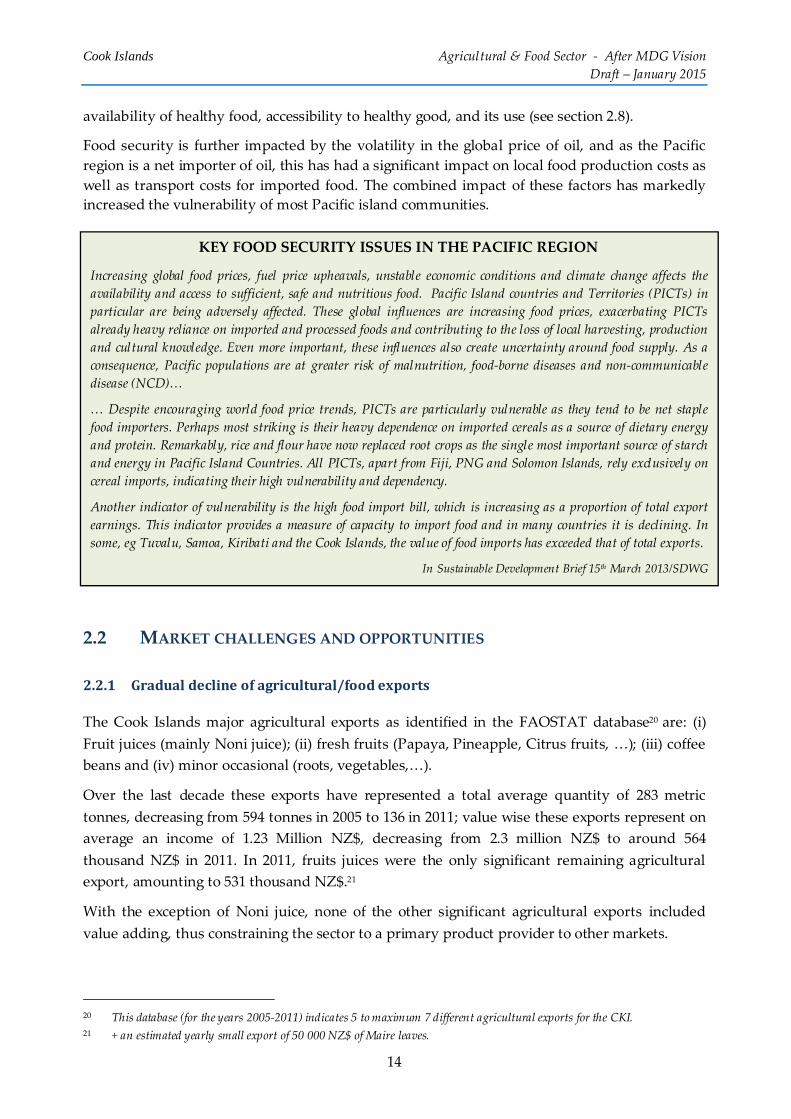
Cook Islands Agricultural & Food Sector ‐ After MDG Vision
Draft – January 2015
14
availability of healthy food, accessibility to healthy good, and its use (see section 2.8).
Food security is further impacted by the volatility in the global price of oil, and as the Pacific
region is a net importer of oil, this has had a significant impact on local food production costs as
well as transport costs for imported food. The combined impact of these factors has markedly
increased the vulnerability of most Pacific island communities.
2.2 MARKET CHALLENGES AND OPPORTUNITIES
2.2.1 Gradualdeclineofagricultural/foodexports
The Cook Islands major agricultural exports as identified in the FAOSTAT database20 are: (i)
Fruit juices (mainly Noni juice); (ii) fresh fruits (Papaya, Pineapple, Citrus fruits, …); (iii) coffee
beans and (iv) minor occasional (roots, vegetables,…).
Over the last decade these exports have represented a total average quantity of 283 metric
tonnes, decreasing from 594 tonnes in 2005 to 136 in 2011; value wise these exports represent on
average an income of 1.23 Million NZ$, decreasing from 2.3 million NZ$ to around 564
thousand NZ$ in 2011. In 2011, fruits juices were the only significant remaining agricultural
export, amounting to 531 thousand NZ$.21
With the exception of Noni juice, none of the other significant agricultural exports included
value adding, thus constraining the sector to a primary product provider to other markets.
20 This database (for the years 2005‐2011) indicates 5 to maximum 7 different agricultural exports for the CKI. 21 + an estimated yearly small export of 50 000 NZ$ of Maire leaves.
KEY FOOD SECURITY ISSUES IN THE PACIFIC REGION
Increasing global food prices, fuel price upheavals, unstable economic conditions and climate change affects the
availability and access to sufficient, safe and nutritious food. Pacific Island countries and Territories (PICTs) in
particular are being adversely affected. These global influences are increasing food prices, exacerbating PICTs
already heavy reliance on imported and processed foods and contributing to the loss of local harvesting, production
and cultural knowledge. Even more important, these influences also create uncertainty around food supply. As a
consequence, Pacific populations are at greater risk of malnutrition, food‐borne diseases and non‐communicable
disease (NCD)…
… Despite encouraging world food price trends, PICTs are particularly vulnerable as they tend to be net staple
food importers. Perhaps most striking is their heavy dependence on imported cereals as a source of dietary energy
and protein. Remarkably, rice and flour have now replaced root crops as the single most important source of starch
and energy in Pacific Island Countries. All PICTs, apart from Fiji, PNG and Solomon Islands, rely exclusively on
cereal imports, indicating their high vulnerability and dependency.
Another indicator of vulnerability is the high food import bill, which is increasing as a proportion of total export
earnings. This indicator provides a measure of capacity to import food and in many countries it is declining. In
some, eg Tuvalu, Samoa, Kiribati and the Cook Islands, the value of food imports has exceeded that of total exports.
In Sustainable Development Brief 15th March 2013/SDWG
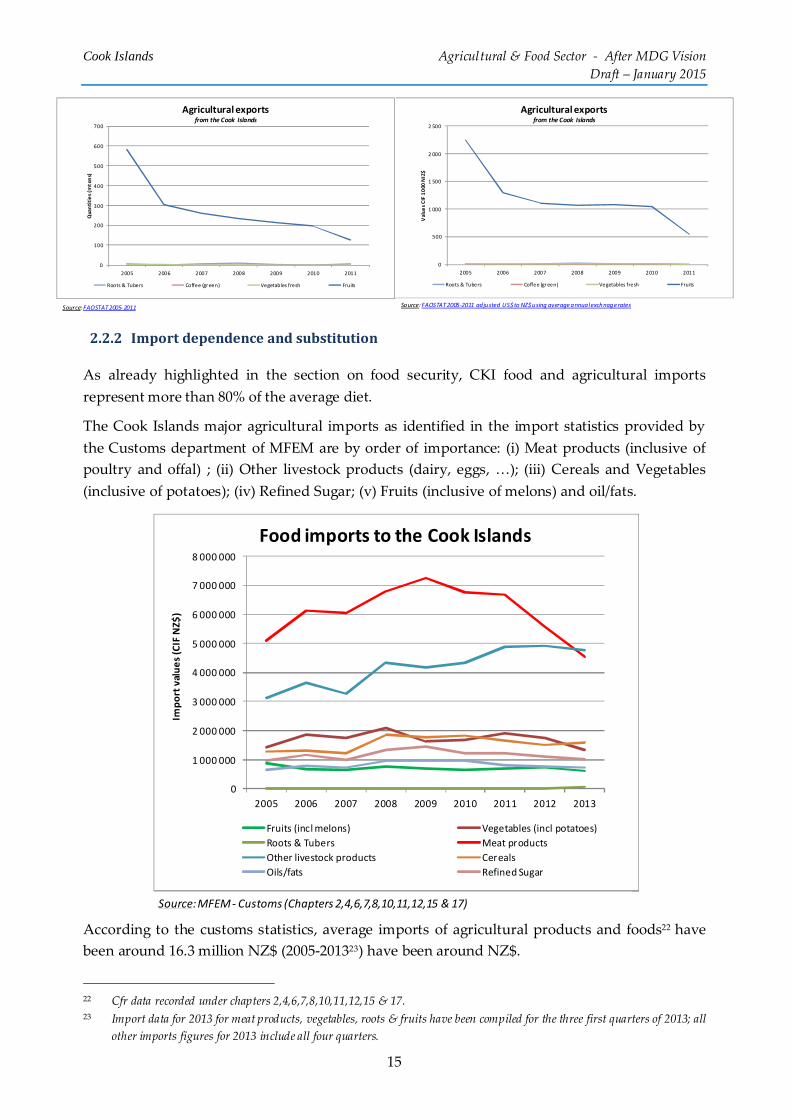
Cook Islands Agricultural & Food Sector ‐ After MDG Vision
Draft – January 2015
15
2.2.2 Importdependenceandsubstitution
As already highlighted in the section on food security, CKI food and agricultural imports
represent more than 80% of the average diet.
The Cook Islands major agricultural imports as identified in the import statistics provided by
the Customs department of MFEM are by order of importance: (i) Meat products (inclusive of
poultry and offal) ; (ii) Other livestock products (dairy, eggs, …); (iii) Cereals and Vegetables
(inclusive of potatoes); (iv) Refined Sugar; (v) Fruits (inclusive of melons) and oil/fats.
According to the customs statistics, average imports of agricultural products and foods22 have
been around 16.3 million NZ$ (2005‐201323) have been around NZ$.
22 Cfr data recorded under chapters 2,4,6,7,8,10,11,12,15 & 17. 23 Import data for 2013 for meat products, vegetables, roots & fruits have been compiled for the three first quarters of 2013; all
other imports figures for 2013 include all four quarters.
0
1 000 000
2 000 000
3 000 000
4 000 000
5 000 000
6 000 000
7 000 000
8 000 000
2005 2006 2007 2008 2009 2010 2011 2012 2013
Import values (CIF NZ$
)
Food imports to the Cook Islands
Fruits (incl melons) Vegetables (incl potatoes)
Roots & Tubers Meat products
Other livestock products Cereals
Oils/fats Refined Sugar
Source: MFEM ‐ Customs (Chapters 2,4,6,7,8,10,11,12,15 & 17)
0
500
1 000
1 500
2 000
2 500
2005 2006 2007 2008 2009 2010 2011
Value
s CIF 1000
NIZ$
Agricultural exports from the Cook Islands
Roots & Tubers Coffee (green) Vegetables fresh Fruits
Source: FAOSTAT2005‐2011 adjusted US$ to NZ$ using average annual exchnage rates
0
100
200
300
400
500
600
700
2005 2006 2007 2008 2009 2010 2011
Quantities (m
tons)
Agricultural exports from the Cook Islands
Roots & Tubers Coffee (green) Vegetables fresh Fruits
Source: FAOSTAT2005‐2011

Cook Islands Agricultural & Food Sector ‐ After MDG Vision
Draft – January 2015
16
When considering import substitution opportunities, import figures have to be regrouped
under the following headings, which are illustrated in the above graphs:
Standard imports for which there is little or no local production opportunity; i.e.
livestock products (all meat except pork, poultry and goat; dairy products; offal; …)
temperate and other fruit preparations and other more temperate vegetables)
Beverages24 (non alcoholic, alcoholic and waters)
Imports of products that are locally available (or could be expanded/developed); i.e.
livestock products (pork, poultry and goats meat + eggs), tropical fruits ( citrus fruits,
papaya, banana, mangoes, pineapple, noni, avocados, pineapple, guavas, melons,
coconut, …) and vegetables (tomatoes, onions/leeks, cabbages, lettuce, carrots, potatoes,
chillies, capsicum, …)
The importance of import substitution represents more or less 4.8 million NZ$ over the 2005‐
2013 period (22.5 % of average total agricultural/food imports over the same period) which is
mostly provided by livestock products (3.6 million NZ$) followed by vegetables (1.1 million
NZ$) and tropical fruits (0.13 million NZ$).
24 Beverage imports in the table have been estimated using the data provided by FAOSTAT for this entry and converting the
value of the imports from US$ to NZ$ using average annual exchange rates.
0
2 000 000
4 000 000
6 000 000
8 000 000
10 000 000
12 000 000
14 000 000
2005 2006 2007 2008 2009 2010 2011 2012 2013
Value in CIF NZ$
Agricultural imports to the Cook Islands (US$)
Ag. Impor ts (Cereales, Oils, Sugar , Livestock, Dairy etc) Beverages Possible substitution
Source: MFEM ‐ Customs (Chapters 2,4,6,7,8,10,11,12,15 & 17)
0
500 000
1 000 000
1 500 000
2 000 000
2 500 000
3 000 000
3 500 000
4 000 000
4 500 000
5 000 000
2005 2006 2007 2008 2009 2010 2011 2012 2013
Values in NZ$
Agricultural Imports ‐ possible substitutions to the Cook Islands
Livestock imprts (see Imports livestock excel file)
Fruits imports (see fruit import excel file)
Source: MFEM ‐ Customs (Chapters 2,4,6,7,8,10,11,12,15 & 17)
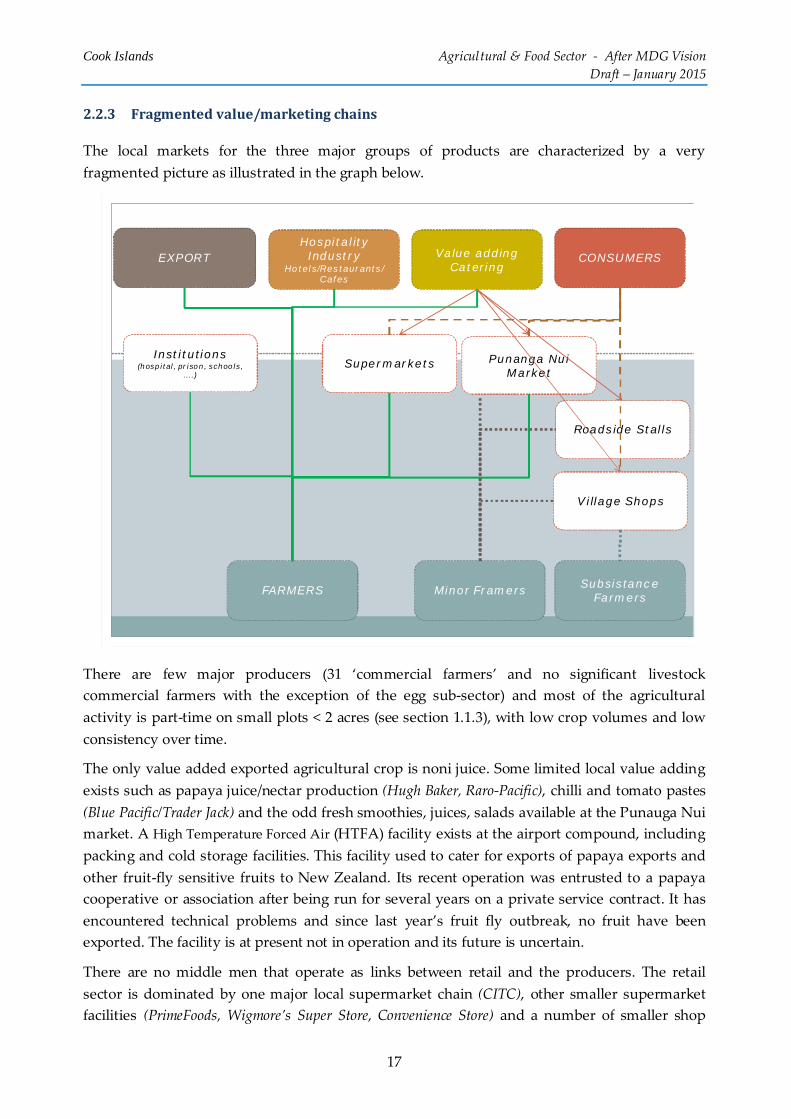
Cook Islands Agricultural & Food Sector ‐ After MDG Vision
Draft – January 2015
17
2.2.3 Fragmentedvalue/marketingchains
The local markets for the three major groups of products are characterized by a very
fragmented picture as illustrated in the graph below.
There are few major producers (31 ‘commercial farmers’ and no significant livestock
commercial farmers with the exception of the egg sub‐sector) and most of the agricultural
activity is part‐time on small plots < 2 acres (see section 1.1.3), with low crop volumes and low
consistency over time.
The only value added exported agricultural crop is noni juice. Some limited local value adding
exists such as papaya juice/nectar production (Hugh Baker, Raro‐Pacific), chilli and tomato pastes
(Blue Pacific/Trader Jack) and the odd fresh smoothies, juices, salads available at the Punauga Nui
market. A High Temperature Forced Air (HTFA) facility exists at the airport compound, including
packing and cold storage facilities. This facility used to cater for exports of papaya exports and
other fruit‐fly sensitive fruits to New Zealand. Its recent operation was entrusted to a papaya
cooperative or association after being run for several years on a private service contract. It has
encountered technical problems and since last year’s fruit fly outbreak, no fruit have been
exported. The facility is at present not in operation and its future is uncertain.
There are no middle men that operate as links between retail and the producers. The retail
sector is dominated by one major local supermarket chain (CITC), other smaller supermarket
facilities (PrimeFoods, Wigmore’s Super Store, Convenience Store) and a number of smaller shop
EXPORTHospitality
IndustryHotels/Restaurants/
Cafes
Value addingCatering
CONSUMERS
SupermarketsInstitutions
(hospital, prison, schools, ....)
Punanga Nui Market
Roadside Stalls
Village Shops
FARMERS Minor Framers Subsistance Farmers

Cook Islands Agricultural & Food Sector ‐ After MDG Vision
Draft – January 2015
18
operators along the Rarotonga ring road. There are no regular other markets other that small
roads sales and small local shops.
2.2.4 LinkageandinteractionwithHospitalitysector
Tourism remains the largest industry in the Cook Islands, accounting for around 60 per cent of
the economy. Arrivals have soared over the past years, as shown in the following graph.
However, growth in tourism arrivals has slowed from 3.2 per cent growth in 2012/13 to 1.6 per
cent growth in 2013/14. Subsequently, tourist arrival forecasts in the CKI budget estimates for
2014/15 have been maintained at their recent levels and slightly revised downwards.
New Zealand remains by far the largest market at 65 per cent of total arrivals. Australia has as
smaller, but increasing share (18 per cent) which is offsetting the declines experienced in
European markets. The average stay is estimated at around 8.0 days, with this average heavily
influenced by the level of New Zealand and Australian arrivals. The average daily spend
(including accommodation) is estimated to be around $200‐230 per visitor (including children),
but varies by time of year and by tourist source market25.
Data in the Cook Islands Visitor Survey26 indicate that 99 % of tourists visit a restaurant/ café
during their stay and this is where they spend the most money. The Visitor Survey also
identifies that 84 % of tourists visit the local market and 69 %
attend island night and feast events.
Interestingly, almost an equal number of tourists cite their
food and beverage experience as the least appealing aspect of
their say (12 per cent) as those that cite it has the most
appealing (11 percent). The ‘food’ or ‘cuisine’ experience is
however an important marketing theme of the Cook Islands
25 MFEM – Budget estimates 2014/2015. 26 Cook Islands Visitor Survey Annual Summary Report April 2012‐March 2013, and Cook Islands Visitor Survey Results
July‐ September 2013; New Zealand Tourism Research Institute, Auckland University of Technology, 2013
Welcome to the paradise of
the Cook Islands.
Dare to experience the unique
culture, food, and lifestyles
http://instagram.com/cookislands

Cook Islands Agricultural & Food Sector ‐ After MDG Vision
Draft – January 2015
19
Tourism Council and Board. It is therefore essential to ensure as far as possible that this ‘food‐
cuisine’ experience draws on local products and food traditions.
The food hospitality (i.e. hotels, restaurants, cafes) sector is a significant consumer of local fresh
produce. In the previous FAO report on linking farmers to market, a rapid estimation of the
importance of this local fresh market was made (see Appendix 3 for a more detailed table27) and
suggests that for vegetables approximately 192 tonnes of
selected vegetables are required, at a value of over NZ$
765 thousand; and that for fruits there is demand for 294
tonnes of fruit valued at around NZ$ 867 thousand, every
year. The total value of the tourist market for this fresh
food produce is therefore estimated to be over NZ$ 1.6
million.
The food hospitality sector accesses food supplies directly from importers and farmers and also
to a lesser extent from all of the other intermediary retail/wholesale outlets. Whilst some of the
hotel/resorts have established preferred supplier arrangements and do provide limited forward
indication of their produce demand, formal contracts are not the norm. A consequence of these
uncoordinated supply chains for local farmers’ produce has been summed up by the food
hospitality sector as a situation of ‘feast or famine’.
2.2.5 Thelivestocksector
There seems to be a major disjoint between the imports of a number of livestock products (see
section 2.2.3) and the existing local production capacity (mainly pork, poultry, goats and eggs –
see section 1.2.2).
Major constraints generally highlighted when considering not to invest or develop livestock
activities in the CKI are:
Direct competition from other Pacific countries reducing viable commercial options;
unless focused28 market interventions29 or niche value adding (origin labels or products)
ventures can be sustainably developed.
Animal feed is imported at great cost and little use of local available or produced feed is
researched and promoted; even though a number of local feed products (coconut,
27 This seems consistent with estimates based on experience in Fiji. If the average tourist there consumes three papaya, two
mangoes, one pineapple and consumes similar quantities of meat products to the average consumption in his country of
origin, the tourist market in the CKI would amount to some 350 tonnes of papaya, 100 tonnes of mango, 100 tonnes of
pineapple and 360 tonnes of meat products annually (of which 110 tons of Beef meat – 75 of Pork ‐140 of chicken and 35 of
sheep meat).
Sources: McGregor estimates for 2006 sited in the Veith report (2009) on ‘Assessing the Viability of Collection Centres for
Fruit and Vegetables in Fiji ‐ Value Chain Approach’ and the Cardno report (2012) –‘ Identification of a Livestock Support
Project for Fiji based on M4P Methodology’ 28 Focused on either protecting the market or improving input importation. 29 Other pacific islands maintain high levels of protection of their national livestock productions. For example Fiji maintains a
32% duty on most livestock products. It is thus ironical that an important share of the “duty free” imported eggs in 2014
originates from the “duty” protected Fiji.
Lettuces, cucumbers, tomato,
pumpkin and silver beet are the most
valuable vegetable markets; while
water melon, banana and rock melon
are the most valuable fruit markets
Linking farmers to Markets
FAO ‐ 2014

Cook Islands Agricultural & Food Sector ‐ After MDG Vision
Draft – January 2015
20
cassava, …) are available and could be used‐incorporated with smaller and more
focused imported feed elements.
The breeds (mostly indigenous) and the present production and animal husbandry
techniques (open air and wandering) are either viewed as low input or as presenting a
major health /consumption hazard.
Environmental concerns regarding animal wastes and production conditions seem to
prevail in the light of CKI’s pristine environment as an important impediment.
The lack of appropriate local value adding ventures is in part justified by the direct
import competition and in part by the inconsistency of local supplies. Small local
butchering and pork workshops operating in the early 2000 have closed down; and so
has the existing local abattoir.
Nevertheless, as past local small value adding ventures have shown, there is scope to try and
regain some market shares for livestock ‘quality’ or ‘local labelled’ products.
The Livestock Sector
in “Linking farmers to markets in the CKI”
The impact of increased competition from livestock producers in Pacific Rim countries which enjoy scale
efficiencies and cheaper feed costs, has made it extremely difficult for commercial livestock producers to
maintain market share, without significant market intervention, which the Government is unwilling to
continue.
Pork ‐ The government has decided to remove tariff protection on imported pork products in April
2014. In addition as the scale of pork production has fallen and shifted from commercial to own
consumption, the standard of commercial meat processing and storage facilities has fallen and is now no
longer operational, making it extremely difficult for local producers to meet necessary quality and
food safety standards required to supply retailers and hospitality markets. Poultry (Eggs) ‐ Although there is no commercial broiler enterprise in Cook Islands there are
commercial layer operations which have a proven capacity to produce and market eggs. This sector has
also benefited from border tariff protection (*) until its very recent removal. With the tariff protection
local eggs are price competitive with imported eggs and have a quality advantage over sea‐freighted
imports in terms of ‘freshness’ and shelf life. However, the levels of production achieved by the local egg
industry have declined as result of difficulties accessing local retail markets (despite a price advantage).
FAO – March 2014
(*)
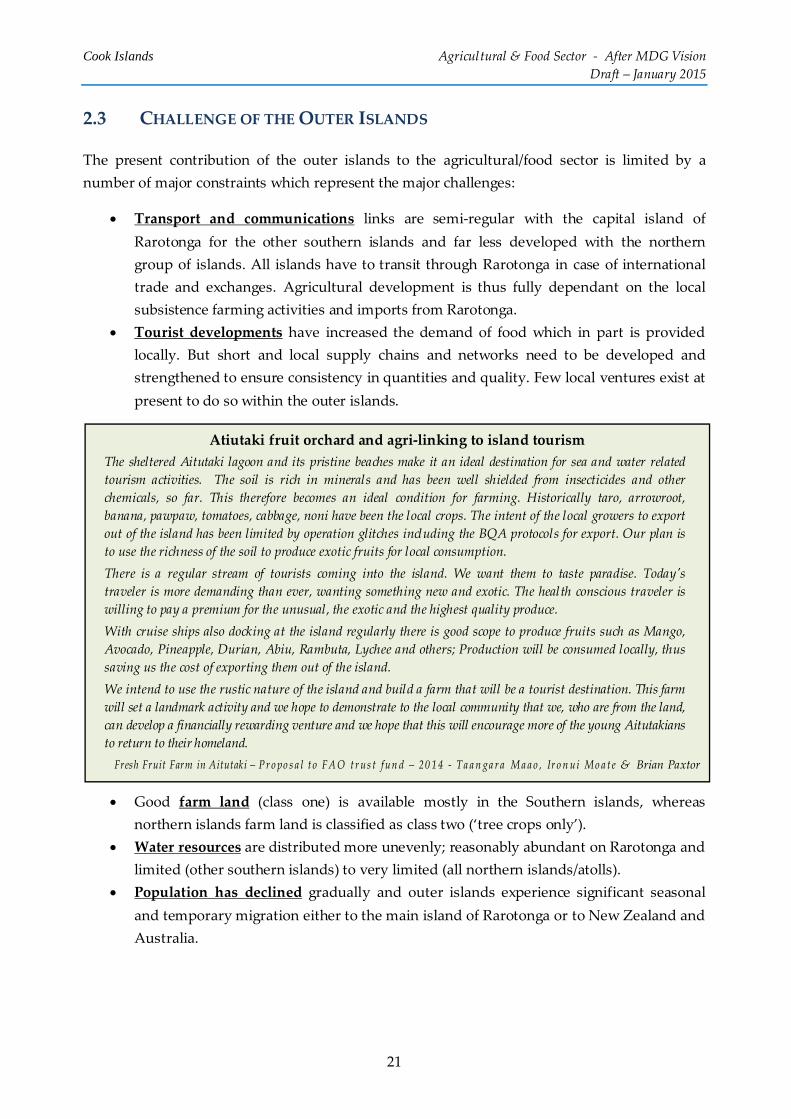
Cook Islands Agricultural & Food Sector ‐ After MDG Vision
Draft – January 2015
21
2.3 CHALLENGE OF THE OUTER ISLANDS
The present contribution of the outer islands to the agricultural/food sector is limited by a
number of major constraints which represent the major challenges:
Transport and communications links are semi‐regular with the capital island of
Rarotonga for the other southern islands and far less developed with the northern
group of islands. All islands have to transit through Rarotonga in case of international
trade and exchanges. Agricultural development is thus fully dependant on the local
subsistence farming activities and imports from Rarotonga.
Tourist developments have increased the demand of food which in part is provided
locally. But short and local supply chains and networks need to be developed and
strengthened to ensure consistency in quantities and quality. Few local ventures exist at
present to do so within the outer islands.
Good farm land (class one) is available mostly in the Southern islands, whereas
northern islands farm land is classified as class two (‘tree crops only’).
Water resources are distributed more unevenly; reasonably abundant on Rarotonga and
limited (other southern islands) to very limited (all northern islands/atolls).
Population has declined gradually and outer islands experience significant seasonal
and temporary migration either to the main island of Rarotonga or to New Zealand and
Australia.
Atiutaki fruit orchard and agri‐linking to island tourism
The sheltered Aitutaki lagoon and its pristine beaches make it an ideal destination for sea and water related
tourism activities. The soil is rich in minerals and has been well shielded from insecticides and other
chemicals, so far. This therefore becomes an ideal condition for farming. Historically taro, arrowroot,
banana, pawpaw, tomatoes, cabbage, noni have been the local crops. The intent of the local growers to export
out of the island has been limited by operation glitches including the BQA protocols for export. Our plan is
to use the richness of the soil to produce exotic fruits for local consumption.
There is a regular stream of tourists coming into the island. We want them to taste paradise. Todayʹs
traveler is more demanding than ever, wanting something new and exotic. The health conscious traveler is
willing to pay a premium for the unusual, the exotic and the highest quality produce.
With cruise ships also docking at the island regularly there is good scope to produce fruits such as Mango,
Avocado, Pineapple, Durian, Abiu, Rambuta, Lychee and others; Production will be consumed locally, thus
saving us the cost of exporting them out of the island.
We intend to use the rustic nature of the island and build a farm that will be a tourist destination. This farm
will set a landmark activity and we hope to demonstrate to the local community that we, who are from the land,
can develop a financially rewarding venture and we hope that this will encourage more of the young Aitutakians
to return to their homeland.
Fresh Fruit Farm in Aitutaki – Pr o po s a l t o FAO t r us t fun d – 20 1 4 ‐ Ta a n ga r a Maa o , Ir o n ui Moa t e & Brian Paxtor

Cook Islands Agricultural & Food Sector ‐ After MDG Vision
Draft – January 2015
22
Production wise (see sections 1.2 and more detailed data in Appendix 3), compared to
Rarotonga,
Other southern islands are: (i)
a major reservoir of livestock
(pigs, poultry and goats); (ii)
important producers of taro
and cassava; and (iii) engaged
presently in producing the
following major tree crops
(coconuts, noni, mango,
banana and coffee), and the
following major vegetable
crops (melons, tomato,
pineapple). These islands had in the past major monoculture citrus/tropical fruit
plantations regularly exporting to New Zealand through Rarotonga.
The northern islands have little or no livestock numbers and small productions of
coconuts, bananas, mangoes and taro.
So far trade in agricultural products from the outer islands have been essentially fresh products
with little if no local value adding (thus reducing volumes and contents to transported; juicing,
jams or other fruit/vegetable preparation, slaughtering and deboning,…)
Water and infrastructure challenges are being gradually addressed through co‐funding of
islands development plans and a number of financial tools initiated by the Government (Socio‐
economic fund, government budget, …) and FTPs (GEF, UNDP, Climate change, …).
The challenge however remains to initiate a number of appropriate and sustainable supply
chains and networks, which avoid the past overspecialisation, and ensure at least consistent and
regular local outlets.
Source: 2011 Agricultural census
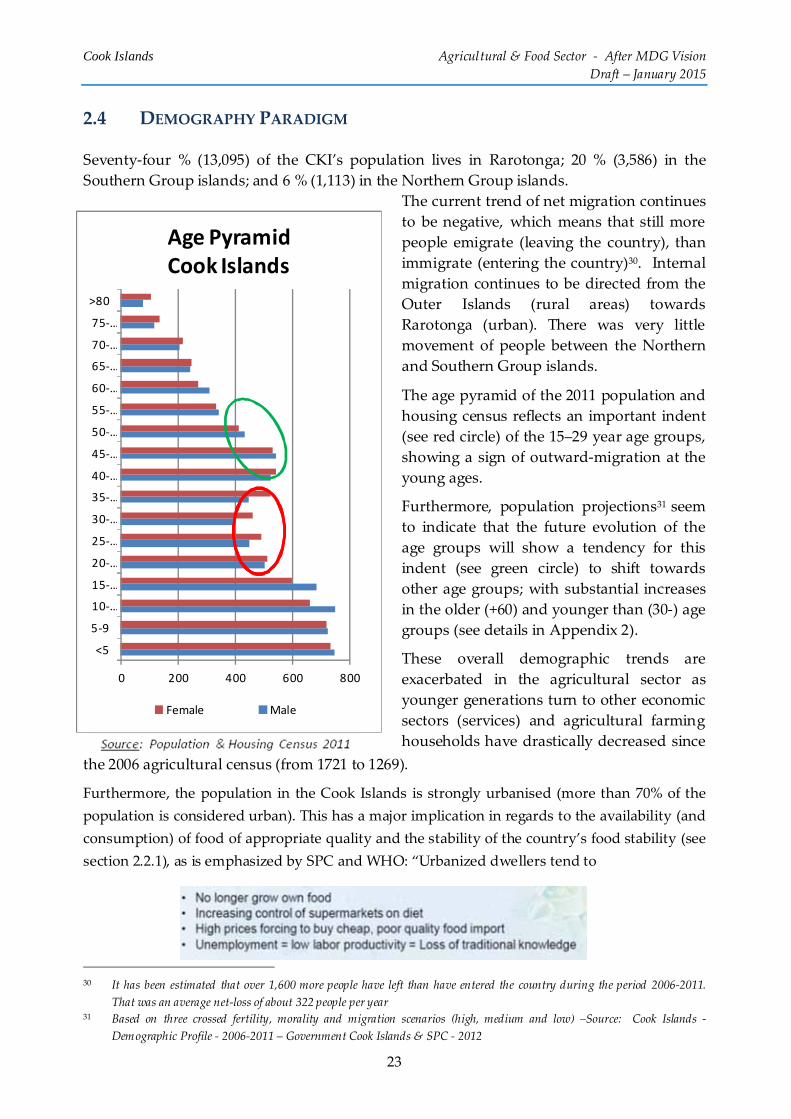
Cook Islands Agricultural & Food Sector ‐ After MDG Vision
Draft – January 2015
23
2.4 DEMOGRAPHY PARADIGM
Seventy‐four % (13,095) of the CKI’s population lives in Rarotonga; 20 % (3,586) in the
Southern Group islands; and 6 % (1,113) in the Northern Group islands.
The current trend of net migration continues
to be negative, which means that still more
people emigrate (leaving the country), than
immigrate (entering the country)30. Internal
migration continues to be directed from the
Outer Islands (rural areas) towards
Rarotonga (urban). There was very little
movement of people between the Northern
and Southern Group islands.
The age pyramid of the 2011 population and
housing census reflects an important indent
(see red circle) of the 15–29 year age groups,
showing a sign of outward‐migration at the
young ages.
Furthermore, population projections31 seem
to indicate that the future evolution of the
age groups will show a tendency for this
indent (see green circle) to shift towards
other age groups; with substantial increases
in the older (+60) and younger than (30‐) age
groups (see details in Appendix 2).
These overall demographic trends are
exacerbated in the agricultural sector as
younger generations turn to other economic
sectors (services) and agricultural farming
households have drastically decreased since
the 2006 agricultural census (from 1721 to 1269).
Furthermore, the population in the Cook Islands is strongly urbanised (more than 70% of the
population is considered urban). This has a major implication in regards to the availability (and
consumption) of food of appropriate quality and the stability of the country’s food stability (see
section 2.2.1), as is emphasized by SPC and WHO: “Urbanized dwellers tend to
30 It has been estimated that over 1,600 more people have left than have entered the country during the period 2006‐2011.
That was an average net‐loss of about 322 people per year 31 Based on three crossed fertility, morality and migration scenarios (high, medium and low) –Source: Cook Islands ‐
Demographic Profile ‐ 2006‐2011 – Government Cook Islands & SPC ‐ 2012
0 200 400 600 800
<5
5‐9
10‐…
15‐…
20‐…
25‐…
30‐…
35‐…
40‐…
45‐…
50‐…
55‐…
60‐…
65‐…
70‐…
75‐…
>80
Age Pyramid Cook Islands
Female Male

Cook Islands Agricultural & Food Sector ‐ After MDG Vision
Draft – January 2015
24
2.5. LABOUR DYNAMICS OF THE SECTOR
According to the 2011 agricultural census a total of 1661 people are working in the agricultural
sector, of which 365 are women. (See Appendix 3 for more detailed figures), this represents 1.30
labour force per agriculture active household. More than 70 % of this labour is over 40 years
old.32 Household and non‐household members are engaged as follows:
Source: 2011 Agricultural census
Farming
labour Total
Of which
Female
Household members
Operators 1 000 71
Paid 31 13
Unpaid 543 281
Sub‐Total 1 578 365
Non ‐ Household members
Operators 30 5
Paid 35 3
Unpaid 18 3
Sub‐Total 83 11
This would suggest that the sector employs 66 paid labour (of which 14 women). Unfortunately
the census does not focus in on the specific 390 farming households that are engaged in farming
for sales (and of which 31 as said to be commercial farmers), and which would be those
contracting non household workers.
Paid labour is expensive as the minimum wage is set at NZ$ 6 per day and the commercial/part‐
time ‘selling’ farmers are thus the ones confronted with these high labour costs:
32 45.6% between 40 and 59 and 25.8 over 60 years old
Competition for labour from the public sector and overseas employment has significantly reduced the
availability of efficiently priced surplus labour for the intensification of agricultural production in the Cook
Islands. The cost of agricultural labour in the Cook Islands is among the highest in the Pacific Islands. Indeed,
with the minimum wage in Cook Islands having been recently increased from NZ$ 5 to NZ$ 6 per hour, wages
in the Cook Islands are comparable with developed, rather than developing countries (e.g. US federal minimum
wage of US$7.25 per hour).
Despite the high minimum wage rate, Cook Islands employers are forced to sponsor labour from overseas
(mainly from Philippines, China and Fiji) in order to take up vacant positions in industries such as tourism and
agriculture, in return for significantly higher hourly wages than the minimum and the payment of large bonds,
return airfares and other expenses. This has significantly raised the cost of agricultural labour, and labour‐
intensive agricultural production, in the Cook Islands. Furthermore, socio‐cultural factors have restricted the
use of foreign workers for agricultural ventures on some outer islands
Linking farmers to Markets
FAO ‐ 2014

Cook Islands Agricultural & Food Sector ‐ After MDG Vision
Draft – January 2015
25
According to the 2011 population and housing census labour monograph’s agricultural sector
snapshot there were 15 foreign workers engaged by the sector (3 from New Zealand, 3 from Fiji,
2 from the Philippines and 7 of other ethnic groups).
The major constraint facing the agricultural sector is that most young people are escaping
agriculture, preferring other employments or migration. They do not view it as an ‘innovative”,
“actual” and interesting income generating activity. It is mostly associated with risks and
viewed as traditional/older generation’s activity. Farming is not seen as a small scale business
and remains driven by ‘production’ as opposed ‘value chain or supply chain’ driven.
LACK OF CONTRACT/ASSOCIATIVE FARMING TRADITION
One often advocated way forward for the agricultural sector is to engage in ‘associative’ forms
of collaboration between farmers. Cook Islands experience with farmers’ associations is rather
limited and needs to be revisited. There have been a number of village level associations which
were basically set‐up on a demand driven approach, i.e. to access equipments (tractors, …) or
specific services (inputs, seeds, …). Most are not business driven and are ineffective in
developing common development plans or promoting grouped contract farming arrangements
with the hospitality sector or SME value‐adding businesses.
There have been a number of recent initiatives to revitalise associations: (i) supporting the
Titikaveka Growers Association (TGA); (ii) launching a Rarotonga fruit growers association
(recently started and still in the formalization process; (iii) the Aroronga farmers association; …
Well run, effective farmers groups/associations are an essential link to value chain and supply
networking. They need however to be more focused and to engage in activities which in time
can develop into financially viable and sustainable services to farmers (members or not).
Starting point should be engaging in a value chain/supply chain network approach, focusing
first on ensuring consistent quantity & quality product supply for a given market/contract/value
chain. The absence of formal and well organized farmer organizations has reduced planning
Titikaveka Growers Association (TGA)
Currently farmer organisations have been disorganised and ad hoc with only one organisation the) that has
attempted to formalise the farmers’ organisation with the main activities being:
Establishing a community compost centre over the past two years
Organizing growers in and beyond Titikaveka to choose which crops they will farm and to stick with
their selection instead as in the past of many growers jumping into the same crops, hence flooding the
market, depressing prices and ending up with a useless surplus.
Offering instruction on organic and biological farming methods to growers
Facilitating discussions with the larger retailers who are the main buyers of produce.
TGA has had limited success and remains a small organisation with a small membership; and in deer need of
business mentoring and focusing on strengthening its capacities to engage effectively in farming contracts and
ensuring group cropping planning in accordance.
In FAO trust fund proposals 2014
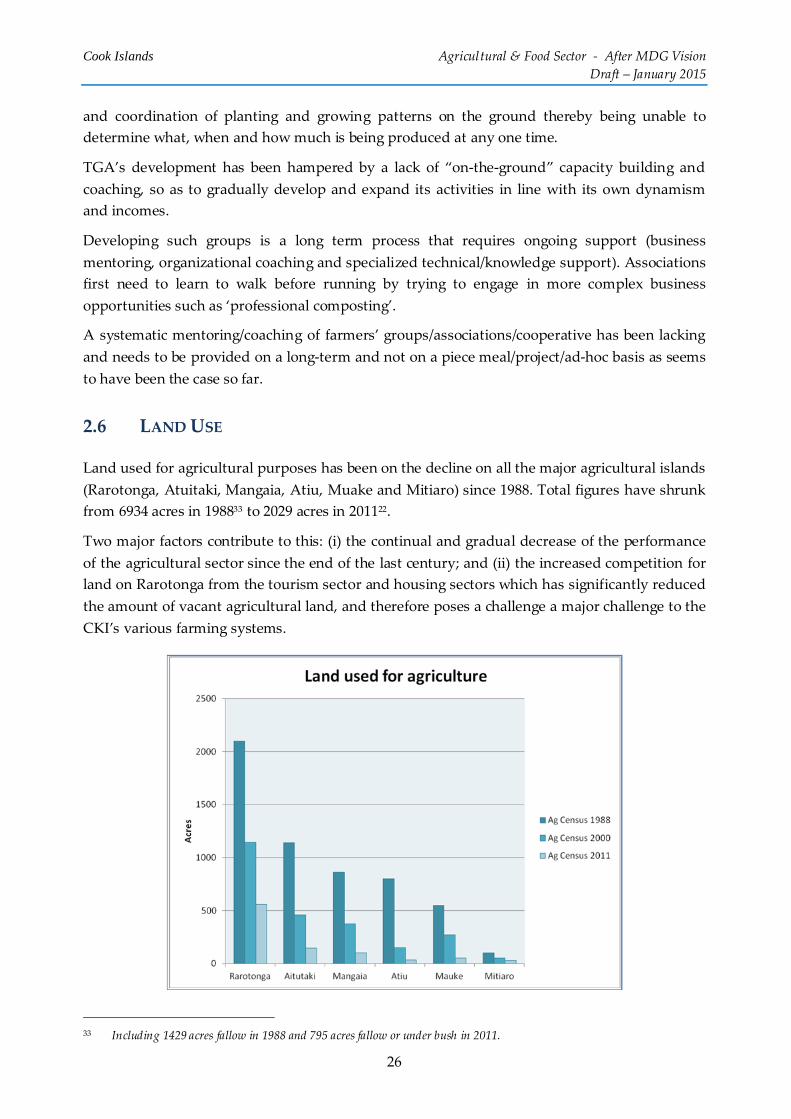
Cook Islands Agricultural & Food Sector ‐ After MDG Vision
Draft – January 2015
26
and coordination of planting and growing patterns on the ground thereby being unable to
determine what, when and how much is being produced at any one time.
TGA’s development has been hampered by a lack of “on‐the‐ground” capacity building and
coaching, so as to gradually develop and expand its activities in line with its own dynamism
and incomes.
Developing such groups is a long term process that requires ongoing support (business
mentoring, organizational coaching and specialized technical/knowledge support). Associations
first need to learn to walk before running by trying to engage in more complex business
opportunities such as ‘professional composting’.
A systematic mentoring/coaching of farmers’ groups/associations/cooperative has been lacking
and needs to be provided on a long‐term and not on a piece meal/project/ad‐hoc basis as seems
to have been the case so far.
2.6 LAND USE
Land used for agricultural purposes has been on the decline on all the major agricultural islands
(Rarotonga, Atuitaki, Mangaia, Atiu, Muake and Mitiaro) since 1988. Total figures have shrunk
from 6934 acres in 198833 to 2029 acres in 201122.
Two major factors contribute to this: (i) the continual and gradual decrease of the performance
of the agricultural sector since the end of the last century; and (ii) the increased competition for
land on Rarotonga from the tourism sector and housing sectors which has significantly reduced
the amount of vacant agricultural land, and therefore poses a challenge a major challenge to the
CKI’s various farming systems.
33 Including 1429 acres fallow in 1988 and 795 acres fallow or under bush in 2011.
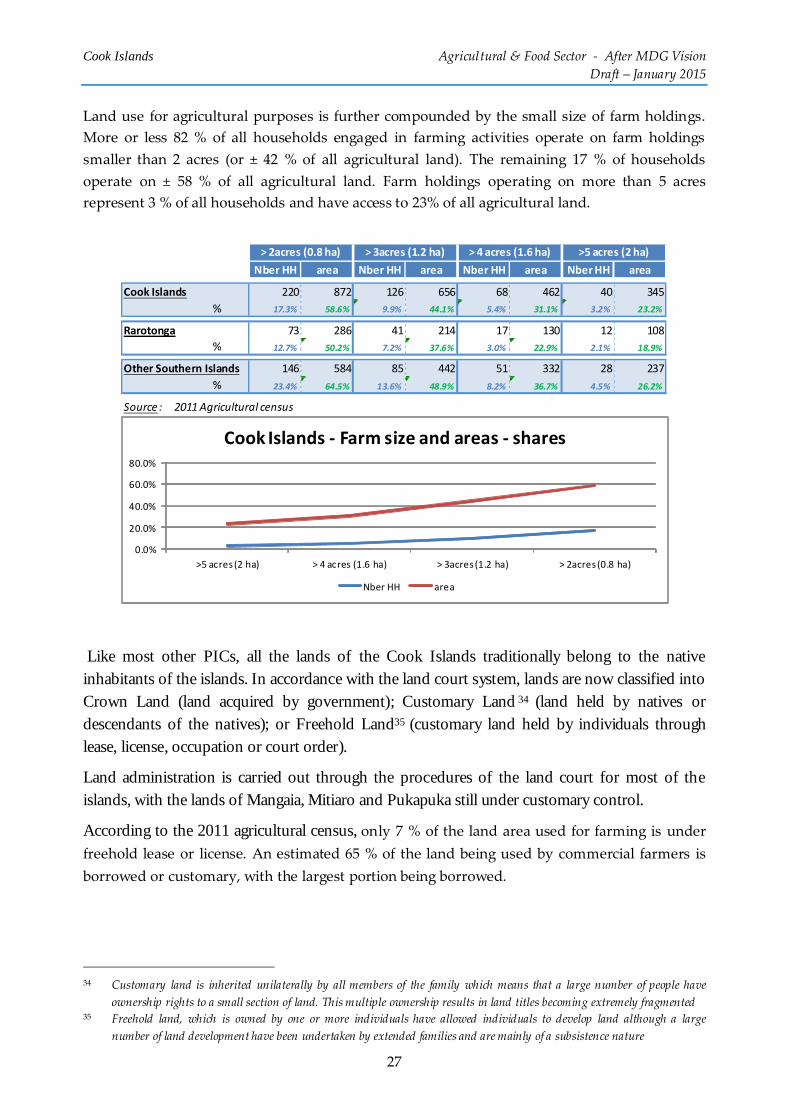
Cook Islands Agricultural & Food Sector ‐ After MDG Vision
Draft – January 2015
27
Land use for agricultural purposes is further compounded by the small size of farm holdings.
More or less 82 % of all households engaged in farming activities operate on farm holdings
smaller than 2 acres (or ± 42 % of all agricultural land). The remaining 17 % of households
operate on ± 58 % of all agricultural land. Farm holdings operating on more than 5 acres
represent 3 % of all households and have access to 23% of all agricultural land.
Like most other PICs, all the lands of the Cook Islands traditionally belong to the native inhabitants of the islands. In accordance with the land court system, lands are now classified into Crown Land (land acquired by government); Customary Land 34 (land held by natives or descendants of the natives); or Freehold Land35 (customary land held by individuals through lease, license, occupation or court order).
Land administration is carried out through the procedures of the land court for most of the islands, with the lands of Mangaia, Mitiaro and Pukapuka still under customary control.
According to the 2011 agricultural census, only 7 % of the land area used for farming is under
freehold lease or license. An estimated 65 % of the land being used by commercial farmers is
borrowed or customary, with the largest portion being borrowed.
34 Customary land is inherited unilaterally by all members of the family which means that a large number of people have
ownership rights to a small section of land. This multiple ownership results in land titles becoming extremely fragmented 35 Freehold land, which is owned by one or more individuals have allowed individuals to develop land although a large
number of land development have been undertaken by extended families and are mainly of a subsistence nature
Nber HH area Nber HH area Nber HH area Nber HH area
Cook Islands 220 872 126 656 68 462 40 345
% 17.3% 58.6% 9.9% 44.1% 5.4% 31.1% 3.2% 23.2%
Rarotonga 73 286 41 214 17 130 12 108
% 12.7% 50.2% 7.2% 37.6% 3.0% 22.9% 2.1% 18.9%
Other Southern Islands 146 584 85 442 51 332 28 237
% 23.4% 64.5% 13.6% 48.9% 8.2% 36.7% 4.5% 26.2%
Source : 2011 Agricultural census
> 2acres (0.8 ha) > 3acres (1.2 ha) > 4 acres (1.6 ha) >5 acres (2 ha)
0.0%
20.0%
40.0%
60.0%
80.0%
>5 acres (2 ha) > 4 acres (1.6 ha) > 3acres (1.2 ha) > 2acres (0.8 ha)
Cook Islands ‐ Farm size and areas ‐ shares
Nber HH area

Cook Islands Agricultural & Food Sector ‐ After MDG Vision
Draft – January 2015
28
.
The proliferation of use rights to customary land among both resident and non‐resident Cook
Islanders has made it extremely difficult for commercial farmers to obtain leases for tracts of
agricultural land of a size sufficient to obtain scale efficiencies from investment in broad
acre, mechanized farming systems. In addition, the incentive for commercial farmers to
invest their own resources to improve and develop borrowed land is significantly diminished,
given the high rate of risk that the owner could reclaim the land without paying them
compensation.
Whilst government recognizes the need for the introduction of legislation to address the
impact of rapid demographic and socioeconomic change on land ‐ such as the implementation
of recommended procedures to address land fragmentation, absentee ownership and land
development1; and negotiating long‐term lease arrangements with off‐shore landowners in
order to establish a land‐bank to open up to investors 1 ‐ these policy reforms will be
politically difficult to achieve. Consequently, the facilitation of investment in land saving
agricultural systems, such as hydroponics and covered agriculture, is critical to improving
the competitiveness of the industry.
Linking farmers to Markets
FAO ‐ 2014
Agricultural census 1988 ‐2000 ‐2011

Cook Islands Agricultural & Food Sector ‐ After MDG Vision
Draft – January 2015
29
2.7 CAPITAL & BUSINESS ENVIRONMENT
The capital and business environment for the agricultural sector is described as follwos in the
previous FAO ‐ CKI mission’s report: “linking farmers to markets”:
Loans and interst rates: The high rate of interest charged on loans to the agriculture sector –
16.5 % for unsecured loans – is a significant barrier to the adoption of land and labour saving
technology (hydroponic and drip irigation systems, coverings, tractors and trailer
attachments), particularly for very small and small‐sized farmers. The Bank of Cook Islands
(BCI), in partnership with the Business Trade Investment Board (BTIB) have already gained
experience of providing low interest loan products for the agriculture sector albeit at a mico‐
finance level.
Availability of a suitable loan product (finance in the range of NZ$ 5 to 50,000 for the
purchase of capital equipment, with maximum interest rate of 5 %) targeted at proven
agriculture sector borrowers who have a viable business plan, and who are supported by
business mentoring services and technical assistance on new technologies, would be an
important catalyst for agribusiness development.
Business Environment. In order to assist financial institutions identify loan applicants in the
agriculture sector suitable for financing, it is important to provide them with information
tools to improve their capacity to calculate the profitability of agribusiness applications, and
estimate likely rates of repayment. Similarly, in order to encourage stakeholders in the
agriculture sector to invest in increasing production and productivity, it is essential to help
them identify commodities offering the best rates of return on investment36.
Given the experience of the BTIB in identifying profitable enterprises in the Cook Islands and
helping them to prepare farm business plans, it is critical that they work alongside
agriculture sector stakeholders to identify a series of ‘best bet’ agribusiness enterprises and
loan applicants to make first use of the low interest loan, in order to ensure the sustainability
of the fund. The support of the Tourism Industry Council should be sought to help identify
36 Consequently, a priority for the Ministry of Agriculture should be the production of a Farm Manual containing
calculations of Gross Margins for the production of the full range of commercial fruit and vegetable crops. These margins
should include some sensitivity analysis in order to enable calculation of profitability for the full range of different input
and output prices commonly experienced in the Cook Islands, in order to enable calculation for both peak and off‐season,
and allow for fluctuations in input prices
Agricultural Development Loan
The Business Trade and Investment Board has worked previously with the Bank of Cook Islands and the
Ministry of Agriculture to provide a small stimulus loan (NZ$ 3,000 at 5% interest, payable within 12‐
months) to 31 farmers in the Cook Islands. Despite the limited period within which loans were to be repaid,
BTIB/BCI received full repayment on 80% of the loans.
The performance of these loans was therefore only slightly less than the average 85% rate of repayment
experienced with mortages in the Cook Islands. Implementation of this scheme has also provided BCI with
good background credit information on members of the agriculture sector which will help them select clients
for future loans.

Cook Islands Agricultural & Food Sector ‐ After MDG Vision
Draft – January 2015
30
dedicated buyers in the tourism industry, and therefore increase the security of agribusiness
loans.
In order to ensure the sustainability of investments in the agricultural sector, it is critical to
ensure that successful loan applicants have ongoing access to technical support on business
planning and modern farming methods. Applicants should also have access to technical
support from agribusinesses overseas that have experience of incorporating these
technologies into a profitable agribusiness. The Chamber of Commerce (CC) is currently
implementing a business mentoring programme (with support from New Zealand) and
would be keen to see this extended to the agriculture sector37.
Income Taxes and VAT. Reducing the tax burden on the primary sector will also encourage
a higher level of investment. In the recent past the government have promoted investment in
tourism in the outer islands by making capital asset investments 100% depreciable over 2‐3
years, allowing operators to reduce their tax payments in the first years after their initial
investment, when repayments on a loan are highest. This same model could also be used to
reduce the tax burden for the primary sector, which in many countries in the Pacific region is
exempt from taxes. Tax holidays may also be considered for agribusinesses that make
significant capital investments over a prescribed threshold level. This would encourage
investment in the adoption of production technologies which increase off‐season supply, as
well as processing technologies which will help to provide a market for second grade fruit
and vegetable products during periods of oversupply.
Furthermore there is no specific primary sector VAT rate; like almost all other Pacific
Islands CKI implements a single VAT rate system, unlike Australia which has a dual rate
system. Considering such a dual system for formal commercialized primary agricultural
products might also contribute to reducing the tax burden.
37 Personal communication Steve Anderson, President Cook Islands Chamber of Commerce

Cook Islands Agricultural & Food Sector ‐ After MDG Vision
Draft – January 2015
31
2.8 HEALTH AND NCD
With the declaration of the “Non Communicable Diseases (NCD) Crisis” at the Pacific Island
Forum by the pacific leaders in 2011,38 efforts to address NCDs have been intensified in the
Cook Islands with increasing national attention and commitment. 39 (See more details in
Appendix 7) NCDs represent a growing burden in the Cook Islands which subsequently
challenges its healthcare system and resources (infrastructure, human, laboratory and
pharmacy.) There are 3 725 patients currently registered in the Ministry of Health’s NCD
registry. The prevalence and incidence of NCD were respectively 2.1 % and 26% in 2012.
Overall, 79% of deaths were due to NCDs. 40
Critical NCD risk factors41 are: (i) tobacco smoking,
(ii) physical inactivity, (iii) alcohol misuse and (iv)
unhealthy diet (low consumption of fruits and
vegetables, high salt, sugar and fat).
The 2011 STEPS report indicates that 61.4% of the
population were obese (BMI ≥ 30kg/m2), 43.9% were
current smokers, 62.9% were current alcohol
drinkers at the time of the survey.; an estimated
33.2% of the population had raised blood pressure42,
23.6% had raised fasting blood glucose (≥6.1mmHg)
and an astounding 75/2% had elevated total blood
38 Pacific NCD Crisis. SPC Secretariat of the Pacific Community and World Health Organization. Noumea. Sept 2011 39 The Cook Islands Te Kaveinga Nui National Sustainable Development Plan 2011 – 2015. 40 Cook Islands NCD Risk Factors STEPS Report. Te Marae Ora Ministry of Health, World Health Organisation. 2011 41 These risks are increasing as a result of climate change and development impacts. For example, modern lifestyles typically
result in less physical activity at home and at work; while climate change is already affecting the food, the water and
environments. 42 Systolic blood pressure ≥140mmHg and/or diastolic blood pressure ≥90mmHg
100%
80%
60%
40%
20%
Tobacco (15 year +)
Physical Inactivity (15 year +)
Overweight (20 year +)
Obesity (20 year +)
% o
f p
op
ula
tio
n
Source: SPC - Country HIES (2008)
PREVALENCE OF NCD KEY RISK
FACTORS IN CKI
Chips before pawpaw:
Cook Islanders lose taste for healthy, local food
“When I was a kid,” says Tupou, a farmer on the Cook Islands,
“we ate mostly fresh fish and tomatoes, pawpaw, and taro. … “I
know lots of people who prefer takeaways rather than cooking
anything. I think that’s why there’s a lot of diabetes and all
that,” Tupou adds. Food on the islands is making many of the
islanders sick…
The traditional diet, like Tupou’s, has been replaced by imported,
often calorie‐rich and nutrient‐poor processed foods and sugary
drinks. With the boutique resorts have come western‐style fast‐
food outlets where islanders spend their wages and, as tourism
has blossomed, so has obesity ….
A recent ministry of health school survey here found that 24% of
girls and 34% of boys are obese.
Extracts from The Guardian September 2, 2014

Cook Islands Agricultural & Food Sector ‐ After MDG Vision
Draft – January 2015
32
cholesterol level exceeding 5.0mmol/L.28
Even if food is not the only cause of the NCD crisis, it remains a crucial contributor, as
unhealthy diets or ‘chips before pawpaw’ directly challenge the vision of what food and which
agriculture is to be pursued in the CKI. Healthy diets and quality of life depends directly on the
production of locally available quality food products made from healthy farm products.
2.9 ENVIRONMENT AND CLIMATE CHANGE
The agricultural sector in the CKI operates in a sensitive environmental environment and will
need to prepare itself to cope with the longer‐term effects of climate changes. Most
environmental projects and climate change programmes envisaged in the CKI are based on the
assumption that the CKI will engage in a sustainable agriculture. At present the prevailing
monoculture/plantation type agricultural system is a high input driven model which has major
impacts on the environment and is directly impacted by the on‐going climate changes.
2.9.1 Environmentalimpact
Although the Cook Islands are isolated and only have a total land area of 23,990 hectares, the
terrestrial landscape supports high ecosystem diversity and endemism.
The biodiversity of the different islands is rich in plants and animals which generations of Cook
Islanders have used to sustain their culture. It is this diversity of plants and animals that needs
to be conserved and that is a major global environmental concern. Despite degradation of
various habitats in the Cook Islands, it is not the case that a great number of species have
become extinct or extirpated. There are 25 threatened coral species, 8 threatened fish species, 3
marine turtle species, 3 threatened whale species, 8 threatened land bird species, 11 threatened
plants, one tree snail, one skink and one threatened seabird.
These island ecosystems are increasingly exposed to anthropogenic impacts that threaten this
biodiversity, such as deficient land conversion, pollution, poorly treated wastewater releases,
invasive species, overexploitation (freshwater, fisheries, etc.), agricultural practices, habitat loss
Coral reefs encircle all nine islands and these are separated by the pelagic ecosystem. Seamount
ecosystems exist within the park. A variety of tropical forest ecosystems exist on the islands,
including littoral forests, the Rarotonga montane rainforest, Rarotonga cloud forest, and
makatea forest on the upraised limestone islands. Wetland ecosystems include streams,
swamps and lakes. Unlike most tropical island environments, there are no mangrove or
seagrass ecosystems in the Cook Islands.
The biodiversity of the Cook Islands is critical to the health and wellbeing of the local
population. Cook Islanders have depended on the terrestrial and marine ecosystems to sustain
themselves and their culture over more than 1,500 years, and the importance of the nation’s
biodiversity is present in every facet of a Cook Islander’s way of life, including the provision of
various natural resources for food, shelter, medicinal and traditional purposes. In addition,
biodiversity sustains offshore fisheries, which is the second largest contributor to the economy
after tourism. In Cook Islands Biodiversity Strategy & Action Plan ‐ 2002
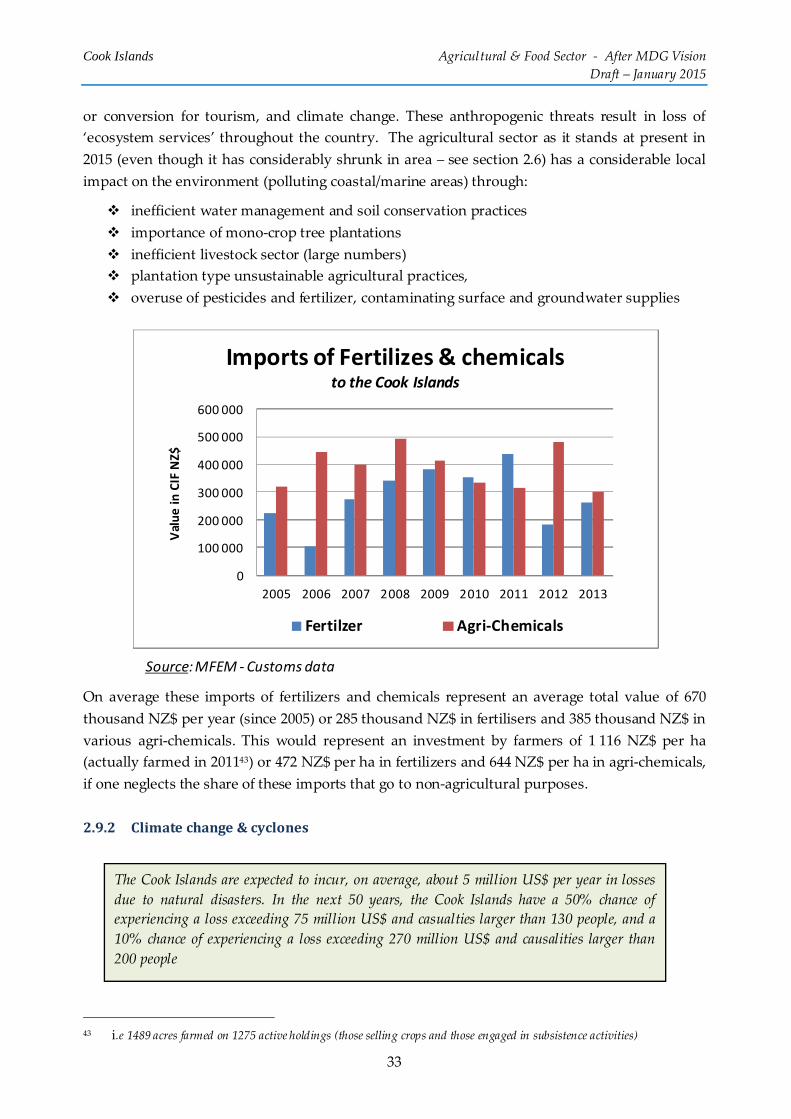
Cook Islands Agricultural & Food Sector ‐ After MDG Vision
Draft – January 2015
33
or conversion for tourism, and climate change. These anthropogenic threats result in loss of
‘ecosystem services’ throughout the country. The agricultural sector as it stands at present in
2015 (even though it has considerably shrunk in area – see section 2.6) has a considerable local
impact on the environment (polluting coastal/marine areas) through:
inefficient water management and soil conservation practices
importance of mono‐crop tree plantations
inefficient livestock sector (large numbers)
plantation type unsustainable agricultural practices,
overuse of pesticides and fertilizer, contaminating surface and groundwater supplies
On average these imports of fertilizers and chemicals represent an average total value of 670
thousand NZ$ per year (since 2005) or 285 thousand NZ$ in fertilisers and 385 thousand NZ$ in
various agri‐chemicals. This would represent an investment by farmers of 1 116 NZ$ per ha
(actually farmed in 201143) or 472 NZ$ per ha in fertilizers and 644 NZ$ per ha in agri‐chemicals,
if one neglects the share of these imports that go to non‐agricultural purposes.
2.9.2 Climatechange&cyclones
43 i.e 1489 acres farmed on 1275 active holdings (those selling crops and those engaged in subsistence activities)
0
100 000
200 000
300 000
400 000
500 000
600 000
2005 2006 2007 2008 2009 2010 2011 2012 2013
Value in
CIF NZ$
Imports of Fertilizes & chemicalsto the Cook Islands
Fertilzer Agri‐Chemicals
Source: MFEM ‐ Customs data
The Cook Islands are expected to incur, on average, about 5 million US$ per year in losses
due to natural disasters. In the next 50 years, the Cook Islands have a 50% chance of
experiencing a loss exceeding 75 million US$ and casualties larger than 130 people, and a
10% chance of experiencing a loss exceeding 270 million US$ and causalities larger than
200 people
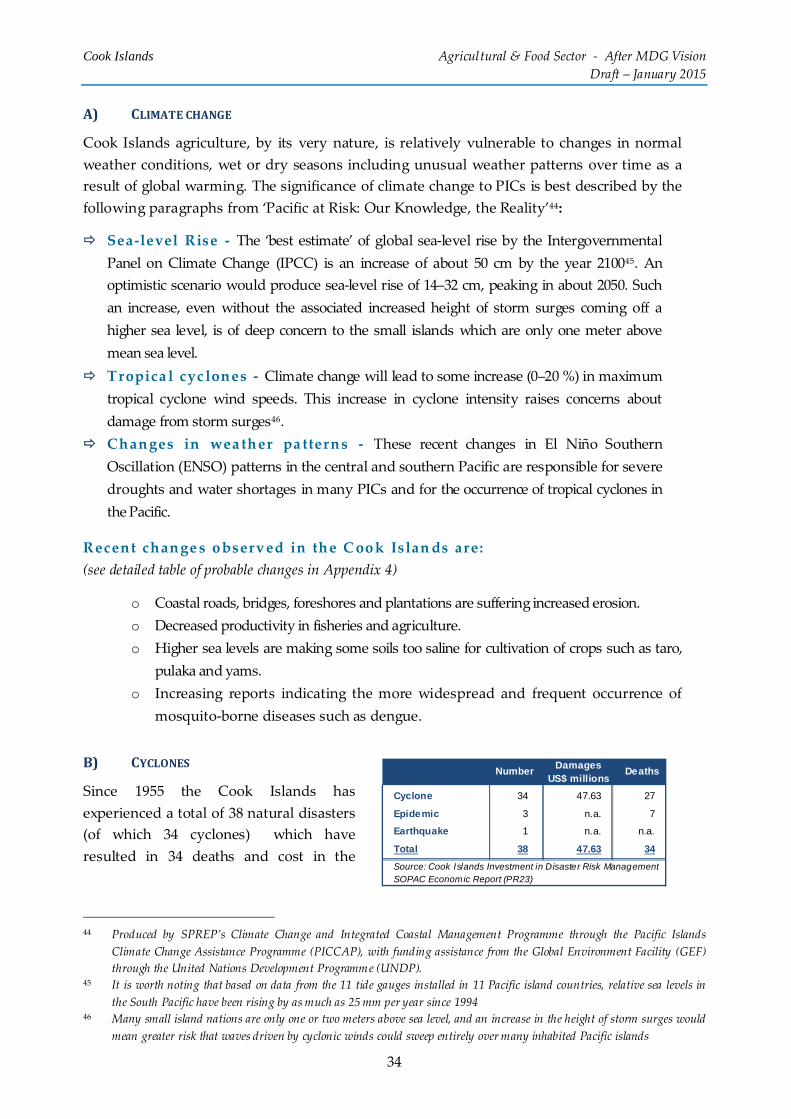
Cook Islands Agricultural & Food Sector ‐ After MDG Vision
Draft – January 2015
34
A) CLIMATECHANGE
Cook Islands agriculture, by its very nature, is relatively vulnerable to changes in normal
weather conditions, wet or dry seasons including unusual weather patterns over time as a
result of global warming. The significance of climate change to PICs is best described by the
following paragraphs from ‘Pacific at Risk: Our Knowledge, the Reality’44:
Sea‐level Rise ‐ The ‘best estimate’ of global sea‐level rise by the Intergovernmental
Panel on Climate Change (IPCC) is an increase of about 50 cm by the year 210045. An
optimistic scenario would produce sea‐level rise of 14–32 cm, peaking in about 2050. Such
an increase, even without the associated increased height of storm surges coming off a
higher sea level, is of deep concern to the small islands which are only one meter above
mean sea level.
Tropica l cyc lones ‐ Climate change will lead to some increase (0–20 %) in maximum
tropical cyclone wind speeds. This increase in cyclone intensity raises concerns about
damage from storm surges46.
Changes in weather pa tterns ‐ These recent changes in El Niño Southern
Oscillation (ENSO) patterns in the central and southern Pacific are responsible for severe
droughts and water shortages in many PICs and for the occurrence of tropical cyclones in
the Pacific.
Recent changes observed in the Cook Islands are:
(see detailed table of probable changes in Appendix 4)
o Coastal roads, bridges, foreshores and plantations are suffering increased erosion.
o Decreased productivity in fisheries and agriculture.
o Higher sea levels are making some soils too saline for cultivation of crops such as taro,
pulaka and yams.
o Increasing reports indicating the more widespread and frequent occurrence of
mosquito‐borne diseases such as dengue.
B) CYCLONES
Since 1955 the Cook Islands has
experienced a total of 38 natural disasters
(of which 34 cyclones) which have
resulted in 34 deaths and cost in the
44 Produced by SPREP’s Climate Change and Integrated Coastal Management Programme through the Pacific Islands
Climate Change Assistance Programme (PICCAP), with funding assistance from the Global Environment Facility (GEF)
through the United Nations Development Programme (UNDP). 45 It is worth noting that based on data from the 11 tide gauges installed in 11 Pacific island countries, relative sea levels in
the South Pacific have been rising by as much as 25 mm per year since 1994 46 Many small island nations are only one or two meters above sea level, and an increase in the height of storm surges would
mean greater risk that waves driven by cyclonic winds could sweep entirely over many inhabited Pacific islands
NumberDamages
US$ millionsDeaths
Cyclone 34 47.63 27
Epidemic 3 n.a. 7
Earthquake 1 n.a. n.a.
Total 38 47.63 34
Source: Cook Islands Investment in Disaster Risk Management SOPAC Economic Report (PR23)
Cook Islands Agricultural & Food Sector ‐ After MDG Vision
Draft – January 2015
35
region of US$ 47.6 million, equivalent to approximately NZ$ 65.4 million47.
In 2005, over a period of five weeks, saw five tropical cyclones, four of which were category 5
(Meena 02/02/05, Nancy 10/02/05, Olaf 14/0205, Percy 25/02/05 and Rae 04/03/05) devastated the
islands causing widespread damage to infrastructure and property; losses were over NZ$35
million, representing 14% of the country’s GDP at the time. In February 2010, Tropical cyclone
Pat struck the island of Atiutaki, affecting 78 % of houses and devastating the local agriculture
sector (Cyclone Recovery Committee 2010). The recovery and reconstruction program was
estimated to cost NZ$ 9.5 million48. This equates to 4 % of GDP in current prices.
These figures identify reconstruction costs associated with damage only. They do not account
for any economic losses which would have occurred as a result of the damage caused by the
disaster. Such losses include foregone wages to the individual and loss of tax revenue to the
Government, or long‐term damage on the agricultural sector.
47 In 2005 in the 2 months February and March, cyclones Meena, Nancy, Olaf, Percy, and Rae swept the country. Four of
these cyclones reached the maximum category five rating causing massive damage to infrastructure and agriculture
(Cyclone Recovery Committee 2006). 48 This amount is for recovery and reconstruction only and does not include any estimate for loss of employment or forgone
tax revenue from the government in terms of income tax, corporate tax and VAT.
In 2005, the island of Pukapuka was completely inundated by wave surges associated with cyclone and strong
winds completely inundating the entire taro plantation areas on Pukapuka with by salt water. It took 3 years before taro could
again be reintroduced to the island ….
Salt spray which is a major threat to agriculture in the outer islands (especially on the low‐lying atolls of the Northern
Group) is not such a big problem on Rarotonga where gardens are normally established on higher grounds. They
impede crop growth and further reduce the amount of land available for crop production …
Excessive rain has resulted in the loss of some once productive agriculture lands and the flooding of plantation areas. These
areas when dried after the cyclones often become boggy and difficult to cultivate …
According to the assessment carried out by the Atiutaki Department of Agriculture, it appears that other than
fruit trees, crops such as root crops received minimal damage because they were too small. Fresh food shortages
will be a problem taking into consideration the loss of bananas and pawpaws and the supplies of many fruit
trees
In Climate Change and Food Security in Pacific Island Countries ‐ A case study in the Cook islands – FAO ‐ 2008

Cook Islands Agricultural & Food Sector ‐ After MDG Vision
Draft – January 2015
36
2.9.3 Climateriskinsurance
One major barrier to investment in agriculture sector development in the Cook Islands, is the
high rate of risk of damage to capital equipment as a result of the frequency of natural
disasters/cyclones.
In May 2011 the Cook Islands Disaster Emergency Trust Fund (CI DE‐TF) was established and
an amount of 200 thousand NZ$ was transferred from the Government’s RTF49 during the 2011‐
2012 financial year. In the budget 201/15 a further 100 thousand NZ$ has been earmarked. The
purpose of the CI DE‐TF is to enable a swift and coordinated response once a State of
Emergency or Disaster is activated. The fund is limited to emergency response as typified by
the following: deployment of Initial Damage Assessment team(s), reestablishment of essential
services such as communications, power, health, water supplies, etc. The fund is not intended
for longer‐term recovery (rehabilitation and reconstruction) which comes into play once a
Recovery Coordinator and Committee (RCC) has been appointed and a recovery plan is
approved by Cabinet.
Cook Islands joined the Pacific Catastrophe Risk Insurance Pilot in 2013 to gain insurance
coverage against earthquake, tsunami and tropical cyclone risk. This insurance scheme aims to
provide a rapid injection of funds in the event of a major disaster, to help governments manage
the immediate costs of recovery. The World Bank acts during this pilot as an intermediary
between Pacific island countries and a group of reinsurance companies, which were selected
through a competitive bidding process – Sompo Japan Insurance, Mitsui Sumitomo Insurance,
Tokio Marine & Nichido Fire Insurance and Swiss Re. The Pacific Catastrophe Risk Insurance
Pilot is part of the broader Pacific Disaster Risk Financing and Insurance (DRFI) program.
In order to provide greater security to investment in capital equipment, the government of
Cook Islands should investigate the feasbility of establishing a public‐private agricultural
insurance facility. Given that the sector which commonly experiences the highest rate of
49 The Cook Islands has a Reserve Trust Fund (RTF) which, as an ongoing policy, accrues 0.5 per cent of annual tax
revenues. This fund may be called upon during a hazardous event. In the budget 2014‐2015 , 515 thousands NZD$ is
appropriated
The Pacific Disaster Risk Financing and Insurance Program
The Pacific Disaster Risk Financing and Insurance Program builds on the Pacific Catastrophe Risk
Assessment and Financing Initiative (PDRAFI). PCRAFI is a joint initiative between the Secretariat of the
Pacific Community SPC, the World Bank, and the Asian Development Bank, with financial support from the
Government of Japan and the Global Facility for Disaster Reduction and Recovery (GFDRR).
Development of Private Disaster Risk Insurance Markets The domestic property catastrophe risk insurance markets are currently under‐developed in the South Pacific.
This activity assists in the design of disaster risk insurance products, both sovereign disaster risk insurance for
governments and disaster micro‐insurance for households and SMEs. It provides insurance companies and
other financial institutions with technical assistance to design and to implement parametric (based on size of
the event) disaster risk insurance mechanisms in the PICs.
Source: World Bank program overview , September 2011

Cook Islands Agricultural & Food Sector ‐ After MDG Vision
Draft – January 2015
37
economic losses as a result of cyclones is the agricultural sector, utilizing these funds to
establish a dedicated agricultural insurance fund could provide help facilitate greater
investment in the sector. Insurance and government risk‐sharing arrangements should increase
a banks’ level of comfort and enable them to increase their lending rates to the agricultural
sector.
2.10 AGRICULTURAL WATER AND MANAGEMENT
Water is an essential agricultural input and its availability (in quantities and consistency over
the cropping seasons) varies among the different Cook islands:
As coral atolls, islands in the Northern Group are without surface water and dependent
for supplies on the fragile fresh water lens which are subject to rapid depletion, salt
intrusion and other pollution. Individual homes traditionally depend on rainwater
stored in small containers.
The volcanic islands of the Southern Group are well supplied with good quality
drinking water and have no major problems during normal climatic conditions. On
Rarotonga and Mangaia, the springs and streams within the catchment valleys provide a
good source of agricultural water and these are already being tapped using filter bed
intake systems. On Rarotonga, water is piped from the stream catchments into the main
reticulation system, serving the majority of households (and their gardens).
On other volcanic islands of the Southern Group, adequate underground aquifers and
pumping facilities have been provided under the government’s water development
programmes..
Farming activities are usually concentrated in the foothill flatter areas and in or around
depressions or around wetland areas. Crops are exposed to regular dry spells. Surface water
catchment facilities exist but need to be rehabiliated or developed in order to intercept rain
water and store it or infiltrate it as much as possible.
Appropriate water sources should also be explored for the provision of water, particularly on
Rarotonga where treated, reticulated water may be more costly and redundant where there may
be better and more appropriate sources available (that may include tank storage from rainfall
capture or groundwater ‐ bearing in mind that standards for such sources may require
particular careful management practices).
Improved water management techniques (drip and farming systmes that favour consistent crop
coverage of the soil together with mulching and use of compost) need to be developed and
extended to farmers.
A national water policy is under preparation. This policy should provide the Government of the
CKI with a comprehensive and consistent framework for managing water resources in a
coordinated manner across all agencies and organizations with a responsibility for managing,
supplying or monitoring water.

Cook Islands Agricultural & Food Sector ‐ After MDG Vision
Draft – January 2015
38
The agricultural sector is both one of the major water users (irrigation/drainage of crops,
hydroponics, and watering of animals) and also one of the sectors directly impacting both the
water quality (pollution and chemicals) and the overall water cycle (soil and water conservation
practices). Agriculture is estimated to be the largest single sector user of water on Rarotonga
with approximately 40% of water usage attributed to agricultural and horticultural practice. .
The national water policy under preparation is articulated around 9 objectives, of which the
three following are directly related to agricultural activities:
Many issues pertaining to water rights, land issues and allocation are complicated
given the situation of customary land rights and ownership of water resources.
Essentially water resources are not explicitly owned by any one person, or the State.
In the absence legislation clarifying this situation, informed public input is necessary
at various decision making levels, which will warrant and ensure that the
management of the water resource is effective and efficient.
Developing and implementing measures for increasing awareness amongst the
population, users and the land owners is a critical factor in educating people as to the
scarce nature of water as a resource.
Objective 1 ‐ Reliable, potable water for all who reside in the Cook Islands and the establishment
of standards for water quality and resource management.
Goal 1.1 ‐ We will ensure all persons in the Cook Islands shall have access to reliable, safe and potable
drinking water. ‐ It is important to establish clear objectives regarding appropriate water quality and
provision for domestic, commercial and agricultural use of water in the Cook Islands.
Goal 1.4 ‐ We will have adequate, appropriate and reliable water for horticultural and agricultural
production ‐ Users of water at each of these sites (householders or small farmers using bores or stream
catchments) must ensure that water is protected from contamination; and will have to prepare policies
or plans to ensure their practice is consistent with standards and will not threaten the quality or
sustainability of sources for other users.
Goal 1.5 ‐ We will have Water catchment and intakes free of toxins and chemical contaminants so that
water meets appropriate standards.
Goal 1.6 ‐ We will develop appropriate water quality standards for streams, rivers and creeks such that
effluent and wastewater does not adversely and permanently affect the natural environment and native
species of the Cook Islands.
Goal 1.7 ‐ We will ensure Ground water is free of chemical and artificial contaminants and free of
harmful toxins that may affect organic life. Goal 1.8 ‐ We will develop appropriate standards for lagoon water quality to ensure the preservation
and proliferation of natural lagoon marine ecology.
Water Quality Standards will identify our expectations for water quality, and management to ensure
appropriate use will be identified in water safety plans; and these policy goals will have direct implications
for land use management, solid and liquid waste management and will link to the NESAF and land
management plans aiding to set goals around management of these areas.

Cook Islands Agricultural & Food Sector ‐ After MDG Vision
Draft – January 2015
39
Objective 3 ‐ Sustainable management of both inland and coastal water resources.
Land‐based activity is a significant factor that impacts on water quality. Therefore land development must be
managed to avoid or minimise contamination or upsetting the natural balance and natural courses of water
and water sources. Relevant agencies involved in the management of these areas of regulation must work in a cooperative and collaborative manner in developing and implementing plans and actions to effectively address issues in this area. Goal 3.2 ‐ We will manage Ground water resources so as to not adversely affect the surrounding
ecology or the overall composition and ongoing sustainability of the water table.
Goal 3.3 ‐ We will manage naturally occurring rivers, streams, creeks or any water ways, temporal or
permanent such that they will neither be disturbed nor diverted.
As with the management of groundwater, the management of water and streams is significantly
impacted by the management of land.
Goal 3.4 ‐ We will ensure any man‐made diversions of or artificial water ways may not adversely affect
the surrounding natural environment or the over‐all balance of any part of the eco‐system. In the
development, management and maintenance of artificial waterways (drains, culverts, canals, etc.) it is
important that they are effectively maintained and managed and this policy is enforced.
Goal 3.5 ‐ We will manage Wetlands and estuaries such that they will not be disturbed or filled in. In
addition to this, any development or activities in wetland areas will not disturb the natural flow of the
water cycle.
Goal 3.6 We will manage all activities in lagoon areas or coastal zones such that they will not adversely
harm the marine ecology.
Goal 3.7 We will ensure maritime activities take all precautions to not pollute or harm the coastal area
in which it is commuting through or where it is docked.
Most of these goals are directly related to land use management policies and practice.
Objective 5 ‐ Equitable systems for controlling demand and appropriate usage, conserving water
and minimising waste and leakages
Water conservation and the minimisation of usage and wastage are the key tenets under which the Cook
Islands will endeavour to improve its management of resources.
Agricultural Practice
Goal 5.5 We will encourage and educate farmers and growers to utilise techniques that will minimise
water use whilst maintaining or increasing crop productivity.
Goal 5.6 We will explore and utilise the most appropriate water sources and storage methods for
horticulture.
Research must be done in this area with farmers and government working hand in hand to find smarter
and more appropriate solutions in the provision of water for the agricultural and horticultural activity
throughout the country. Provisions for this should be part of the water infrastructure strategy.


Cook Islands Agricultural & Food Sector ‐ After MDG Vision
Draft – January 2015
41
2.11 CONCLUSIONS – AGRICULTURAL SECTOR IN AN AKARI
In an Akari, the agricultural sector in the Cook Islands presents a number of specific
characteristics which are summed up in the following slide:
The recent performance of the sector is disappointing as illustrated in the following slide. It
seems to be persistently focused on capturing export markets, whereas its internal food markets
and opportunities are neglected, if not totally abandoned.
Many smallholders (1275)Small size (80% farms have less than 2 acres)
Few Commercial (31) and many part-time farm holdings (359)
Tree crops dominate followed by roots crops and a small but significant vegetable sector
Important numbers of livestock (Pork, Poultry, Goat) – little formal value adding
Importance of outer islands (Aitutaki, Atiu & Mangaia) in both fruits, root crops and livestock
Reduced agricultural land area (down from ±7000 in 1988 to ± 2000 now) – challenged by a fragmented land
ownership and increased pressure on its use for tourist, economic and housing projects
Demographic paradigm – aging population and out-migration of the younger (70% farmers are older than 40)– farming does not attract younger generation – old-
fashion and not high-tec.
FOOD SECURE but > 80 % importedCKI highly urbanized (72%) and high NCD risk
Unhealthy diets
Agricultural exports down to half a million NZ$Insufficient to balance the average yearly import bill
of fertilizers and agricultural chemicals (± 700 thousand NZ$)
Import substitution opportunities limited toLivestock (3.5 million NZ$), vegetables (1.1 million NZ$ )
and tropical fruits (0.13 million NZ$)
LOCAL MARKETS fragmented and little local value adding ventures
Local supply chains poorly formalised High opportunity to develop specific ventures with hospitality sector to promote consistent supplies
LOCAL livestock sector totally abandonedPork, poultry and eggs are now fully imported
Thus underutilization of existing stocks

Cook Islands Agricultural & Food Sector ‐ After MDG Vision
Draft – January 2015
42
The agricultural sector is at present operating (see following slide) within a passive business
environment and a more and more demanding environmental framework as its direct impact
on the environment are far from negligible. There is a lot to be done to foster a better business
environment and to implement more sustainable farming practices and systems.
How to revitalize a sectordriven by part-timers ?
Inconsistency of productions ?
Lack of strategic vision ?
So from here ?????
& Other constraining policy frameworks (trade, environment, water,
land use….)

Cook Islands Agricultural & Food Sector ‐ After MDG Vision
Draft – January 2015
43
3. AGRICULTURE & FOOD STRATEGIC INTENT OR AFTER MDG VISION
To turn the sector round, it is important that all stakeholders (private and public stakeholders)
agree on three major prerequisites:
The first, which is conceptual, is that the agricultural sector is a little more complex than
just production. Agriculture is more than just an economic earning sector producing
primary inputs for others. It is a sector where many other societal elements play major
roles or interact. It concerns food, it concerns sustainable natural resources management
and it concerns quality of island life.
It requires a wide approach whereby other stakeholders need to come on board and
interact with the farming community and the Ministry of Agriculture.
The second, that will be developed in the subsequent sections, is that one needs to know
and agree on what is expected from and for this important sector; or in other words
“What agriculture does Cook Islands want”.
Before developing more detailed actions plans, policy frameworks and combining it all
into a sectoral development plan, all stakeholders need to come together on a strategic
intent, in a similar way as the tourism sector has done. This strategic intent or Vision
will need to represent a long term perspective, as many elements of such a Vision will
need time and energy to materialise. This in turn requires a wide national commitment
involving the present legislature, but also the future ones.

Cook Islands Agricultural & Food Sector ‐ After MDG Vision
Draft – January 2015
44
Based on the field work, contacts and round tables organized in November 2014, a
Vision, called after MDG, will be presented hereafter for discussion.
The third derives from the simple finding that this is not the first attempt at revitalizing
the sector. Several other missions and reports have all more or less highlighted the
various challenges presented in the previous section. Suggestions forward have been
made and the present vision has tried to expand on them. The major problem remains:
(i) real and pragmatic commitment to support the sector’s turn around by all
stakeholders; and (ii) who will be in the driver’s seat to impulse and mentor the
implementation of the Vision.
“A lot of the things happening today have made us continuously dependent on
foreign inputs, whether it’s agriculture or other things,” says farmers’ leader
Teava Iro, who argues that there needs to be much more investment, otherwise
the few farmers who remain risk being locked into a cycle of dependence.
“I think development is all about empowerment
and there’s no middle ground.
Either you fund it properly or you don’t bother at all.”
Extracts from The Guardian September 2, 2014
It’s a no‐brainer really
So despite best efforts for over a decade, Pacific Resort at Muri is meeting only 16% ‐ by value
‐ of its food needs from local growers; local fishermen get about 7% of the food budget. On
Aitutaki the percentages are slightly higher with the growers on 20% and the fishermen on
10%.
So out of an annual food bill of $1.2million about $300‐thousand goes directly into the hands
of local growers and fishermen, the rest goes offshore via local importers. Greg Stanaway the
CEO of the Pacific Resort Hotel Group says he would really like to see far more product from
locals. He says local foods are fresher and more nutritious. With greater and more regular
supplies he would make a feature of the local food in the resorts restaurants…
There is huge potential for the fledging agriculture industry to supply fresh produce – including
juices ‐ to the local market, not just for the visitors, but to locals as well. And that by replacing a
lot of the imported processed foods and things like soft drinks, the country would save overseas
funds and end up with better health outcomes too by eating healthier tucker…
Ramping up local food production will provide jobs, better food and juices for the visitors and
the locals, and much healthier outcomes for locals too. Healthier food, healthier outcomes, local
food for tourists, fewer imports and jobs too – they all seem like no‐brainers really…
Agriculture needs a ‘champion’ a leader, is there anyone waiting in the wings?
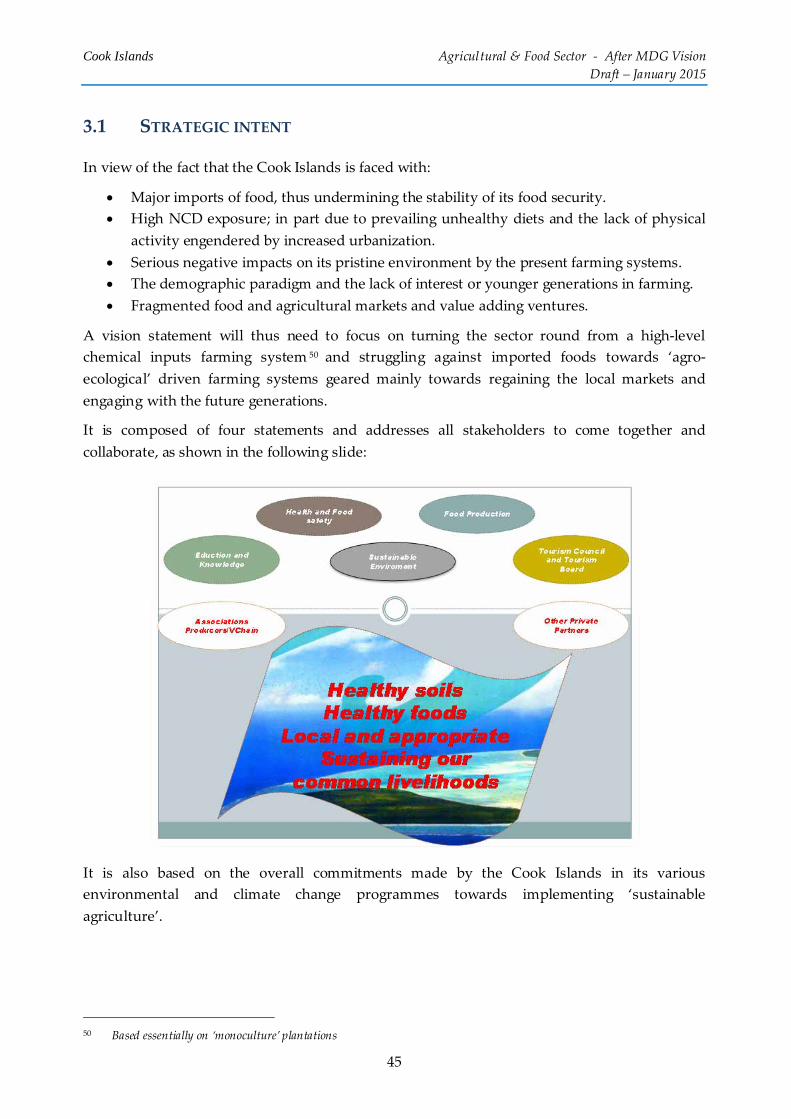
Cook Islands Agricultural & Food Sector ‐ After MDG Vision
Draft – January 2015
45
3.1 STRATEGIC INTENT
In view of the fact that the Cook Islands is faced with:
Major imports of food, thus undermining the stability of its food security.
High NCD exposure; in part due to prevailing unhealthy diets and the lack of physical
activity engendered by increased urbanization.
Serious negative impacts on its pristine environment by the present farming systems.
The demographic paradigm and the lack of interest or younger generations in farming.
Fragmented food and agricultural markets and value adding ventures.
A vision statement will thus need to focus on turning the sector round from a high‐level
chemical inputs farming system 50 and struggling against imported foods towards ‘agro‐
ecological’ driven farming systems geared mainly towards regaining the local markets and
engaging with the future generations.
It is composed of four statements and addresses all stakeholders to come together and
collaborate, as shown in the following slide:
It is also based on the overall commitments made by the Cook Islands in its various
environmental and climate change programmes towards implementing ‘sustainable
agriculture’.
50 Based essentially on ‘monoculture’ plantations

Cook Islands Agricultural & Food Sector ‐ After MDG Vision
Draft – January 2015
46
3.2 THE FOUR KEY ELEMENTS OF THE STRATEGIC INTENT
To implement the four key elements of the strategic intent or vision, a number of new
approaches or major issues will need to guide the various objectives and activities that will form
part of the future sector action plan(s).
3.2.1 Healthysoils&Healthyfoods
Healthy soils and healthy foods are
two key elements of the Vision that
go hand in hand.
They both imply greater care to the
way in which food is produced and
processed. The starting point
however lies in addressing the soils
and the farming techniques. Usage
of high rates of chemicals and
fertilizers need to be brought under
control and radically reduced, if not
banned.
Agro‐ecological farming practices
and systems need to be pursued in
the CKI with determination, as a
major approach to fulfil the
country’s commitment in the Reef to
AGRO‐ECOLOGY
Agro‐ecology refers to a range of agronomic techniques, including
intercropping, the recycling of manure and food scraps into
fertilizers, and agroforestry, that reduce the use of external inputs
and maximize resource efficiency... It enhances soils productivity
and protects the crops against pests by relying on the natural
environment such as beneficial trees, plants, animals and insects,…
Diverse farming systems contribute to more diverse diets for the
communities that produce their own food, thus improving
nutrition….
Olivier de Schutter, former UN Special Rapporteur on the right to
food
It is also an approach that generates a higher overall productivity
(at farm rather than crop level) through a diverse range of
agricultural products and environmental services, which reduce
risks of crop failure in the long term. It is concerned with farming
systems.
In Agroecology ‐ What it is and what it has to offer –
Laura Silici –IIED Issue Paper ‐ June 2014

Cook Islands Agricultural & Food Sector ‐ After MDG Vision
Draft – January 2015
47
Ridge GEF programme of “sustainably managing its productive landscape”.
Agro‐ecology is an integrated approach whereby more attention is paid to diversified cropping
systems and‐or integrated crops‐livestock systems.
More extension and adaptive research focused on developing and promoting such approaches
will need to be part of the Vision. CKI has already started with activities that have contributed
to the awareness raising of the existing soil conditions and the possibilities of integrated pest
management through soil schools and farmers’ field schools.
In Titikaveka the TGA has been engaged since a couple of years, with the initial support (now
completed) of NZAID and ARDA in composting of green waste from the Muri area. In
Arorangi, Baker Tree Services (BTS) produces basic shredded mulch from its own green waste
which farmers collect for mulching their fields.
There is however very little adaptive on‐farm research/extension going on at present in the CKI;
most agricultural research being focused on varieties and single crops. Neither TGA nor BTS
have enjoyed regular technical support that would have enabled them to strengthen their
operations and to develop a strong compost sector in the Country. With the present
abandonment of the livestock sector, the compost sector is losing one of its major local inputs.
Agro-ecological farming
Soil schools
FFS and coaching exchange
Adaptive research in response to farmers problems
Developing a performing 'compost' sector
Healthy soils1
Cook Islands Agricultural & Food Sector ‐ After MDG Vision
Draft – January 2015
48
The major challenge of the agricultural producers will be to negotiate this 180° turn around.
Specific mixes of crops, intercropping and rotations, combined agro‐forestry and composting
techniques (and formulas) all need to be developed and extended. Improving soil health and
quality will imply overall improvements in soil coverage (mulching) which in turn will lead to
improved water management and if drip irrigation and other modern shading techniques
(shade‐houses,…) are promoted will further improve the effectiveness of these modern and
more costly techniques.
Agro‐ecology is a knowledge intensive farming approach, as it implies constant observation
and interactions with networks of other practitioners.
Local organic farming trials are on‐going on some individual farms, but still need mentoring
and observation in order to contribute significantly to this turn around. All these initiatives
require support; continued coaching and the development (and agreement) on a number of
crop standards and‐or Good Agricultural Practices (GAP). These in turn should enable both
producers (commercial or part‐time farmers) to eventually receive a “differentiated” price for
their crop according to their GAP or standard; and consumers to be able to access and buy
produce that they ‘can trust’.
To develop these standards will require stakeholders to come together and engage in a
Participatory Guarantee System’s (PGS) approach. This PGS approach has been developed with
the support of SPC in various other countries and has facilitated access to small loans and credit
in the Sigatoka Valley in Fiji.
Supporting the emergence of an agro‐ecological farming model, will need to proceed hand in
hand with a more effective implementation of the chemical act and with water quality
standards (and levels of polluting agents in rivers, sources, water tables and marine areas),
when they will have been defined in the national water strategy. This will require a transitional
period during which restrictions51 will need to be gradually introduced in addition to a number
of front‐up bans (especially in the field of some agri‐chemicals).
51 Or construction layout standards for livestock, composting and other agricultural value adding/grading/storing activities
that minimize water run‐off and direct infiltration of manure, juices, or wastes.
Crop standards and GAP Develop local traditional breads/varieties Chemical act and ban Healthy food and life promotion-campaign Healthy 'gardening'
Healthy foods2
PGS aims to provide a credible guarantee to consumers seeking quality produce through direct participation of
farmers and consumers/buyers in the guarantee process. Together they define transparent, systemised decision‐
making processes sharing the responsibility for the guarantee and to verify that farmers are consistently
maintaining the standards. Trust is created through open information and peer reviews. PGS involve less formal
certification and is more flexible to producers’ and consumers’ needs/expectations.

Cook Islands Agricultural & Food Sector ‐ After MDG Vision
Draft – January 2015
49
Ensuring Healthy foods implies in addition to the standard food safety procedures in relation to
collecting, processing, preparing and distributing food products and the definition of the
abovementioned GAP or crop standards, the promotion of healthy diets and eating habits. This
will require working on:
Promoting specific NCD less risky diets and highlighting the benefits of a number of
traditional products and diets.
Conducting joint campaigns on healthy foods and NCD avoidance together with a
number of civil society associations.
Reintroducing a number of traditional crops/livestock breads in the framing systems
and ensuring that appropriate seeds and seedling techniques are available to
farmers/groups.
‘Extending’ agricultural extension beyond the group of commercial and ‘selling’
farmers’ in order to encompass small ‘hobby’ or ‘household’ gardeners and to improve
on simple gardening or box gardening techniques (equally promoting low‐input
gardening)
‘Extending’ agricultural extension to schools (using the FFS approach with some
teachers) in order to convey both agro‐ecological farming approaches and healthy diets
and quality of life to the students.
3.2.2 Smallandlocal&Sustainingthecookislanderslivelihoods
Ensuring that the engagement with healthy soils and healthy food is sustained in the long‐run
requires a concomitant engagement to fulfil the second part of country’s commitment in the
Reef to Ridge GEF programme of “taking into account food security and livelihoods”.
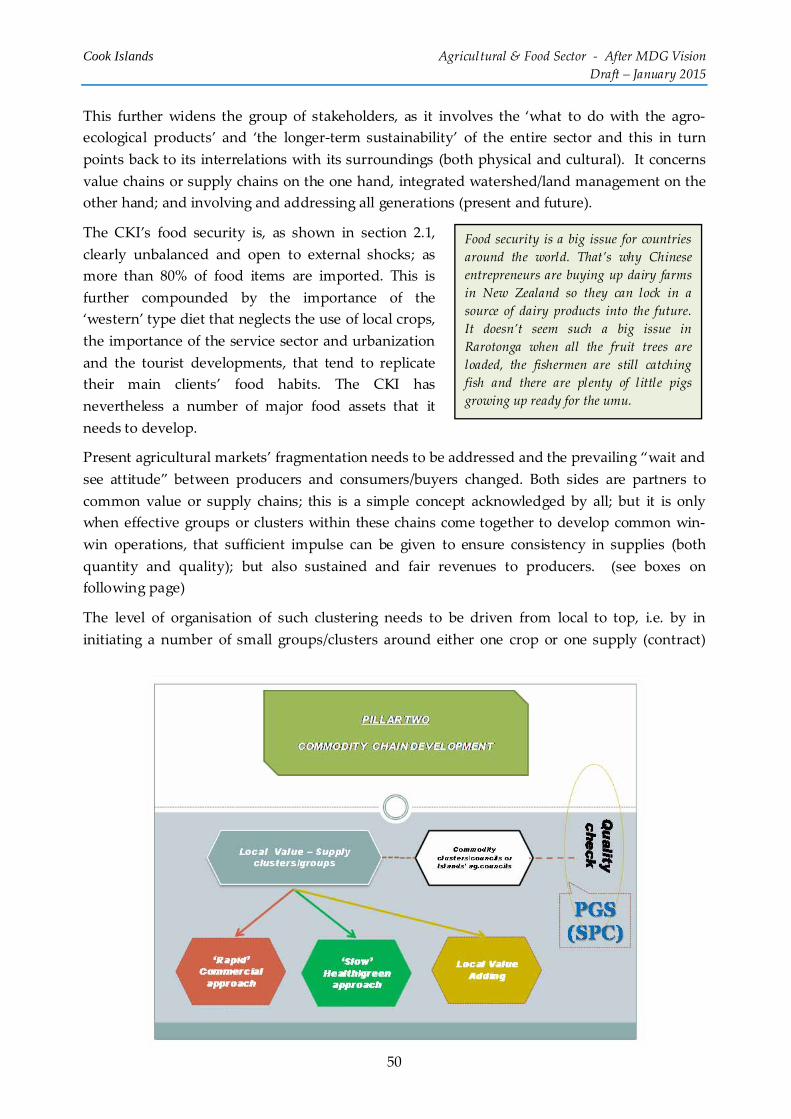
Cook Islands Agricultural & Food Sector ‐ After MDG Vision
Draft – January 2015
50
This further widens the group of stakeholders, as it involves the ‘what to do with the agro‐
ecological products’ and ‘the longer‐term sustainability’ of the entire sector and this in turn
points back to its interrelations with its surroundings (both physical and cultural). It concerns
value chains or supply chains on the one hand, integrated watershed/land management on the
other hand; and involving and addressing all generations (present and future).
The CKI’s food security is, as shown in section 2.1,
clearly unbalanced and open to external shocks; as
more than 80% of food items are imported. This is
further compounded by the importance of the
‘western’ type diet that neglects the use of local crops,
the importance of the service sector and urbanization
and the tourist developments, that tend to replicate
their main clients’ food habits. The CKI has
nevertheless a number of major food assets that it
needs to develop.
Present agricultural markets’ fragmentation needs to be addressed and the prevailing “wait and
see attitude” between producers and consumers/buyers changed. Both sides are partners to
common value or supply chains; this is a simple concept acknowledged by all; but it is only
when effective groups or clusters within these chains come together to develop common win‐
win operations, that sufficient impulse can be given to ensure consistency in supplies (both
quantity and quality); but also sustained and fair revenues to producers. (see boxes on
following page)
The level of organisation of such clustering needs to be driven from local to top, i.e. by in
initiating a number of small groups/clusters around either one crop or one supply (contract)
Food security is a big issue for countries
around the world. That’s why Chinese
entrepreneurs are buying up dairy farms
in New Zealand so they can lock in a
source of dairy products into the future.
It doesn’t seem such a big issue in
Rarotonga when all the fruit trees are
loaded, the fishermen are still catching
fish and there are plenty of little pigs
growing up ready for the umu.
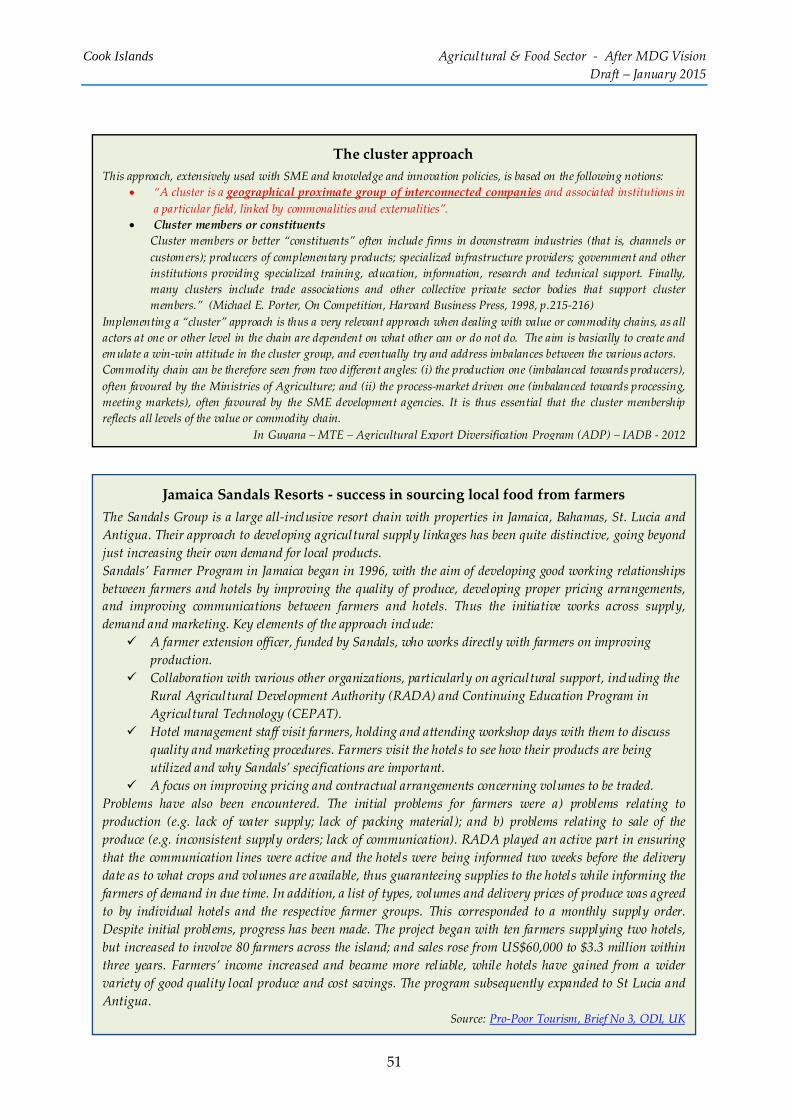
Cook Islands Agricultural & Food Sector ‐ After MDG Vision
Draft – January 2015
51
Jamaica Sandals Resorts ‐ success in sourcing local food from farmers
The Sandals Group is a large all‐inclusive resort chain with properties in Jamaica, Bahamas, St. Lucia and
Antigua. Their approach to developing agricultural supply linkages has been quite distinctive, going beyond
just increasing their own demand for local products.
Sandals’ Farmer Program in Jamaica began in 1996, with the aim of developing good working relationships
between farmers and hotels by improving the quality of produce, developing proper pricing arrangements,
and improving communications between farmers and hotels. Thus the initiative works across supply,
demand and marketing. Key elements of the approach include:
A farmer extension officer, funded by Sandals, who works directly with farmers on improving production.
Collaboration with various other organizations, particularly on agricultural support, including the Rural Agricultural Development Authority (RADA) and Continuing Education Program in
Agricultural Technology (CEPAT).
Hotel management staff visit farmers, holding and attending workshop days with them to discuss quality and marketing procedures. Farmers visit the hotels to see how their products are being
utilized and why Sandals’ specifications are important.
A focus on improving pricing and contractual arrangements concerning volumes to be traded. Problems have also been encountered. The initial problems for farmers were a) problems relating to
production (e.g. lack of water supply; lack of packing material); and b) problems relating to sale of the
produce (e.g. inconsistent supply orders; lack of communication). RADA played an active part in ensuring
that the communication lines were active and the hotels were being informed two weeks before the delivery
date as to what crops and volumes are available, thus guaranteeing supplies to the hotels while informing the
farmers of demand in due time. In addition, a list of types, volumes and delivery prices of produce was agreed
to by individual hotels and the respective farmer groups. This corresponded to a monthly supply order.
Despite initial problems, progress has been made. The project began with ten farmers supplying two hotels,
but increased to involve 80 farmers across the island; and sales rose from US$60,000 to $3.3 million within
three years. Farmers’ income increased and became more reliable, while hotels have gained from a wider
variety of good quality local produce and cost savings. The program subsequently expanded to St Lucia and
Antigua. Source: Pro‐Poor Tourism, Brief No 3, ODI, UK
The cluster approach
This approach, extensively used with SME and knowledge and innovation policies, is based on the following notions:
“A cluster is a geographical proximate group of interconnected companies and associated institutions in
a particular field, linked by commonalities and externalities”.
Cluster members or constituents
Cluster members or better “constituents” often include firms in downstream industries (that is, channels or
customers); producers of complementary products; specialized infrastructure providers; government and other
institutions providing specialized training, education, information, research and technical support. Finally,
many clusters include trade associations and other collective private sector bodies that support cluster
members.” (Michael E. Porter, On Competition, Harvard Business Press, 1998, p.215‐216)
Implementing a “cluster” approach is thus a very relevant approach when dealing with value or commodity chains, as all
actors at one or other level in the chain are dependent on what other can or do not do. The aim is basically to create and
emulate a win‐win attitude in the cluster group, and eventually try and address imbalances between the various actors.
Commodity chain can be therefore seen from two different angles: (i) the production one (imbalanced towards producers),
often favoured by the Ministries of Agriculture; and (ii) the process‐market driven one (imbalanced towards processing,
meeting markets), often favoured by the SME development agencies. It is thus essential that the cluster membership
reflects all levels of the value or commodity chain.
In Guyana – MTE – Agricultural Export Diversification Program (ADP) – IADB ‐ 2012

Cook Islands Agricultural & Food Sector ‐ After MDG Vision
Draft – January 2015
52
and in due time federating local cluster initiatives to develop and share a number of services;
such as gradually testing and developing a common quality system, based on pooling needs
and quality responses through participating clusters. Top‐down clustering does often not work,
as it then becomes similar to the ‘opportunity’ associations that come together to benefit from
an equipment or instant market opportunity.
In line with the healthy soil and healthy food approach, there are at present three possible major
lines of value‐supply chain promotion in the CKI: (See more detailed slides in Appendix 6)
4. The ‘rapid commercial’ clusters – which are driven directly as supply chains through
contract agreements combined with co‐investment (either through knowledge sharing‐
(adaptive research/extension) build up, or through direct coaching or providing
mentoring services, or through specific other investments (casings, bags, grading,…)
between a number of local producers (at village or area level, individually or as a
group/association) and one or several buyers (hospitality and‐or retailers).
There are at present in the CKI a number of pilot operations, such as the operational
framework between TGA and Pacific Resorts or the recently started operational
framework between the Atiutaki Fruit farm, Air Rarotonga Atiutaki one day tour and
the Manea Nui Plantations in Rarotonga.
5. The ‘slow health‐green’ clusters – which would aim at facilitating short circuit
deliveries and focus more on promoting ‘healthy foods‐diets’ within the local
communities and residents. This approach would need to be implemented gradually as
it first needs to build trust relationships and traditional/improved diets/cuisine using
existing or traditional crops (vegetables, roots, fruits, fish, livestock etc) will need to de
identify and redesigned. It can be implemented either through one producer for a group
Small & Appropriate
No wonder crop - no wonder industry
Supporting local business in VC-Adding
Priority to local markets (Tourism, local markets, ...)
Involving outer islands as partners
Revitalize livetsock through local quality labeled products
Favouring ad-hoc economic/financial environments
3
Linking farm to tables in Somoa
In 2012, the Poutasi Development Trust (PDT), in partnership with the Tindall Foundation and VSA,
established Poutasi Gardens. The Gardens currently supply over 20 restaurants and resorts with fresh
locally grown produce. After three years the Poutasi Gardens now employs five full time workers, four of
whom are women, including the team leader. The Gardens buy produce from more than 10 local families and
sell to its customers. Seventy per cent of all income from the Gardens project is paid directly to people in the
district. 10,000 tala (around NZ $5,000) now goes back into the community each month, allowing the
community to support a preschool for 25 children and the Poutasi Arts Centre for local artisans to make and
sell their products. The project has also trained 20 village members in intensive horticulture and garden staff
are now managing many aspects of the garden independently.

Cook Islands Agricultural & Food Sector ‐ After MDG Vision
Draft – January 2015
53
of consumers. It can also combine a group of producers and aim at consumers or specific
social groups (as schools, elderly, …)
In CKI, adapting such a model might be an interesting way forward to strengthen a
number of part‐time farmers (subsistence selling part of their crop). Various initiatives
exist elsewhere and are often referred to as ‘home vegetable/fruit boxes or baskets’;
most of these short circuits initiatives originate from the 1960 Teikei groups in Japan.
The Teikei groups in Japan
The origin of the Community Supported Agriculture (CSA) concept, the partnership between consumers
and farmers, can be traced to Japan in the mid‐1960s. Homemakers began noticing an increase in imported
foods, the consistent loss of farmland to development, and the migration of farmers to the cities. In 1965, a
group of women approached a local farm family with an idea to address these issues and provide their
families with fresh fruits and vegetables. The farmers agreed to provide produce if multiple families
made a commitment to support the farm.
A contract was drawn and the ʺteikeiʺ concept was born, which translated literally means partnership, but
philosophically means ʺfood with the farmer’s face on it.ʺ Clubs operating under the teikei concept in Japan
today serve thousands of people sharing the harvest of hundreds of farmers. This concept is based on a
number of criteria:
Production has to be agro‐ecologically sound, i.e. farms/gardens need to grow different items
together with some livestock, using compost and livestock manure for fertilizer and seeds and local livestock feed.
Size needs of units needs to be small and consistent with the importance of the groups, in a
sense the entire groups belongs to one big family.
Consumers help producers as a farming experience and need to visit their producers to share their
problems and eventually lend a hand and help.
Simplification of crop grading/selection and packing. Producers have to carry out minimal
grading; big or small, with or without mud on them.
Self‐distribution is the rule as delivery is made by themselves, producer or consumer. The producer will know who will eat their produce and the consumer will know who takes care of it. ʺTeikei ̋
stands on the friendly relationship between producers and consumers.
Reform in diet, challenging and changing the consumers’ diet and ways of shopping. This often goes
to pair appropriate recipes to consume all of the produce: “from root to leaf”, The selection of crops
and recipes are adjusted to seasonal changes and exploiting whatever crops each season offers in a
natural way to maximize nutritious value, avoiding products artificially grown out of season.
Prices are set with an agreement on both sides through a direct negotiation. ʺProducers should be
regardful of consumersʹ diet and health, and consumers are regardful of producersʹ livelihood. ̋
Linking farm to tables in Somoa ‐ continued
Samoa’s Farm to Table scheme, run by Women in Business Development Inc (WIBDI), has been
operating since November 2013, and while its aim – connecting family farmers to the tourism industry ‐
may sound simple, in Samoa it means creating a whole supply chain. At present 20 family farmers are
supplying 10 restaurants and three hotels. Almost all farmers in Samoa can be considered ‘family farmers’.
Many are ‘pre‐business’: few have bank accounts, keep business records or understand supply agreements.
So for WIBDI, success involves many things: doing hands‐on marketing, restaurant liaison, produce grading
and delivery, invoicing, and even chef training. Supplying just 13 outlets, Farm to Table is, for now, being
kept deliberately small so that it can be evaluated and adapted.

Cook Islands Agricultural & Food Sector ‐ After MDG Vision
Draft – January 2015
54
6. The value adding clusters ‐ which are more process oriented and require incorporating
more complex procedures as the end product is a processed quality food (that has a
significant shelf live) and not so much a fresh primary product that will be consumed
rapidly. Adding value can also be a way of reducing volumes and transport costs and
accessing higher value end products. These clusters are usually difficult to set‐up as
they often involve a strong technical partner (who has the markets and the technical
skills to control the value chain) and a large amount of producers and stringent quality
control or grading procedures. But just like any cluster, it remains a question of
developing a win‐win chain assessment and a shared vision to reinvest in the value
chain that drives the value adding. In view of the few existing overseas’ markets for
value added products, in the short term, thinking local market and local hospitality
sector might be a strong starting point.
Existing export opportunities such as Organic Noni Juice to China need of course to
continue, but a stronger diversified market, strategy combined with re‐injecting
revenues into the value chain (research, seedling production, intercropping, etc).
Organic Noni Juice
Extracts of Brad’s Case study ???
Dried Bananas – Women in Development (Samoa)
A special partnership between WIBDI, Oxfam and All Good Bananas is bringing Samoan Organic Dried
Banana Chunks to New Zealand. Oxfam has been working with WIBDI for over ten years now, helping to
identify opportunities for income generation and job creation at the village level. WIBDI is currently
working with over 250 small‐scale farmers growing organically certified misiluki bananas in Samoa.
Exporting dried bananas will provide these famers with a vital new income opportunity. As well as being
good for the growers, there are plenty of great reasons for eating organic dried banana chunks. Misiluki
bananas are naturally sweeter, which means that nothing else needs to be added – no preservatives, no sugar,
no sweetener; just organic, naturally dried bananas.

Cook Islands Agricultural & Food Sector ‐ After MDG Vision
Draft – January 2015
55
Value adding clusters may of course combine a number of operations, as the papaya
value/tropical fruits chain can illustrate. CKI papaya have for years been primarily
either consumed locally with little local processing or exported mainly to New Zealand.
The latter has drastically decreased in volume and faces strong competition from other
papaya industries in the Pacific, such as Fiji through its Natures’ ways cooperative. One
of the major constraints to exports is the need for HFTA treatments, which is technically
sensitive and costly and for air freighting.
Turned away crop has at present but little alternatives to a differentiated price (value
added juice or jams or chutneys…) and the local ’export’ market (the hospitality sector)
is not seen as the major ‘export market’ by the various actors and thus undersupplied by
local crops. Papaya remains a major CKI crop and it would need to come together as a
value chain, and not just as a producers cum exporters chain and gradually develop and
offer other options to the papaya crop in the CKI.
The papaya sector also needs to investigate the various alternative production systems
and gradually move towards a more diversified organic/agro‐ecological production
system. Adaptive research and investing within the value chain needs to be stimulated
by the various stakeholders, once again highlighting the need for reinvesting proceeds
from sales in the value chain.
The Fiji Natures’ ways cooperative has been able to mobilize its members and has
therefore been in a position to enjoy regular co‐funding from the Government and other
FTP to provide its own internal extension services, its own adaptive research and
seedling production and interacting with the bio‐security agency in Fiji.
CKI needs to give support to this clustering of agricultural/food sector by initiating
specific support tools (TA for establishment, mentoring and coaching during the various
stages of cluster development, specific financial/macro‐economic packages to
Eventual Livestock cluster(s)
There are a number of possible livestock cluster that could be supported and gradually mentored to some
form of long‐term sustainability. They would however need to be based on a quality product (small piglets,
special hams, cuts, …) and‐or a specific local production technique (appropriate use of local feeds and
husbandry). These clusters would have to address in addition the selection (and improvement) of local breeds
the support to ensure proper animal health support services.
One way forward would be to take example on the poultry and egg sector in Fiji, where one of the major
producers, operates with a number of smaller out‐growers. Establishing a cluster run (or cluster shared)
hatching facility, which requires adequate technological skills, could serve as an incentive to a number of
out‐growers, members of the cluster and the group in turn could market together either the eggs or live
animals, and gradually move further up the value chain, to prepare or market specific CKI products.
Goats are mostly present on one island; and coming together in a cluster could in due time drive this sub‐
sector to be more effective in supplying Rarotonga. Pigs of course with the hospitality sector interested in
umu piglets or pigs for BBQ, this again could be the starting point of revitalizing a local pig sector, based on
developing small local cluster activities leading to the re‐establishment of a number of local meat processing
ventures.
Cook Islands Agricultural & Food Sector ‐ After MDG Vision
Draft – January 2015
56
accompany the scaling up phase of a number of selected ‘viable’ priority clusters, close
monitoring and the provision of wider framework kind support such as combined
involvement of health/tertiary education/agriculture/civil society/tourism council in
accompanying the development of these clusters)
Sustaining common livelihoods will be a direct consequence of the above small and appropriate
clustering endeavours, but it will also need to draw on a series of mutual reinforcing initiatives:
By resolutely opting for a 180° turn in farming practices and focusing more on agro‐
ecologically sound farming techniques, the various clusters will have to be open and
engage with for the various environmental programmes and projects planned and on‐
going in the CKI.
These projects in turn will also need to interact with the various clustered groups in
order to raise their awareness of the “landscape” the cluster is operating in and the
various impacts that need to be gradually mitigated together. The two will need to
collaborate as the core of the clusters’ activities will most often be in the buffer zones
around the various reserves or protected areas.
This will also require a 180° turn from the various environmental agencies that have a
tendency to consider agriculture as a damaging activity and not as a sector that can
provide environmental services in addition and in combination with environmentally
friendly productive activities.
Sustainable agriculture is often a major theme in these various projects and can be
effectively implemented if small grants from these various programmes can be
mobilised to support combined actions and appropriate mitigation plans (inclusive of
improved soil & water management) developed together with the clusters.
Trying to address the demographic paradigm through cluster specific private‐public
partnerships. These specific PPP could build on the present tertiary education/ apprenti‐
ceship framework being implemented by the Government through the Cook Islands
Tertiary Training Institute.
Develop alliances with environmental programmes highlight agriculture's positive 'agro-ecological' impacts both by reducing pollution and improved resources management
Building bridges between stakeholders and generations through specific initiatives in tertiary education and ad-hoc market outlets
Sustaining our common livelihoods
4
Cook Islands Agricultural & Food Sector ‐ After MDG Vision
Draft – January 2015
57
This apprenticeship programme could eventually include a special funding window for
special agro‐apprenticeship agreements with a specific cluster. These cluster‐agreements
would concern a number of part‐time employees or young unemployed that would
have an apprenticeship type contract with the lead partner of a cluster.
The apprenticeship contract would include part‐time service work (direct income
earner) and part‐time farming activities. The apprenticeship would be concluded for a
minimum of three years during which CITTI (thus also enabling a kind of certification),
MOA or another technical agency such as VSA for example or the mentoring
programme of the Chamber of Commerce and the cluster lead partner would assist the
apprentices to established themselves as full fledge agro‐operators. (The package would
be developed in such a manner as to promote farming as a business or an agro‐
operation).
In due time this specific apprenticeship could build on the various school garden
initiatives undertaken in some secondary schools and from which specific students
coulds eventually opt for this kind of apprenticeship.
Cook Islands Tertiary Training Institute Apprenticeship Programme
CITTI’s Apprenticeship Programme will provide a 1 year wage subsidy of up to 50% of the gross
hourly rate paid by the employer (host company) up to a maximum of $6500.00 per annum.
Employers (host company) will be required to enter into a training agreement with the Cook Islands
Tertiary Training Institute and the Apprentice. Employers must provide a minimum of 25 hours per
week of relevant employment at their premises.
Who is eligible for the incentive ?
People seeking work and enrolling in Cook Islands Tertiary Training Institute programmes
of study.
People engaged in work under a contract of employment and looking to enrol in a Cook
Islands Tertiary Training Institute programme of study and not engaged in formal training
with any other training provider
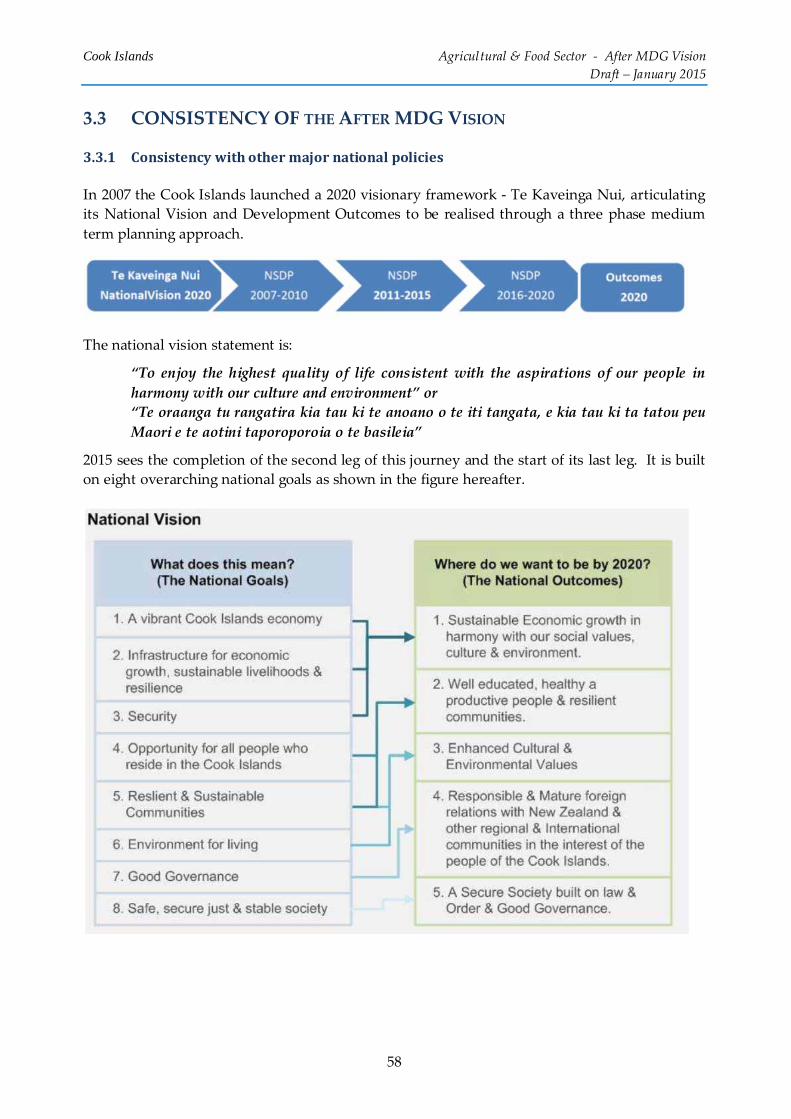
Cook Islands Agricultural & Food Sector ‐ After MDG Vision
Draft – January 2015
58
3.3 CONSISTENCY OF THE AFTER MDG VISION
3.3.1 Consistencywithothermajornationalpolicies
In 2007 the Cook Islands launched a 2020 visionary framework ‐ Te Kaveinga Nui, articulating
its National Vision and Development Outcomes to be realised through a three phase medium
term planning approach.
The national vision statement is:
“To enjoy the highest quality of life consistent with the aspirations of our people in
harmony with our culture and environment” or
“Te oraanga tu rangatira kia tau ki te anoano o te iti tangata, e kia tau ki ta tatou peu
Maori e te aotini taporoporoia o te basileia”
2015 sees the completion of the second leg of this journey and the start of its last leg. It is built
on eight overarching national goals as shown in the figure hereafter.

Cook Islands Agricultural & Food Sector ‐ After MDG Vision
Draft – January 2015
59
The after MDG vision for the agriculture/food with its four major focus areas is consistent with
this national vision or the National Sustainable Development Plan (NSDP) as it is widely
known. The MDG vision for the agriculture sector is however defined as larger than just being a
part of the National Goal One ‘A vibrant CKI economy’. The MDG vision sees the sector as a
crossroads or cross‐cutting sector where production of food, local economy, livelihoods, health
and diets, education, management of natural resources all interact as is illustrated in the
following graph52:
52 References in the graph are as follows:
P = Priority area (or National goal )
NS= national strategy to be pursued under the 2010‐2015 step
P1/NS3 Unlock potential for our agriculture
P1/NS4 Identify and exploit trade
opportunities
P2/NS1 Improve our facilities for waste
management
P4/NS3 Enable every young person to have access to the opportunity to develop
knowledge & skills ...Dual Pathways
P4/NS8 NCDs
P5/NS4Building resilience
P6/NS1Improved IWRM
P6/NS3Implement waste minimisation
P6/NS5Land Use
P6/NS6Biodiversity/Ecosystems
(reef ‐ ridge)
P8/NS5Improve land management and
LIS(GIS)h
Small & Appropriate
Healthy soils1
4
3
2 Healthy foods
Sustaining our common livelihoods
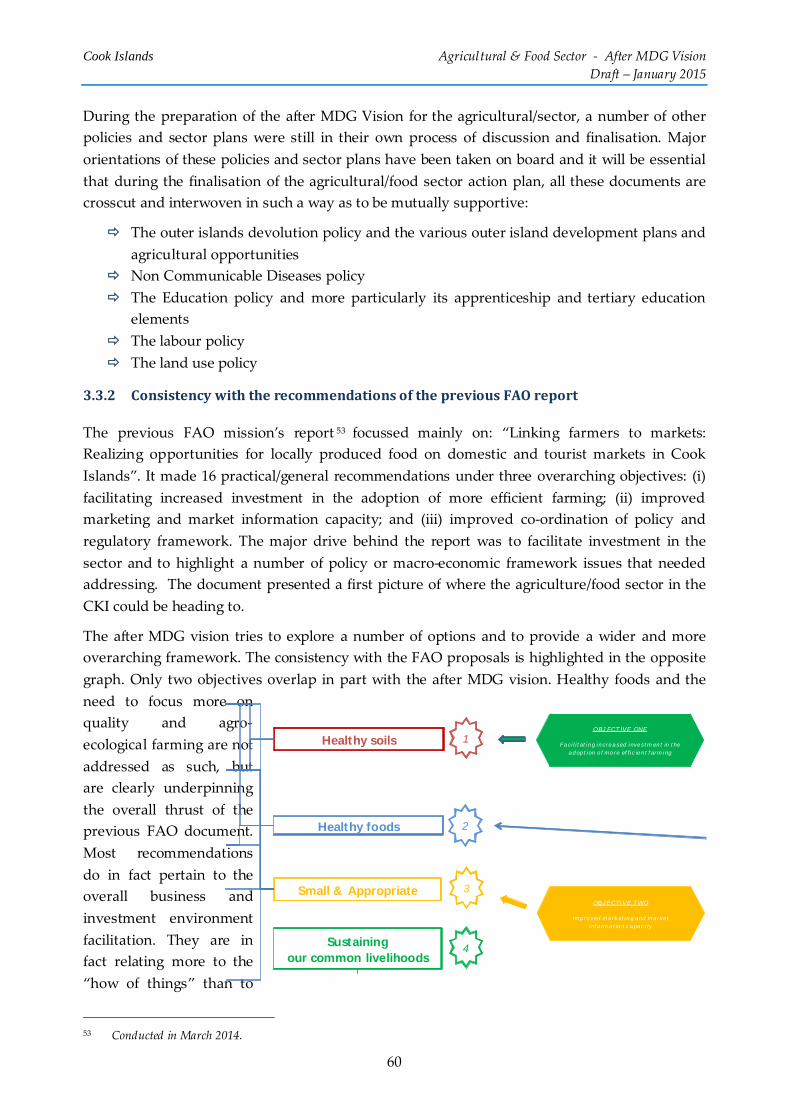
Cook Islands Agricultural & Food Sector ‐ After MDG Vision
Draft – January 2015
60
During the preparation of the after MDG Vision for the agricultural/sector, a number of other
policies and sector plans were still in their own process of discussion and finalisation. Major
orientations of these policies and sector plans have been taken on board and it will be essential
that during the finalisation of the agricultural/food sector action plan, all these documents are
crosscut and interwoven in such a way as to be mutually supportive:
The outer islands devolution policy and the various outer island development plans and
agricultural opportunities
Non Communicable Diseases policy
The Education policy and more particularly its apprenticeship and tertiary education
elements
The labour policy
The land use policy
3.3.2 ConsistencywiththerecommendationsofthepreviousFAOreport
The previous FAO mission’s report 53 focussed mainly on: “Linking farmers to markets:
Realizing opportunities for locally produced food on domestic and tourist markets in Cook
Islands”. It made 16 practical/general recommendations under three overarching objectives: (i)
facilitating increased investment in the adoption of more efficient farming; (ii) improved
marketing and market information capacity; and (iii) improved co‐ordination of policy and
regulatory framework. The major drive behind the report was to facilitate investment in the
sector and to highlight a number of policy or macro‐economic framework issues that needed
addressing. The document presented a first picture of where the agriculture/food sector in the
CKI could be heading to.
The after MDG vision tries to explore a number of options and to provide a wider and more
overarching framework. The consistency with the FAO proposals is highlighted in the opposite
graph. Only two objectives overlap in part with the after MDG vision. Healthy foods and the
need to focus more on
quality and agro‐
ecological farming are not
addressed as such, but
are clearly underpinning
the overall thrust of the
previous FAO document.
Most recommendations
do in fact pertain to the
overall business and
investment environment
facilitation. They are in
fact relating more to the
“how of things” than to
53 Conducted in March 2014.
OBJECTIVE ONE
Facilitating increased investment in the adoption of more efficient farming
OBJECTIVE TWO
Improved marketing and market information capacity
Small & Appropriate
Healthy soils 1
3
2Healthy foods
Sustaining our common livelihoods
4
Cook Islands Agricultural & Food Sector ‐ After MDG Vision
Draft – January 2015
61
“what things need to be encouraged”.
The various recommendations have thus been re‐organised in Appendix 5 according to the four
pillars of the Vision. In this appendix, at least 10 recommendations have been regrouped under
the third objective that intends to address the overall policy and economic framework.
As will be shown in the draft template for the agricultural/food action plan (see chapter four
hereafter), most of these recommendations are very relevant and will need to be more
pragmatically defined in order to clearly and pragmatically address the various areas of
intervention that will be outlined with all stakeholders as being part of the 2015‐2020 action
plan and beyond.
3.4 DRIVING THE VISION TOWARDS A PRAGMATIC ACTION PLAN
During the various discussions, face to face interviews and round tables conducted during the
November 2014 field work, a major and recurrent concern of all has been “who will be the
driver” or as a previous box concludes “Agriculture needs a ‘champion’ a leader, is there anyone waiting in the wings?”.
As already mentioned the sector is wider than just economic issues of production which has
been so far the major concern of the Ministry of Agriculture. In view of this, the previous FAO
report suggested the establishments of a Food Policy Council in order to help achieve the
implementation of policy and regulatory reforms required to achieve improved food security. It
was envisaged to attach this high level, multi‐sector (public and private sector stakeholders)
statutory body within the NSDC at the Prime Minsiter’s Office.
In order to emphasize even more that the sector is essentially a sector fully driven in last resort
by the private sector, with the public sector providing services to facilitate and support the
sector, it might be worth reconsidering the establishment of a Food Policy Council and prefer
instead a model comparable in its concept to the one operating for the tourism and hospitality,
sector, where there is a Tourism Council which drives the sector, which is in turn supported by
a specialized board.
The sector needs first to be technically re‐oriented and marketing/value/supply chain cluster
groups initiated. This will require consultations between potential partners and groups,
development of ad‐hoc strategic partnerships and initiating a number of basic services that will
be beneficial to the sector as a whole (intelligence, but also knowledge networking and sharing,
grouped access to ‘new’ inputs, etc). Policies and regulatory frameworks are of course part of
this effort, but they need to be responsive to the sector and it is therefore proposed in the after
MDG vision that an independent private sector driven council be set up. This might equally be
a way to bring people of different political backgrounds (Rarotonga and outer islands, majority
and opposition) to work together on long‐term sector defined priorities.
3.4.1 Initiatingasectorcouncildrivenbythefarmersandprivate–sector
It is suggested that this council be gradually established during the coming two or three years.
Before formalising a council, it is suggested to spin the council off as a special task force within
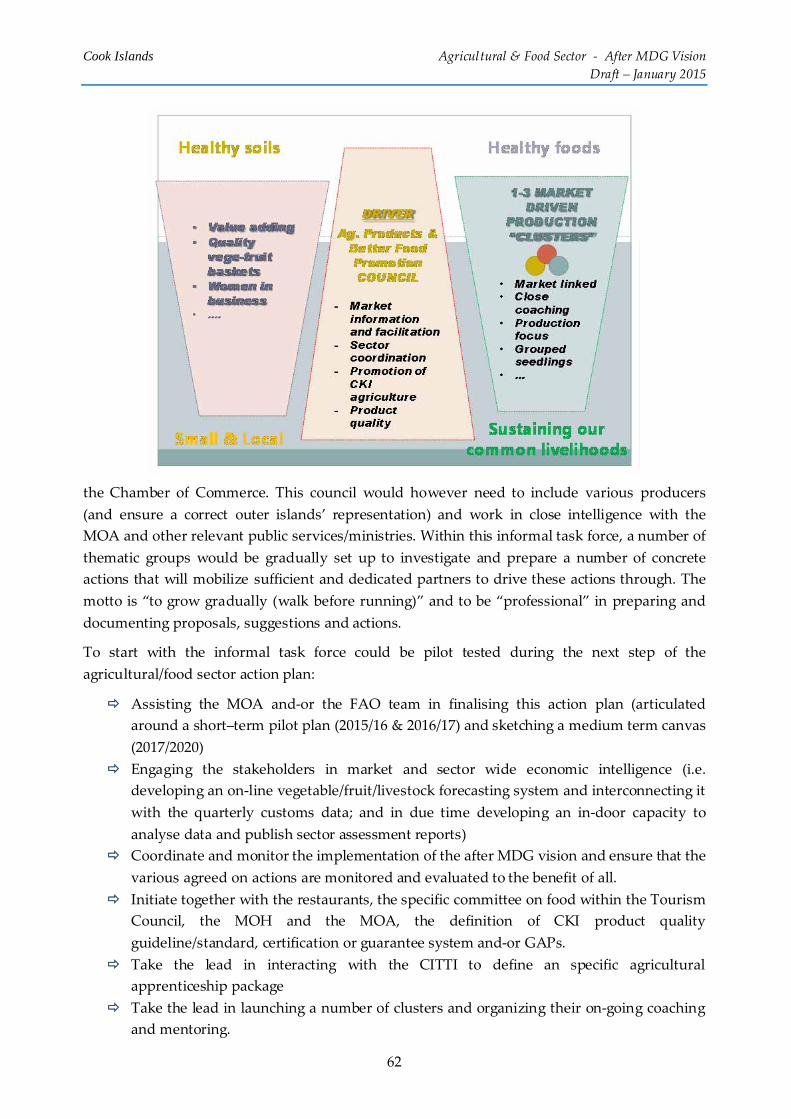
Cook Islands Agricultural & Food Sector ‐ After MDG Vision
Draft – January 2015
62
the Chamber of Commerce. This council would however need to include various producers
(and ensure a correct outer islands’ representation) and work in close intelligence with the
MOA and other relevant public services/ministries. Within this informal task force, a number of
thematic groups would be gradually set up to investigate and prepare a number of concrete
actions that will mobilize sufficient and dedicated partners to drive these actions through. The
motto is “to grow gradually (walk before running)” and to be “professional” in preparing and
documenting proposals, suggestions and actions.
To start with the informal task force could be pilot tested during the next step of the
agricultural/food sector action plan:
Assisting the MOA and‐or the FAO team in finalising this action plan (articulated
around a short–term pilot plan (2015/16 & 2016/17) and sketching a medium term canvas
(2017/2020)
Engaging the stakeholders in market and sector wide economic intelligence (i.e.
developing an on‐line vegetable/fruit/livestock forecasting system and interconnecting it
with the quarterly customs data; and in due time developing an in‐door capacity to
analyse data and publish sector assessment reports)
Coordinate and monitor the implementation of the after MDG vision and ensure that the
various agreed on actions are monitored and evaluated to the benefit of all.
Initiate together with the restaurants, the specific committee on food within the Tourism
Council, the MOH and the MOA, the definition of CKI product quality
guideline/standard, certification or guarantee system and‐or GAPs.
Take the lead in interacting with the CITTI to define an specific agricultural
apprenticeship package
Take the lead in launching a number of clusters and organizing their on‐going coaching
and mentoring.

Cook Islands Agricultural & Food Sector ‐ After MDG Vision
Draft – January 2015
63
3.4.2 Engaginginclusteringandclusterbuilding
A specific thematic group of the sector council will need to engage in supporting the emergence
of a number of specialise clusters: i) to start at least 2 to 3 ‘rapid economic ‘clusters driven by a
major supply contract or specific technical activity such as composting; ii) to establish at least
one livestock focused cluster; iii) establishing one or two small ‘slow green’ cluster or short
circuit test groups together with the NCD group within the MOH; iv) examine how to
consolidate the existing commodity value chains (Noni, papaya products) and v) support a
strategic small scale women in business partnership to support short circuit simple value
adding activities.
Cluster development would proceed stepwise, after each step is reviewed by an internal
mentoring group:
STEP 1 Cluster establishment (sensitisation, group formation and initial activity planning)
STEP 2 Technical design of the cluster package with the various partners and business plan
development (inclusive wherever possible of ad‐hoc environmental mitigation plans)
STEP 3 After approval of support, implementation of the first business plan with constant
coaching and business and technical mentoring
STEP 4 on‐going monitoring and development of subsequent activity plans and monitoring of
business development
3.4.3 Creatinganenablingenvironment
As outlined in the previous FAO report there are a number of overall actions (see appendix 5
relating to tax code, import duties, financial tools, supportive FTP’s interventions, …) to be
assessed in order to gradually create a more supportive enabling environment, and which can
be clarified once the major clusters and types activities of the sector plan are more clearly
defined.
Assessing these actions in greater detail and monitoring their eventual effectiveness will need to
be done in parallel with the on‐going activities during the implementation of the short‐term
2015/2016/2017 pilot sector plan.
Some of the required actions can thus be gradually addressed and policy proposals submitted
to the relevant government bodies/agencies, but others will require longer and more in depth
consultations and discussions in order to find longer term and lasting solutions.
Greg Stanaway thinks that somehow, the land tenure system needs to be changed to allow more land
to be brought into production; and he thinks we need to import labour used to working large‐scale
gardens. He thinks they should probably come from China and/or the Philippines. He knows that will be
controversial but he says the workers should not be considered cheap labour and they should be paid
maybe double the current minimum wage; and they should come here under a fixed contract and visa
arrangement – say two years with another two maximum, and they should train locals to take over
from them while they’re here.

Cook Islands Agricultural & Food Sector ‐ After MDG Vision
Draft – January 2015
64
4 FROM INTENT TO OPERATIONAL SECTOR PLAN
An operational sector action plan will be developed with the various stakeholders during the
second quarter of 2015 after the 50 year CKI celebrations and the partner meeting planned in
February 2015.
An indicative plan is presented hereafter as a general guideline to assist the sector council and
the MOA in developing a more detailed plan and to prepare more detailed budgets and
proposals for those various activities for which Government, FTP partners, private operators or
foundations or NGOs have shown interest. It is articulated around:
5 ‘productive’ strategic objectives: (i) agricultural production moves form high chemical
inputs to agro‐ecological production modes; ii) more efficient livestock activities for
niche markets underpins the green value chain; iii) healthy food habits contribute to
reduced NCD incidence; iv) small and local geared agri‐ventures are commercial reality
in the Cook Islands; and v) the demography paradigm is addressed.
2 more ‘structural’ strategic objectives: (vi) the overall governance of the agricultural
sector is sector driven; and vii) the institutional framework is supportive of the
agricultural sector development
The overall consistency of the indicative template for an operational sector plan with the after
MDG Vision is shown in the following graph
Operational and institutional support to
the implementation of the after MDG
Vission for the agriultural /food sector in
the CKI
Small & Appropriate
Healthy soils 1
3
2Healthy foods
Sustaining our common livelihoods
4
Strategic Objective 1Agricultural production moves form high chemical
inputs to agro-ecological production modes
Strategic Objective 2More efficient livestock activities for niche markets
underpines the green value chain
Strategic Objective 3Healthy food habits contribute to reduced NCD
incidence
Strategic Objective 4Small and local geared agri-ventures are commercial
reality in the Cook Islands
Strategic Objective 5The demography paradigm is addressed
Strategic Objective 6The overall governance of the agricultural sector is
sector driven.
Strategic Objective 7The institutional framework is supportive of the
agricultural sector development.
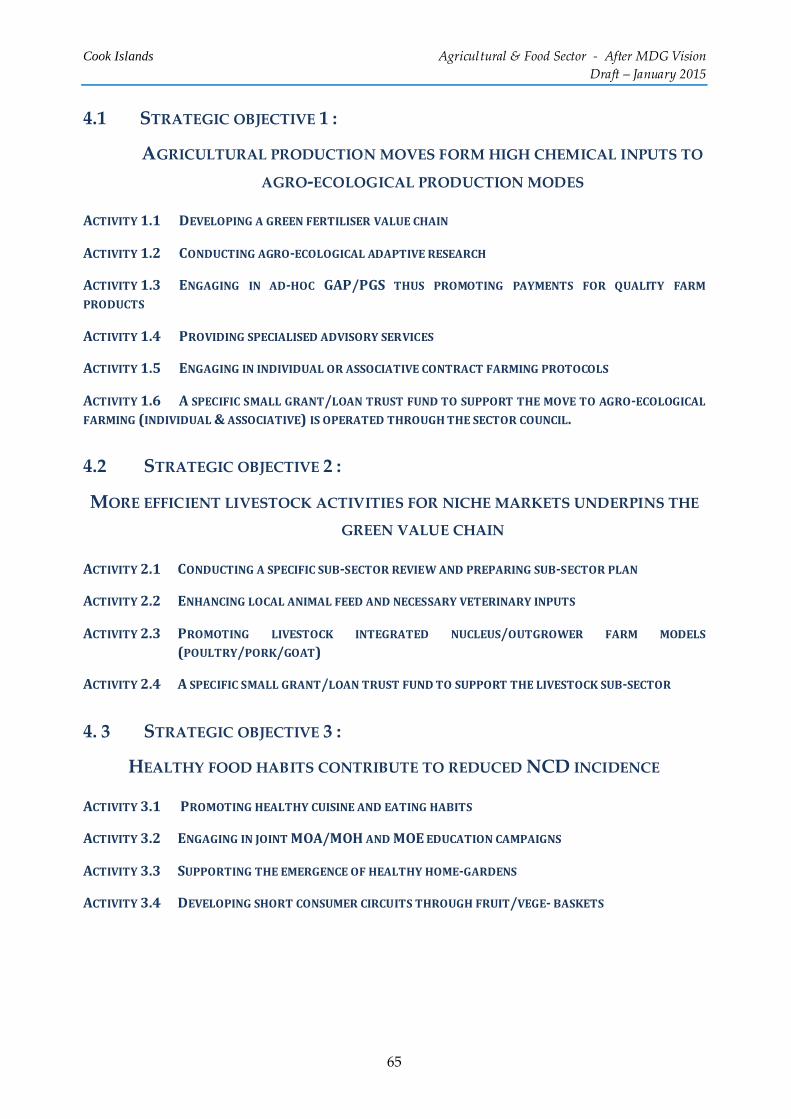
Cook Islands Agricultural & Food Sector ‐ After MDG Vision
Draft – January 2015
65
4.1 STRATEGIC OBJECTIVE 1 :
AGRICULTURAL PRODUCTION MOVES FORM HIGH CHEMICAL INPUTS TO
AGRO‐ECOLOGICAL PRODUCTION MODES
ACTIVITY1.1 DEVELOPINGAGREENFERTILISERVALUECHAIN
ACTIVITY1.2 CONDUCTINGAGRO‐ECOLOGICALADAPTIVERESEARCH
ACTIVITY1.3 ENGAGING IN AD‐HOC GAP/PGS THUS PROMOTING PAYMENTS FOR QUALITY FARMPRODUCTS
ACTIVITY1.4 PROVIDINGSPECIALISEDADVISORYSERVICES
ACTIVITY1.5 ENGAGINGININDIVIDUALORASSOCIATIVECONTRACTFARMINGPROTOCOLS
ACTIVITY1.6 ASPECIFICSMALLGRANT/LOANTRUSTFUNDTOSUPPORTTHEMOVETOAGRO‐ECOLOGICALFARMING(INDIVIDUAL&ASSOCIATIVE)ISOPERATEDTHROUGHTHESECTORCOUNCIL.
4.2 STRATEGIC OBJECTIVE 2 :
MORE EFFICIENT LIVESTOCK ACTIVITIES FOR NICHE MARKETS UNDERPINS THE
GREEN VALUE CHAIN
ACTIVITY2.1 CONDUCTINGASPECIFICSUB‐SECTORREVIEWANDPREPARINGSUB‐SECTORPLAN
ACTIVITY2.2 ENHANCINGLOCALANIMALFEEDANDNECESSARYVETERINARYINPUTS
ACTIVITY2.3 PROMOTING LIVESTOCK INTEGRATED NUCLEUS/OUTGROWER FARM MODELS
(POULTRY/PORK/GOAT)
ACTIVITY2.4 ASPECIFICSMALLGRANT/LOANTRUSTFUNDTOSUPPORTTHELIVESTOCKSUB‐SECTOR
4. 3 STRATEGIC OBJECTIVE 3 :
HEALTHY FOOD HABITS CONTRIBUTE TO REDUCED NCD INCIDENCE
ACTIVITY3.1 PROMOTINGHEALTHYCUISINEANDEATINGHABITS
ACTIVITY3.2 ENGAGINGINJOINTMOA/MOHANDMOEEDUCATIONCAMPAIGNS
ACTIVITY3.3 SUPPORTINGTHEEMERGENCEOFHEALTHYHOME‐GARDENS
ACTIVITY3.4 DEVELOPINGSHORTCONSUMERCIRCUITSTHROUGHFRUIT/VEGE‐BASKETS

Cook Islands Agricultural & Food Sector ‐ After MDG Vision
Draft – January 2015
66
4.4 STRATEGIC OBJECTIVE 4 :
SMALL AND LOCAL GEARED AGRI‐VENTURES ARE COMMERCIAL REALITY
IN THE COOK ISLANDS
ACTIVITY4.1 SMALLVALUEADDINGVENTURESAREDEVELOPEDANDOPERATIONAL
ACTIVITY4.2 ENGAGINGINCROSS‐CUTTINGINITIATIVESTOSUSTAINLOCALPRODUCTIONTRAFFICTOANDFROMTHEVARIOUSHOSPITALITYACTORSINTHECKI
ACTIVITY4.3 SUPPORTINGTHEEMERGENCEOFVALUECHAININTEGRATEDSERVICES
ACTIVITY4.4 ASPECIFICGRANT/LOANTRUSTFUNDTOSUPPORTVALUEADDINGANDINTEGRATEDVALUECHAINACTIONSISOPERATEDTHROUGHTHESECTORCOUNCIL.
4. 5 STRATEGIC OBJECTIVE 5 :
THE DEMOGRAPHY PARADIGM IS ADDRESSED
ACTIVITY5.1 AGRO‐ECOLOGICALFARMINGISPARTOFTHEBASICTEACHINGCURRICULUM
ACTIVITY5.2 APPRENTICESHIPS AND TERTIARY EDUCATION SUPPORT THE START‐UP OF YOUNG/NEWFARMERS
ACTIVITY5.3 SPECIFICBUSINESSMENTORINGANDCOACHINGISAVAILABLETO'NEW'FARMERS
ACTIVITY5.4 FACILITATINGACCESSTOREGIONALTEMPORARYLABOURISCONSIDEREDANDFACILITATED
ACTIVITY5.5 A SPECIFIC TRUST FUND TO SUPPORT START‐UP FARMING IS OPERATED THROUGH THESECTORCOUNCIL
4.6 STRATEGIC OBJECTIVE 6:
THE OVERALL GOVERNANCE OF THE AGRICULTURAL SECTOR IS
SECTOR DRIVEN.
ACTIVITY6.1 ANAGRICULTURESECTORALCOUNCILDRIVESTHESECTOR
ACTIVITY6.2 INTERACTIONSWITH PUBLIC SERVICES (HEALTH, EDUCATION, FINANCES, ENVIRONMENT,TRADE,…)ARESTREAMLINED
ACTIVITY6.3 MARKETINTELLIGENCEISCOLLECTEDANDDISSEMINATED
ACTIVITY6.4 SECTOR INTELLIGENCE IS MONITORED AND SPECIFIC CROP/SYSTEM/LIVESTOCK REVIEWSCONDUCTED
ACTIVITY6.5 ANNUALSECTORREVIEWS/STATEOFTHESECTORARECONDUCTED/PUBLISHED

Cook Islands Agricultural & Food Sector ‐ After MDG Vision
Draft – January 2015
67
4.7 STRATEGIC OBJECTIVE 7:
The institutional FRAMEWORK is supportive of the agricultural
sector development.
ACTIVITY7.1 THEVARIOUSACTS IMPACTINGTHEAGRICULTURAL SECTORAREREVIEWEDANDUPDATED(THEAGRICULTURALACT,THEFOODACT,THECHEMICALACT,…)
ACTIVITY7.2 ANAGRICULTURAL INSURANCEPACKAGE ISDEVELOPED INACCORDANCEWITHTHEGLOBALPACIFICCATASTROPHERISKFUND(WBSUPPORTED)
ACTIVITY7.3 A SECTOR SPECIFICPER ISCONDUCTEDANDA SECTOR SUPPORTIVETARIFF/TAX/MACRO‐ECONOMICPACKAGEISINITIATED
ACTIVITY7.4 ACCESSTOLANDISFACILITATEDANDITSUSEPROTECTED
ACTIVITY7.5 ENVIRONMENTALANDCLIMATECHANGEPROGRAMMESGIVEFULLSUPPORTTOSUSTAINABLEAGRICULTUREANDITSGRADUALADAPTATIONTOAGRO‐ECOLOGICALPRODUCTIONMODES
ACTIVITY7.6 THE ROLE AND ORGANISATION OF THEMOA IS REVIEWED IN LINE WITH THE PRESENT SECTORPLAN
FOR THE APPENDICES PLEASE REFER TO
www.mfem.gov.ck